

Abstract
Contrast-enhanced ultrasound (CEUS) is clinically used to image the microcirculation at lower imaging frequencies (<2 MHz). Recently, plane-wave acquisitions and Doppler processing have revealed improved microbubble sensitivity, enabling CEUS use at higher frequencies (15 MHz) and the ability to image simultaneously blood flow in the micro- and macrocirculations. We used this approach to assess acute and chronic blood flow changes within contused spinal cord in a rodent spinal cord injury model. Immediately after spinal cord injury, we found significant differences in perfusion deficit between moderate and severe injuries (1.73 ± 0.1 mm2 vs. 3.2 ± 0.3 mm2, respectively), as well as a delay in microbubble arrival time in tissue adjacent to the injury site (0.97 ± 0.1 s vs. 1.54 ± 0.1 s, respectively). Acutely, morphological changes to central sulcal arteries were observed where vessels rostral to the contusion were displaced 4.8 ± 2.2° and 8.2 ± 3.1° anteriorly, and vessels caudal to the contusion 17.8 ± 3.9° and 24.2 ± 4.1° posteriorly, respectively, for moderate and severe injuries. Significant correlation of the acute perfusion deficit and arrival time were found with the chronic assessment of locomotive function and histological estimate of spared spinal cord tissue.
Keywords: Doppler, Ultrasound contrast agents, Microbubbles, Spinal cord injury
INTRODUCTION
Both clinical and pre-clinical methods for in vivo microvascular assessment of blood flow are limited by trade-offs between depth of penetration, resolution and acquisition time (Shih et al. 2012; Errico et al. 2015). Ultrasound imaging of blood flow has a number of advantages in terms of depth of penetration and acquisition rate, with continuing improvement in spatial resolution when compared with other technologies. The addition of microbubbles has given ultrasound the ability to image the microcirculation in overcoming limitations of Doppler approaches (Heimdal and Torp 1997; Tierney et al. 2019; Averkiou et al. 2020). Contrast-enhanced ultrasound (CEUS) is now clinically used worldwide to image blood flow in the microcirculation at lower imaging frequencies (<2 MHz) primarily in the liver and heart (Averkiou et al. 2020). Attempts to use CEUS for applications requiring higher spatial resolution and elevated frequencies (e.g., breast, lymph nodes) have met with limited success because of challenges in sensitivity (Goertz et al. 2005). Recently, plane-wave non-linear Doppler imaging has exhibited improved microbubble sensitivity enabling CEUS use at higher frequencies (15 MHz) and the ability to image blood flow in the micro- and macrocirculations simultaneously (Bruce et al. 2020).
In the present work, we apply this approach to describe blood flow changes for injuries of different severity in a rodent spinal cord injury (SCI) model. SCI is characterized by the direct mechanical disruption of tissue structure (i.e., primary injury) (Cadotte and Fehlings 2011) However, subsequent hemorrhage and edema and inflammation lead to an expanding zone of swelling, resulting in ischemia, and further damage to surrounding tissue (Mautes et al. 2000; Streijger et al. 2017). Current and novel neuroprotective strategies are focused on mitigating the reduction in blood flow in these perilesional areas of spinal cord tissue (Saadoun and Papadopoulos 2020). Through the use of non-linear Doppler ultrasound imaging of microbubbles, this work seeks to identify the changes in blood flow immediately following SCI and the resulting chronic changes in spinal cord morphology and blood flow and motor function.
Previous studies have explored blood flow changes following SCI of a single injury severity using ultrasound Doppler and CEUS in rodent SCI models (Westergren et al. 2001; Soubeyrand et al. 2012, 2014; Cao et al. 2015; Beliard et al., 2022). Previously, our group found that a contusion-type injury to the spinal cord results in an increase in intraspinal pressure and a deficit of tissue perfusion immediately after injury (Khaing et al. 2017, 2018, 2020b). In the present work, we describe additional changes in blood flow parameters using non-linear Doppler CEUS for two different injury severities in a rodent SCI model at both the acute and chronic time points. Non-linear Doppler CEUS enables the segmentation of the vascular tree by velocity and the simultaneous imaging of blood flow in the micro- and macrocirculation (Bruce et al. 2020). Two different acquisitions are used to, directly and through bolus kinetics, estimate the hemodynamic changes following SCI.
Parametric maps of bolus arrival time, perfusion area deficits and morphological changes in larger vessels are investigated. Blood flow changes both immediately after injury and longer-term alterations in vasculature are compared against histological and locomotive functional assessments. An improved understanding of blood flow changes would help to guide and assess the efficacy of neuroprotective research following SCI.
In this work, we refer to the microcirculation/microvasculature as the low-velocity sub-resolved flow captured in Doppler processing and the macrocirculation/macrovasculature flow as the higher-velocity spatially resolved flow in larger vasculature (Bruce et al. 2020). We also use perfusion, as used in the ultrasound community, to refer to the presence of microbubble flow in sub-resolved vasculature (i.e., below the ability to resolve individual vessels).
METHODS
The overall experimental design consisted of spinal cord injury of different severity to two cohorts of rats with a calibrated contusion device. Surgery on each rat provided access to the spinal cord for injury and acoustic access for ultrasound imaging. Ultrasound imaging with microbubbles was performed pre-injury and then post-injury. Each rat was then cared for 8 wk, when surgery again provided an acoustic window for final ultrasound imaging followed by spinal cord removal for histological analysis. Locomotor function was assessed pre-injury and 1 and 8 wk post-injury.
Spinal cord injury model
The details of the surgical procedure were previously described in Khaing et al. (2020b). Surgical procedures were performed according to approved institutional animal care and use committee protocol following all appropriate guidelines from the University’s Animal Welfare Assurance (A3464-01), as well as the National Institutes of Health (NIH) Office of Laboratory Animal Welfare. Female Long-Evans (Harlan Labs, Indianapolis, IN, USA) rats weighing 250 g at the time of experiment were used. After general anesthesia, the area overlying the T6/T10 vertebrae was exposed. A laminectomy was performed to expose the spinal cord from T6 to T10. A contusion-type lesion was produced using the Infinite Horizon (IH) Impactor device (Precision Systems & Instrumentation, Lexington, KY, USA). A cohort of six rats received a 150-kDyn (impact force), referred to as a moderate injury, spinal cord contusion using the IH impactor device at the T8 level. Similarly, a second cohort of six rats received a 200-kDyn spinal cord contusion, referred to as a severe injury. Previous work found perfusion area deficit differences of a factor of ≥2 with minimal variability (< 1 mm2) between moderate and severe injury groups; cohorts of six rats still provided a margin of error to detect more subtle changes in other features (Van Belle 2011). At 8 wk, surgery was again performed to expose the spinal cord for CEUS imaging of chronic blood flow and vessel changes.
Locomotor analysis
This test highlights functional changes from balance to coordination to recovery patterns that illustrate the physiological effects the injury has on the subject. Prior to surgery, each animal was acclimated to an enclosed open field area which was roughly 80 × 10 cm in size, where overall locomotor function was assessed prior to injury with the Basso–Beattie–Bresnahan (BBB) locomotor rating scale (Basso et al. 1995) Assessment of hindlimb locomotor behavior measures long-term functional recovery after spinal cord injury, and serves as a tool for evaluating the therapeutic efficacy of various treatments. This 21-point open-field locomotion score was developed to study the sequence of locomotor recovery patterns and takes into consideration the early (BBB score from 0 to 7), intermediate (8–13) and late (14–21) phases of recovery.
Non-linear Doppler CEUS imaging
The Vantage ultrasound research platform (Verasonics, Kirkland, WA, USA) was used to program multi-angle plane-wave non-linear Doppler sequences, using a 15-MHz linear array transducer (Vermon, Tours, France). Plane waves at 15 MHz and 2 cycles in duration at a pulse repetition frequency (PRF) of 10 kHz were emitted using the full linear array aperture, and the resulting echoes were recorded from every transducer element. Table 1 lists the parameters used for the ultrasound acquisitions. The multi-angle amplitude modulated plane-wave Doppler acquisition was coherently combined on reception to generate a non-linear Doppler ensemble (Fig. 1a), where tissue signal is suppressed preserving microbubble signals (Tremblay-Darveau et al. 2016; Bruce et al. 2020) The segmentation of low-velocity flow in the microcirculation from higher-velocity flow in larger vessels was accomplished through singular value decomposition (SVD) of the non-linear Doppler ensemble (Fig. 1b). The details of the SVD processing can be found in Bruce et al. (2020), where in brief the eigenvectors of the row and column spaces of the Casorati matrix created from the non-linear Doppler frames enable a spatiotemporal decomposition. The lowest-velocity projections, capturing microbubbles having the longest correlation times, are combined for the perfusion signal, and the highest-velocity projections, containing microbubble signals having the shortest correlation times, are used to capture the higher-velocity flow in the larger vasculature (Fig. 1b). The cutoff between these two groups, a singular value of 50, is based on the smoothing of speckle as illustrated in Figure 6 of Bruce et al. (2020).
Table 1.
Ultrasound parameters
| Parameter | Value |
|---|---|
| Frequency | 15 MHz |
| Pulse length | 2 cycles |
| Angles | (−10 0 10) |
| Pulse repetition frequency | 10 kHz |
| Ensemble lengths | 600/40 |
Fig. 1.

Non-linear Doppler processing of microbubbles in a rat spinal cord after injury. (a), where a nonlinear pulsing sequence is interleaved within a Doppler ensemble and then combined (dotted arrows) to generate a nonlinear Doppler signal where tissue signal is removed. (b) SVD Doppler processing segments low velocity microbubble signal (i.e., perfusion) in the microcirculation from higher velocity flow in the larger vasculature. SVD = singular value decomposition.
Fig. 6.

Changes in locomotive function (Basso–Beattie–Bresnahan [BBB] scores) and microcirculatory blood flow (perfusion deficit and arrival time) at the three measurement time points (pre-injury, post-injury, chronic). The means are shown with confidence intervals. *p < 0.05. **p < 0.01.
After laminectomy, the ultrasound probe was positioned 5 mm from the spinal cord and over the center sagittal plane. Ultrasound gel acoustically coupled the transducer to the spinal cord. For each contrast injection, a bolus of 0.1 mL of Definity (Lantheus, Somerset, NJ, USA) was injected intravenously followed by a 0.2-mL saline flush.
Non-linear Doppler CEUS blood flow features
A non-linear Doppler ensemble length of 600 was used to visualize microvasculature filled with microbubbles. After segmentation of the non-linear Doppler ensemble (Fig. 1b), changes in perfusion and larger vasculature over the pre-, post- and chronic time points were assessed. The area of microvascular disruption (i.e., perfusion area deficit [AD] Figure 1) was measured immediately after contusion, as was the extent of morphological alterations of the higher-velocity larger vasculature. At the post-injury time point, the change in angle of central sulcal arteries both rostral (toward the nose) and caudal (toward the tail) to the site of contusion. A minimum of five vessels were identified pre- and post-injury where the change in angle between pre- and post-injury was measured (il lustrated in Khaing et al. 2020a). At the chronic time point, the rostral-caudal extent of the presence of tortuous central sulcal vessels was estimated.
In addition, a shorter acquisition of 40 non-linear Doppler pulse repetition intervals (PRIs) were acquired at 16 Hz for 30 s to follow the passage of the bolus injection after injury. The bolus kinetics of different regions of an injured spinal cord were followed and compared for the two different flow components. The mean power of the regions of interest (ROIs) were calculated for each acquisition capturing the passage of the bolus through the microcirculation (e.g., low-velocity segmented microbubble signal, i.e., perfusion; Fig. 1b). Smaller ROIs (100 × 100 μm) were averaged and then followed over the course of bolus transit, producing individual time-intensity curves (TICs) over the spinal cord. For arrival time, a piecewise polynomial fit was used to estimate the difference in time between a 10% change in the perfusion and the first arrival of microbubbles into the gray matter. The resulting estimated arrival times were then estimated over the extent of the spinal cord (Fig. 2b). The maximal arrival time (MAT) delay was estimated for the acute and chronic time points. Table 2 lists the blood flow features estimated with ultrasound and the measures against which they will be compared.
Fig. 2.

The steps in creating a parametric map of bolus kinetic features. (a) Non-linear Doppler images to capture bolus passage. (b) Bolus kinetics for different spatial locations. (c) Illustrative parametric map of microbubble arrival time.
Table 2.
Features assessed
| Parameter | Symbol | Units |
|---|---|---|
| Maximum arrival time delay | MAT | s |
| Perfusion area deficit | AD | mm2 |
| Rostral/caudal vessel angle change | degrees | |
| Chronic extent of tortuosity | m | |
| Locomotive functional score | BBB | score (1:21) |
| Spared tissue | mm2 |
BBB = Basso–Beattie–Bresnahan score.
Histology
The details of the histological preparation for the estimation of spared tissue at the chronic time point were previously described in Khaing et al. (2020b). Standard cresyl violet (labels neurons and cell nuclei) and Luxol fast blue (myelin) stainings were performed to visualize spared tissue and myelin within longitudinal sections of the spinal cord. In medial sections, the total area of the spinal cord within a 3-mm section centered around the injury was estimated for spared tissue at the chronic time point.
Statistical analysis
The statistical analysis follows over time (i.e., pre-, acute, chronic) the different changes between injury types (i.e., moderate and severe) of the microcirculatory features MAT and AD. A two-sample t-test and Bonferroni post hoc test were used to determine significant differences for the microcirculatory features (i.e., MAT and AD) between moderate and severe injury groups at each time point. A two-way factorial analysis of variance (ANOVA) was performed, with one factor being injury severity and the second factor being time (i.e., pre-injury, post-injury and chronic) based on the blood flow features estimated by CEUS (i.e., arrival time and area deficit), as well as to identify interactions between the two factors. A p value <0.05 was used to identify significance and for confidence intervals.
Correlation and regression analysis
To determine which blood flow features best correlated with histology and functional assessment, a correlation matrix was generated. Pairwise dependencies between features were measured with Pearson correlation coefficient r. Those features that did correlate significantly were used for regression analysis. In addition to the microcirculatory features, three descriptive features of the macrovasculature after injury were also included in the correlation analysis: change in central sulcal vessel angle both rostral and caudal to the injury at the acute time point and extent of tortuosity at the chronic time point.
Linear regression analysis with corresponding R2 was used to evaluate the linear relationship between changes in the microcirculation with functional and histological changes. The acute parameters MAT and AD were cross-referenced against the chronic measures of SCI, spared tissue and end locomotive function. This comparison points to the utility of acutely accessible parameters in prediction of the degree of injury severity.
RESULTS
Using high-frequency ultrasound and CEUS, we observed marked alterations in tissue and blood flow following contusive injuries to the spinal cord of different severity in a rat model. We observed alterations in blood flow at both the site of contusion and adjacent spinal cord tissue. The assessments of blood flow immediately after injury and 8 wk later were compared and correlated with functional assessment and histology.
Tissue changes
On B-mode imaging, an increase in hematoma size (rostral to caudal extent) was observed between the moderate and severe injury groups (Fig. 1). Although there was variability in longitudinal and cross-sectional shape, in general the hematoma area and rostral-caudal extent was larger for severe injuries.
Significant tissue sparing with alterations in both micro- and macrovascular flow was observed 8 wk post-injury. The amounts of spared tissue estimated from histology at the site of injury 8 wk post-injury were 3.80 ± 0.68 and 5.60 ± 0.67 mm2, respectively, for the moderate and severe injury groups. At 8 wk post-injury, Figure 3f illustrates the greater loss of spinal cord tissue for a severe injury relative to a moderate injury (Fig. 3c). Cysts were observed in the zone of injury for both levels of severity, with septations appearing in severe injury cysts.
Fig. 3.
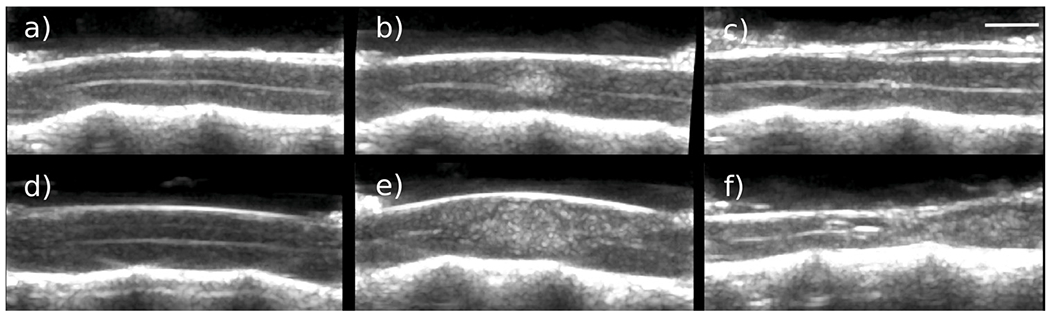
B-Mode images pre-injury, post-injury and after 8 wk. (a–c) Changes for a moderate injury. (d– f) Changes for a severe injury.
Vascular changes
Acute time point.
At the site of the contusion immediately after injury, a marked disruption in blood flow was observed in the microvasculature, as illustrated in Figure 4b and 4e. Severe injuries exhibited a near-twofold change in microvascular deficit relative to moderate injuries, 1.73 ± 0.1 mm2 versus 3.2 ± 0.3 mm2 (p < 0.05), respectively (Fig. 6). The spatial extent and shape of the perfusion deficit varied between injury types, as seen in Figure 4b and 4d. The perfusion deficit size varied between injury types, with extension down to the gray-white matter ventral border for moderate injuries (Fig. 4b). Severe injuries experienced a complete disruption in microcirculation from the dorsal to ventral aspect of the spinal cord (Fig. 4d). In the rostral-caudal axis, perfusion deficits in severe injuries extended further rostrally and caudally in the dorsal aspect of spinal cord tissue, whereas moderate injuries were symmetric in this axis. In moderate injuries, the disruption in microcirculation was more symmetric and localized (Fig. 4b).
Fig. 4.

Segmented flow at the pre-, post- and chronic injury time points, illustrating the progression of blood flow changes in the micro- and macrocirculations after spinal cord injury for moderate (a–f) and severe (g–l) injuries. Rostral/caudal directions are to the left and right, respectively. Bar = 1 mm. csa = critical shoulder angle.
Alterations of the hemodynamics of the microcirculation were observed in spinal cord tissue adjacent to the contusion, by assessment of changes in bolus kinetics of microbubbles passing through the microcirculation (Fig. 5). At the acute time point, a significant difference was observed between injury groups in the time of arrival of microbubbles at the tissue surrounding the contusion (p < 0.01 (Fig. 6b). The mean maximum arrival time increased to 0.97 ± 0.06 s after moderate injury and further to 1.54 ± 0.08 after severe injury. Larger rostral-caudal extents of microbubble delay were observed in severe injuries (Fig. 5e) relative to moderate injuries.
Fig. 5.

Parametric maps illustrating the spatial variations in microbubble arrival times for pre-, post- and chronic injury time points for a moderate injury (a–c) and a severe injury (d–f).
Morphological changes to the larger vasculature adjacent to the contusion were observed immediately after injury (Fig. 4). Acutely, morphological changes to the central sulcal arteries, penetrating branches of the anterior spinal artery feeding central gray matter, were observed where rostral vessels were significantly anteriorly displaced 4.8 ± 2.2° and 8.2 ± 3.1°, and caudal vessels were posteriorly displaced 17.8 ± 3.9° and 24.2 ± 4.1° for moderate and severe injuries, respectively. In moderate injuries within the site of contusion, sulcal arterial flow was preserved in all but one rat, while central sulcal flow in severe injuries was disrupted (Fig. 4) in all rats. In severe injuries, dorsal-medial vasculature was observed to bow out both rostral and caudal from the site of contusion, as seen in Figure 4k.
Chronic time point.
Morphological changes of the macrovasculature were observed for both injury types at 8 wk post-injury (Fig. 4i, 4l). These changes included loss or alteration of macrovascular flow at the site of injury, tortuous sulcal arteries extending out from the injury site and a bowing of dorsal vasculature both rostral and caudal to the injury site. The rostral-caudal extent of sulcal arteries was observed to differ significantly: 5.5 ± 2.2 and 10.5 ± 1.7 mm for moderate and severe injuries, respectively. The extent (often extending beyond one segment) of the loss of macrovasculature in the dorsal region of the injury site was a consistent observation for severe injuries. This loss of macrovascular flow was observed for moderate injuries as well but was not observed in all members and was more localized within a segment (~5 mm).
At the chronic time point, no significant difference in microbubble arrival times was observed between injury groups (Fig. 6b). The mean maximum arrival time for moderate injury was 0.67 ± 0.08 s for moderate injuries and 0.80 ± 0.08 s for severe injuries. However, the microbubble arrival time at the chronic time point was spatially more heterogeneous in the severe injury group (Fig. 5).
Functional changes
Spinal cord injury severity resulted in a significant difference in locomotor recovery (p < 0.01) (Fig. 6). The mean BBB scores for the severe group at acute and chronic time points were 4 and 11 (±1.35), respectively, whereas the mean BBB score for the moderate group at acute and chronic points were 11 and 18 (±1.72).
Statistical analyses
Regression analysis.
The acute MAT was significantly correlated with locomotive function (BBB) at the chronic time point (r = 0.6, p < 0.05; Fig. 7b), which was not observed for the chronic MAT. There was a high correlation between the chronic functional score (BBB) and perfusion area deficit (r = 0.8, p < 0.01; Fig. 7a). In addition, both MAT and perfusion AD correlated significantly with sparred tissue (Pearson r = 0.77 and r = 0.82, p < 0.05, Fig. 7c and 7d, respectively).
Fig. 7.

Regression analysis at the acute time point. Comparison of contrast-enhanced ultrasound parameters MAT and AD relative to sparred tissue measured at the chronic time point for both injury types. p < 0.01, p < 0.05. AD = perfusion area deficit; BBB = Basso–Beattie–Bresnahan score; MAT = maximum arrival time.
Injury group analysis.
A two-way factorial ANOVA was performed to test the interaction of injury severity (i.e., moderate and severe) and time (i.e., pre-, post- and chronic) on the changes in blood flow estimated by CEUS (i.e., arrival time and area deficit). Both time and injury had a causal effect on the blood flow estimates of MAT and AD that was statistically significant (p < 0.05). At the acute time point for injury type, moderate injury had almost half the MAT delay than the severe injury, which was significant (p < 0.01). There was no significant difference at the chronic time point between injury types for MAT. In addition, Table 3 lists the significant differences between injury groups for MAT and AD for each time point.
Table 3.
Differences between injury severity groups
| Time | Feature | t-Test | Post hoc Bonferroni |
|---|---|---|---|
| Pre-injury | Arrival time delay | 0.9 | 0.354 |
| Area deficit size | 1 | 1 | |
| BBB (1:21) | 1 | 1 | |
| Post-injury | Arrival time delay | <0.01 | <0.01 |
| Area deficit size | <0.01 | <0.01 | |
| BBB (1:21) | <0.01 | <0.01 | |
| Chronic | Arrival time delay | <0.05 | <0.063 |
| Spared tissue | <0.01 | <0.01 | |
| BBB (1:21) | <0.01 | <0.05 |
BBB = Basso–Beattie–Bresnahan score.
Correlation matrix analysis.
The correlation between the microcirculatory features (MAT and perfusion AD) for each time point, along with the macrovascular features at the chronic time point, was evaluated over the entire population of rodents (i.e., combined moderate and severe injury groups). The resulting correlation matrix (Fig. 8) illustrates the correlations between these features as well as the resulting chronic locomotive function (BBB) and spared tissue from histology. The parameters of the acute changes in microcirculatory flow correlated highly with the resulting locomotive function (i.e., week 8 BBB), spared tissue and extent of chronic sulcal artery changes.
Fig. 8.

XCorrelation matrix of flow features and chronic functional score and sparred tissue. Each colored grid has a p value <0.05. BBB = Basso–Beattie–Bresnahan score.
DISCUSSION
In this work, we investigated the use of high-frequency ultrasound with non-linear Doppler imaging of microbubbles to describe changes in blood flow in a rodent SCI model compared with functional assessment and spared spinal cord tissue. The SCI model surgically removes the lamina of the vertebrae, providing dorsal access to the spinal cord for contusive injury and an acoustic window for ultrasound imaging. We use a nonlinear Doppler imaging approach that enables the segmentation of blood flow based on velocity and separation of lower-velocity flow in the microcirculation from higher-velocity flow in the larger vasculature (Bruce et al. 2020). This approach enables the simultaneous imaging of different parts of the vascular tree not possible with conventional Doppler or CEUS approaches. With this approach, we investigated blood flow changes in the microcirculation and larger vasculature immediately after injury and 8 wk later.
Our previous studies were limited to severe injury types (i.e., contusions of 200 kDyn) evaluated at the acute time point. In these studies, we found that contusion-type injuries to the spinal cord result in a deficit of tissue perfusion at the injury epicenter immediately after injury (Khaing et al. 2018, 2020a, 2020b) We extend these previous studies using ultrasound contrast agents to investigate blood flow changes after SCI by, for the first time, reporting on the blood flow changes arising from different severities of injury and following the alterations to spinal cord tissue, locomotive function and blood flow after 8 wk (Soubeyrand et al. 2012; Khaing et al. 2018, 2020b). Here, we investigate additional hemodynamic parameters, in addition to the perfusion area deficit, from both moderate and severe injuries, 150- and 200-kDyn contusions, respectively. We found nearly a doubling of perfusion area deficit between injury types. In addition, we analyzed the bolus kinetics of microbubble passage through the spinal cord, where we observed increases in arrival time surrounding contused tissue, especially in the dorsal regions (Fig. 4). A significant increase in maximal arrival time from 1 to 1.5 s was observed between injury types after SCI. These disturbances in microbubble arrival time suggest a perturbation in vascular resistance of these regions and correspond to the regions where the increase in ISP has been observed (Khaing et al. 2017). In addition, morphological changes to central sulcal (Fig. 4h) arterial vessels were displaced away from the contusion in both the rostral and caudal directions, likely because of the swelling and increase in ISP surrounding the contusion. These acute changes were more pronounced in the severe injury group, with a significant difference in vessel angle change rostral to the contusion.
After 8 wk, significant tissue loss was observed with both ultrasound and histology. More tissue loss was observed in the severe injury group, with 3.2 mm2 versus 1.73 mm2 of sparred tissue remaining around the center of the lesion. Multiple cysts of varying size were observed for both injury groups. In conjunction, tortuous central sulcal vessels were observed in both injury groups extending further rostral and caudal from the contusion site for severe injuries. An increase in arrival time at the chronic time point was observed, but the change was not significant between injury groups.
Changes in acute blood flow measurements (i.e., MAT and AD) were highly correlated with final motor function and the amount of spinal cord tissue remaining between the two severities of injury (Fig. 8). These microcirculatory changes also correlated with chronic changes of the larger vasculature, which were more extensive in the severe injury group. The ability to detect and localize ischemia in tissue at risk for secondary injury after SCI could play an important role preclinically in assessing and guiding neuroprotective strategies, as well as clinically aiding management and prognosis (Saadoun and Papadopoulos 2020).
Our study has several limitations. This study assessed only the medial plane of the spinal cord and did not capture other longitudinal planes. With the spinal cord tissue resting on top of the vertebral body, the large acoustic impedance with the bone interface can create large off-axis artifacts, which can obscure visualization of microbubble signal in ventral tissue. The limited number of rodents possibly limited identification of significant differences in other bolus-kinetic parameters (e.g., mean transit time).
CONCLUSIONS
In a rodent spinal cord injury model, non-linear Doppler imaging of microbubbles was used to investigate blood flow changes in the spinal cord in and around the site of injury. Blood flow changes at the time of injury dependent on injury severity were observed in the microcirculation that correlated with long-term locomotive function and histological tissue loss. Morphological changes observed to the larger vasculature immediately after injury extended away from the site of injury over time. This work illustrates the ability to detect differences in blood changes between injuries of different severity and the potential to identify tissue at risk for secondary injury and potentially inform and guide new neuroprotective therapies after spinal cord injury.
Acknowledgments—
This work was supported by awards from the Craig Neilsen Foundation, Department of Defense (DOD) Congressionally Directed Medical Research Programs (CDMRP) Translational Award (W81XWH-18-1-0753) and the University of Washington Department of Neurological Surgery.
REFERENCES
- Averkiou MA, Bruce MF, Powers JE, Sheeran PS, Burns PN. Imaging methods for ultrasound contrast agents. Ultrasound Med Biol 2020;46:498–517. [DOI] [PubMed] [Google Scholar]
- Basso DM, Beattie MS, Bresnahan JC. A sensitive and reliable locomotor rating scale for open field testing in rats. J Neurotrauma 1995;12:1–21. [DOI] [PubMed] [Google Scholar]
- Benoit Beliard, Elodie Tiran, Kadia Kante, Mickael Tanter, Nothias Fatiha, Sylvia Soares, Sophie Pezet. Ultrafast Doppler imaging and Ultrasound Localization Microscopy reveal the complexity of vascular rearrangement in chronic spinal lesion. Research Square 2022. doi: 10.21203/rs.3.rs-1001156/v2. [DOI] [PMC free article] [PubMed] [Google Scholar]
- Bruce M, Hannah A, Hammond R, Khaing ZZ, Tremblay-Darveau C, Burns PN, Hofstetter CP. High frequency nonlinear Doppler contrast-enhanced ultrasound imaging of blood flow. IEEE Trans Ultrason Ferroelectr Freq Control 2020;67:1776–1784. [DOI] [PubMed] [Google Scholar]
- Cadotte DW, Fehlings MG. Spinal cord injury: A systematic review of current treatment options. Clin Orthop Relat Res 2011;469:732–741. [DOI] [PMC free article] [PubMed] [Google Scholar]
- Cao Y, Wu T, Yuan Z, Li D, Ni S, Hu J, Lu H. Three-dimensional imaging of microvasculature in the rat spinal cord following injury. Sci Rep 2015;5:2045–2322. [DOI] [PMC free article] [PubMed] [Google Scholar]
- Errico C, Pierre J, Pezet S, Desailly Y, Lenkei Z, Couture O, Tanter M. Ultra-fast ultrasound localization microscopy for deep super-resolution vascular imaging. Nature 2015;527:499–502. [DOI] [PubMed] [Google Scholar]
- Goertz DE, Cherin E, Needles A, Karshafian R, Brown AS, Burns PN, Foster FS. High frequency nonlinear B-scan imaging of microbubble contrast agents. IEEE Trans Ultrason Ferroelectr Freq Control 2005;52:65–79. [DOI] [PubMed] [Google Scholar]
- Heimdal A, Torp H. Ultrasound Doppler measurements of low velocity blood flow: Limitations due to clutter signals from vibrating muscles. IEEE Trans Ultrason Ferroelectr Freq Control 1997;44:873–881. [Google Scholar]
- Khaing ZZ, Cates LN, Fischedick AE, McClintic AM, Mourad PD, Hofstetter CP. Temporal and spatial evolution of raised intraspinal pressure after traumatic spinal cord injury. J Neurotrauma 2017;34:645–651. [DOI] [PubMed] [Google Scholar]
- Khaing Z, Bruce M, Hannah A, Hammond R, Tremblay-Darveau C, Hofstetter C, Burns P. Contrast-enhanced ultrasound to visualize hemodynamic changes after rodent spinal cord injury. J Neurosurg Spine 2018;29:306–313. [DOI] [PubMed] [Google Scholar]
- Khaing ZZ, Cates LN, Hyde J, DeWees DM, Hammond R, Bruce M, Hofstetter CP. Contrast-enhanced ultrasound for assessment of local hemodynamic changes following a rodent contusion spinal cord injury. Mil Med 2020a;185:470–475. [DOI] [PubMed] [Google Scholar]
- Khaing ZZ, Cates LN, Hyde JE, Hammond R, Bruce M, Hofstetter CP. Transcutaneous contrast-enhanced ultrasound imaging of the posttraumatic spinal cord. Spinal Cord 2020b;58:695–704. [DOI] [PubMed] [Google Scholar]
- Mautes AE, Weinzierl MR, Donovan F, Noble LJ. Vascular events after spinal cord injury: Contribution to secondary pathogenesis. Phys Ther 2000;80:673–687. [PubMed] [Google Scholar]
- Saadoun S, Papadopoulos MC. Targeted perfusion therapy in spinal cord trauma. Neurotherapeutics 2020;17:511–521. [DOI] [PMC free article] [PubMed] [Google Scholar]
- Shih AY, Driscoll JD, Drew PJ, Nishimura N, Schaffer CB, Kleinfeld D. Two-photon microscopy as a tool to study blood flow and neurovascular coupling in the rodent brain. J Cereb Blood Flow Metab 2012;32:1277–1309. [DOI] [PMC free article] [PubMed] [Google Scholar]
- Soubeyrand M, Laemmel E, Dubory A, Vicaut E, Court C, Duranteau J. Real-time and spatial quantification using contrast-enhanced ultrasonography of spinal cord perfusion during experimental spinal cord injury. Spine 2012;37:E1376–E1382. [DOI] [PubMed] [Google Scholar]
- Soubeyrand M, Badner A, Vawda R, Chung YS, Fehlings MG. Very high resolution ultrasound imaging for real-time quantitative visualization of vascular disruption after spinal cord injury. J Neurotrauma 2014;31:1767–1775. [DOI] [PMC free article] [PubMed] [Google Scholar]
- Streijger F, So K, Manouchehri N, Tigchelaar S, Lee JH, Okon EB, Shortt K, Kim SE, McInnes K, Cripton P. Changes in pressure, hemodynamics, and metabolism within the spinal cord during the first 7 days after injury using a porcine model. J Neurotrauma 2017;34:3336–3350. [DOI] [PubMed] [Google Scholar]
- Tierney J, Baker J, Brown D, Wilkes D, Byram B. Independent component-based spatiotemporal clutter filtering for slow flow ultrasound. IEEE Trans Med Imaging 2019;39:1472–1482. [DOI] [PMC free article] [PubMed] [Google Scholar]
- Tremblay-Darveau C, Williams R, Milot L, Bruce M, Burns PN. Visualizing the tumor microvasculature with a nonlinear plane-wave Doppler imaging scheme based on amplitude modulation. IEEE Trans Med Imaging 2016;35:699–709. [DOI] [PubMed] [Google Scholar]
- Van Belle G Statistical rules of thumb. 699New York: Wiley; 2011. [Google Scholar]
- Westergren H, Farooque M, Olsson Y, Holtz A. Spinal cord blood flow changes following systemic hypothermia and spinal cord compression injury: An experimental study in the rat using laser-Doppler flowmetry. Spinal Cord 2001;39:74–84. [DOI] [PubMed] [Google Scholar]