Abstract
CD8 T cells are central mediators of immune responses against infections and cancer. Here we identified Dapl1 as a crucial regulator of CD8 T cell responses to cancer and infections. Dapl1 deficiency promotes the expansion of tumor-infiltrating effector memory-like CD8 T cells and prevents their functional exhaustion, coupled with increased antitumor immunity and improved efficacy of adoptive T cell therapy. Dapl1 controls activation of NFATc2, a transcription factor required for the effector function of CD8 T cells. Although NFATc2 mediates induction of the immune checkpoint receptor Tim3, competent NFATc2 activation prevents functional exhaustion of CD8 T cells. Interestingly, exhausted CD8 T cells display attenuated NFATc2 activation due to Tim3-mediated feedback inhibition; Dapl1 deletion rescues NFATc2 activation and, thereby, prevents dysfunction of exhausted CD8 T cells in chronic infection and cancer. These findings establish Dapl1 as a crucial regulator of CD8 T cell immunity and a potential target for cancer immunotherapy.
Keywords: CD8 T cells, T cell exhaustion, antitumor immunity, NFATc2, Dapl1
CD8 T cells are a central component in adaptive immune responses to infections and cancer1,2. A normal acute immune response leads to pathogen clearance and generation of memory T cells; however, in chronic infections and cancer, persistent antigen exposure induces a state of T cell exhaustion, characterized by progressive loss of effector functions and expression of inhibitory receptors, or immune checkpoint receptors (ICR), such as PD1, Tim3, CTLA4, and Lag33–5. Expression of inhibitory receptors contributes to the functional exhaustion, and targeting ICRs with blocking antibodies provides an approach in cancer immunotherapy6–8.
Exhausted CD8 T (TEX) cells represent a heterogeneous population, consisting subsets with different transcriptomic profiles and functional properties, responsible for tumor control and responses to ICR blockade therapy9,10. A progenitor-like subpopulation, expressing the transcription factor TCF1, has self- renewal and differentiation capacities and maintains long-lasting T cell responses under chronic stimulation conditions9,11–14. This subpopulation responds to ICR blockade for expansion and differentiation into different stages of TEX cells9,12,15,16. The molecular mechanism regulating TEX differentiation and dysfunction is still poorly understood. Several transcription factors, such as NFAT, IRF4, and Eomes, have been shown to mediate induction of ICR expression11,17–19. NFATc1 is upregulated in exhausted CD8+ T cells17, 20. Overexpression of an engineered NFATc2 mutant, incapable of cooperating with AP-1, can induce the expression of inhibitory receptors and a subset of exhaustion genes, and promote T cell exhaustion18. NFAT cooperates with BATF and IRF4 to mediate the CD8 T cell exhaustion program17. Of note, these transcription factors are also crucial for the generation and function of effector CD8 T cells21–23, but their role in regulating the functionality of TEX cells is unclear.
In the present study, we identified death-associated protein like 1 (Dapl1) as a crucial regulator of CD8 T cell activation and exhaustion. Dapl1 has been implicated as a regulator of retinal pigment epithelial cell proliferation24, but its role in the immune system is undefined. We found that Dapl1 is predominantly expressed in CD8 T cells and involved in negative regulation of CD8 T cell responses to infections and tumorigenesis. Dapl1 ablation promotes expansion of tumor-infiltrating effector memory-like CD8 T cells and improves the functionality of TEX cells. Dapl1 exerts these functions by negatively regulating NFATc2 activation. These results identify Dapl1 as a crucial regulator of CD8 T cell function and exhaustion, highlighting a mechanism that regulates the intratumoral function of CD8 T cells.
Results
Dapl1 is a negative regulator of CD8 T cell activation
We have previously shown that CD8 T cells lacking a deubiquitinase, Otub1, display stronger responses to infections and cancer25. Our RNA sequencing (RNAseq) analysis identified Dapl1 as a gene drastically downregulated in the Otub1-deficient CD8 T cells (GSE126777). Interestingly, Dapl1 was abundantly expressed in CD8 T cells, only weakly expressed in CD4 T cells, and barely detected in other immune cells (Extended Data Fig. 1a,b). To examine the role of Dapl1 in regulating T cell functions, we generated Dapl1 knockout (KO) mice (Extended Data Fig. 1c–f). Dapl1 deficiency did not alter the frequencies and numbers of CD4 and CD8 T cells or naïve and memory-like CD4 and CD8 T cells (Extended Data Fig. 1g–i); however, Dapl1 deficiency promoted the activation of CD8 T cells, as revealed by elevated production of cytokines, including interleukin 2 (IL-2), interferon-γ (IFN-γ), and TNF-α, upon in vitro stimulation with agonistic antibodies for T cell receptor (TCR) and CD28: anti-CD3 and anti-CD28 (Extended Data Fig. 1j,k). Dapl1 deficiency had no significant effect on CD4 T cell activation (Extended Data Fig. 1j,k). DAPL1 knockdown in primary human CD8 T cells also enhanced cytokine induction by anti-CD3 and anti-CD28 (Extended Data Fig. 1l–n). Thus, Dapl1 is predominantly expressed in CD8 T cells and involved in negative regulation of CD8 T cell activation.
Dapl1 regulates CD8 T cell responses to bacterial infections
To evaluate the in vivo functions of Dapl1, we employed a bacterial infection model using a recombinant Listeria monocytogenes strain expressing chicken ovalbumin (LM-OVA)26,27. Compared to WT mice, Dapl1 KO mice mounted much stronger immune responses against LM-OVA infection, as evidenced by a significantly lower bacterial titer in the liver and higher frequency of antigen-specific CD8 effector T cells (Fig. 1a–c). In contrast, the frequency of CD4 effector T cells responding to the MHC II-restricted Listeria antigen listeriolysin (LLO190–201) was comparable between wildtype and Dapl1 KO mice (Fig. 1d).
Fig. 1. Dapl1 deficiency promotes antitumor immunity and improves ACT efficacy.
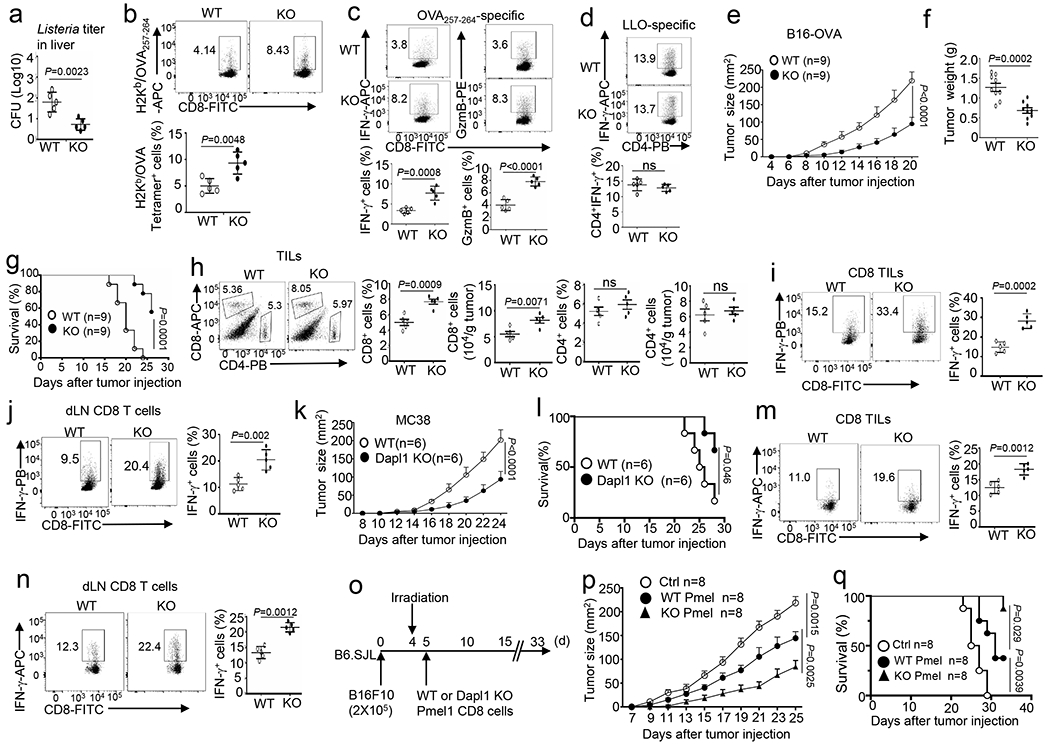
a-d, Bacterial burden in the liver (a) and flow cytometry analysis of the frequency of H2Kb/OVA257–264 Tetramer+ CD8 T cells (b), OVA257–264-specific IFN-γ- or Granzyme B- producing CD8 effector T cells (c), and LLO190–201-specific IFN-γ- producing CD4 effector T cells (d) in the spleen of wildtype (WT) and Dapl1 KO mice infected with LM-OVA for 7 days. Data are presented as a representative plot (upper) and summary graph (lower). n=5 per genotype. e-j, Tumor growth curve (e), tumor weight on day 20 (f), survival curves (g), flow cytometry analysis of the frequency and absolute cell number of tumor- infiltrating CD4 and CD8 T cells (h), and flow cytometry analysis of the frequency of IFN-γ- producing CD8 T cells in the tumor (i) and draining lymph nodes (j) of wildtype (WT) or Dapl1 KO mice injected subcutaneously with B16-OVA melanoma cells. Data in h-j are shown as representative plots (left) and summary graphs (right). n=9 (e-g) or 5 (h-j) per genotype. k-n, Tumor growth curve (k), survival curves (l), flow cytometry analysis of the frequency of IFN-γ-producing CD8 T cells in the tumor (m) and draining lymph nodes (n) of wildtype or Dapl1 KO mice injected subcutaneously with MC38 cells. n=6 (k,l) or 5 (m,n) per genotype. o-q, Schematic of experimental design (o), tumor growth curve (p) and survival plot (q) of wildtype B16F10 tumor-bearing mice adoptively transferred with wildtype or Dapl1 KO Pmel1 effector CD8 T cells (6×10⁵). Control mice were inoculated with B16F10 cells without irradiation and Pmel1 T cell injection. n =8 per genotype. Data are representative of three independent experiments. Summary data are shown as the mean ± s.d. with P values determined using a two-tailed unpaired Student’s t-test (a-d, f, h-j, l, m, n), two-sided log-rank Mantel-Cox tests (g, l, q) and two-way ANOVA with Bonferroni correction (e, k, p).
Dapl1 deficiency promotes antitumor CD8 T cell responses
To examine the role of Dapl1 in regulating antitumor immunity, we employed an animal model involving inoculation of mice with murine B16 melanoma cells expressing OVA (B16-OVA). Compared with the wildtype mice, the Dapl1 KO mice displayed reduced tumor burden and improved survival coupled with significantly increased CD8 tumor-infiltrating lymphocytes (TILs) and IFN-γ-producing CD8 effector T cells (Fig. 1e–j). On the other hand, Dapl1 deficiency did not alter the frequency of CD4 TILs or CD4 effector T cells (Fig. 1h and Extended Data Fig. 2a). Similar results were obtained with the MC38 colon cancer model (Fig. 1k–n and Extended Data Fig. 2b,c).
To evaluate the therapeutic potential of targeting Dapl1, we employed a mouse model of adoptive cell therapy (ACT) using CD8 T cells derived from Pmel1 TCR transgenic mice producing CD8 T cells specific for a melanoma antigen, gp100, expressed in B16F10 melanoma cells28 (Fig. 1o). Compared to wildtype Pmel1 CD8 T cells, Dapl1-deficient Pmel1 CD8 T cells had a markedly stronger function in suppressing tumor growth and improving mouse survival (Fig. 1p,q). Transfer of Dapl1-deficient Pmel1 CD8 T cells also led to a higher frequency of tumor-infiltrating total and effector Pmel1 T cells throughout a time course ranging from 5 days to 15 days after Pmel1 cell transfer (Extended Data Fig. 2d–g).
Dapl1 regulates Tim3 expression and ICR blockade therapy
To dissect the mechanism by which Dapl1 regulates CD8 T cell function, we examined the role of Dapl1 in regulating ICR expression using the B16-OVA model. Interestingly, Dapl1 deletion markedly increased the frequency of Tim3+ CD8 TILs, although it did not significantly alter the frequency of PD1+ or Lag3+ CD8 TILs (Fig. 2a). The Tim3+ CD8 TILs were mostly PD1 positive, and this PD1+Tim3+ CD8 TIL population was significantly increased in the Dapl1 KO mice (Fig. 2b). Dapl1 deficiency also elevated the expression level (mean fluorescence intensity) of Tim3, but not other ICRs analyzed (Extended Data Fig. 2h). Similar results were observed with the MC38 tumor model (Extended Data Fig. 2i). Dapl1 deficiency did not alter Tim3 expression in CD4 TILs (Extended Data Fig. 2j).
Fig. 2. Dapl1 deficiency promotes Tim3 expression and improves responses to ICR blockade.
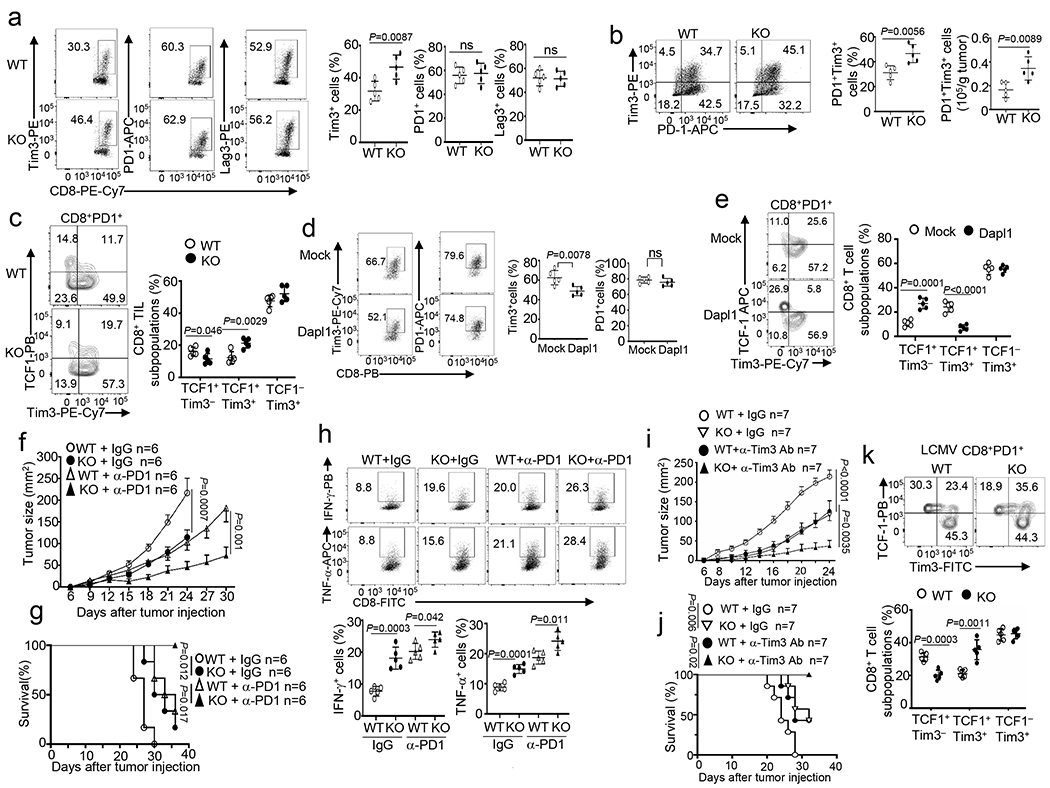
a,b, Flow cytometry analysis of the frequency of Tim3+, PD1+ and Lag3+ CD8 T cells (a), and the frequency and absolute cell number of Tim3+ PD1+ CD8 TEX cells (b) in the tumor of B16-OVA-implanted wildtype (WT) and Dapl1 KO mice. n = 5 per genotype. c, Flow cytometry analysis of the frequency of TCF1+Tim3−, TCF1+Tim3+ and TCF1−Tim3+ subsets, gated on CD8+PD1+ T cells in the tumor of B16-OVA tumor-bearing wildtype or Dapl1 KO mice, n = 5 per genotype. d,e, Flow cytometry analysis of the frequency of Tim3+ and PD1+ CD8 T cells (d), TCF1+Tim3−, TCF1+Tim3+ and TCF1−Tim3+ subsets(e) in the tumor of B16F10-implanted B6.SJL mice (CD45.1+) adoptively transferred with Dapl1 KO Pmel1 CD8 T cells (CD45.2+) transduced with either an empty vector (Mock) or HA-Dapl1 expression vector (Dapl1). n = 5 per genotype. f-h, Tumor growth curves (f), survival curves (g) and flow cytometry analysis of the frequency of IFN-γ- or TNF-α- producing CD8 T cells in the tumor (h) of wildtype or Dapl1 KO mice injected subcutaneously with B16-OVA followed by i.p. injection with anti-PD1 (100 μg/mouse) or isotype control on days 7, 9, and 11. n = 6 (f,g) or n = 5 (h) per genotype. i,j, Tumor growth curves (i) and survival curves (j) of wildtype or Dapl1 KO mice injected subcutaneously with B16-OVA followed by i.p. injection with anti-Tim3 (200 μg/mouse) or isotype control on days 7, 9, and 11. n = 7 per genotype. k, Flow cytometry analysis of the frequency of TCF1+Tim3−, TCF1+Tim3+ and TCF1−Tim3+ subsets, gated on H2Db/GP33–41 tetramer+ CD8+PD1+ T cells in the spleen of wildtype or Dapl1 KO mice infected with LCMV clone 13 for 30 days, n = 5 per genotype. Data are representative of three independent experiments. Summary data are shown as the mean ± s.d. with P values determined using a two-tailed unpaired Student’s t-test (a-e, h, k), two-sided log-rank Mantel–Cox tests (g, j) and two-way ANOVA with Bonferroni correction (f, i). ns, not significant.
Recent studies suggest that a subpopulation of TCF1-expressing CD8 TEX cells has hallmarks of progenitor and central memory T cells and responds to anti-PD1 therapy to produce terminally exhausted TCF1−PD1+Tim3+ CD8 T cells9,12,15,29–31. We detected progenitor exhausted (TCF1hiPD1+Tim3−) and terminally exhausted (TCF1−PD1+Tim3+) populations in the CD8 TILs of B16-OVA melanoma-bearing mice (Fig. 2c). We also identified a PD1+Tim3+ CD8 TIL population retaining expression of TCF1, and this TCF1+PD1+Tim3+ population was substantially increased in Dapl1 KO mice (Fig. 2c). The expansion of TCF1+PD1+Tim3+ cells was associated with decreased frequencies of the TCF1+PD1+Tim3− cells, indicating that Dapl1 deficiency might promote the conversion of progenitor exhausted CD8 TILs to an intermediate form (Fig. 2c). In line with the Dapl1 KO mouse studies, Dapl1 overexpression in Pmel1 CD8 T cells reduced the generation of Tim3+ CD8 TILs and TCF1+PD1+Tim3+ subsets as well as effector CD8 TILs in an ACT model (Fig. 2d,e and Extended Data Fig. 2k–m).
Because of the results presented above, we examined whether Dapl1 deletion might enhance ICR blockade responses. Indeed, Dapl1 deficiency profoundly promoted anti-PD1-induced tumor suppression and mouse survival as well as CD8 TIL increase (Fig. 2f–h, Extended Data Fig. 2n). Dapl1 deletion also synergized with anti-Tim3 treatment to reduce tumor growth and increase survival rate, associated with increased frequencies of CD8 TILs (Fig. 2i,j, Extended Data Fig. 2o). We also performed lymphocytic choriomeningitis virus (LCMV) clone 13 infection, a widely used model for studying chronic infection and CD8 T-cell exhaustion3. Dapl1 deficiency increased the frequency of viral antigen (GP33)-specific CD8 T cells as well as Tim3+ and TCF1+PD1+Tim3+ CD8 T cells (Fig. 2k and Extended Data Fig. 3a–d), although it did not alter the frequency of a recently described CX3CR1+ cytotoxic effector CD8 T cell subset31,32 (Extended Data Fig. 3e). Together, these results suggest that Dapl1 deficiency expands a population of TCF1+PD1+Tim3+ CD8 TEX cells in both cancer and LCMV chronic infection models and improves responses to anti-PD1- and anti-Tim3 cancer therapy.
Dapl1 regulates the functionality of exhausted CD8 T cells
Because Dapl1 deficiency promotes antitumor immunity despite increasing Tim3 expression, we tested whether Dapl1 might regulate the functionality of exhausted CD8 T cells. Interestingly, the Dapl1-deficient PD1+Tim3+ CD8 TILs expressed a much higher level of granzyme B, IFN-γ, and the proliferation marker Ki67 (Fig. 3a,b). In the LCMV clone 13 chronic infection model, the Dapl1 KO mice also produced a significantly higher frequency of antigen-specific CD8 T cells, coupled with reduced viral load, and the Dapl1 KO PD1+Tim3+ CD8 T cells expressed a higher level of Ki67 and effector-related molecules (Fig. 3c–f). Sorted Dapl1-deficient antigen-specific GP33+PD1+ CD8 T cells also displayed markedly higher proliferative ability than the wildtype GP33+PD1+ CD8 T cells in vitro (Fig. 3g).
Fig. 3. Dapl1 regulates the functionality of exhausted CD8 T cells.
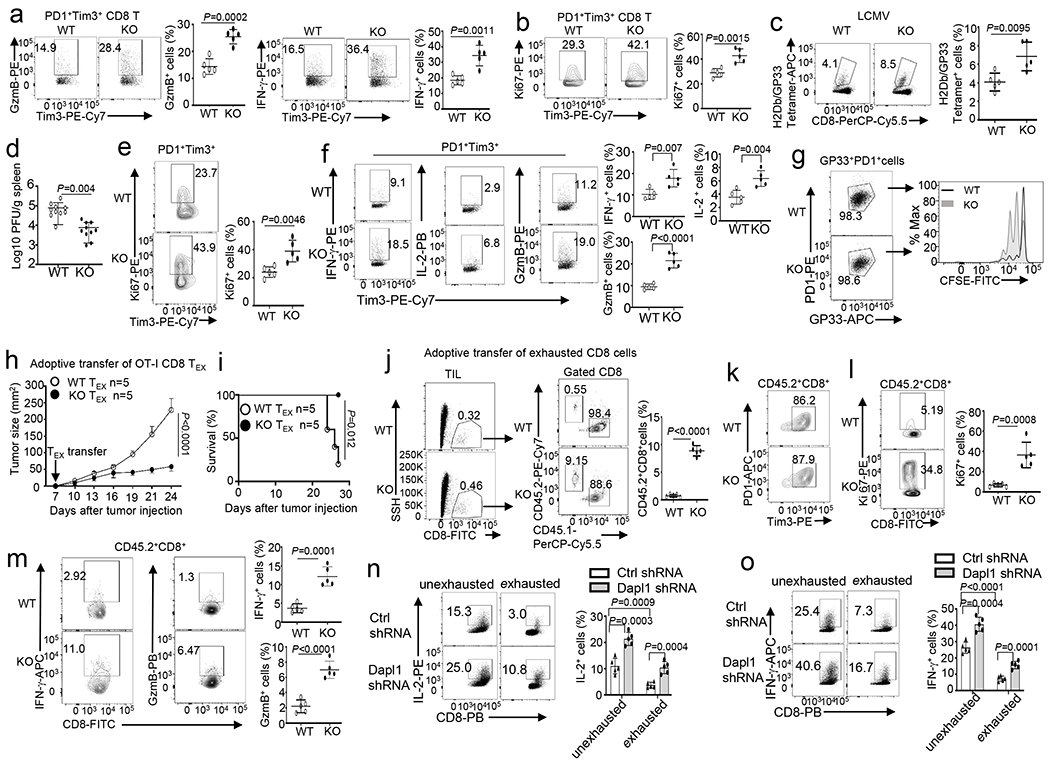
a,b, Flow cytometry analysis of the frequency of Granzyme B- or IFN-γ-producing cells (a) and Ki67+ cells (b), gated on CD8+PD1+Tim3+ T cells in the tumor of B16-OVA-bearing wildtype (WT) or Dapl1 KO mice. n =5 per genotype. c,d, Flow cytometry analysis of the frequency of H2Db/GP33–41 Tetramer+ CD8 T cells (c) and LCMV viral load (d) in the spleen of LCMV clone 13-infected wildtype and Dapl1 KO mice. n=5(c) or n=10 (d) per genotype. e,f, Flow cytometry analysis of the frequency of Ki67+ cells in gated H2Db/GP33–41 tetramer+PD1+Tim3+ CD8 T cell population (e) and ICS detecting IFN-γ-, IL-2- or granzyme B-producing cells in the gated PD1+Tim3+ CD8 T cell population (f) derived from the spleen of wildtype or Dapl1 KO mice infected with LCMV clone 13 for 30 days. n =5 per genotype. g, Flow cytometry analysis of CFSE dilution to measure the proliferation of H2Db/GP33–41 Tetramer+PD1+ CD8 T cells, stimulated in vitro with anti-CD3 plus anti-CD28 for 3 days. h,i, Tumor growth curve (h) and survival plot (i) of B16-OVA-bearing B6.SJL mice (CD45.1+) adoptively transferred (on day 7 after tumor injection) with in vitro exhausted wildtype or Dapl1 KO OT-I (CD45.2+) CD8 T cells (5×10⁵ cells/mouse). n =5 per genotype. j-m, Flow cytometry analysis of the frequency of donor OT-I CD8 T cells (CD45.2+) and host CD8 T cells (CD45.1+) (j) as well as donor (CD45.2+) PD1+Tim3+ cells (k), Ki67+ cells (l), and IFN-γ- or granzyme B-producing OT-I CD8 T cells (m) in gated tumor-infiltrating CD45.2+CD8+ T cells of the mice from h. n =5 per genotype. n,o, ICS analysis of IL-2-producing (n) or IFN-γ-producing (o) cells in human CD8 T cells transduced with a control (Ctrl) shRNA or a Dapl1-specific shRNA and subsequently cultured under exhaustion or unexhaustion conditions. Data are representative of three independent experiments. Summary data are shown as the mean ± s.d. with P values determined using a two-tailed unpaired Student’s t-test (a-f, j, l-o), two-sided log-rank Mantel–Cox tests (i) and two-way ANOVA with Bonferroni correction (h).
To directly test the role of Dapl1 in regulating the functionality of CD8 TEX cells, we employed an ACT model using in vitro generated OVA-specific OT-I CD8 TEX cells. These TEX cells expressed high levels of exhaustion-associated molecules and decreased levels of progenitor- and effector-associated molecules (Extended Data Fig. 4a,b). When adoptively transferred into B16-OVA tumor-bearing mice, wildtype OT-I CD8 TEX cells were ineffective in suppressing tumor growth, whereas Dapl1 KO OT-I CD8 TEX cells markedly suppressed tumor growth and improved survival of the tumor-bearing mice (Fig. 3h,i). These phenotypes were associated with a profoundly higher frequency of transferred Dapl1 KO OT-I CD8 T cells, relative to the transferred wildtype OT-I CD8 T cells, in the tumors (Fig. 3j). Although both wildtype and Dapl1 KO OT-I CD8 TILs were largely PD1+Tim3+, the Dapl1 KO CD8 TILs expressed a much higher level of Ki67 and effector-related molecules (Fig. 3k–m). Using an in vitro model, we showed that Dapl1 knockdown in exhausted human CD8 T cells also significantly increased cytokine expression (Fig. 3n,o and Extended Data Fig. 4c–g). Together, these results suggest that Dapl1 deletion may preserve the functionality of exhausted CD8 T cells and, thereby, promote antitumor immunity.
Cell-intrinsic function of Dapl1 in CD8 T cell regulation
The expression profile of Dapl1 (Extended Data Fig. 1a,b) suggested a cell-intrinsic role in CD8 T cell regulation. To further confirm this idea, we generated mixed bone marrow chimeric mice (Extended Data Fig. 5a). While the spleen of the tumor-challenged chimeric mice contained a similar frequency of wildtype and Dapl1 KO CD8 T cells, the tumor of these mice contained a markedly higher frequency of Dapl1 KO CD8 T cells (Extended Data Fig. 5b). The Dapl1 KO CD8 TILs had an increased frequency of cells expressing effector cytokines and Ki67 than the wildtype TILs (Extended Data Fig. 5c). The Dapl1 KO CD8 TILs also contained an increased frequency of Tim3+, PD1+Tim3+, and TCF1+PD1+Tim3+ populations, and the Dapl1 KO PD1+Tim3+ CD8 TILs produced a much higher level of effector cytokines and Ki67 (Extended Data Fig. 5d–g). Similar results were obtained with the LCMV clone 13 infection model (Extended Data Fig. 5h–l). Mixed bone marrow chimeric mouse studies also revealed that the function of Dapl1 in regulating CD8 T cell responses to LM-OVA infection was cell-intrinsic (Extended Data Fig. 6a–c). The cell-intrinsic function of Dapl1 was further demonstrated by a mixed T cell adoptive transfer approach (Extended Data Fig. 6d–k). These results emphasize a cell-intrinsic role for Dapl1 in regulating CD8 T cell functions in different models.
Dapl1 deletion expand effector memory-like CD8 TILs
To examine the role of Dapl1 in regulating the dynamics of CD8 TIL subpopulations, we performed single-cell RNAseq (scRNAseq) analysis of TILs prepared from B16-OVA tumor-bearing mice. Unsupervised clustering identified 6 clusters of CD8 TILs, and Dapl1 deletion reduced the frequency of cluster 1 and expanded cluster 3 (Fig. 4a,b). Clusters 1 and 4 cells expressed genes associated with progenitor-like CD8 T cells, including Tcf7 (encoding TCF1), Foxp1, Sell, Lef1, and Id3 (Fig. 4c). Dapl1 was abundantly expressed in the Tcf7hi cluster 1 cells and much more weakly expressed in the other clusters (Fig. 4d). Analysis of a human uveal melanoma scRNAseq dataset (GSE139829) also revealed selective expression of Dapl1 in the Tcf7+ progenitor-like CD8 TIL subpopulation (Extended Data Fig. 7a–c). Cluster 3 cells, named effector memory-like CD8 TILs, had hallmarks of both memory and effector CD8 T cells. They expressed memory-related genes, such as Tcf7, Lef1, Foxp1, and Klf2, but not Sell or Id3 (Fig. 4c), indicative of transition towards effector cells. Indeed, cluster 3 cells expressed effector-related genes, such as Ifng, Gzma, Gzmb, Ccr2, Cxcr3, Rora, and Itgb1 (Fig. 4c,d). They also expressed high levels of Ly6c2, a gene involved in CD8 T cell memory33–35, and low levels of Pdcd1 (Fig. 4c,d). Flow cytometry assays further confirmed the increased frequency of CXCR3+, Ly6c+, and CCR2+ cells within the PD1loTCF1lo effector CD8 TIL population (Fig. 4e). These results suggest that Dapl1 deficiency decreases the Tcf7hi progenitor-like CD8 T cells and increases the Tcf7low effector memory-like CD8 T cells.
Fig. 4. Dapl1 deletion reprograms tumor-infiltrating CD8 T cells.
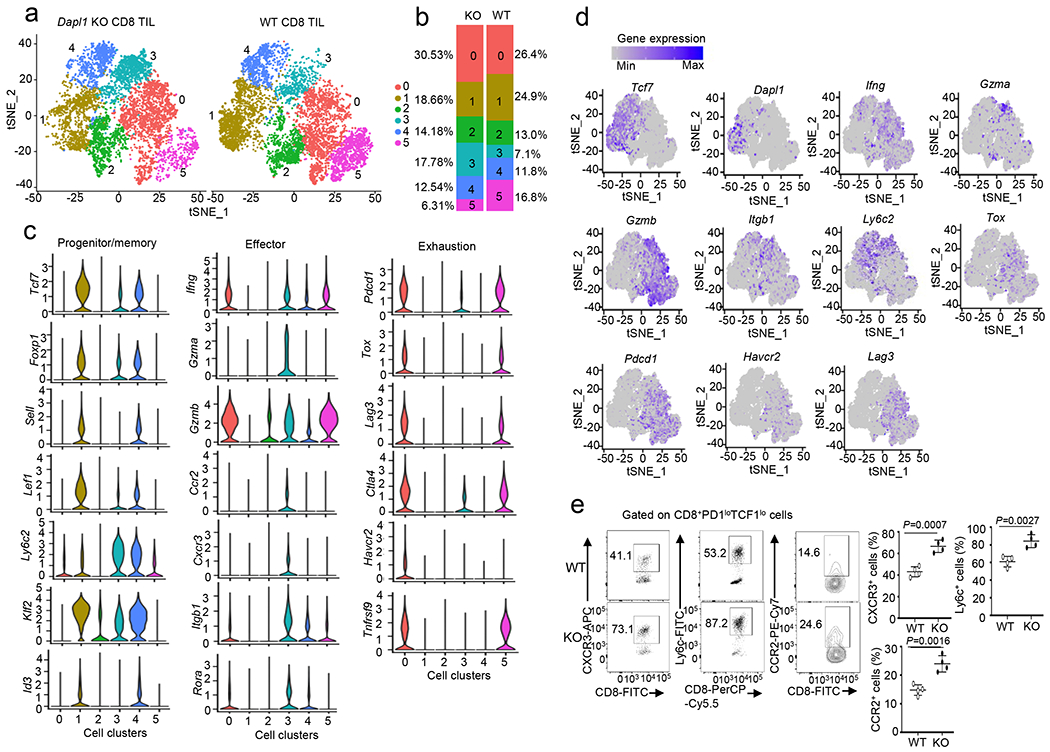
a, tSNE plot based on unsupervised clustering analysis of scRNAseq using tumor-infiltrating CD8+ T cells prepared from B16-OVA tumor-bearing wildtype or Dapl1 KO mice (day 22 tumor; combined from 6 tumors/genotype). The 6 clusters are labeled with different colors. b, Quantification of the proportion of WT or Dapl1 KO CD8 T cells in each cluster. c, Violin plots showing expression of genes associated with progenitor/memory, effector, and exhaustion functions in the indicated 6 clusters of CD8 TILs. d, Expression profile of the indicated genes in each cluster of CD8 TILs. e, Flow cytometry analysis of the frequency of CXCR3+, Ly6c+ or CCR2+ cells gated on PD1low TCF1low CD8 T cells derived from day 22 tumor of B16-OVA-bearing wildtype or Dapl1 KO mice. Data are presented as representative FACS plots (left) and summary graphs (right). n=4 per genotype. Summary data are shown as the mean ± s.d. with P values determined using a two-tailed unpaired Student’s t-test (e).
Clusters 0 and 5 were major subpopulations of CD8 TILs expressing exhaustion-related genes, such as Tox, Pdcd1, Lag3, and Ctla4, and these exhausted TILs retained the ability to express some effector-related genes, such as Gzmb, Ifng, and Tnfrsf9 (Fig. 4c,d). However, clusters 0 and 5 lacked expression of a number of other effector-related genes, such as Gzma, Rora, Cxcr3, Ccr2, and only weakly expressed Itgb1. Dapl1 deficiency drastically reduced the frequency of cluster 5 cells (Fig. 4a,b). These results suggest that Dapl1 deficiency results in expansion of an effector memory-like CD8 TIL subpopulation (cluster 3) and reduction in a subpopulation of exhausted CD8 TILs (cluster 5), highlighting a role for Dapl1 in regulating the intratumoral dynamics of CD8 T cells.
qRT-PCR assays confirmed that Dapl1 was highly expressed in PD1−Tim3− progenitor-like cell subset and moderately expressed in PD1+Tim3+ exhausted cell subset (Extended Data Fig. 7d). To test whether Dapl1 regulated the conversion of progenitor-like CD8 T cells to effector CD8 T cells, we prepared antigen (GP33)-specific progenitor CD8 T cells from LCMV clone 13-infected mice and adoptively transferred them into B6.SJL mice bearing B16F10 melanoma expressing an LCMV minigene, B16F10-LCMVmini (Extended Data Fig. 7e). On days 3 and 10 after transfer, the Dapl1 KO CD8 T cells contained a lower frequency of TCF1hi and TCF1+Tim3− progenitor CD8 TEX cells (Extended Data Fig. 7f,g) and a higher frequency of effector CD8 T cells (Extended Data Fig. 7h) in the tumor, compared to the wildtype CD8 T cells. Although the wildtype and Dapl1 KO progenitor CD8 T cells had comparable levels of apoptosis, the Dapl1 KO progenitor CD8 TEX cells displayed a higher level of Ki67, indicative of increased proliferation (Extended Data Fig. 7i,j). These data suggest that Dapl1 may negatively regulate progenitor-like CD8 T cell expansion and conversion to effector CD8 T cells.
Dapl1 serves as a negative regulator of NFATc2
Dapl1 deficiency did not appreciably influence TCR/CD28-stimulated activation of major signaling events, including phosphorylation of AKT, the mTORC1 target S6 kinase (S6K), the MAP kinases ERK and p38, and the NF-κB pathway proteins p65 and IκBα as well as nuclear translocation of the AP1 family proteins c-Jun and c-Fos (Extended Data Fig. 8a,b). Interestingly, Dapl1 deficiency promoted nuclear translocation of the transcription factor NFATc2, although not NFATc1 and NFATc3, in CD8 T cells (Fig. 5a–c). Dapl1 deficiency did not promote NFATc2 activation in CD4 T cells (Extended Data Fig. 8c). Overexpression of Dapl1 in the Jurkat T cell line, which had undetectable levels of endogenous Dapl1, inhibited activation of NFATc2, but not NFATc1 (Fig. 5d). Thus, Dapl1 serves as a specific regulator of NFATc2.
Fig. 5. Dapl1 is a specific regulator of NFATc2 activation.
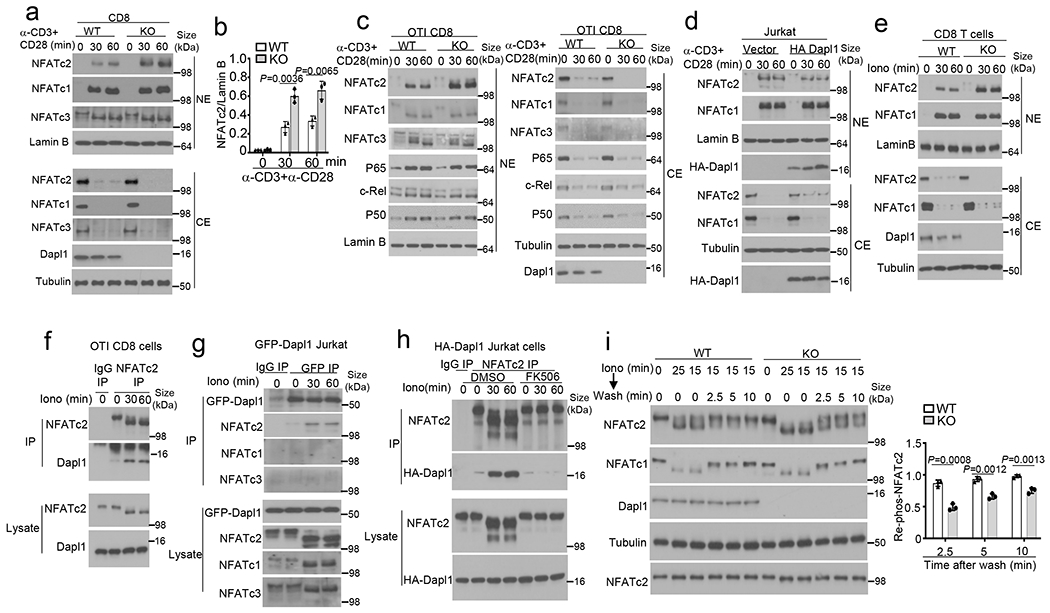
a,b, Immunoblot analysis of the indicated proteins in cytoplasmic (CE) and nuclear (NE) extracts of naive wildtype (WT) or Dapl1 KO CD8 T cells stimulated with anti-CD3 and anti-CD28 (a, b). Data are presented as a representative blot (a) and a summary graph of densitometric quantifications of NFATc2 (presented as NFATc2/LamninB ratio) based on three independent experiments (b). c,d, Immunoblot analysis of the indicated proteins in cytoplasmic (CE) and nuclear (NE) extracts of wildtype or Dapl1 KO OT-I CD8 T cells (c) and Jurkat T cells transduced with either an empty vector or HA-Dapl1 expression vector (d), stimulated with anti-CD3 and anti-CD28 for the indicated time points. e, Immunoblot analysis of the indicated proteins in cytoplasmic (CE) and nuclear (NE) extracts of naive wildtype or Dapl1 KO CD8 T cells stimulated with ionomycin. f-h, Co-IP analysis of NFATc2-Dapl1 interactions (upper panels) and direct IB analyses of the indicated proteins (lower panels) in ionomycin-stimulated wildtype OT-I CD8 T cells (f), Jurkat T cells transduced with a GFP-Dapl1 expression vector (g), or Jurkat T cells transduced with an HA-Dapl1 expression vector and pretreated with 20 nM FK506 or solvent control (DMSO) (h). i, Immunoblot analysis of NFATc2 or NFATc1 dephosphorylation and re-phosphorylation in whole cell lysates of wildtype or Dapl1 KO naïve CD8 T cells, stimulated with ionomycin for 15 min followed by washing and incubation in fresh medium without ionomycin for the indicated time points. Data are presented as a representative blot (left) and a summary graph of densitometric quantifications of re-phosphorylated NFATc2 (presented as phospho-NFATc2/total NFATc2 ratio) based on three independent experiments (right). Data are representative of three independent experiments. Summary data are shown as the mean ± s.d. with P values determined using a two- tailed unpaired Student’s t-test (b, i).
Activation of NFATs involves their dephosphorylation by the calcium-dependent phosphatase calcineurin, which triggers their nuclear translocation36,37. Dapl1 deficiency in murine CD8 T cells or knockdown in human CD8 T cells promoted the activation of NFATc2, but not NFATc1, by a calcium ionophore, ionomycin (Fig. 5e and Extended Data Fig. 8d). Coimmunoprecipitation (coIP) assays revealed that Dapl1 interacted with NFATc2 in ionomycin-stimulated cells but not in unstimulated cells (Fig. 5f). Similar results were obtained with Jurkat T cells stably transduced with Dapl1 (Fig. 5g). Dapl1 did not interact with NFATc1 or NFATc3 (Fig. 5g). Inhibition of NFATc2 dephosphorylation by a calcineurin inhibitor, FK506, blocked the Dapl1-NFATc2 interaction (Fig. 5h). Furthermore, overexpressed Dapl1 interacted with a constitutively active NFATc2 mutant (CA-NFATc2) mimicking dephosphorylated NFATc238, but not with wildtype NFATc2 representing fully phosphorylated form (Extended Data Fig. 8e). Dapl1 did not interact with a constitutive active NFATc1 (CA-NFATc1) (Extended Data Fig. 8f). Thus, Dapl1 physically interacts with dephosphorylated NFATc2 in response calcium signals.
NFAT activation is opposed by specific protein kinases mediating rephosphorylation of activated NFATs to cause their nuclear export36. Using an ionomycin flash stimulation and chase experiment39,40, we found that Dapl1 deficiency substantially attenuated the rephosphorylation of NFATc2 in CD8 T cells after ionomycin removal (Fig. 5i), suggesting that Dapl1 negatively regulates NFATc2 activation by promoting its rephosphorylation.
NFATc2 deletion reverses the Dapl1 KO CD8 T cell phenotypes
By generating Dapl1 and NFATc2 double KO mice, we found that NFATc2 deletion reversed the hyper-activation phenotype of the Dapl1 KO CD8 T cells and prevented the hyper-responsiveness of Dapl1 KO mice to LM-OVA infections (Fig. 6a–d and Extended Data Fig. 8g). NFATc2 deletion also increased tumor burden and erased the differences between the wildtype and Dapl1 KO mice in tumor growth (Fig. 6e). The increased frequency of tumor-infiltrating CD8 effector T cells in Dapl1 KO mice was also eliminated by the NFATc2 deficiency (Fig. 6f and Extended Data Fig. 8h).
Fig. 6. NFATc2 mediates the effector function and Tim3 hyperexpression of Dapl1-deficient CD8 T cells.
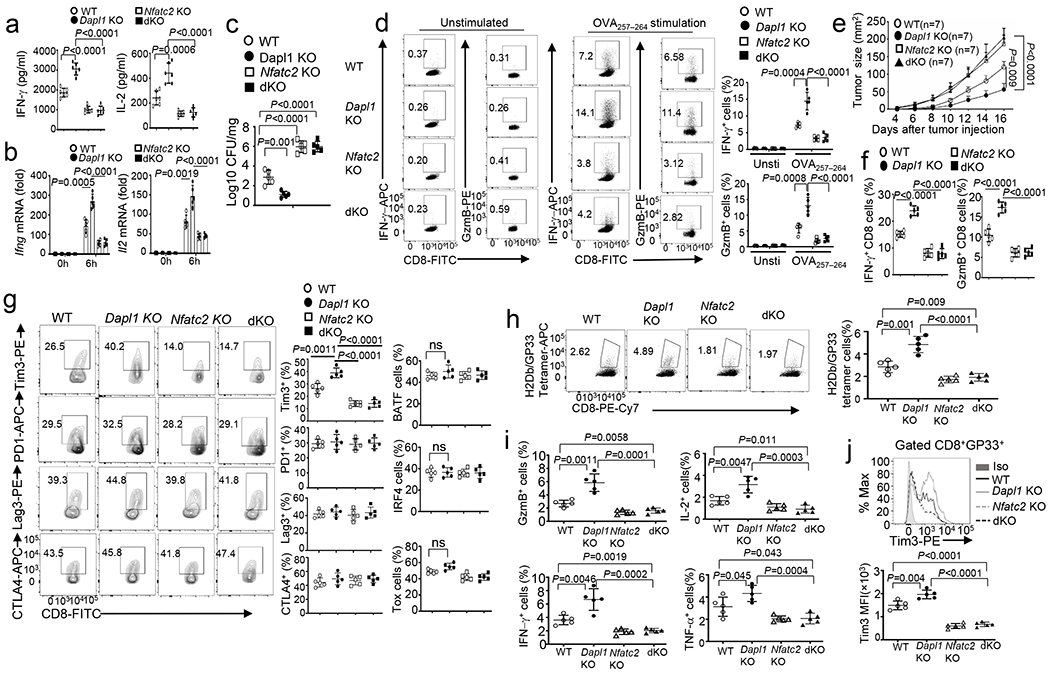
a,b, ELISA of secreted IL-2 and IFN-γ (a) and qRT-PCR analysis of IFN-γ and IL-2 mRNA (b) in naive CD8 T cells from the indicated mouse strains, stimulated for 48h (a) or 6h (b) with anti-CD3 and anti-CD28. n =6 (a) or 5 (b) per genotype. c,d, Bacterial burden in the liver (c) and flow cytometry analysis of the frequency of splenic IFN-γ- or Granzyme B- producing CD8 effector T cells following in vitro restimulation with OVA peptide or medium control (unstimulated) (d) of wildtype (WT), Dapl1 KO, NFATc2 KO and Dapl1-NFATc2 dKO (dKO) mice infected with LM-OVA for 7 days. n =5 per genotype. e-g, Tumor growth curve (e) and flow cytometry analysis of the frequency of IFN-γ- or Granzyme B-producing CD8 T cells (f) and CD8 T cell subsets expressing the indicated molecules (g) in the tumor of B16-OVA-bearing wildtype, Dapl1 KO, NFATc2 KO and Dapl1-NFATc2 dKO mice. n =7 per genotype (e), and n =5 per genotype (f,g). h-j, Flow cytometry analysis of the frequency of H2Db/GP33–41 Tetramer+ CD8 T cells (h), Granzyme B-, IFN-γ-, IL-2- or TNF-α-producing CD8 effector T cells (i), and Tim3 expression level on H2Db/GP33–41 Tetramer+ CD8 T cells (j) in the spleen of wildtype, Dapl1 KO, NFATc2 KO and Dapl1-NFATc2 dKO mice infected with LCMV clone 13 for 30 days. n =5 per genotype. Data are representative of three independent experiments. Summary data are shown as the mean ± s.d. with P values determined using a two-tailed unpaired Student’s t-test (a-d, f-j) and two-way ANOVA with Bonferroni correction (e).
Since Dapl1 deficiency increased Tim3 expression (Fig. 2a and Extended Data Fig. 2h), we examined the potential involvement of NFATc2 in this function of Dapl1. NFATc2 deletion dramatically decreased the frequency of Tim3+ CD8 TILs and blocked the hyper-induction of Tim3+ CD8 TILs in Dapl1 KO mice (Fig. 6g). NFATc2 deficiency did not alter the frequency of CD8 TILs expressing several other ICRs (PD1, CTLA4, Lag3) or transcription factors (Tox, IRF4, BATF) known to be regulated by NFAT (Fig. 6g). These results suggest that the Dapl1-NFATc2 axis is essential for controlling Tim3 expression, whereas NFATc2 may be functionally redundant with other NFAT members in regulating the other target genes. In the LCMV clone 13 chronic infection model, the phenotypes of Dapl1 KO mice were also reversed upon NFATc2 deletion (Fig. 6h–j and Extended Data Fig. 8i).
We further examined the role of NFATc2 in mediating Tim3 expression using an in vitro approach. Acute activation of both effector and exhausted CD8 T cells induced expression of the Tim3-encoding gene Havcr2, which was elevated in Dapl1-deficient CD8 T cells (Fig. 7a,b). NFATc2 deficiency blocked the induction of Havcr2 and erased the differences between Dapl1-sufficient and Dapl1-deficient CD8 T cells (Fig. 7a,b). Chromatin IP (ChIP) assays revealed the binding of NFATc2 to Havcr2 promoter in a region between −432 and −5, in LCMV-specific CD8 T cells, but not in naïve CD8 T cells (Fig. 7c). This promoter-binding activity was increased in the Dapl1 KO T cells (Fig. 7d). These results further suggest that Dapl1 regulates Tim3 expression through controlling NFATc2 activation.
Fig. 7. Dapl1-mediated NFATc2 inhibition contributes to regulation of Havcr2 expression and CD8 T cell functions.
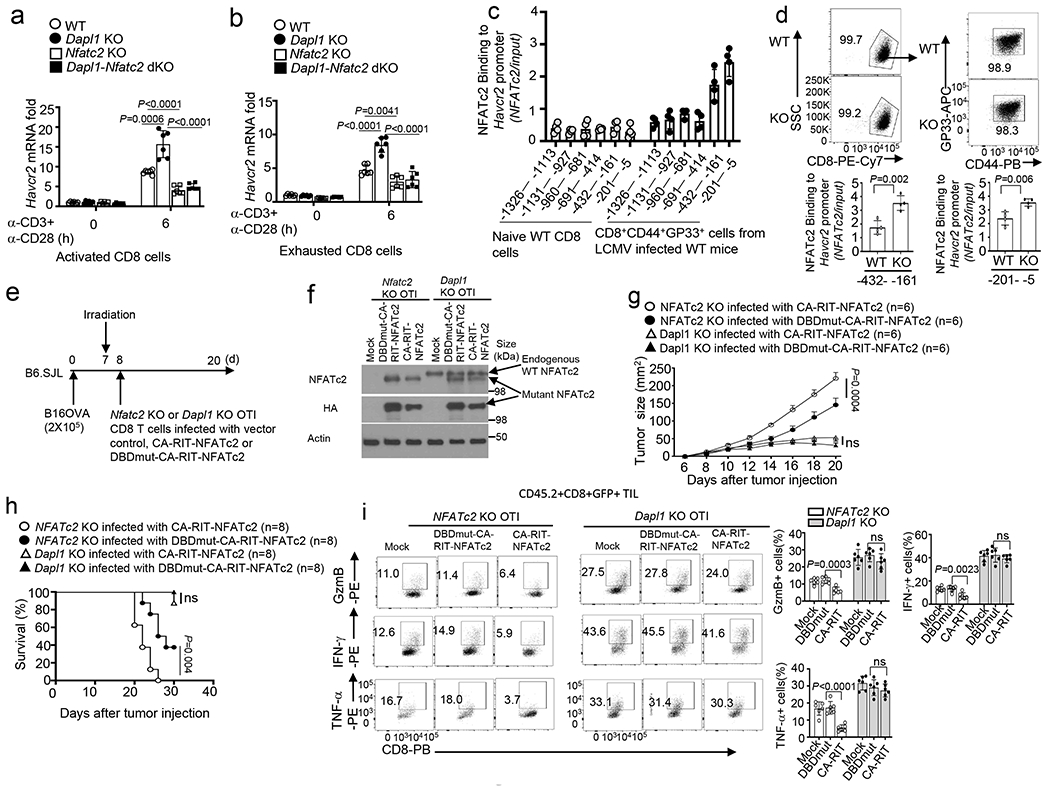
a,b, qRT-PCR analysis of Havcr2 mRNA in activated CD8 T cells (a) or in vitro exhausted CD8 T cells (b) from the indicated mouse strains, stimulated for 6 h with anti-CD3 and anti-CD28. n =6 per genotype. c, ChIP assay of the recruitment of NFATc2 to various regions of the Havcr2 promoter in naive CD8 T cells from uninfected wildtype mice or CD8+CD44+GP33+ cells from LCMV clone 13-infected (for 4 weeks) mice. n =4 per genotype. d, ChIP assays of the binding of NFATc2 to the indicated regions of Havcr2 promoter in CD8+CD44+GP33+ cells derived from wildtype or Dapl1 KO mice infected with LCMV clone 13 for 4 weeks. n =4 per genotype. e,f, Schematic of experimental design (e) and immunoblot analysis of endogenous wildtype NFATc2 and transduced HA-tagged NFATc2 mutants in Nfatc2 KO or Dapl1 KO CD8 T cells infected with vector control (Mock), CA-RIT-NFATc2 or DBDmut-CA-RIT-NFATc2 (f), n = 2 biologically independent experiments. g-i,Tumor growth curve (g), mouse survival plot (h), and flow cytometry analysis of the frequency of IFN-γ-, TNF-α- and Granzyme B-producing CD8 T cells in the tumor (i) of B16-OVA tumor-bearing B6.SJL mice adoptively transferred with the indicated OTI effector CD8 T cells depicted in e. n = 6 (g,i) or n = 8 (h) per genotype. Data are pooled from two independent experiments (e-i), Summary data are shown as the mean±s.d. with P values determined using a two-tailed unpaired Student’s t-test (a,b,d,i), two-sided log-rank Mantel–Cox tests (h) and two-way ANOVA with Bonferroni correction (g). ns, not significant.
A prior study demonstrates that overexpression of a constitutively active NFATc2 mutant defective in AP-1 binding, CA-RIT-NFATc2, induces CD8 T cell exhaustion and inhibits antitumor immunity18. Consistently, expression of CA-RIT-NFATc2 in NFATc2 KO OTI CD8 T cells reduced their antitumor function, as compared to the cells overexpressing a control NFATc2 mutant defective in DNA binding, DBDmut-CARIT-NFATc2 (Fig. 7e–h). However, overexpression of CA-RIT-NFATc2 in Dapl1 KO OTI CD8 T cells only moderately reduced their antitumor function and effector TIL generation (Fig. 7f–i). These results suggest that the exhausting form of NFATc2 could not override the activation-function of the wildtype NFATc2 in Dapl1-deficient CD8 T cells.
Exhausted CD8 T cells display attenuated NFATc2 activation
NFATc2 mediates both effector function and ICR expression in T cells, but its role in regulating the functionality of TEX cells is unclear41. We first examined NFATc2 activation, based on its nuclear translocation, in sorted progenitor (PD1−Tim3−) and exhausted (PD1+Tim3+) CD8 TILs (Extended Data Fig. 9a,b). Interestingly, while NFATc2 was efficiently activated by ionomycin in progenitor CD8 TILs, the NFATc2 activation was severely attenuated in exhausted CD8 TILs, and this signaling defect was largely, although not completely, rescued in the Dapl1 KO exhausted CD8 TILs (Fig. 8a). Enhanced NFATc2 activation was also observed in ionomycin-stimulated Dapl1 KO progenitor CD8 TILs (Extended Data Fig. 9c). Although less severely, NFATc1 activation was also attenuated in exhausted CD8 TILs; however, this defect was not rescued by Dapl1 deficiency (Extended Data Fig. 9d,e). Similar results were obtained with progenitor and exhausted CD8 T cells prepared from LCMV clone 13-infected mice (Fig. 8b and Extended Data Fig. 9f–j). Furthermore, ectopic expression of Dapl1 in Dapl1 KO TEX and TPro Pmel1 CD8 TILs inhibited activation of NFATc2 but not NFATc1 (Fig. 8c and Extended Data Fig. 9k,l). Finally, Dapl1 knockdown rescued NFATc2 activation in human CD8 TEX cells (Extended Data Fig. 9m). These results emphasize the role of Dapl1 in regulating NFATc2 activation in CD8 T cells.
Fig. 8. Exhausted CD8 T cells display suppressed NFATc2 activation, which can be rescued by Dapl1 deletion or Tim3 blockade.
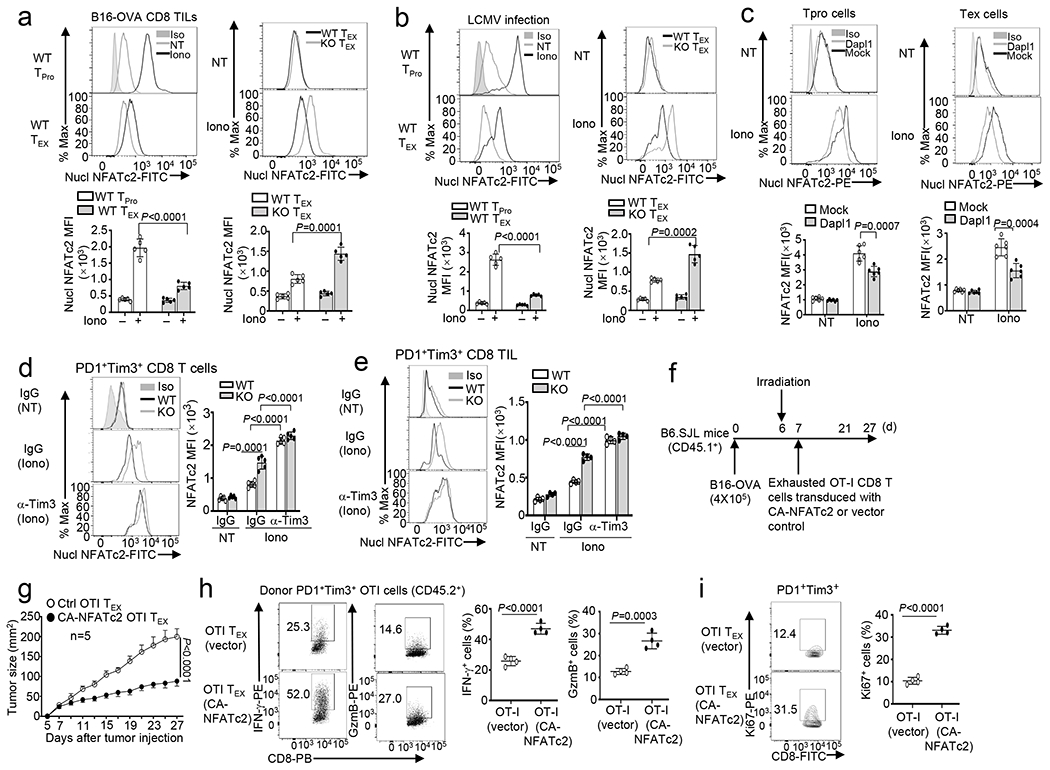
a,b, Flow cytometry analysis of nuclear NFATc2 in PD1− Tim3− progenitor (TPro) or PD1+Tim3+ CD8 TEX cells isolated from the tumors of B16-OVA-bearing wildtype (WT) or Dapl1 KO mice (a) or LCMV clone 13-infected wildtype or Dapl1 KO mice (b), either not treated (NT) or stimulated with ionomycin (Iono) for 30 min. n =5 per genotype. c, Flow cytometric analysis of nuclear NFATc2 in untreated (NT) or ionomycin-stimulated (Iono, 30 min) PD1+Tim3+ TEX and PD1−Tim3− progenitor (TPro) CD8 TILs derived from the tumor of B16F10-implanted B6.SJL mice (CD45.1+) adoptively transferred with vector- or Dapl1-transduced Dapl1 KO Pmel1 CD8 T cells (CD45.2+) as defined in Extended Data Fig. 2k–l. n =6 per genotype. d,e, Flow cytometry analysis of nuclear NFATc2 in PD1+Tim3+ exhausted CD8 T cells sorted from the spleen of wildtype or Dapl1 KO mice infected with LCMV clone 13 for 30 days and injected i.p. with anti-Tim3 (100 μg/mouse) or IgG isotype control every 3 days (d) or sorted from the tumor of B16-OVA-bearing wildtype or Dapl1 KO mice injected with anti-Tim3 (200 μg/mouse) or isotype IgG control on days 7, 9, and 11 (e). The cells were either not treated (NT) or stimulated with ionomycin (Iono) for 30 min. n =5 per genotype (d) or n =4 per genotype (e). f-i, Schematic of experimental design (f), tumor growth curve (g) and flow cytometry analysis of the frequency of IFN-γ- or granzyme B-producing cells (h) or Ki67+ proliferating cells (i) within the gated PD1+Tim3+ OT-I CD8 T cell population (CD45.2+) in the tumor of B16-OVA-bearing B6.SJL mice (CD45.1+) adoptively transferred with in vitro exhausted OT-I CD8 T cells transduced with either an empty vector or CA-NFATc2. n=5 (g) or 4 (h,i) per genotype. Data are representative of three independent experiments. Summary data are shown as the mean ± s.d. with P values determined using a two-tailed unpaired Student’s t-test (a-e, h,i) and two-way ANOVA with Bonferroni correction (g).
Since NFATc2 mediates Tim3 expression (Fig. 6g), we tested the possible involvement of Tim3 in a feedback inhibition of NFATc2 activation. We treated LCMV clone 13-infected mice with a Tim3-blocking antibody. Anti-Tim3 treatment efficiently improved NFATc2 activation in wildtype cells and eliminated the differences between wildtype and Dapl1 KO cells (Fig. 8d). Anti-Tim3 treatment of tumor-bearing mice also rescued the NFATc2 activation in wildtype PD1+Tim3+ CD8 TEX TILs and eliminated the differences between wildtype and Dapl1 KO cells (Fig. 8e). Tim3 blockade also further increased the nuclear expression of NFATc2 in Dapl1 KO CD8 T cells, suggesting that Dapl1 deletion could partially release Tim3-mediated NFATc2 suppression (Fig. 8d,e and Extended Data Fig. 9n). Tim3 blockade also enhanced NFATc1 activation in PD1+Tim3+ CD8 TILs (Extended Data Fig. 9o,p). These results suggest that Tim3 suppresses the activation of both NFATc2 and NFATc1, although Dapl1 deletion selectively rescues the activation of NFATc2.
Since both Dapl1 deficiency and Tim3 blockade could promote antitumor CD8 T cell responses (Fig. 2i and Extended Data Fig. 2o), it suggested the possibility that elevating NFATc2 activation might improve the functionality of CD8 TEX cells. To test this possibility, we transduced wildtype OT-I CD8 T cells with an empty vector or a constitutively active NFATc2 (CA-NFATc2). Following in vitro exhaustion induction, these cells were adoptively transferred into B16-OVA melanoma-bearing B6.SJL mice (Fig. 8f). Compared to the control OT-I CD8 T cells, the CA-NFATc2-expressing OT-I CD8 T cells caused much more potent and sustained tumor suppression (Fig. 8g). CA-NFATc2 expression greatly increased effector molecule (IFNγ and granzyme B) production and proliferation of the PD1+Tim3+ exhausted CD8 TILs (Fig. 8h,i). Together, these results suggest that Dapl1 deletion and Tim3 blockade could rescue the defect of NFAT activation in CD8 TEX cells, which in turn contributes to the increased functionality of exhausted CD8 T cells.
Discussion
In this paper, we report the identification of Dapl1 as a critical regulator of CD8 T cells. Dapl1 not only controls the activation and effector function of CD8 T cells but also regulates CD8 T cell exhaustion in chronic viral infections and cancer. Our data suggest that Dapl1 exerts these functions through negative regulation of the transcription factor NFATc2.
CD8 TILs are heterogenous, consisting subpopulations with hallmarks of memory- or progenitor-like, effector-like, transitional, and dysfunctional (exhausted) T cells10, 42. Our study suggest a role for Dapl1 in regulating the dynamics of CD8 TIL subpopulations. Dapl1 deletion expands CD8 TILs displaying transcriptomic features of both effector and memory T cells. While controlling effector memory-like CD8 TIL expansion may be an important mechanism by which Dapl1 regulates antitumor CD8 T cell responses, Dapl1 also plays a role in regulating CD8 TEX cells. Dapl1 deletion promotes the expansion of Tim3+ exhausted CD8 TILs and concomitantly reduces the frequency of Tim3− exhausted CD8 TILs. Interestingly, the Tim3+ CD8 TILs expanded in Dapl1 KO mice represent a subpopulation of TCF1+PD1+Tim3+ CD8 T cells, which was also markedly expanded in the spleen of LCMV clone 13-infected Dapl1 KO mice. Of note, TCF1 is a transcription factor that mediates the renewal, expansion, and effector function of exhausted CD8 T cells9,12,15,29–31,43. This result is consistent with the finding that Dapl1 deletion improves the functionality of exhausted CD8 T cells.
Induction of T cell exhaustion is associated with expression of ICRs, particularly PD1 and Tim344, but the mechanism underlying the dysfunction of TEX cells is not well understood. Our data suggest that Dapl1 regulates a pathway contributing to the dysfunction of exhausted CD8 T cells. Although Dapl1 deficiency promotes Tim3 expression, the Dapl1-deficient PD1+Tim3+ CD8 T cells display a much higher level of proliferative ability and effector function than their wildtype counterparts. In ACT, Dapl1-deficient CD8 TEX cells efficiently suppressed tumor growth, whereas the wildtype CD8 TEX cells were ineffective. The function of Dapl1 in CD8 T cell regulation is to a large extent mediated through controlling NFATc2 activation.
NFAT mediates both effector function and ICR expression in T cells41. However, since NFAT family members have redundant functions, it is unclear whether hyper activation of a specific NFAT member contributes to effector function or exhaustion of CD8 T cells. Our present work demonstrates that NFATc2 hyper-activation in Dapl1 KO CD8 T cells promotes CD8 T cell immunity under both acute and chronic conditions. NFATc2 deficiency impaired the expression of Tim3 without affecting the expression of various other ICRs. Consistently, deletion of Dapl1 promoted the expression of Tim3 but not the other ICRs. In line with a previous report18, we found that overexpression of a NFATc2 mutant defective in AP1 binding, CA-RIT-NFATc2, in Nfatc2 KO CD8 T cells inhibits CD8 T cell function in tumor suppression. However, fully functional NFATc2 appears to prevent, rather than promote, the dysfunction of exhausted CD8 T cells. First, NFATc2 activation is attenuated in exhausted CD8 T cells and can be rescued by Dapl1 deletion and Tim3 blockade, both of which strongly improve the functionality of exhausted CD8 T cells. Second, expression of a constitutively active functional NFATc2, CA-NFATc2, improves the functionality of exhausted CD8 TILs. Our findings also suggest a potential mechanism of NFATc2 regulation in exhausted CD8 T cells. Since Tim3 blockade completely restores NFATc2 activation, one intriguing possibility is that Tim3 provides a feedback mechanism of NFATc2 inhibition, which could be partially overcome by Dapl1 deletion.
In conclusion, this work establishes Dapl1 as a pivotal regulator of CD8 T cell responses and reveals a mechanism regulating CD8 T cell function in antitumor immunity. Dapl1 deletion promotes expansion of effector memory CD8 T cells and increases the functionality of CD8 TEX cells and also improves responses to ICR inhibitors. These findings suggest that targeting Dapl1 is a potential approach to induce antitumor CD8 T cell responses and reinvigorate exhausted CD8 T cells in cancer treatment.
Methods
The research conducted in this study complies with all of the relevant ethical regulations. All animal experiments were conducted in accordance with protocols (00001177-RN02) approved by the Institutional Animal Care and Use Committee of the University of Texas MD Anderson Cancer Center.
Mice.
Dapl1 KO mice were generated (in C57BL/6 background) using CRISPR-Cas9, involving introduction of a stop codon (taa) and an EcoRI restriction site (gaattc) to the 3’ boundary of exon 3. A guided RNA (gRNA), GATGCTCTGACGGACACACTGG, and a donor oligo, 5’- AGTGCCATCACAAATGTCGCCAAGATACAGATGTTGGATGCTCTGACGGACACACT GtaagaattcGACAAGGTGAGCCATGCCCGAGGCAACGCAGACGACACTCTAGCTCTGTC TTTA-3’ (ordered from Sigma-Aldrich) were used for Dapl1 KO mouse generation in the Genetically Engineered Mouse Facility of The University of Texas MD Anderson Cancer Center. To eliminate possible off-target effect, the Dapl1 KO mice were backcrossed to C57BL/6 background for six generations. Nfatc2 KO mice (Nfatc2tm1Rao/Mmnc, cat# 000197-UNC), generated in a C57BL/6 × 129 mixed genetic background and backcrossed to C57BL/6 background for five generations, were purchased from Mutant Mouse Resource & Research Centers (MMRRC). Dapl1 KO mice were crossed with Nfatc2 KO mice to generate age-matched Dapl1 WT, Dapl1 KO, Nfatc2 KO and Dapl1-Nfatc2 double KO (dKO) mice. B6.SJL mice (expressing the CD45.1 congenic marker), Rag1 KO mice, and the OT-I and Pmel1 TCR–transgenic mice (all on C57BL/6 background) were from The Jackson Laboratory. Dapl1 KO mice were crossed with Pmel1 mice or OT-I mice to generate Dapl1 KO Pmel1 or Dapl1 KO OT-I mice. Experiments were performed with young adult (6- to 8-week-old) female and male mice. All mice were maintained in a specific- pathogen-free facility of the University of Texas MD Anderson Cancer Center with 12h dark/12h light cycles, at 70-74 °F and 40–60% humidity with water and food provided, and all animal experiments were conducted in accordance with protocols approved by the Institutional Animal Care and Use Committee of the University of Texas MD Anderson Cancer Center.
Plasmids.
pPRIPuEGFP-Dapl1 were generated by inserting the mouse Dapl1 cDNA into the pPRIPuEGFP retroviral vector. pCLXSN(GFP)-HA-Dapl1 was generated by inserting the mouse Dapl1 cDNA, along with an N-terminal HA tag, into the pCLXSN(GFP) retroviral vector. pLIRES-EGFP-CA-NFATc2 and pLIRES-EGFP-CA-NFATc1 were provided by Joao P.B. Viola (Brazilian National Cancer Institute). CA-RIT-NFATc2(cat# 85181) and DBDmut-CAT-RIT-NFATc2(cat# 63669) were obtained from Addgene.
Antibodies and reagents.
Antibody for Dapl1 (Cat#PA5-49251, 1:1000) was from Invitrogen. Antibodies for NFATc2(Cat#5861, 1:1000), NFATc1(Cat#8032, 1:1000), α-Tubulin (Cat#2144, 1:2000), β-Actin (Cat#3700, 1:2000), phospho-Akt Ser473 (Cat#9271, 1:1000), Phospho-p70 S6K Thr389 (Cat#9206, 1:1000), AKT (Cat#9272, 1:1000), NF-κB p65 (Cat#8242, 1:1000), phospho-NF-κB p65 Ser536 (Cat#3033, 1:1000), IκBα (Cat#4814, 1:1000), phospho-IκBα Ser32/36 (Cat#9246, 1:1000), phospho-ERK Thr202/Tyr 204 (Cat#4370, 1:1000), phospho-p38 Thr180/Tyr182(Cat#9211, 1:1000), c-Rel (Cat#12707, 1:1000), p105/p50 (Cat#13586, 1:1000), c-Fos (Cat#2250, 1:1000) and c-Jun (Cat#9165, 1:1000) were from Cell Signaling Technology. Antibodies for NFATc3 (Cat#sc-8405, 1:1000), Lamin B (Cat#sc-6216, 1:1000) and GFP (Cat#sc-9996, 1:1000) were from Santa Cruz Biotechnology. Anti-HA (Cat#11583816001, 1:5000) and horseradish peroxidase- conjugated anti-HA (Cat#12013819001, 1:1000) were purchased from Roche. Horseradish Peroxidase- conjugated secondary antibodies, including donkey anti-mouse IgG (Cat#715-035-151, 1:10,000), goat anti-mouse IgG light chain (Cat#115-035-174, 1:2000), donkey anti-rabbit IgG (Cat#711-035-152, 1:10,000), and mouse anti-rabbit IgG light chain (Cat#211-032-171, 1:2000), were purchased from Jackson ImmunoResearch.
Functional-grade anti-mouse (m) CD3ε (Cat#16-0031-86, clone 145-2C11, 1:1000), anti-mCD28 (Cat#16-0281-86, clone 37.51, 1:1000), anti-human CD3 (Cat#16-0037-85, clone OKT3, 1:1000) and anti-human CD28 (Cat#16-0289-85, clone CD28.2, 1:1000) were from eBioscience.
Fluorescence-labeled antibodies for murine CD4 (L3T4), CD8 (53-6.7), CD44 (IM7), CD62L(MEL-14), IFN-γ (XMG1.2), CD45.1 (A20), CD45.2 (104), CD279 (PD1) (clone J43), CD3 (145-2C11), CXCR3 (CXCR3-173), T-bet (4B10), Granzyme B (NGZB), TNF-α (MP6-XT22), CTLA4 (14D3), murine CD366 (Tim3) (clone 8B.2C12) CD223 (Lag3) (clone C9B7W), TOX (TXRX10) and IL-2 (JES6-SH4) as well as human CD366 (Tim3) (F38-2E2) were from eBioscience. Fluorescence-labeled antibodies for human CD8 (SK1), IFN-γ (4S.B3), IL-2(MQ1-17H12), PD1(A17188B), murine CD366 (Tim3) (clone RMT3-23), murine CD223 (Lag3) (clone C9B7W), murine TIGIT (1G9), murine Ly6c (HK1.4), murine CCR2 (SA203G11), murine Ly108 (330-AJ), murine CX3CR1 (SA011F11) and NFATc1(7A6) were from Biolegend. Fluorescence-labeled antibodies for TCF1/TCF7(S33-966), BATF (S39-1060), IRF4 (Q9-343), Ki67(B56) and FITC Annexin V apoptosis detection kit (556547) were from BD Bioscience. Fluorescence-labeled anti- NFATc2 (D43B1, 14324) was from Cell Signaling Technology. Fluorescence-labeled H2Kb/OVA257-264 tetramer and H2Db/GP33-41 tetramer were provided by the NIH Tetramer Core Facility.
Monensin (00-4505-51) was obtained from eBioscience. CellTrace CFSE Cell Proliferation kit (C34554) was from Invitrogen. PMA (P1585) and ionomycin (I0634) were from Sigma-Aldrich. The calcineurin inhibitor, FK506 (tlrl-fk5), was purchased from InVivoGen, and the LCMV GP33-41 peptide (KAVYNFATM) was purchased from Anaspec. The ELISA reagents for mouse IL-2 and IFN-γ were from eBioscience.
Flow cytometry and intracellular cytokine staining (ICS).
Suspensions of thymocytes, lymph- node cells and splenocytes were prepared as described45. Cells were stained with the indicated fluorescence-conjugated antibodies and subjected to flow cytometry analysis and cell sorting as previously described45, 46 using FACS Fortessa and FACS Aria (BD Biosciences). For intracellular cytokine staining assays, T cells isolated from the spleen, draining lymph nodes or tumors of mice or from in vitro cultures were stimulated for 5 h with PMA (50 ng/ml) and ionomycin (500 ng/ml) in the presence of monensin (10 μg/ml) during the last 2 hours, and then subjected to ICS and flow cytometry analyses. The data were analyzed using FlowJo software. The gating strategies were shown in Extended Data Fig. 10.
Flow cytometry analysis of nuclear NFAT.
Nuclei of T cells were isolated using a protocol adapted from a previous report47. In brief, the indicated T cell populations were sorted from LCMV clone 13-infected, or B16-OVA-bearing mice and either not treated or stimulated with ionomycin for 30 min. The stimulated cells were spun down and resuspended with 500 μl of Buffer A containing 320 mM sucrose, 10 mM HEPES, 8 mM MgCl2, a protease inhibitor cocktail and 0.1% (v/v) Triton X-100. After 15 min incubation on ice, the lysed cells were centrifuged to collect the nuclei, and the nuclear pellet was washed twice with buffer A (without Triton X-100) and fixed in 3% formaldehyde. The fixed nuclei were permeabilized with 0.3% Triton X-100 in PBS plus 2% FBS and stained with fluorescence-labeled antibodies for NFATc1 or NFATc2 or primary antibodies for NFATc1 or NFATc2, followed by fluorescence-labeled secondary antibody and subjected to flow cytometry analysis.
Cell culture, viral transduction and overexpression.
The HEK293T, Jurkat, B16F10, MC38 and B16-OVA were from ATCC. LMCV GP33 minigene was generated by cloning epitope (M-KAVYNFATM) lentivirus vector of pLOC CMV-IRES-tGFPnuc-blasticidin. The resulting plasmid were used to infected murine melanoma cell line B16F10 to get B16F10 LCMV mini stable expressed cell line. For gene silencing, lentiviral particles were prepared by transfecting HEK293T cells with pGIPZ lentiviral vectors encoding specific shRNAs or control shRNAs along with packaging plasmids. The packaged lentiviruses were then used to infect the indicated cells, and the infected cells were enriched by flow cytometric cell sorting based on GFP expression (GFP is expressed by the pGIPZ vector). To transduce primary T cells, naive OT-I CD8+ or Pmel1 CD8+T cells were stimulated in 48-well plates for 24 h with plate-bound anti-CD3 (1 μg/ml) plus anti-CD28 (1 μg/ml) in the presence of 10 ng/ml of mIL-15 and 5 ng/ml of mIL-2, then infected twice (at 48 and 72 h) with retroviruses. The transduced cells were enriched by flow cytometry cell sorting on the basis of GFP. For overexpression studies, the cells were infected with retroviral vectors for the indicated cDNAs.
L. monocytogenes infection.
Age- and sex-matched WT and knockout mice (6–8 weeks old) were infected intravenously with 5×10⁴ colony-forming units (CFU) of OVA-expressing recombinant L. monocytogenes (LM-OVA). Seven days after infection, the mice were sacrificed for analysis of OVA-specific CD8 effector T cells and LLO-specific CD4 effector T cells in the spleen using the MHC I-restricted OVA257-264 peptide (SIINFEKL, Genemed Synthesis) and the MHC II- restricted LLO190-201 peptide (NEKYAQAYPNVS, Genemed Synthesis).
LCMV infection.
Age- and sex-matched wildtype and knockout mice (6–8 weeks old) mice were infected intravenously with 2 × 10⁶ plaque-forming units of LCMV clone 13 (provided by E. John Wherry, University of Pennsylvania). Thirty days after infection, mice were euthanized for the analysis of antigen-specific CD8 T cells in the spleen. In brief, splenocytes were stimulated with 3 μg/ml of LCMV GP33-41 peptide (KAVYNFATM; AnaSpec) for 6 h with monensin added during the last 2 hours. Cells were then subjected to staining of intracellular IFN-γ, IL-2, TNF-α and Granzyme B and flow cytometry analysis. To determine the virus titration in infected mice, spleen was collected and homogenized. The spleen homogenates were serially diluted and quantitated by plaque assay on Vero cell monolayers as previously described48. In brief, Vero cells were plated in 6 well tissue culture plates and incubated overnight. Vero cells were then incubated with 10-fold dilutions of spleen lysates for 1 hour. The supernatant was aspirated and replaced with 4ml of 0.5% agarose in complete Medium 199. The plates were then incubated for 5 days and stained with 2ml of 0.5% agarose in complete Medium 199 containing 0.01% neutral red for overnight. Plaques were visually counted the next day.
Tumor models.
Age- and sex-matched wildtype and Dapl1 KO mice were injected subcutaneously with 2 × 10⁵ B16-OVA or B16F10 murine melanoma cells or with 5 × 10⁵ MC38 colon cancer cells and monitored for tumor growth and survival. In some of the experiments, Age- and sex-matched wildtype and Dapl1 KO mice were administered i.p. with 100 μg anti-PD1 (Cat# BE0146, BioXcell), 200 μg anti-Tim3 (Cat# BE0115, BioXcell) or isotype control (Cat# BE0089, BioXcell) on days 7, 9, and 11. The challenged mice were monitored for tumor growth with tumor size being expressed as tumor area. For survival rate calculation, mice with a tumor size reaching 225mm2 were considered lethal and sacrificed based on the protocol approved by the Institutional Animal Care and Use Committee of the University of Texas MD Anderson. At the indicated time point, all mice were euthanized for flow cytometry analysis of immune cells from both the draining lymph nodes and tumors.
ACT was performed using Pmel1 CD8 T cells recognizing the B16 melanoma antigen gp100. Splenocytes were isolated from wildtype Pmel1 or Dapl1 KO Pmel1 mice and stimulated in vitro with plate-coated anti-CD3 (1 μg/ml) and soluble anti-CD28 (1 μg/ml). The culture was provided with mIL-2 (10 ng/ml) on day 2 and CD8 T cells were purified from the culture on day 5 and used for adoptive transfer experiments. To generate tumor-bearing mice, wildtype B6 mice were injected subcutaneously with B16F10 melanoma cells, and after 4 days, the tumor-bearing mice were subjected to whole-body irradiation (500 rad, 137Cs irradiator) to induce lymphodepletion. One day after the irradiation, the mice were adoptively transferred with in vitro-activated wildtype or Dapl1 KO Pmel1 CD8+ T cells (6 × 10⁵). Control mice were not irradiated or injected with Pmel1 T cells. For adoptive transfer with exhausted CD8 T cells, day 7 B16-OVA melanoma-implanted wildtype B6.SJL mice were injected i.v. with in vitro-generated wildtype or Dapl1 KO exhausted CD8+ T cells (5 × 10⁵).
For adoptive transfer progenitor CD8 T cells, progenitor CD8 T cells (CD8+ H2Db/GP33 Tetramer+ Ly108+ Tim3−) were isolated from the spleen of wildtype or Dapl1 KO mice infected with LCMV Clone 13 (2 × 10⁶ PFU per mouse). B6.SJL mice were injected subcutaneously with B16F10 LCMV mini melanoma cells, and after 6 days, the tumor-bearing mice were subjected to whole-body irradiation. One day after the irradiation, the mice were adoptively transferred with the sorted wildtype or Dapl1 KO progenitor CD8 cells.
Mixed bone marrow chimeras.
BM cells isolated from Dapl1 KO or WT mice (CD45.2+) were mixed with BM cells from B6.SJL (CD45.1+) mice (in 1:4 ratio) and adoptively transferred into irradiated (950 rad) Rag1-KO mice. After 6 weeks, the chimeric mice were infected i.v. with LM-OVA (5 × 10⁴ CFU per mouse), LCMV clone 13 (2 × 10⁶ PFU per mouse) or injected subcutaneously with 2 × 10⁵ B16-OVA murine melanoma cells.
Progenitor and exhausted CD8 TIL cell purification.
Age- and sex-matched wildtype and Dapl1 KO mice were injected subcutaneously with 2 × 10⁵ B16-OVA melanoma cells. At the indicated time point, tumors were dissected from the surrounding fascia. Tumors were digested with collagenase IV (0.05%; Roche Applied Science) and DNase I (100 ug/ml; Roche Applied Science) at 37°C for 45 min. The cell suspensions were passed through a 70-μm nylon cell strainer to prepare single-cell suspensions and collected by centrifugation. Tumor-infiltrating leukocytes were enriched using Lymphocyte Cell Separation Medium (cat#CL5035, Cedarlane) by centrifugation (1200 × g, 30mins), followed by CD8+ MACS positive selection (Ly-2, Miltenyi). We sorted the progenitor cells and exhausted CD8 cells using a BD FACS Aria II to obtain more than 95% purity. The purified cells were used for the indicated NFAT activation experiments.
ChIP assays.
Naive CD8+ T cells were sorted from uninfected wildtype mice, CD8+ CD44+ H2Db/GP33 Tetramer+ T cells were sorted from the spleen of wildtype and Dapl1 knockout mice infected with LCMV clone 13. ChIP assay was performed using the EpiQuik ChIP Kit (cat# P-2002-03, EpiGentek). In brief, the cells were fixed with 1% formaldehyde and sonicated as previously described49. Lysates were subjected to immunoprecipitation with the NFATc2 antibody (cat# NB300-504, Novus Biologicals), and the precipitated DNA was then purified and quantified by qPCR using a pair of primers (Supplementary Table 1) that amplify the target region of the HAVCR2 promoter. The y axis is the percentage (%) of target transcript factor-binding DNA normalization for total input DNA.
Immunoblot and coIP.
T cells and other indicated cells were lysed in RIPA buffer containing 50 mM Tris–HCl (pH 7.4), 150 mM NaCl, 1% NP-40, 0.5% sodium deoxycholate, 1 mM EDTA, 1 mM dithiothreitol, 1 mM sodium orthovanadate, 5 mM sodium fluoride, 20 mM p-nitrophenyl phosphate, 1 mM phenylmethylsulfonyl fluoride, 1mg/ml pepstatin, and 1 mg/ml aprotinin. The whole-cell lysates were subjected to immunoblot and coIP assays as described50. For immunoblot analysis of phosphorylated proteins, the RIPA lysis buffer was also supplemented with phosphatase inhibitors (1 mM sodium orthovanadate, 5 mM sodium fluoride, 20 mM p-nitrophenyl phosphate). The density of the protein bands in photographic films was quantified by using the ImageJ software.
ELISA and qRT-PCR.
Supernatants of in vitro cell cultures were analyzed by ELISA using a commercial assay system (eBioScience). Total RNA was extracted with TRIzol reagent (cat#15596026, Invitrogen) from the indicated cells and subjected to qRT-PCR using SYBR reagent (cat# 1725124, Bio-Rad). Gene- specific primer sets used in this study are listed in Supplementary Table 1. Bio-Rad CFX Manager software was used for real-time PCR data acquisition and analysis.
Exhausted CD8 T cell generation in vitro.
In vitro induction of CD8 T cell exhaustion was essentially as described51. Mouse CD8 T cells were purified from wildtype OT-I or Dapl1 KO OT-I mice. For generation of exhausted CD8 T cells, OT-I CD8 T cells were cocultured with CD11b+ CD11c− monocytes and CD11b+CD11c+ dendritic cells with 5 ng/ml IL-15 and 5 ng/ml IL-7 plus 10 ng/ml OVA257–264 peptide for 48 h. The cells were washed and then subjected to daily repeated stimulations with OVA257–264 peptide in the presence of IL-15 and IL-7 for an additional 3 days. Effector CD8 cells were cocultured with monocytes and dendritic cells with IL-15 and IL-7 plus OVA257–264 peptide for 48 h following an additional three days culture without peptide. Control cells were cultured in complete medium with 5 ng/ml IL-15 and 5 ng/ml IL-7 for 5 days without adding peptide. On day five, cells were purified and used for the indicated experiments.
In vitro human CD8 T cell exhaustion was induced following a published protocol52. In brief, Buffy coats from anonymous healthy donors were purchased from Gulf Coast Regional Blood Center. Informed consent was not required for it. Human CD8 cells were sorted from Human peripheral blood mononuclear cells (PBMCs) that were isolated from Buffy coats, and cultured in RPMI 1640 medium (Gibco) supplemented with 10% human serum (Cat# 100-512, Gemini Bio), 10 mM HEPES buffer solution, 2 mM GlutaMAX, 1 mM sodium pyruvate, 5.5 mM 2-ME, 100 unit/ml penicillin, and 100 g/ml streptomycin with 50 U/ml hIL-2. CD8 T cells were stimulated in 24-well plates with T-Activator CD3/CD28 Dynabeads (cat#11131D, Thermo Fisher) following the manufacturer’s instructions. The cells were washed and restimulated with a fresh batch of Dynabeads every 48 h. After three rounds of stimulations, the exhausted human CD8 T cells were used in the indicated experiments. Unstimulated control cells were cultured in complete medium with hIL-2 (50 U/ml).
ScRNA-seq and data analysis.
Six pairs of wildtype and Dapl1 KO mice (6 weeks old) were injected subcutaneously with 2 × 10⁵ B16-OVA melanoma cells. At day 22, Tumor-infiltrating T cells were further purified from tumors. Reagents, consumables, reaction master mixes, reaction volumes, cycling numbers, cycling conditions, and clean up steps were completed following the 10X Genomics’ 3’ scRNAseq V3.1 protocol. QC steps after cDNA amplification and library preparation steps were carried out by running Thermo Fisher Qubit HS dsDNA Assay along with Agilent HS DNA Bioanalyzer for concentration and quality assessments. Equal amounts of each uniquely-indexed sample library was pooled together. The resultant pool was verified for concentration via qPCR using a KAPA Biosystems KAPA Library Quantification Kit. The pool was sequenced using a NovaSeq6000 sequencer S1 100-cycle flow cell, read depth of 50,000-100,000 reads/cell. Sample demultiplexing, barcode processing, alignment, filtering, UMI counting and aggregation of sequencing runs were performed using Cellranger analysis pipeline (v.5.0.0). Downstream analyses were performed in R using the Seurat package (v.4.0.1).
Statistical analysis.
Statistical analysis was performed using Prism software (GraphPad Software 8.0). Two-way ANOVA with Bonferroni multiple comparison test was used for B16-OVA tumor growth. Kaplan- Meier analyses was used and the log-rank Mantel-Cox test was employed to determine any statistical difference between the survival curves of two groups. Other statistical analyses were performed by two-tailed unpaired t-test. All statistical tests were justified as appropriate and data met the assumptions of the tests. All data are presented as mean ± SD. A p value <0.05 was considered significant. The number of animals used (n), and the specific statistical tests used are indicated for each experiment in the figure legends.
Extended Data
Extended Data Fig. 1. Characterization of Dapl1 expression and Dapl1 KO mice.
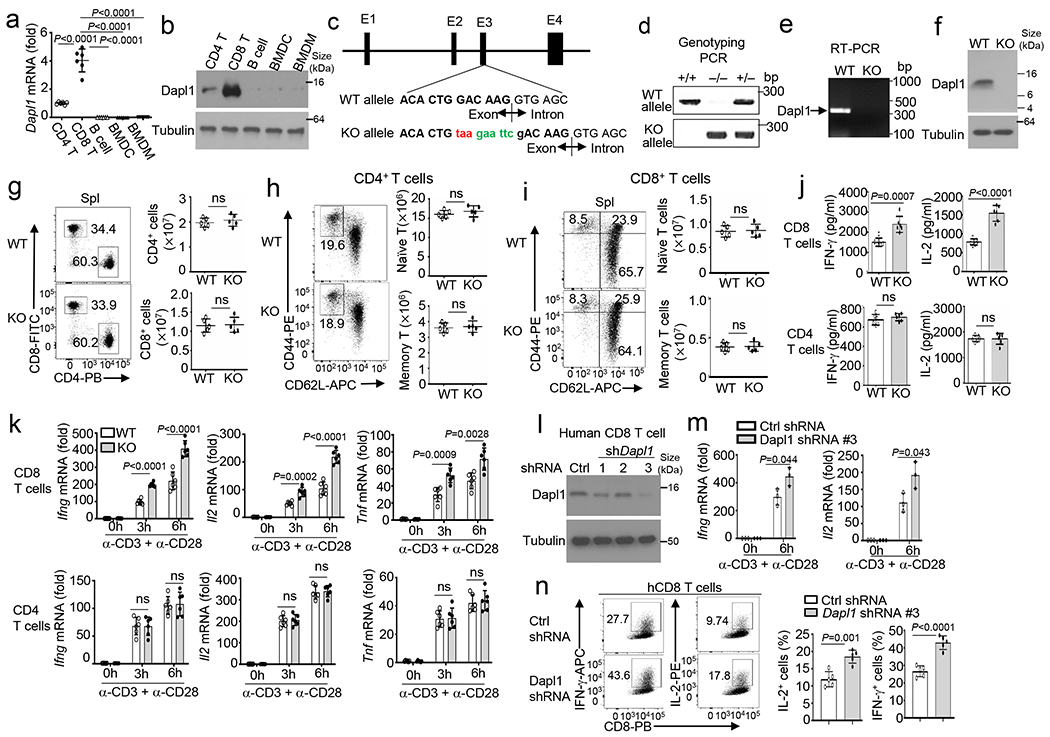
a,b, qRT-PCR (a) and immunoblot (b) analysis of Dapl1 expression in CD4 and CD8T cells, Bcells, bone marrow DCs (BMDC), and bone marrow derived macrophages (BMDM). c, Dapl1 knock out strategy using CRISPR-Cas9, indicating introduction of as top codon (taa) and an EcoRI restriction site (gaattc) to the 3’ boundary of exon3. d, Genotyping PCR using tail DNA from wildtype (WT, +/+), Dapl1 KO(−/−), and heterozygous (+/−) mice. The reverse PCR primer binds to the mutated region to distinguish WT and KO alleles. e,f, RT-PCR (e) and immunoblot (f) analysis of Dapl1 expression using WT or Dapl1 KO (KO) CD8 T cells. g-i, Flow cytometry analysis of the frequency and absolute cell numbers of CD4 and CD8 T cells (g), naive (CD44loCD62Lhi) and memory (CD44hiCD62Llo) CD4 T cells (h), and naive (CD44lo) and memory (CD44hi) CD8 T cells (i) in the spleen of wildtype (WT) or Dapl1 KO mice. Data are presented as a representative plot (left) and summary graphs (right). n =5 per genotype. j,k, ELISA analysis of secreted IL-2 and IFN-γ (j) and qRT-PCR analysis of the indicated mRNAs (k) in wildtype and Dapl1 KO naive CD8 or CD4 T cells, stimulated with anti-CD3 and anti-CD28 for 48h (j) or for the indicated timepoints (k). n=6 per genotype. l, Immunoblot analysis of Dapl1 in human CD8 T cells transduced with a control shRNA (Ctrl) or three different Dapl1 shRNAs. m,n, qRT-PCR analysis of IFNG and IL2 mRNAs (m) and flow cytometry analysis of intracellular IFN-γ and IL-2 proteins (n) in human CD8 T cells transduced with control or Dapl1 shRNA (#3) and stimulated with anti-CD3 plus anti-CD28 for the indicated timepoints (m) or 48h (n). Data are pooled from two independent experiments. Summary data are shown as the mean±s.d. with P values determined using a two-tailed unpaired Student’s t-test (a, g-k, m, n). ns, not significant.
Extended Data Fig. 2. Dapl1 deficiency promotes antitumor responses and Tim3 expression in CD8, but not CD4, T cells.
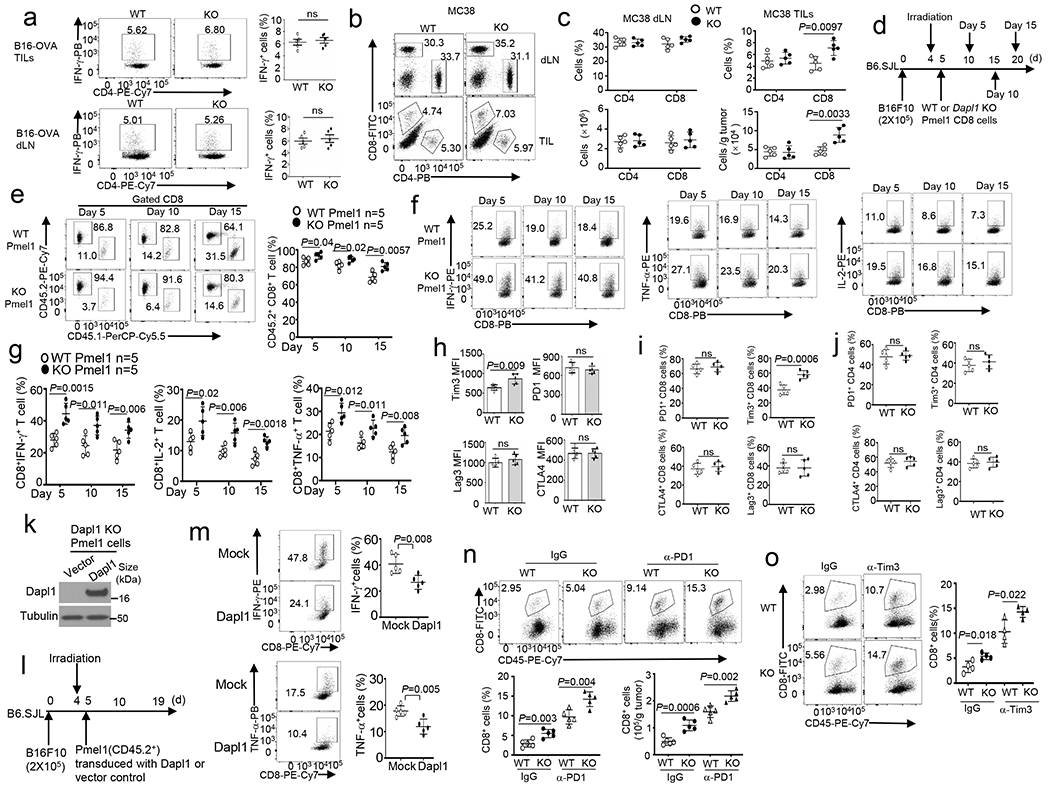
a, Flow cytometry analysis of the frequency of IFN-γ-producing CD4 T cells in the tumor (upper) and draining lymphnodes (dLN, lower) of wildtype (WT) or Dapl1 KO (KO) mice injected subcutaneously with B16-OVA for 20 days. n =5 per genotype. b,c, Flow cytometry analysis of the frequency and absolute cell number of CD4 and CD8 T cells in draining lymphnodes and tumors (TILs) of MC38 colon cancer cell-implanted wildtype or Dapl1 KO mice. n=5 per genotype. d-g, Schematic of experimental design (d), flow cytometry analysis of the frequency of donor Pmel1 CD8 T cells (CD45.2+) and host CD8 T cells (CD45.1+) (e) and donor (CD45.2+) IFN-γ-, IL-2- or TNF-α-producing Pmel1 CD8 T cells (f,g) in the tumor of B16F10-implanted B6.SJL mice (CD45.1+) adoptively transferred with in vitro activated wildtype or Dapl1 KO Pmel1 (CD45.2+) CD8 T cells (collected on day 5, 10 and 15 after Pmel1 cells transfer). n =5 per genotype. h, Flow cytometry analysis of Tim3, PD-1, CTLA4 or Lag3 expression levels in CD8T ILs of wildtype (WT) or Dapl1 KO mice implanted with B16-OVA for 20 days. n=5 per genotype. i,j, Flow cytometry analysis of the frequency of PD-1+, Tim3+, CTLA4+ or Lag3+ CD8 (i) or CD4 TILs (j) in wildtype or Dapl1 KO mice implanted with MC38 colon cancer cells for 24 days. n=5 per genotype. k-m, Immunoblot analysis of Dapl1 expression in Dapl1 KO Pmel1 CD8 T cells transduced with either an empty vector or HA-Dapl1 expression vector (k), schematic of experimental design for a doptive transfer of the transduced Dapl1 KO Pmel1 cells (CD45.2+) into B16F10-implanted B6.SJL mice (CD45.1+) (l), and flow cytometry analysis of the frequency of IFN-γ- and TNF-α-producing CD8 T cells in the tumor (m). n =5 per genotype. n,o, Flow cytometry analysis of the frequency and absolute cell numbers of CD8 TILs in day-24 B16-OVA-implanted wildtype and Dapl1 KO mice injected i.p. with anti-PD-1 (100 μg/mouse) or an IgG isotype control (n) or anti-Tim3 (200 μg/mouse) or an IgG isotype control (o) on days 7, 9, and 11, n=5 (n) or 4 (o) per genotype. Summary data are shown as the mean ± s.d. with P values determined using a two-tailed unpaired Student’s t-test (a-c, e, g-j, m-o). ns, not significant.
Extended Data Fig. 3. Kinetic analysis of Dapl1 function in regulating anti-LCMV CD8 T cell responses.
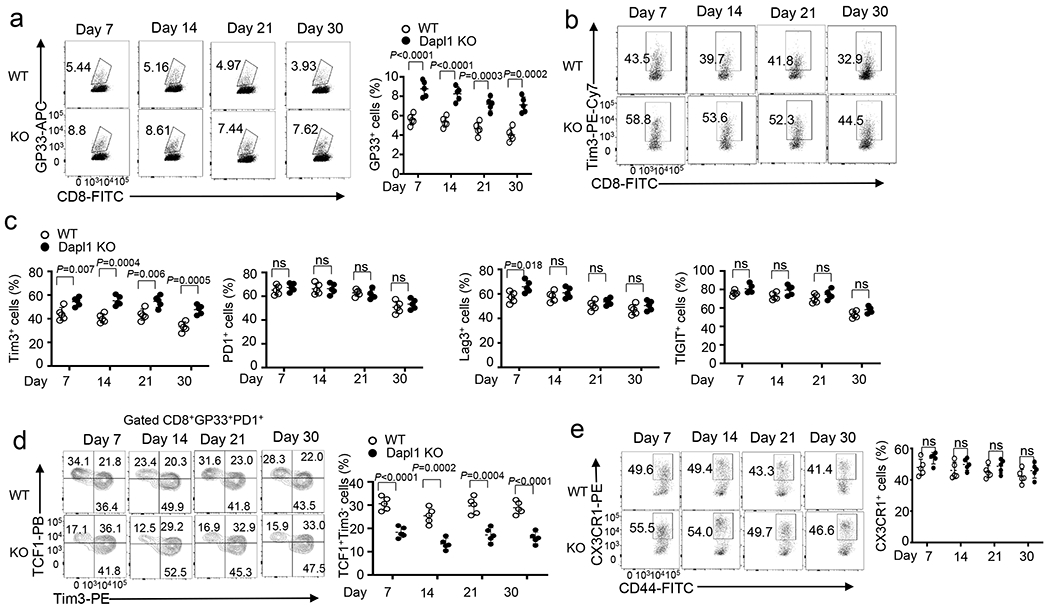
a, Flow cytometry analysis of the frequency of H2Db/gp33-41 Tetramer+ CD8 T cells in the spleen of day 7, 14, 21, and 30 LCMV clone 13-infected wildtype (WT) and Dapl1 KO mice. Data are presented as a representative FACS plot (left) and summary graph (right). n =5 per genotype. b,c, Flow cytometry analysis of the frequency of Tim3+, PD1+, Lag3+, or TIGIT+ CD8 T cells in the spleen of day 7, 14, 21, and 30 LCMV clone 13-infected wildtype and Dapl1 KO mice. Data are presented as a representative FACS plot (b) and summary graphs (c). n =5 per genotype. d,e, Flow cytometry analysis of the frequency of TCF1+Tim3−, TCF1+Tim3+ and TCF1−Tim3+ subsets in gated CD8+gp33+PD1+T cells (d) and CX3CR1+ cytotoxic effector CD8 cells in gated CD8+gp33+T cells (e) in the spleen of day 7, 14, 21, and 30 LCMV clone 13-infected wildtype and Dapl1 KO mice. Data are presented as a representative FACS plot (left) and summary graphs (right). n =5 per genotype. Data are pooled from two independent experiments. Summary data are shown as the mean±s.d. with P values determined using a two-tailed unpaired Student’s t-test (a, c-e). ns, not significant.
Extended Data Fig. 4. Characterization of in vitro generated exhausted CD8 T cells.
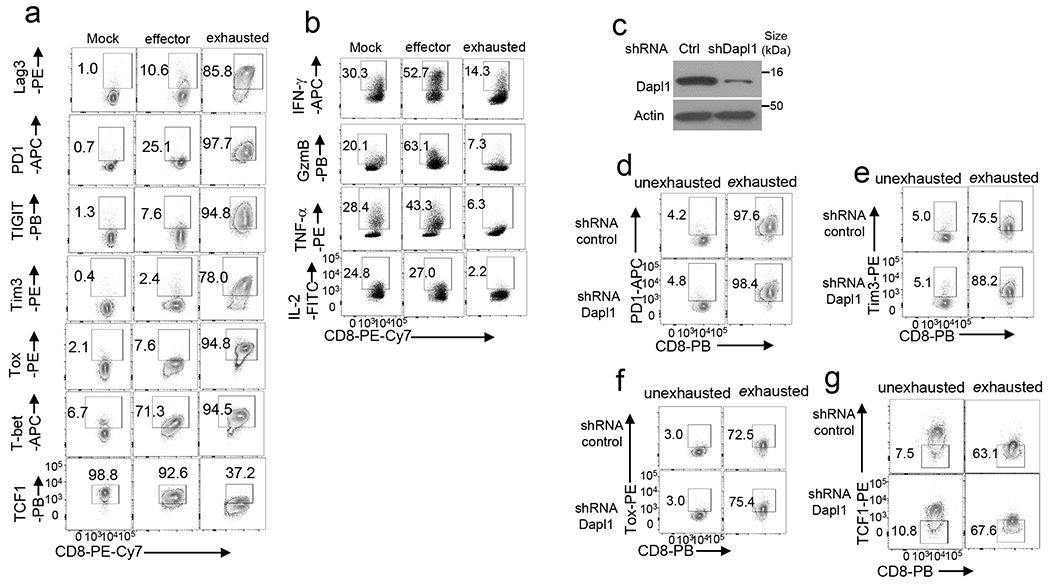
a,b, Flow cytometry analysis of the indicated ICRs, TOX, T-bet, and TCF1 (a) or effector-related molecules (b) in wildtype OT1 CD8 T cells cultured in vitro under mock or OVA257-264-stimulated effector or exhaustion conditions. c-g, Immunoblot analysis of Dapl1 knockdown (c) and flow cytometry analysis of the expression of PD1+ (d), Tim3+ (e), TOX (f), and TCF1 (g) in human CD8 T cells transduced with a control (Ctrl) shRNA or a Dapl1-specific shRNA and cultured under unexhaustion(cultured with 50 U/ml hIL-2) and exhaustion (three round of stimulation with anti-CD3/anti-CD28 Dynabeads) conditions. Data are representative of three independent experiments.
Extended Data Fig. 5. Dapl1 has a cell-intrinsic function in regulating CD8 T cell functions.
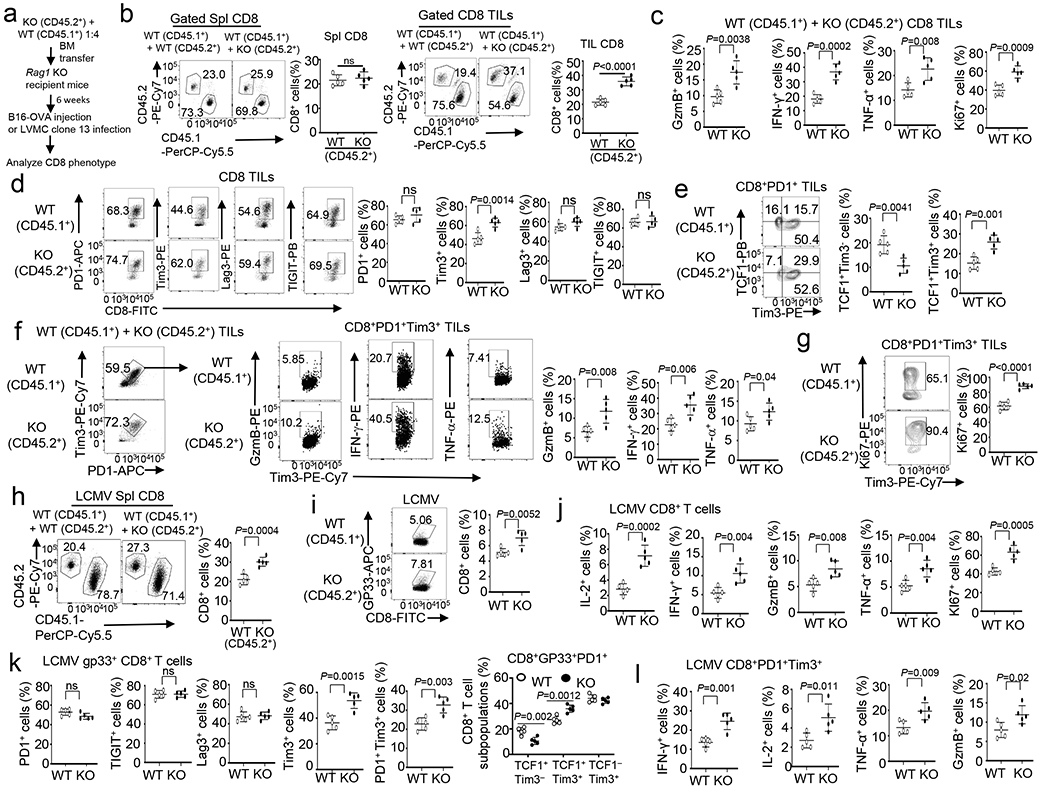
a, Schematic of experimental design. b-g Flow cytometry analysis of the frequency of splenic (Spl) or TIL CD45.1+CD8+ or CD45.2+CD8+ T cells (b), Granzyme B-, IFN-γ-, TNF-α-producing or Ki67+ CD8 TILs (c), PD1+,Tim3+, Lag3+ or TIGIT+ CD8 TILs (d), TCF1+Tim3−, TCF1+Tim3+ and TCF1−Tim3+ subsets in gated CD8+PD1+ TILs (e), Granzyme B-, IFN-γ-, TNF-α-producing cells in gated PD1+Tim3+ CD8 TILs (f), or Ki67+CD8+ cells in gated PD1+Tim3+ CD8+ TILs (g) of B16-OVA tumor-bearing Rag1 KO recipient mice adoptively transferred with a mixture of BM cells derived from B6.SJL mice (CD45.1+) and Dapl1 KO (CD45.2+) or wildtype mice (CD45.2+). Data are presented as representative FACS plots and summary graphs. n = 5 chimeric mice. h-l, Flow cytometry analysis of the frequency of CD45.1+CD8+ or CD45.2+CD8+ T cells (h), H2Db/gp33-41 Tetramer+ CD8+ T cells (i), IL-2-, IFN-γ-, Granzyme B-, TNF-α-, or Ki67+-producing CD8 T cells (j), PD1+, Tim3+, Lag3+, TIGIT+, PD1+Tim3+ CD8 T cells or TCF1+Tim3−, TCF1+Tim3+, TCF1−Tim3+ subsets (k), and IFN-γ-, IL-2-, TNF-α- or Granzyme B-producing CD8 T cells (l), gated on PD1+Tim3+ CD8+ T cells in the spleen of Rag1 KO recipient mice adoptively transferred with a mixture of BM cells derived from B6.SJL mice (CD45.1+) and Dapl1 KO (CD45.2+) or wildtype (CD45.2+) mice, infected i.v. with LCMV clone 13 for 30 days. Data are presented as representative FACS plots and summary graphs. n = 5 chimeric mice. Summary data are shown as the mean±s.d. with P values determined using a two-tailed unpaired Student’s t-test (b-l). ns, not significant.
Extended Data Fig. 6. Dapl1 has a cell-intrinsic role in regulating CD8 T cell responses to LM-OVA infection and cancer.
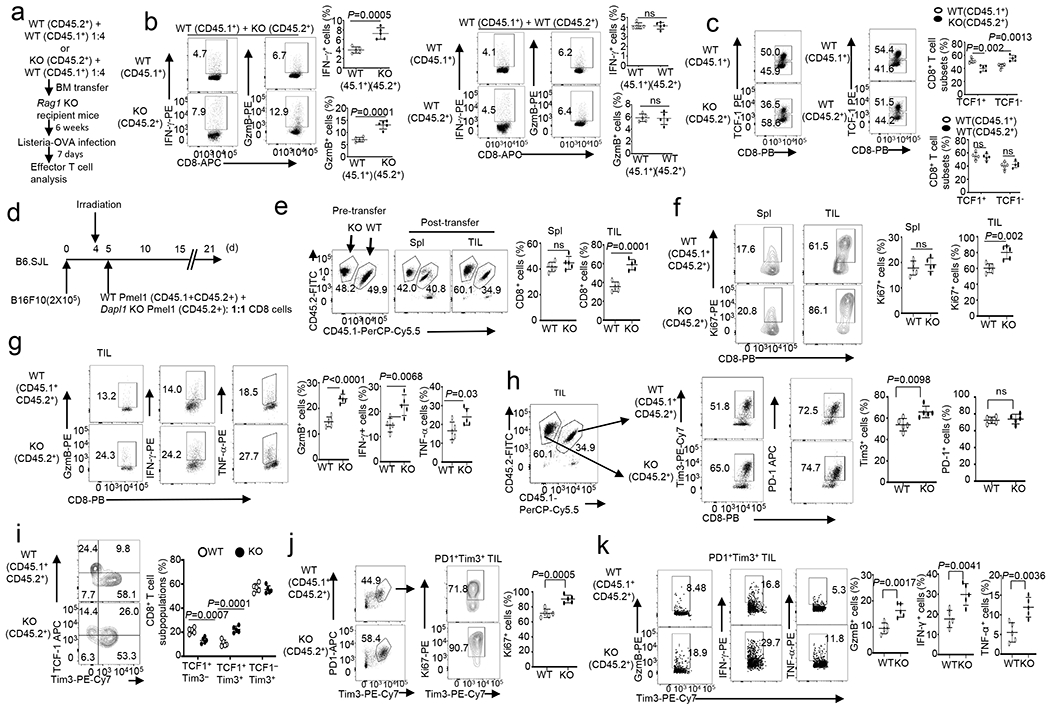
a, Schematic of experimental design for generating mixed bone marrow chimeric mice and LM-OVA infection. b,c, Flow cytometry analysis of the frequency of IFN-γ- or Granzyme B-producing CD8 effector T cells (b) and TCF1+ CD8+, TCF1− CD8+ cells (c) in the spleen of Rag1 KO recipient mice adoptively transferred (for 6 week) with a mixture of BM cells derived from B6.SJL mice (CD45.1+) and Dapl1 KO (CD45.2+) or wildtype (WT, CD45.2+) mice, infected i.v. with LM-OVA for 7 days. Data are presented as representative FACS plots and summary graphs. n = 5 chimeric mice. d-k, Schematic of experimental design (d) and flow cytometry analysis of the frequency of wildtype (CD45.1+CD45.2+) and Dapl1 KO (CD45.2+) CD8 T cells (e), Ki67+ CD8 T cells (f), effector CD8 T cells (g), Tim3+ or PD1+ CD8 T cells (h), TCF1+Tim3−, TCF1+Tim3+ and TCF1−Tim3+ subsets in gated PD1+ CD8 TILs (i), Ki67+ cells in gated PD1+Tim3+ CD8 T cells (j), and Granzyme B-, IFN-γ-, or TNF-α-producing cells in gated PD1+Tim3+ CD8 T cells (k) in the spleen (Spl) or the tumor (TIL) of B16F10 tumor-bearing B6.SJL mice (CD45.1+) adoptively transferred with a mixture (1:1) of wildtype (CD45.1+CD45.2+) and Dapl1 KO (CD45.2+) Pmel1 CD8 T cells. Data are presented as representative FACS plots and summary graphs. n =5 recipient mice. Summary data are shown as the mean ± s.d. with P values determined using a two-tailed unpaired Student’s t-test (b, c, e-k). ns, not significant.
Extended Data Fig. 7. Dapl1 regulates progenitor-like CD8 T cell proliferation and conversion to effector-like CD8 T cells.
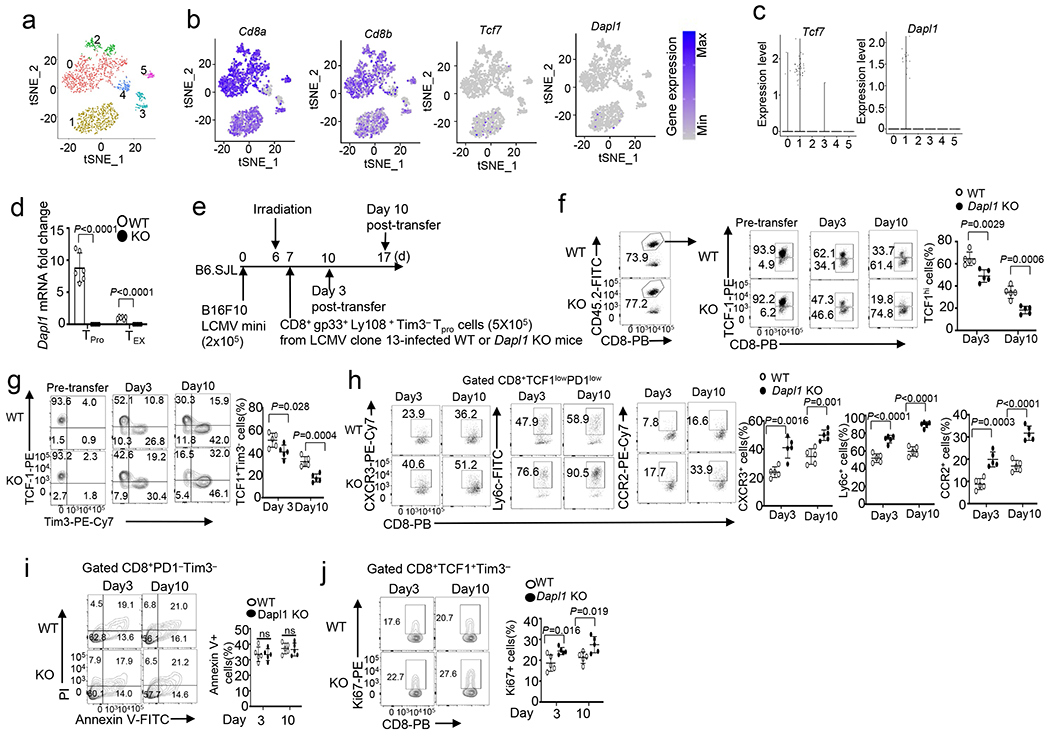
a, tSNE plot based on unsupervised clustering analysis of scRNAseq data from human uveal melanoma dataset GSE139829 showing 6 clusters of CD8 TILs. b,c, Expression profile of the indicated genes in each cluster of CD8 TILs (b) and Violin plots showing predominant expression of Tcf7 and Dapl1 in the cluster 1 progenitor population (c). d, qRT-PCR analysis of Dapl1 expression in PD1−Tim3− progenitor (TPro) or PD1+Tim3+ CD8 TEX cells isolated from LCMV clone 13-infected wildtype or Dapl1 KO mice. n = 6 per genotype. e-j, Schematic of experimental design (e) and flow cytometry analysis of the frequency of TCF1hi and TCF1+Tim3− progenitor exhausted CD8 T cells (f,g), CXCR3+, Ly6c+ or CCR2+ effect or CD8 T cells in gated PD1lowTCF1low CD8 T cells (h), apoptotic cells in gated PD1−Tim3− CD8 T cells (i), and Ki67+ proliferative cells in gated TCF1+Tim3−CD8 T cells (j) derived from the tumor of B16F10 LCMV mini tumor-bearing B6.SJL mice on day 3 and day 10 following adoptive transfer with antigen-specific progenitor CD8 T cells sorted from the spleen of LCMV clone 13-infected wildtype and Dapl1 KO mice. Data are shown as representative plots and summary graphs. n = 5 per genotype. Summary data are shown as the mean±s.d. with P values determined using a two-tailed unpaired Student’s t-test (d, f-j). ns, not significant.
Supplementary Fig. 8. NFATc2 is regulated by Dapl1 and mediates the hyper-responses of Dapl1 KO CD8T cells.
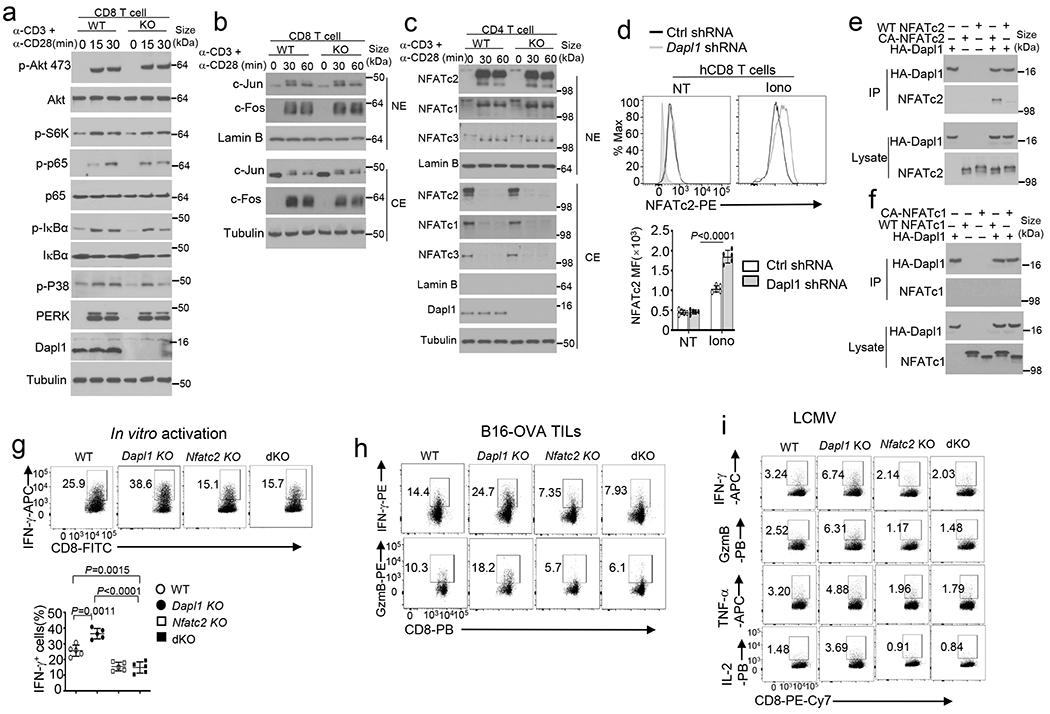
a-c, Immunoblot analysis of the indicated phosphorylated (p-) and total proteins in whole cell lysates (a) or in cytoplasmic (CE) and nuclear (NE) extracts (b,c) of wildtype (WT) or Dapl1 KO (KO) CD8 (a, b) or CD4 (c) naïve T cells stimulated with anti-CD3 plus anti-CD28 for the indicated time points. d, Flow cytometry analysis of nuclear NFATc2 in human CD8 cells transduced with a non-silencing control shRNA (Ctrl shRNA) or Dapl1-specific shRNA, either not treated (NT) or stimulated for 30 min with ionomycin (Iono). Data are presented as representative FACS plots (upper) and a summary graph (lower), n=5 biologically independent repeats. e,f, CoIP analysis of Dapl1 interaction with NFATc2 (e) or with NFATc1 (f) in 293 T cells transfected with (+) HA-Dapl1 along with (+) wildtype NFATc2 or a constitutive active NFATc2 (CA-NFATc2) (e), wildtype NFATc1 or a constitutive active NFATc1 (CA-NFATc1) (f). g, Flow cytometry analysis of intracellular IFN-γ in naive CD8 T cells from the indicated genotypes, stimulated for 48 h with anti-CD3 and anti-CD28. Data are presented as representative FACS plots (upper) and summary graphs (lower). n =5 per genotype. h, Flow cytometry analysis of IFN-γ- or granzyme B-producing CD8 T cells in the tumor of the indicated mouse strains injected subcutaneously with 2×10⁵ B16-OVA cells for 16 days. i, ICS and flow cytometry analysis of gp33-41 antigen-specific CD8 T cells producing the indicated cytokines in the spleen of LCMV clone 13-infected (for 30 days) wildtype (WT), Dapl1 KO, NFATc2 KO and Dapl1-NFATc2 double KO (dKO) mice. The splenocytes were restimulated in vitro for 6 h with gp33-41 peptide in the presence of monensin before ICS. Summary data are shown as the mean±s.d. with P values determined using a two-tailed unpaired Student’s t-test (d,g). Western blots are representative of three independent experiments (a-c, e).
Extended Data Fig. 9. Attenuated activation of NFATc2 and NFATc1 in exhausted CD8 T cells.
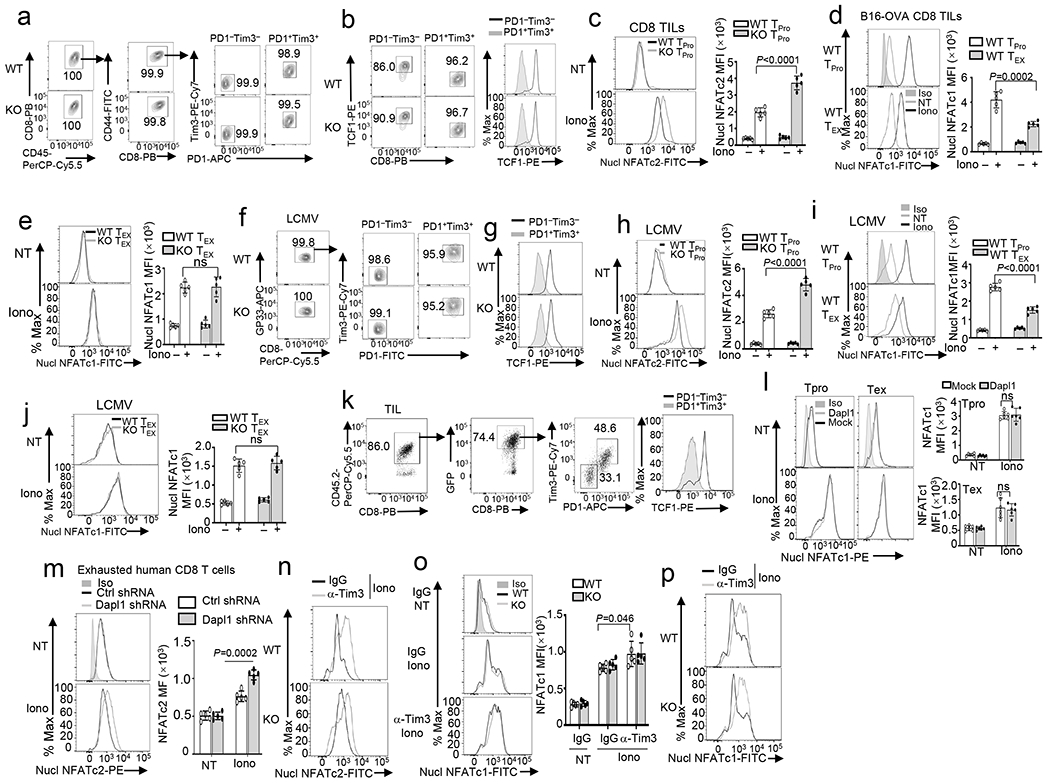
a,b Flow cytometry analysis of sorted PD1+Tim3+ exhausted (TEX) and PD1−Tim3− progenitor (TPro) CD8 TILs (a) and the expression of TCF1 (b) in PD1+Tim3+ exhausted (TEX) and PD1−Tim3− progenitor (TPro) CD8 cells derived from day 20tumor of B16-OVA tumor-bearing wildtype (WT) or Dapl1 KO (KO) mice. c-e, Flow cytometry analysis of nuclear NFATc2 (c) and NFATc1 (d,e) in wildtype and Dapl1 KO TPro CD8 TILs (c), wildtype TEX and TPro CD8 TILs (d), or wildtype and Dapl1 KO TEX CD8 TILs (e), either untreated (NT) or ionomycin-stimulated (Iono, 30 min). n =5 per genotype. f,g, Flow cytometry analysis of sorted PD1+Tim3+ exhausted (TEX) and PD1−Tim3− progenitor (TPro) CD8 T cells (f) and the expression of TCF1 (g) in PD1+Tim3+ exhausted (TEX) and PD1−Tim3− progenitor (TPro) CD8 cells from LCMV clone 13-infected wildtype or Dapl1 KO mice. h-j, Flow cytometryanalysis of nuclear NFATc2 (h) and NFATc1 (i,j) in wildtype and Dapl1 KO progenitor (TPro) CD8 T cells(h), wildtype TEX and TPro cells (i), and wildtype and Dapl1 KO TEX cells (j) from the spleen of LCMV clone 13-infected mice, either not treated (NT) or stimulated with ionomycin (Iono) for 30 min. n =5 per genotype. k,l, Gating strategies for sorting PD1+Tim3+ exhausted (TEX) and PD1−Tim3− progenitor (TPro) Pmel1 CD8 TILs from the tumor (k) of B16F10-implanted B6.SJL mice (CD45.1+) adoptively transferred with Dapl1 KO Pmel1 CD8 T cells (CD45.2+) transduced with either an empty vector or HA-Dapl1 expression vector, and flow cytometry analysis of nuclear NFATc1 in untreated (NT) or ionomycin-stimulated (Iono, 30 min) PD1+Tim3+ exhausted (TEX) and PD1−Tim3− progenitor (TPro) Pmel1 CD8 TILs (l). n =5 per genotype. m, Flow cytometry analysis of nuclear NFATc2 in in vitro generated exhausted human CD8 T cells transduced with a non-silencing control shRNA (Ctrl shRNA) or a Dapl1-specific shRNA, either not treated (NT) or stimulated for 30 min with ionomycin. n=5 biologically independent repeats. n-p, Flow cytometry analysis of nuclear NFATc2 (n) and nuclear NFATc1 (o,p) in PD1+Tim3+ CD8 T cells in the tumor of B16-OVA-bearing wildtype or Dapl1 KO mice injected with anti-Tim3 or IgG isotype control on days 7, 9, and 11. n=5 per genotype. Summary data are shown as the mean±s.d. with P values determined using a two-tailed unpaired Student’s t-test (c-e, h-j, l, m, o). ns, not significant.
Extended Data Fig. 10. The gating strategy used in flow cytometry analysis.
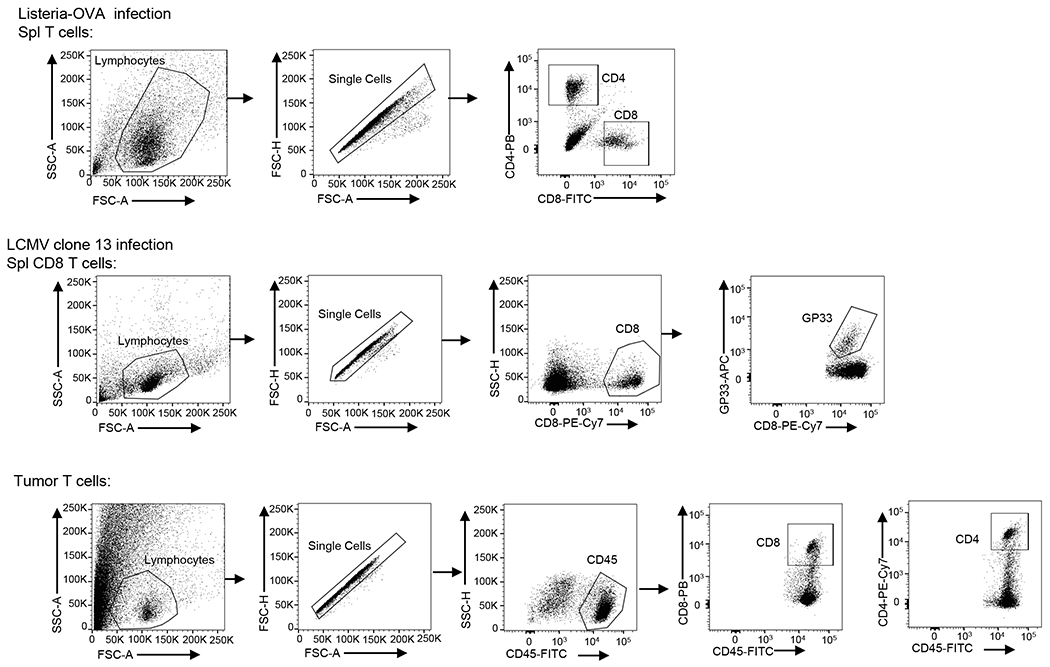
Live immune cell populations were gated on the FSC-A and SSC-A. Single cells were gated basing on FSC-A and FAS-H. The subpopulations of the indicated immune cell were gated basing on specific markers as indicated in the individual panels.
Supplementary Material
Acknowledgements
We thank J.P.B. Viola for NFAT expression vectors, E.J. Wherry for LCMV clone 13, and MMRRC for NFATc2 KO mice. We thank the Genetically Engineered Mouse Facility as well as the flow cytometry, sequencing and microarray, and animal facilities of the shared resources at The MD Anderson Cancer Center, supported by the NIH/NCI Cancer Center Support Grant (CCSG) P30CA016672. The Advanced Technology Genomics Core (ATGC) is supported by CA016672 (ATGC) and NIH grant no. 1S10OD024977-01. This study was supported by a grant from the National Institutes of Health (AI64639 to S.-C.S.). T.G. was a visiting student supported by a scholarship from the China Scholarship Council with the grant number of 201906380080.
Footnotes
Competing Interests Statement
X.Z. is presently an employee of Flagship Labs 91, Inc, J.K. is presently an employee of Bristol-Myers Squibb, X.X. is presently an employee of AbbVie, although they participated in this research when they were employed in the University of Texas MD Anderson Cancer Center. All competing interests are unrelated to the current study. The other authors declare no competing interests.
Code availability
All the code will be available from the corresponding author on reasonable request, including but not limited to the following: scRNA-seq analysis, bulk RNA-seq analysis.
Data availability
scRNA-seq data that support the findings of this study have been deposited in the Gene Expression Omnibus (GEO) under accession codes GSE175689. Previously published scRNA-seq data that were re-analysed here are available under accession code GSE139829. Previously published RNA-seq data that were re-analysed here are available under accession code GSE126777. All other data supporting the findings of this study are available from the corresponding author on reasonable request. Source data are provided with this paper.
References
- 1.Zhang N & Bevan MJ CD8(+) T cells: foot soldiers of the immune system. Immunity 35, 161–168 (2011). [DOI] [PMC free article] [PubMed] [Google Scholar]
- 2.Durgeau A, Virk Y, Corgnac S & Mami-Chouaib F Recent Advances in Targeting CD8 T-Cell Immunity for More Effective Cancer Immunotherapy. Front Immunol 9, 14 (2018). [DOI] [PMC free article] [PubMed] [Google Scholar]
- 3.Hashimoto M et al. CD8 T Cell Exhaustion in Chronic Infection and Cancer: Opportunities for Interventions. Annu Rev Med 69, 301–318 (2018). [DOI] [PubMed] [Google Scholar]
- 4.McLane LM, Abdel-Hakeem MS & Wherry EJ CD8 T Cell Exhaustion During Chronic Viral Infection and Cancer. Annu Rev Immunol 37, 457–495 (2019). [DOI] [PubMed] [Google Scholar]
- 5.van der Leun AM, Thommen DS & Schumacher TN CD8(+) T cell states in human cancer: insights from single-cell analysis. Nat Rev Cancer 20, 218–232 (2020). [DOI] [PMC free article] [PubMed] [Google Scholar]
- 6.Pardoll DM The blockade of immune checkpoints in cancer immunotherapy. Nat Rev Cancer 12, 252–264 (2012). [DOI] [PMC free article] [PubMed] [Google Scholar]
- 7.Zou W, Wolchok JD & Chen L PD-L1 (B7-H1) and PD-1 pathway blockade for cancer therapy: Mechanisms, response biomarkers, and combinations. Sci Transl Med 8, 328rv324 (2016). [DOI] [PMC free article] [PubMed] [Google Scholar]
- 8.Grywalska E, Pasiarski M, Gozdz S & Rolinski J Immune-checkpoint inhibitors for combating T-cell dysfunction in cancer. Onco Targets Ther 11, 6505–6524 (2018). [DOI] [PMC free article] [PubMed] [Google Scholar]
- 9.Miller BC et al. Subsets of exhausted CD8(+) T cells differentially mediate tumor control and respond to checkpoint blockade. Nature immunology 20, 326–336 (2019). [DOI] [PMC free article] [PubMed] [Google Scholar]
- 10.Li H et al. Dysfunctional CD8 T Cells Form a Proliferative, Dynamically Regulated Compartment within Human Melanoma. Cell 176, 775–789 e718 (2019). [DOI] [PMC free article] [PubMed] [Google Scholar]
- 11.Kallies A, Zehn D & Utzschneider DT Precursor exhausted T cells: key to successful immunotherapy? Nat Rev Immunol 20, 128–136 (2020). [DOI] [PubMed] [Google Scholar]
- 12.Siddiqui I et al. Intratumoral Tcf1(+)PD-1(+)CD8(+) T Cells with Stem-like Properties Promote Tumor Control in Response to Vaccination and Checkpoint Blockade Immunotherapy. Immunity 50, 195–211 e110 (2019). [DOI] [PubMed] [Google Scholar]
- 13.Kurtulus S et al. Checkpoint Blockade Immunotherapy Induces Dynamic Changes in PD-1(−)CD8(+) Tumor-Infiltrating T Cells. Immunity 50, 181–194 e186 (2019). [DOI] [PMC free article] [PubMed] [Google Scholar]
- 14.Escobar G, Mangani D & Anderson AC T cell factor 1: A master regulator of the T cell response in disease. Sci Immunol 5 (2020). [DOI] [PMC free article] [PubMed] [Google Scholar]
- 15.Utzschneider DT et al. T Cell Factor 1-Expressing Memory-like CD8(+) T Cells Sustain the Immune Response to Chronic Viral Infections. Immunity 45, 415–427 (2016). [DOI] [PubMed] [Google Scholar]
- 16.Beltra JC et al. Developmental Relationships of Four Exhausted CD8(+) T Cell Subsets Reveals Underlying Transcriptional and Epigenetic Landscape Control Mechanisms. Immunity 52, 825–841 e828 (2020). [DOI] [PMC free article] [PubMed] [Google Scholar]
- 17.Man K et al. Transcription Factor IRF4 Promotes CD8(+) T Cell Exhaustion and Limits the Development of Memory-like T Cells during Chronic Infection. Immunity 47, 1129–1141 e1125 (2017). [DOI] [PubMed] [Google Scholar]
- 18.Martinez GJ et al. The transcription factor NFAT promotes exhaustion of activated CD8(+) T cells. Immunity 42, 265–278 (2015). [DOI] [PMC free article] [PubMed] [Google Scholar]
- 19.Seo W, Jerin C & Nishikawa H Transcriptional regulatory network for the establishment of CD8(+) T cell exhaustion. Exp Mol Med 53, 202–209 (2021). [DOI] [PMC free article] [PubMed] [Google Scholar]
- 20.Wherry EJ et al. Molecular signature of CD8+ T cell exhaustion during chronic viral infection. Immunity 27, 670–684 (2007). [DOI] [PubMed] [Google Scholar]
- 21.Raczkowski F et al. The transcription factor Interferon Regulatory Factor 4 is required for the generation of protective effector CD8+ T cells. Proc Natl Acad Sci U S A 110, 15019–15024 (2013). [DOI] [PMC free article] [PubMed] [Google Scholar]
- 22.Klein-Hessling S et al. NFATc1 controls the cytotoxicity of CD8(+) T cells. Nat Commun 8, 511 (2017). [DOI] [PMC free article] [PubMed] [Google Scholar]
- 23.Pearce EL et al. Control of effector CD8+ T cell function by the transcription factor Eomesodermin. Science 302, 1041–1043 (2003). [DOI] [PubMed] [Google Scholar]
- 24.Ma X et al. DAPL1, a susceptibility locus for age-related macular degeneration, acts as a novel suppressor of cell proliferation in the retinal pigment epithelium. Hum Mol Genet 26, 1612–1621 (2017). [DOI] [PubMed] [Google Scholar]
- 25.Zhou X et al. The deubiquitinase Otub1 controls the activation of CD8(+) T cells and NK cells by regulating IL-15-mediated priming. Nature immunology 20, 879–889 (2019). [DOI] [PMC free article] [PubMed] [Google Scholar]
- 26.Khan SH & Badovinac VP Listeria monocytogenes: a model pathogen to study antigen-specific memory CD8 T cell responses. Semin Immunopathol 37, 301–310 (2015). [DOI] [PMC free article] [PubMed] [Google Scholar]
- 27.Qiu Z, Khairallah C & Sheridan BS Listeria Monocytogenes: A Model Pathogen Continues to Refine Our Knowledge of the CD8 T Cell Response. Pathogens 7 (2018). [DOI] [PMC free article] [PubMed] [Google Scholar]
- 28.Overwijk WW et al. Tumor regression and autoimmunity after reversal of a functionally tolerant state of self-reactive CD8+ T cells. J Exp Med 198, 569–580 (2003). [DOI] [PMC free article] [PubMed] [Google Scholar]
- 29.Wu T et al. The TCF1-Bcl6 axis counteracts type I interferon to repress exhaustion and maintain T cell stemness. Sci Immunol 1 (2016). [DOI] [PMC free article] [PubMed] [Google Scholar]
- 30.Chen Z et al. TCF-1-Centered Transcriptional Network Drives an Effector versus Exhausted CD8 T Cell-Fate Decision. Immunity 51, 840–855 e845 (2019). [DOI] [PMC free article] [PubMed] [Google Scholar]
- 31.Hudson WH et al. Proliferating Transitory T Cells with an Effector-like Transcriptional Signature Emerge from PD-1(+) Stem-like CD8(+) T Cells during Chronic Infection. Immunity 51, 1043–1058 e1044 (2019). [DOI] [PMC free article] [PubMed] [Google Scholar]
- 32.Zander R et al. CD4(+) T Cell Help Is Required for the Formation of a Cytolytic CD8(+) T Cell Subset that Protects against Chronic Infection and Cancer. Immunity 51, 1028–1042 e1024 (2019). [DOI] [PMC free article] [PubMed] [Google Scholar]
- 33.Walunas TL, Bruce DS, Dustin L, Loh DY & Bluestone JA Ly-6C is a marker of memory CD8+ T cells. J Immunol 155, 1873–1883 (1995). [PubMed] [Google Scholar]
- 34.Cerwenka A, Carter LL, Reome JB, Swain SL & Dutton RW In vivo persistence of CD8 polarized T cell subsets producing type 1 or type 2 cytokines. J Immunol 161, 97–105 (1998). [PubMed] [Google Scholar]
- 35.Curtsinger JM, Lins DC & Mescher MF CD8+ memory T cells (CD44high, Ly-6C+) are more sensitive than naive cells to (CD44low, Ly-6C-) to TCR/CD8 signaling in response to antigen. J Immunol 160, 3236–3243 (1998). [PubMed] [Google Scholar]
- 36.Muller MR & Rao A NFAT, immunity and cancer: a transcription factor comes of age. Nat Rev Immunol 10, 645–656 (2010). [DOI] [PubMed] [Google Scholar]
- 37.Vaeth M & Feske S NFAT control of immune function: New Frontiers for an Abiding Trooper. F1000Res 7, 260 (2018). [DOI] [PMC free article] [PubMed] [Google Scholar]
- 38.Faget DV, Lucena PI, Robbs BK & Viola JP NFAT1 C-terminal domains are necessary but not sufficient for inducing cell death. PLoS One 7, e47868 (2012). [DOI] [PMC free article] [PubMed] [Google Scholar]
- 39.Loh C, Carew JA, Kim J, Hogan PG & Rao A T-cell receptor stimulation elicits an early phase of activation and a later phase of deactivation of the transcription factor NFAT1. Mol Cell Biol 16, 3945–3954 (1996). [DOI] [PMC free article] [PubMed] [Google Scholar]
- 40.Liu Z et al. The kinase LRRK2 is a regulator of the transcription factor NFAT that modulates the severity of inflammatory bowel disease. Nature immunology 12, 1063–1070 (2011). [DOI] [PMC free article] [PubMed] [Google Scholar]
- 41.Hogan PG Calcium-NFAT transcriptional signalling in T cell activation and T cell exhaustion. Cell Calcium 63, 66–69 (2017). [DOI] [PMC free article] [PubMed] [Google Scholar]
- 42.Carmona SJ, Siddiqui I, Bilous M, Held W & Gfeller D Deciphering the transcriptomic landscape of tumor-infiltrating CD8 lymphocytes in B16 melanoma tumors with single-cell RNA-Seq. Oncoimmunology 9, 1737369 (2020). [DOI] [PMC free article] [PubMed] [Google Scholar]
- 43.Wang Y et al. The Transcription Factor TCF1 Preserves the Effector Function of Exhausted CD8 T Cells During Chronic Viral Infection. Front Immunol 10, 169 (2019). [DOI] [PMC free article] [PubMed] [Google Scholar]
- 44.Sakuishi K et al. Targeting Tim-3 and PD-1 pathways to reverse T cell exhaustion and restore anti-tumor immunity. J Exp Med 207, 2187–2194 (2010). [DOI] [PMC free article] [PubMed] [Google Scholar]
Methods-only references
- 45.Reiley WW et al. Regulation of T cell development by the deubiquitinating enzyme CYLD. Nature immunology 7, 411–417 (2006). [DOI] [PubMed] [Google Scholar]
- 46.Reiley WW et al. Deubiquitinating enzyme CYLD negatively regulates the ubiquitin-dependent kinase Tak1 and prevents abnormal T cell responses. J Exp Med 204, 1475–1485 (2007). [DOI] [PMC free article] [PubMed] [Google Scholar]
- 47.Podtschaske M et al. Digital NFATc2 activation per cell transforms graded T cell receptor activation into an all-or-none IL-2 expression. PLoS One 2, e935 (2007). [DOI] [PMC free article] [PubMed] [Google Scholar]
- 48.Ahmed R, Salmi A, Butler LD, Chiller JM & Oldstone MB Selection of genetic variants of lymphocytic choriomeningitis virus in spleens of persistently infected mice. Role in suppression of cytotoxic T lymphocyte response and viral persistence. J Exp Med 160, 521–540 (1984). [DOI] [PMC free article] [PubMed] [Google Scholar]
- 49.Nelson JD, Denisenko O & Bomsztyk K Protocol for the fast chromatin immunoprecipitation (ChIP) method. Nat Protoc 1, 179–185 (2006). [DOI] [PubMed] [Google Scholar]
- 50.Xiao G, Harhaj EW & Sun SC NF-kappaB-inducing kinase regulates the processing of NF-kappaB2 p100. Mol Cell 7, 401–409 (2001). [DOI] [PubMed] [Google Scholar]
- 51.Zhao M et al. Rapid in vitro generation of bona fide exhausted CD8+ T cells is accompanied by Tcf7 promotor methylation. PLoS Pathog 16, e1008555 (2020). [DOI] [PMC free article] [PubMed] [Google Scholar]
- 52.Dunsford LS, Thoirs RH, Rathbone E & Patakas A A Human In Vitro T Cell Exhaustion Model for Assessing Immuno-Oncology Therapies, in Immuno-Oncology 89–101 (2020). [Google Scholar]
Associated Data
This section collects any data citations, data availability statements, or supplementary materials included in this article.
Supplementary Materials
Data Availability Statement
scRNA-seq data that support the findings of this study have been deposited in the Gene Expression Omnibus (GEO) under accession codes GSE175689. Previously published scRNA-seq data that were re-analysed here are available under accession code GSE139829. Previously published RNA-seq data that were re-analysed here are available under accession code GSE126777. All other data supporting the findings of this study are available from the corresponding author on reasonable request. Source data are provided with this paper.


