Abstract
Dysregulation of the imprinted H19/IGF2 locus can lead to Silver-Russell syndrome (SRS) in humans. However, the mechanism of how abnormal H19/IGF2 expression contributes to various SRS phenotypes remains unclear, largely due to incomplete understanding of the developmental functions of these two genes. We previously generated a mouse model with humanized H19/IGF2 imprinting control region (hIC1) on the paternal allele that exhibited H19/Igf2 dysregulation together with SRS-like growth restriction and perinatal lethality. Here, we dissect the role of H19 and Igf2 in cardiac and placental development utilizing multiple mouse models with varying levels of H19 and Igf2. We report severe cardiac defects such as ventricular septal defects and thinned myocardium, placental anomalies including thrombosis and vascular malformations, together with growth restriction in mouse embryos that correlated with the extent of H19/Igf2 dysregulation. Transcriptomic analysis using cardiac endothelial cells of these mouse models shows that H19/Igf2 dysregulation disrupts pathways related to extracellular matrix and proliferation of endothelial cells. Our work links the heart and placenta through regulation by H19 and Igf2, demonstrating that accurate dosage of both H19 and Igf2 is critical for normal embryonic development, especially related to the cardiac-placental axis.
Research organism: Mouse
Introduction
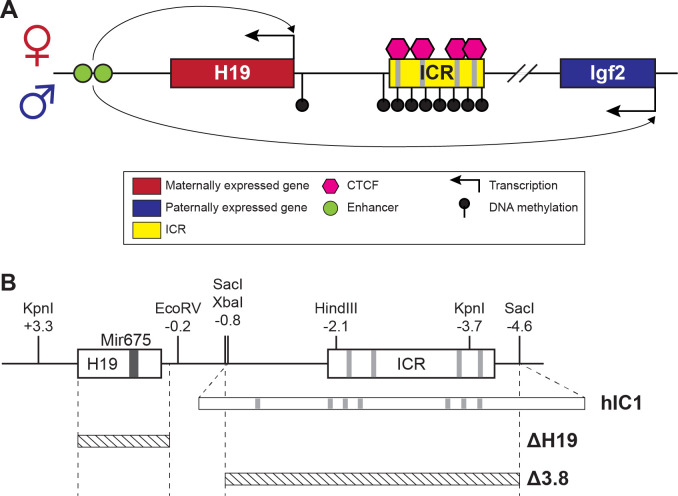
Genomic imprinting is a mammalian-specific phenomenon where a small number of genes are expressed in an allele-specific manner. Functionally, imprinted genes have central roles in development and growth in both humans and mice (Barlow and Bartolomei, 2014). Additionally, proper gene dosage of most imprinted genes is essential for normal development. Human chromosome 11 and the orthologous region on mouse chromosome 7 harbor two jointly controlled growth regulators with opposing functions; H19 long non-coding RNA (lncRNA) and Insulin-like Growth Factor 2 (IGF2/Igf2). These two imprinted genes share an imprinting control region (ICR), a cis-regulatory element located between two genes, which is essential for their allele-specific expression, as well as tissue-specific enhancers located downstream of H19 (Chang and Bartolomei, 2020). The H19/IGF2 ICR, which is designated as IC1 in humans, binds CTCF on the maternal allele, forming an insulator and enabling H19 exclusive access to the shared enhancers (Figure 1A). On the paternal allele, the H19/IGF2 ICR is methylated, which prevents CTCF from binding and an insulator from forming. Consequently, IGF2 usurps the shared enhancers, and H19 is repressed on the paternal allele. Ultimately, allele-specific ICR methylation facilitates monoallelic expression of H19 and IGF2 with H19 expressed from the maternal allele and IGF2 expressed from the paternal allele.
Figure 1. H19/Igf2 cluster and mouse models utilized in this study.
(A) A schematic representation of the wild-type H19/Igf2 cluster in mouse. The maternally expressed H19 and the paternally expressed Igf2 genes are shown in red and blue, respectively. Black lollipops on the paternal allele represent DNA methylation. The maternal imprinting control region (ICR) is bound to CTCF proteins (pink hexagons) at CTCF-binding sites, forming an insulator that blocks the maternal Igf2 promoter from the shared enhancers (green circles). These enhancers interact with the H19 promoter on the maternal allele and Igf2 promoter on the paternal allele. (B) Schematic of the mouse endogenous H19/Igf2 ICR, H19hIC1 (shortened as hIC1; Hur et al., 2016), H19Δ2.8kb-H19 (shortened as Δ H19), and H19 Δ3.8kb-5’H19 (shortened as Δ 3.8; Thorvaldsen et al., 2002; Thorvaldsen et al., 2006) alleles. Restriction site locations (kb) are relative to the H19 transcription start site. Gray lines on the ICR represent conserved CTCF-binding sequences.
Dysregulation of the H19/IGF2 cluster is associated with two growth disorders, Beckwith-Wiedemann syndrome (BWS) and Silver-Russell syndrome (SRS). In contrast to overgrowth observed for BWS, SRS is characterized by intrauterine growth restriction resulting in small for gestational age births. Other symptoms of SRS vary widely among patients and include hemihypotrophy, cognitive impairment, relative macrocephaly, and fifth-finger clinodactyly (Wakeling et al., 2017). Approximately, 50% of patients with SRS exhibit IC1 hypomethylation (Eggermann et al., 2011). Lack of methylation may allow the formation of an ectopic insulator on paternal IC1, which likely explains why this class of SRS individuals has biallelic H19 expression and greatly diminished IGF2 expression (Abi Habib et al., 2017; Gicquel et al., 2005). Importantly, ICR mutations in the mouse that were generated to study imprinted gene regulation provided critical information, suggesting a role for H19 and IGF2 in SRS. For example, mutating CpGs at CTCF sites on the paternal H19/Igf2 ICR resulted in the loss of ICR methylation, activation of paternal H19, and reduced Igf2 expression (Engel et al., 2004). This mutation led to restricted embryonic growth, which phenocopies SRS. Nevertheless, although we and others successfully modeled a subset of SRS mutations in the mouse, not all mutations were translatable because the mouse H19/Igf2 ICR lacks extensive sequence conservation with human IC1. Thus, a mouse model with human IC1 sequence substituted for the endogenous mouse H19/Igf2 ICR was generated (H19hIC1, shortened as hIC1; Hur et al., 2016) to model human mutations more precisely (Freschi et al., 2018; Freschi et al., 2021). Consistent with expectations, maternally transmitted hIC1 successfully maintained insulator function, suggesting the possibility to model human IC1 mutations endogenously in mice upon maternal transmission. In contrast, paternally transmitted hIC1 showed loss of methylation and formation of an ectopic insulator. Consequently, paternal hIC1 transmission caused elevated H19 expression and Igf2 depletion together with growth restriction and embryonic lethality (Hur et al., 2016). Although the epigenetic defects and growth restriction of these mice nicely model SRS symptoms, many SRS individuals are viable. A potential explanation for such discrepancy between human and mouse could reflect the mosaic nature of epigenetic defects in human (Soellner et al., 2019), with a subset of cells showing normal methylation patterns.
The mechanism by which H19/IGF2 expression dysregulation causes SRS phenotypes is unknown, largely because the function of these two genes during development is incompletely understood. IGF2 is a well-described growth factor promoting fetoplacental growth, which functions in an endocrine/paracrine manner through binding to IGF/insulin receptors (Harris and Westwood, 2012). Decreased IGF2 levels in patients with SRS suggest that IGF2 contributes to restricted growth in these patients (Abi Habib et al., 2017; Begemann et al., 2015; Gicquel et al., 2005). Consistently, in mice, paternal-specific deletion of Igf2 resulted in loss of Igf2 expression and pre- and postnatal growth restriction (DeChiara et al., 1991; Haley et al., 2012). In contrast, the exact role of H19 remains unclear. Previous studies in mouse suggested that H19 lncRNA is a precursor for microRNA 675 (Mir675), which regulates Igf1r expression (Keniry et al., 2012) and that H19 represses Igf2 expression in trans (Gabory et al., 2009). As a result, H19 has been largely overlooked and suggested to be an occasional regulator of Igf2 expression. Nevertheless, a previously described mouse model with H19 overexpression without changes in Igf2 expression showed embryonic growth restriction (Drewell et al., 2000), suggesting that H19 mediates growth suppression independently from Igf2. Here, we report severe developmental defects of the heart and placenta in mouse models with dysregulated H19/Igf2 expression. Embryos with the paternal hIC1 showed atrioventricular (AV) cushion defects in the heart coupled with ventricular septal defects (VSDs) and extremely thinned myocardial walls. Combined with placental anomalies, the cardiac defects most likely contribute to the lethality of these mice (Kochilas et al., 1999; Snider and Conway, 2011). Deletion of H19 from the maternal allele, thereby reducing H19 levels, failed to rescue completely the lethality and growth restriction associated with the paternal inheritance of hIC1. A minimal rescue of the earlier growth and resorption frequency was, however, observed with normalized H19 expression. Ultimately, modifying both H19 and Igf2 expression was necessary to rescue most phenotypes. Transcriptomic analysis of embryonic cardiac endothelial cells identified several key signaling pathways that are affected by the dysregulated H19 and Igf2 and are potentially responsible for the paternal hIC1-related cardiac defects. This work emphasizes the importance of accurate dosage of H19 and Igf2 expression in normal cardiac and placental development, disruption of which can lead to SRS-like pathologies.
Results
Mouse models with genetic modifications that perturb H19 and Igf2 to different extents were used to address the phenotypic consequences of abnormal H19 and Igf2 levels (Figure 1B). hIC1 refers to the humanized H19hIC1 allele that substitutes the endogenous mouse H19/Igf2 ICR with the corresponding human IC1 sequence, which was initially generated to study human BWS and SRS mutations in the mouse (Freschi et al., 2018; Hur et al., 2016). Paternal transmission of hIC1 (+/hIC1) was previously reported to increase H19 and greatly diminish Igf2 expression and resulted in embryonic lethality.
Cardiac and placental defects in +/hIC1 embryos
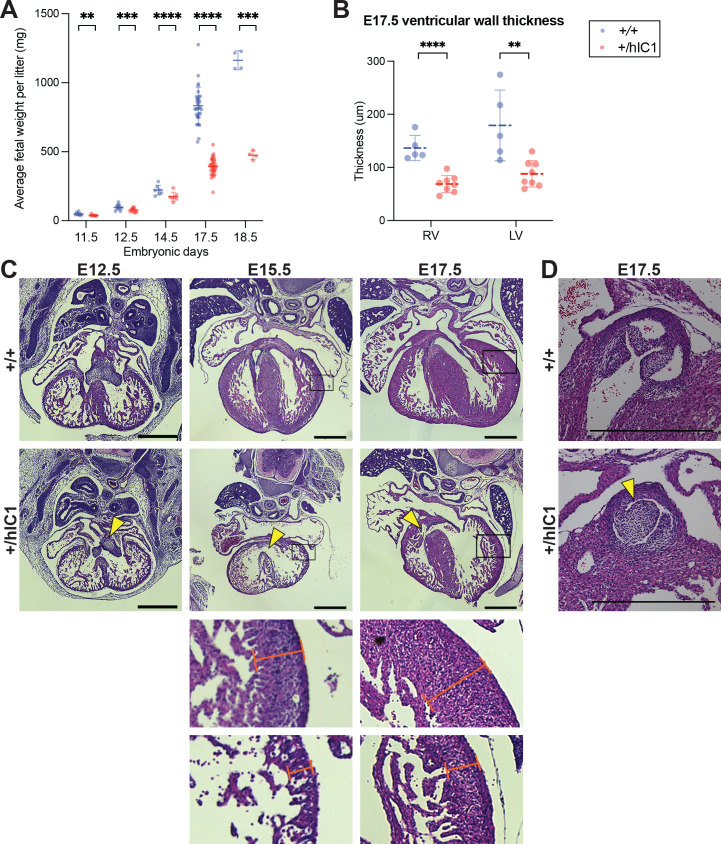
Our initial experiments examined the developmental phenotype of +/hIC1 embryos to determine how abnormal H19/Igf2 expression resulted in dramatic growth defects and lethality. As previously reported (Hur et al., 2016), +/hIC1 embryos showed severe growth restriction (note that for heterozygous embryos, maternal allele is written first, Figure 2A). The growth restriction appeared as early as E11.5 and was greatly exaggerated by the end of gestation. Although E18.5 +/hIC1 embryos were observed alive and weighed approximately 40% of their wild-type littermates, +/hIC1 neonates were perinatally lethal, with no live pups found on the day of birth. To ascertain the source of lethality, we first examined lungs from dead +/hIC1 neonates. The lungs floated in water, demonstrating that +/hIC1 pups respired after birth (Borensztein et al., 2012). Additionally, +/hIC1 neonates did not have a cleft palate, but no milk spots were found in their abdomen, indicating a lack of feeding.
Figure 2. Growth anomalies and cardiac defects of +/hIC1 embryos.
(A) Fetal weight of the wild-type (blue) and +/hIC1 (red) embryos at E11.5, E12.5, E14.5, E17.5, and E18.5 (mean ± SD). Each data point represents an average weight of each genotype from one litter. 8 litters for E11.5, 10 litters for E12.5, 7 litters for E14.5, 31 litters for E17.5, and 4 litters for E18.5 are presented. (B) Quantification of ventricular wall thickness (µm), measured from E17.5 wild-type and +/hIC1 hearts (mean ± SD). Each data point represents an individual conceptus. Five wild-type and eight +/hIC1 embryos from four different litters were examined. (C) Representative cross-sections of wild-type and +/hIC1 embryonic hearts at E12.5, E15.5, and E17.5, stained with hematoxylin and eosin. All the hearts represented here are from female fetuses. Note the lack of fusion between atrioventricular (AV) cushions at E12.5, the ventricular septal defect (VSD) at E15.5, and E17.5 in +/hIC1 hearts (yellow arrowheads). The boxed regions of E15.5 and E17.5 images are enlarged at the bottom of the figure, to show where the ventricular wall thickness is measured. Scale bars = 500 µm. (D) A representative image of pulmonary valves in E17.5 wild-type and +/hIC1 hearts. The +/hIC1 right pulmonary cusp is enlarged (yellow arrowhead), and there is no cusp in the anterior position, in contrast to the tricuspid structure in the wild-type heart. Scale bars = 500 µm. Statistics used are (A) multiple paired t-test and (B) multiple unpaired t-test with **p<0.01, ***p<0.001, ****p<0.0001, and ns = not significant.
Figure 2—figure supplement 1. Supplementary data for anomalies observed in +/hIC1 hearts.
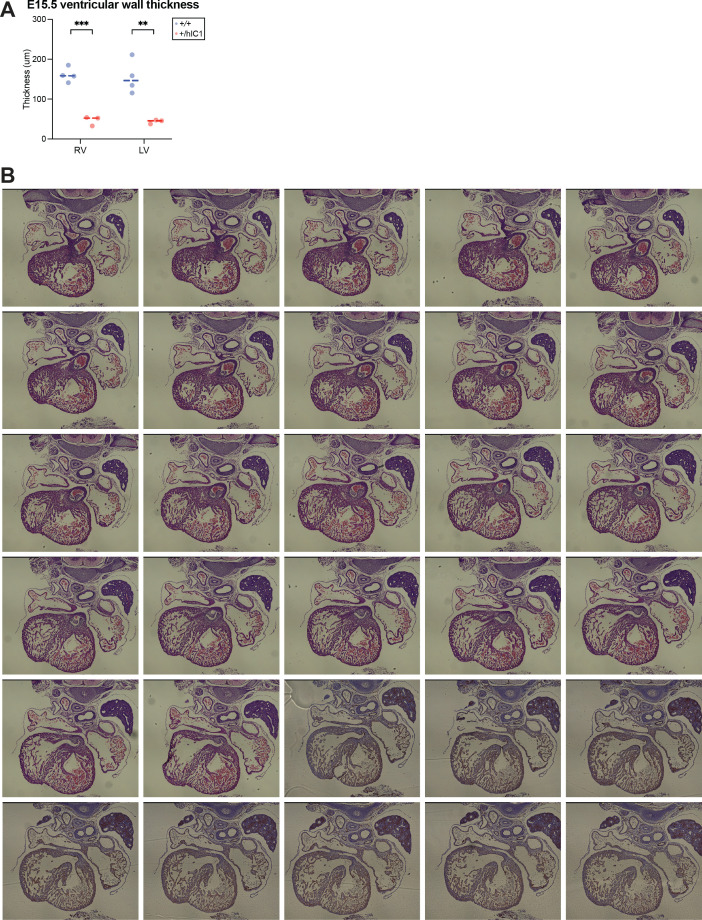
Histological analyses were performed throughout development on major organs where H19 and Igf2 are highly expressed. Severe developmental defects were found in the +/hIC1 heart and placenta. Cardiac defects in +/hIC1 embryos were observed as early as E12.5, where the superior and inferior endocardial cushions failed to fuse into a common AV cushion (Figure 2C). The cushion defect preceded incomplete interventricular septum (IVS) formation. At E15.5, a severe perimembranous VSD was observed in all five +/hIC1 hearts that were evaluated (Figure 2C). Importantly, this congenital heart defect resembles malformations reported in several SRS patients with IC1 hypomethylation (Ghanim et al., 2013), although the prevalence is unclear and may reflect the degree of mosaicism in SRS. Additionally, E15.5 hearts showed an extremely thin myocardium (Figure 2C and Figure 2—figure supplement 1A). Both VSD and thinned ventricular walls persisted in E17.5 +/hIC1 hearts (Figure 2B and C). Additionally, 6 out of 16 +/hIC1 hearts in the late gestation group (E15.5 to P0) had bicuspid pulmonary valve, a rare cardiac defect in which the pulmonary valve only develops two cusps as opposed to the normal tricuspid structure (Figure 2D and Figure 2—figure supplement 1B). These results demonstrate that paternal hIC1 transmission results in variably penetrant cardiac phenotypes. Notably, AV valvuloseptal morphogenesis, the fusion of the AV cushion and nascent septa during cardiogenesis, is required for proper cardiac septation (Eisenberg and Markwald, 1995). Segmentation of the heart into four separate chambers is required to establish distinct pulmonary and systemic blood flow during heart development and is required to prevent the mixing of oxygenated and deoxygenated blood. We speculate that the failure of hIC1 mutants to establish complete ventricular septation could have led to a reduced ability to provide oxygen and nutrient rich blood to the rest of the developing body (Savolainen et al., 2009; Spicer et al., 2014).
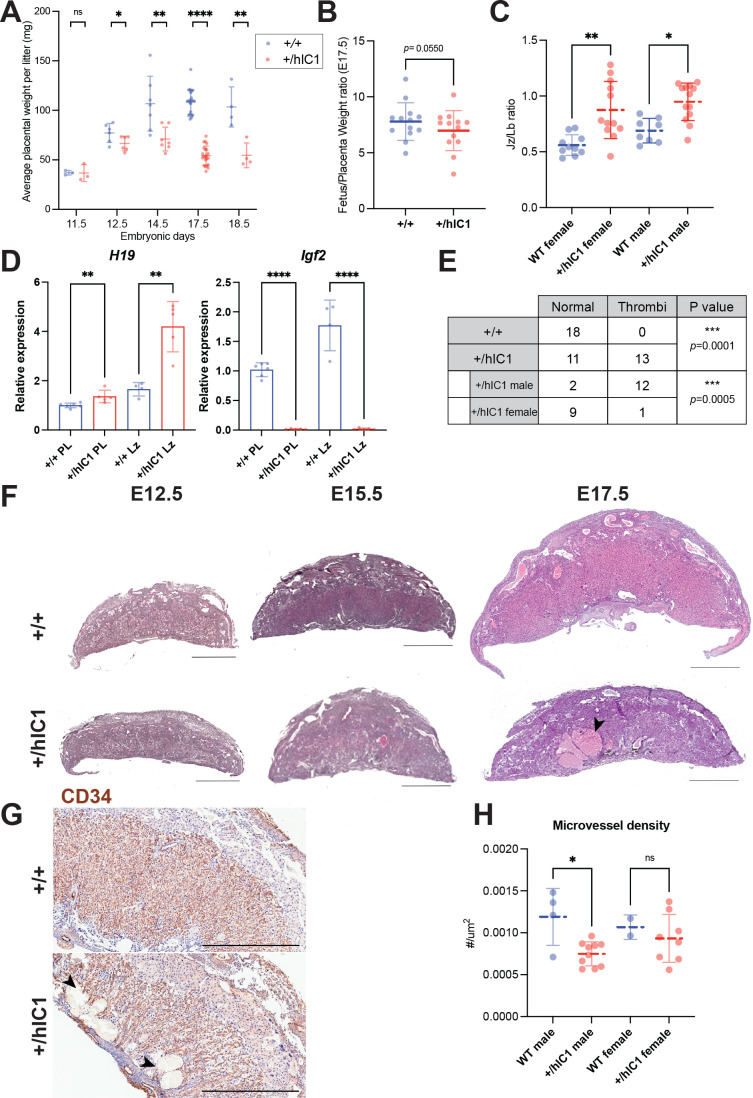
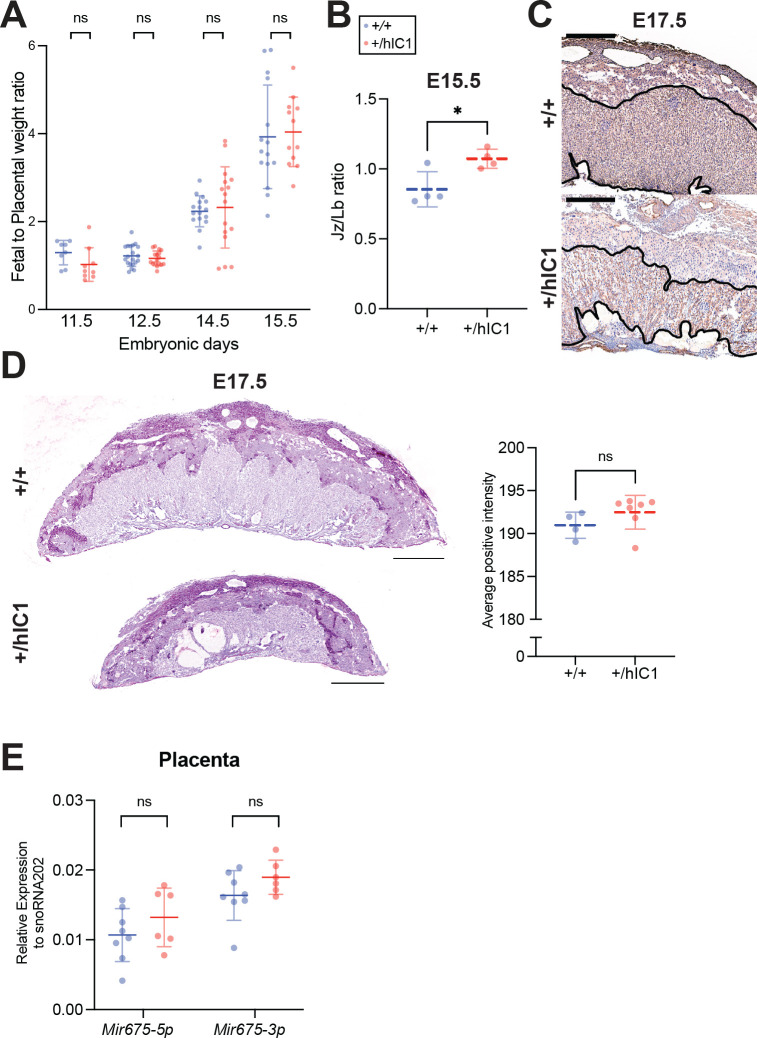
Another major organ with high H19/Igf2 expression, which forms early in development, is the placenta. Multiple developmental defects were observed in +/hIC1 placentas. As previously described (Hur et al., 2016), +/hIC1 placentas were growth restricted throughout development (Figure 3A), although the fetal to placental weight ratio was not affected through E15.5 (Figure 3—figure supplement 1A). However, at E17.5, the fetal to placental weight ratio was lower in +/hIC1 conceptuses, indicating that the fetal growth restriction was more severe than the placental growth restriction as the concepti neared term (Figure 3B). In addition to placental undergrowth, the junctional to labyrinth zone ratio was increased in +/hIC1 placentas (Figure 3C and Figure 3—figure supplement 1B), suggesting that the growth of the labyrinth layer, where the maternal-fetal exchange occurs, was more affected. Moreover, H19 overexpression was exaggerated in the labyrinth in E17.5 +/hIC1 placentas, while the Igf2 depletion was consistent throughout the whole placenta (Figure 3D), possibly indicating that H19 overexpression contributed disproportionately to the phenotype of growth restriction in the labyrinth. Large thrombi were observed in the labyrinth zone of these +/hIC1 placentas (Figure 3F), in a male-skewed manner (Figure 3E). As the thrombi could be formed due to defective vasculature structures, wild-type and +/hIC1 placentas were stained for CD34, a marker for the fetoplacental endothelial cells that line the microvessels in the labyrinth layer. Vessels in the +/hIC1 labyrinth were highly dilated (Figure 3G), and quantification of the stained areas showed that the microvascular density was significantly decreased in +/hIC1 placentas among males (Figure 3H and Figure 3—figure supplement 1C). Although previous studies reported that Igf2-null mice had lower placental glycogen concentration (Lopez et al., 1996) and H19 deletion led to increased placental glycogen storage (Esquiliano et al., 2009), Periodic acid-Schiff (PAS) staining on +/hIC1 placentas showed that the glycogen content is not significantly different between wild-type and +/hIC1 placentas (Figure 3—figure supplement 1D). The reduced labyrinth layer and defective microvascular expansion likely compromised the ability of +/hIC1 placentas to supply nutrients and oxygen to the fetus. These results support the hypothesis that the abnormal growth of +/hIC1 embryos may be explained by failure in multiple organs, especially the heart and placenta, which are developmentally linked (Barak et al., 2019).
Figure 3. Placental defects of +/hIC1 embryos.
(A) Placental weight of the wild-type (blue) and +/hIC1 (red) samples at E11.5, E12.5, E14.5, E17.5, and E18.5 (mean ± SD). Each data point represents an average weight of each genotype from one litter. 3 litters for E11.5, 6 litters for E12.5, 7 litters for E14.5, 22 litters for E17.5, and 4 litters for E18.5 are presented. (B) Fetal to placental weight ratios in E17.5 wild-type and +/hIC1 samples (mean ± SD). Each data point represents the average F/P ratio of each genotype from one litter. 13 litters are presented. (C) Junctional zone (Jz) to labyrinth (Lb) ratio in E17.5 wild-type and +/hIC1 placentas (mean ± SD). (D) Relative total expression of H19 and Igf2 in E17.5 wild-type and +/hIC1 placentas and Lb samples (mean ± SD). (E) Number of wild-type, male, and female +/hIC1 placentas with thrombi observed. (F) Representative cross-sections of E12.5, E15.5, and E17.5 wild-type and +/hIC1 placentas stained with hematoxylin and eosin. All depicted E12.5 and E15.5 placentas are female. The E17.5 wild-type placenta is female, and +/hIC1 placenta is male. Black arrowhead indicates a large thrombus formed in the +/hIC1 Lb. Scale bars = 1 mm. (G) Representative images of CD34 immunostaining counterstained with hematoxylin on E17.5 wild-type female and +/hIC1 male placental sections. Black arrowheads indicate thrombi in the +/hIC1 Lb. Scale bars = 1 mm. (H) Quantification of the microvessel density in E17.5 wild-type and +/hIC1 placentas. 4 wild-type male, 10 +/hIC1 male, 2 wild-type female, 8 +/hIC1 female placentas from six litters were quantified. (C, D, and H) Each data point represents an individual conceptus from different litters. Statistics used are (A and B) multiple paired t-test, (C) one-way ANOVA with Tukey’s multiple comparisons test, (D and H) multiple unpaired t-test, (E) Fisher’s exact test. *p<0.05, **p<0.01, ***p<0.001, ****p<0.0001, and ns = not significant.
Figure 3—figure supplement 1. Supplementary data for anomalies observed in +/hIC1 placentas.
Additionally, we examined expression of the H19-derived Mir675 in +/hIC1 placentas to determine if the level of Mir675 is correlated with changes in H19 and Igf2 expression. This analysis was conducted at E15.5 when cardiac and placental defects were already observed in +/hIC1 embryos (Figure 2—figure supplement 1A, B and Figure 3—figure supplement 1B). Despite increased H19 expression and Igf2 depletion (Hur et al., 2016), Mir675 was not significantly increased in +/hIC1 placentas compared to the wild-type (Figure 3—figure supplement 1E). Thus, we conclude that the placental phenotypes observed in +/hIC1 mice are solely attributable to the increased H19 lncRNA, irrespective of Mir675. Another possibility is that the disproportionate H19 overexpression in the labyrinth layer at E17.5 (Figure 3D) was also present at E15.5 because growth suppression was more severe in labyrinth than in junctional zone in E15.5 (Figure 3—figure supplement 1B) and in E17.5 placenta (Figure 3C). This would have made it difficult to detect a substantial difference in Mir675 expression in the whole placenta.
Normalizing H19 expression partially rescues paternal hIC1 defects
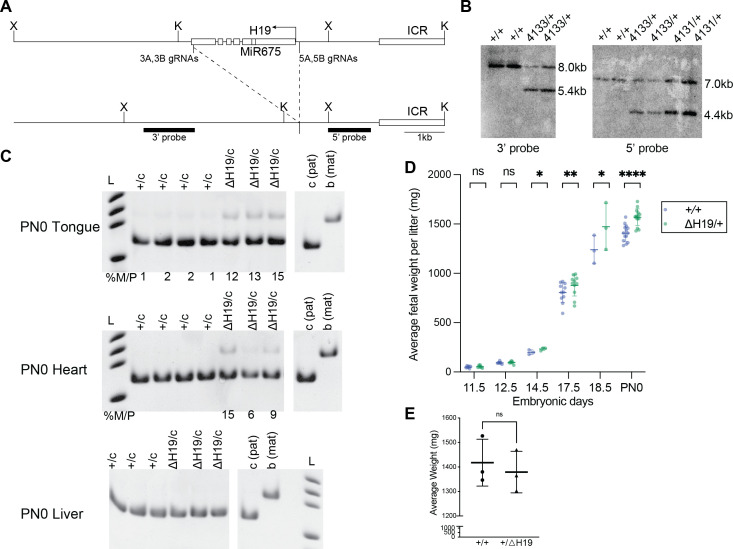
It has been previously reported that Igf2 null mice are viable (DeChiara et al., 1991). Thus, we hypothesize that H19 overexpression combined with a loss of Igf2 expression is the molecular contributor to the lethality of paternal hIC1 transmission. To examine if reduced H19 expression would rescue the paternal hIC1 transmission phenotypes, we generated a mouse model with deletion of the H19 transcription unit (H19Δ2.8kb-H19; shortened as ΔH19; Figure 1B, Figure 4—figure supplement 1A and B). Consistent with previous reports, maternal deletion of H19 (ΔH19/+) led to an absence of H19 expression and tissue-specific minimal activation of maternal Igf2 (Figure 4—figure supplement 1C). These mice are viable and fertile, regardless of whether the deletion is maternally or paternally transmitted, although maternal transmission is associated with increased fetal weight from E14.5 and onward (Figure 4—figure supplement 1D).
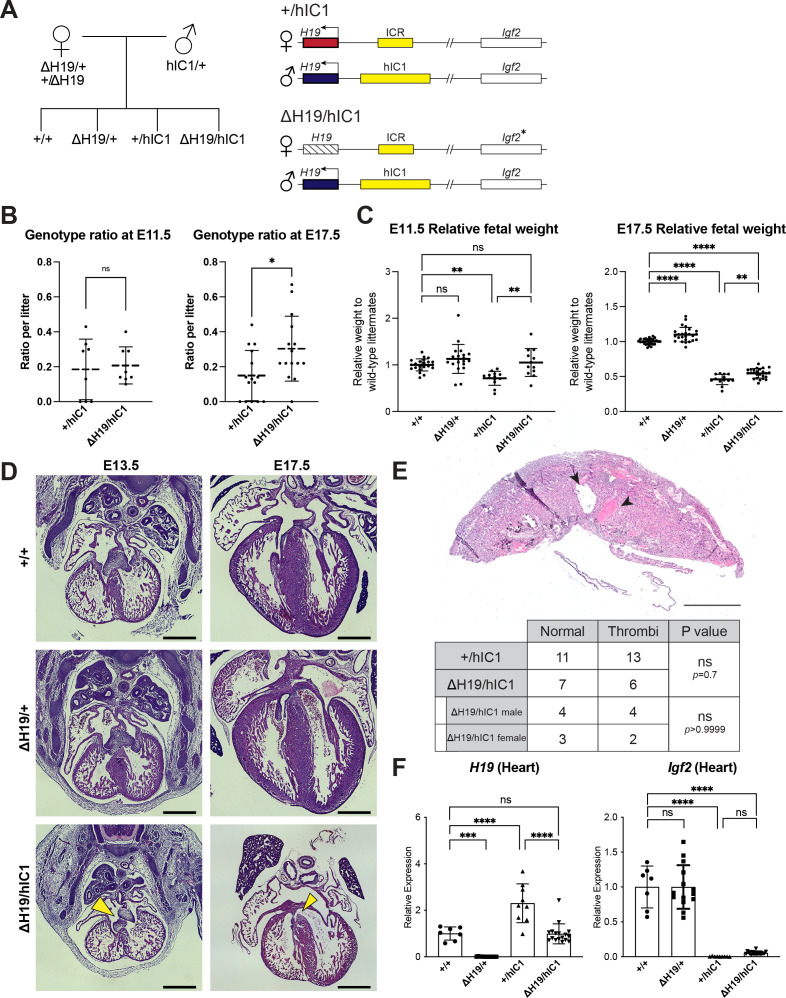
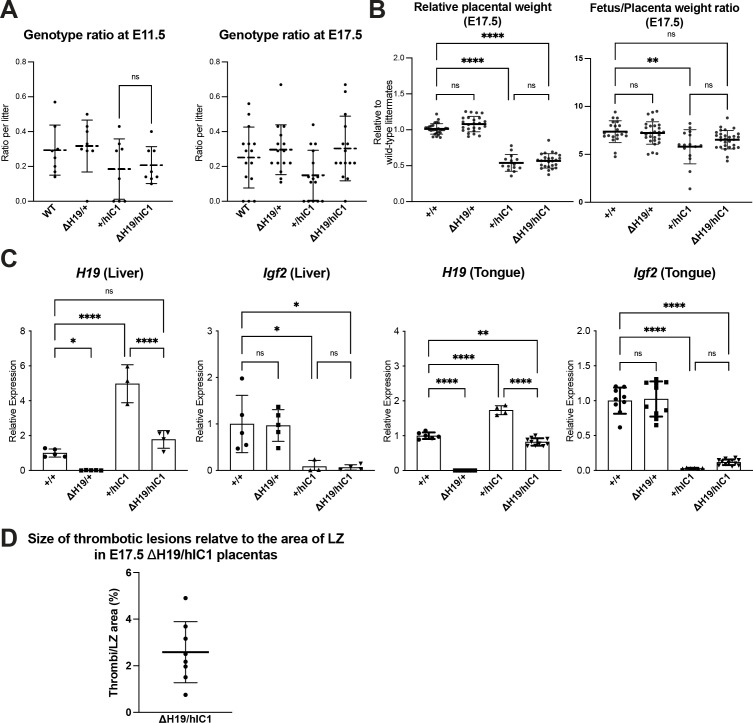
Heterozygous ΔH19 females were mated with heterozygous hIC1 males to generate ΔH19/hIC1 embryos. These embryos were expected to have lower H19 expression compared to +/hIC1 embryos, as the maternal H19 expression was silenced (Figure 4A). Among four possible genotypes from this breeding, +/hIC1 embryos constituted approximately 15% per litter at E17.5, as opposed to the expected Mendelian ratio of 25%. In contrast, ΔH19/hIC1 embryos comprised approximately 30% per litter at E17.5, indicating partial rescue of the resorption frequency by maternal H19 deletion (Figure 4B and Figure 4—figure supplement 2A). However, ΔH19/hIC1 embryos still exhibited perinatal lethality, with no live pups observed on the day of birth. With respect to growth restriction, the maternal ΔH19 allele partially rescued the phenotype. At E11.5, ΔH19/hIC1 fetal weight was not significantly different from wild-type littermates (Figure 4C). However, at late gestation (E17.5), although ΔH19/hIC1 fetuses had a significant increase in fetal weight compared to the +/hIC1 fetuses, ΔH19/hIC1 fetuses remained significantly smaller compared to the wild-type. As perinatal lethality was still observed, conceptuses were analyzed histologically to characterize their developmental defects. The AV cushion defect persisted in all examined E13.5 ΔH19/hIC1 embryos, and 50% of the examined E17.5 ΔH19/hIC1 hearts showed either perimembranous or muscular VSDs (Figure 4D). Thrombi were still present in approximately 50% of ΔH19/hIC1 placentas (Figure 4E and Figure 4—figure supplement 2D), and placental weight remained significantly lower compared to wild-type littermates (Figure 4—figure supplement 2B). Of note, none of these histological defects were observed in ΔH19/+ embryonic hearts and placentas (see Figure 4D for example; three ΔH19/+ hearts each from E13.5, E15.5, and E17.5 concepti, and 20 E17.5 ΔH19/+ placentas were examined). E17.5 ΔH19/hIC1 tissues demonstrated wild-type levels of H19 expression, while the Igf2 expression remained markedly lower than wild-type (Figure 4F and Figure 4—figure supplement 2C). From these results, we conclude that restoring H19 expression is not sufficient to rescue completely the lethality and developmental defects upon paternal transmission of hIC1. Thus, phenotypes are likely caused by abnormal expression of both H19 and Igf2.
Figure 4. Normalizing H19 expression through the maternal deletion of H19.
(A) A schematic representation of the rescue breeding between △H19 heterozygous female and hIC1/+ male mice. △H19/hIC1 embryos are expected to express H19 only from the paternal allele and maternally express Igf2 in a tissue-specific manner. (B) Ratio of +/hIC1 and △H19/hIC1 embryos observed in E11.5 and E17.5 litters (mean ± SD). 8 E11.5 litters and 15 E17.5 litters with litter size larger than five pups were examined. Each data point represents one litter. (C) Relative fetal weights of wild-type, △H19/+, +/hIC1, and △H19/hIC1 embryos at E11.5 and E17.5, normalized to the average body weight of the wild-type littermates (mean ± SD). (D) Representative cross-sections of wild-type, △H19/+ and △H19/hIC1 embryonic hearts at E13.5 and E17.5, stained with hematoxylin and eosin. Note the cushion defect at E13.5 and the ventricular septal defect (VSD) at E17.5 in △H19/hIC1 hearts (yellow arrows). All E13.5 samples and E17.5 wild-type sample are male, and E17.5 △H19/+ and △H19/hIC1 samples are female. Scale bars = 500 µm. (E) Top: Representative cross-section of E17.5 △H19/hIC1 male placenta stained with hematoxylin and eosin. Black arrowheads indicate thrombi. Scale bar = 1 mm. Bottom: Number of the wild-type, male, and female +/hIC1 placentas with thrombi observed. (F) Relative total expression of H19 and Igf2 in E17.5 wild-type, △H19/+, +/hIC1, and △H19/hIC1 hearts (mean ± SD). (C and F) Each data point represents an individual conceptus from different litters. Statistics used are (B, C, and F) one-way ANOVA with Tukey’s multiple comparisons test and (E) Fisher’s exact test. *p<0.05, **p<0.01, ***p<0.001, ****p<0.0001, and ns = not significant.
Figure 4—figure supplement 1. Characterization of ΔH19 allele.
Figure 4—figure supplement 2. Supplementary data for rescue upon maternal ΔH19 transmission.
Paternal hIC1 defects are rescued by deletion of the maternal H19/Igf2 ICR
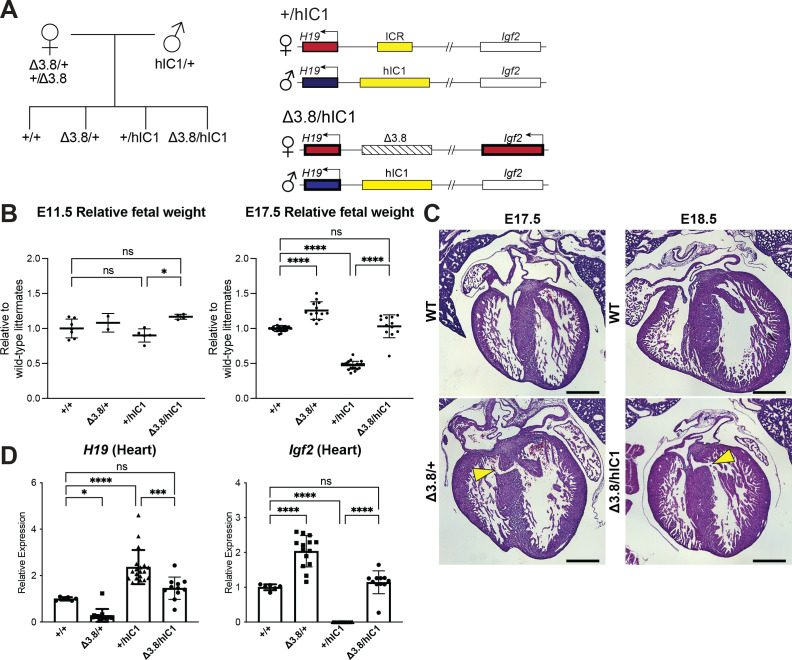
Finally, we utilized a previously published mouse model with a 3.8 kb deletion spanning the H19/Igf2 ICR (H19Δ3.8kb-5’H19; shortened as Δ3.8) to modulate both H19 and Igf2 expression (Thorvaldsen et al., 2002; Thorvaldsen et al., 2006). Absence of the maternal H19/Igf2 ICR activates the maternal Igf2 allele and reduces H19 expression. Thus, Igf2 expression from the maternal allele in Δ3.8/hIC1 embryos was expected to restore Igf2 levels (Figure 5A).
Figure 5. Restoring H19 and Igf2 expression utilizing maternal H19/Igf2 imprinting control region (ICR) deletion.
(A) A schematic representation of the offspring produced when △3.8 heterozygous female and hIC1/+ male mice are mated is depicted. △3.8/hIC1 embryos are expected to show activation of maternal Igf2 expression as well as paternal H19 expression. (B) Relative fetal weights of wild-type, △3.8/+, +/hIC1, and △3.8/hIC1 embryos at E11.5 and E17.5, normalized to the average body weight of wild-type littermates (mean ± SD). 2 E11.5 litters and 10 E17.5 litters are presented. (C) Representative cross-sections of E17.5 △3.8/+ and E18.5 △3.8/hIC1 embryonic hearts with ventricular septal defects (VSDs; yellow arrows), stained with hematoxylin and eosin. Sections from wild-type littermates are shown together for comparison. The E17.5 wild-type sample is male, and the rest are female. Scale bars = 500 µm. (D) Relative total expression of H19 and Igf2 in E17.5 wild-type, △3.8/+, +/hIC1, and △3.8/hIC1 hearts (mean ± SD). (B and D) Each data point represents an individual conceptus from different litters. One-way ANOVA with Tukey’s multiple comparisons test was used with *p<0.05, ***p<0.001, ****p<0.0001, and ns = not significant.
Figure 5—figure supplement 1. Supplementary data for rescue upon maternal Δ3.8 transmission.
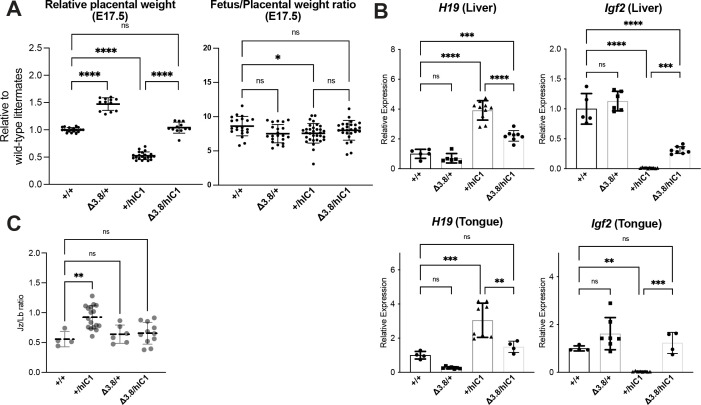
Crosses between heterozygous Δ3.8 females and heterozygous hIC1 males produced the expected Mendelian ratio of offspring with Δ3.8/hIC1 mice appearing fully viable. Both fetal and placental weights were not significantly different between Δ3.8/hIC1 and wild-type concepti at E17.5 (Figure 5B and Figure 5—figure supplement 1A), demonstrating full rescue of the lethality and growth restriction. However, a subset of Δ3.8/+ and Δ3.8/hIC1 embryonic hearts (three out of six Δ3.8/+ hearts and two out of five Δ3.8/hIC1 hearts) had VSDs, although the lesions in the IVS were smaller than those found in +/hIC1 hearts (Figure 5C). While Igf2 expression in the E17.5 Δ3.8/hIC1 hearts was restored to wild-type levels, normalization of H19 expression varied among embryos. Although not statistically significant in heart, Δ3.8/hIC1 embryos tended to have higher H19 expression compared to the wild-type littermates (Figure 5D and Figure 5—figure supplement 1B). These results suggest that the physiological levels of H19 and Igf2 expression are critical for normal cardiac development, and the variability in H19 rescue could help to explain the varying penetrance of the cardiac phenotype. No thrombi were detected in the Δ3.8/hIC1 placentas, and the placental morphology was normal with the junctional to labyrinth zone ratio not significantly different compared to wild-type (Figure 5—figure supplement 1C). In sum, restoring both H19 and Igf2 to near wild-type levels was necessary for the full rescue of the most severe pathologies of paternal hIC1 transmission.
Transcriptomic analysis of cardiac endothelial cells with various H19/Igf2 expression
Severe cardiac phenotypes associated with paternal hIC1 transmission prompted us to question the mechanism of how dysregulated H19/Igf2 causes such developmental defects. The paternal hIC1-associated cardiac phenotypes were observed as early as E12.5 when AV cushion fusion is delayed in developing hearts (Figure 2B), making E12.5 an optimal time point to identify the key pathways of valve development and cardiac septation that are disrupted by H19/Igf2 dysregulation. Endothelial and endothelial-derived cells comprise the majority population in the AV cushion and majority non-myocyte population of the ventricular septum at E12.5 (von Gise and Pu, 2012). Moreover, both H19 and Igf2 are strongly expressed in the endocardial layer of developing heart (García-Padilla et al., 2019). Therefore, transcriptomic analysis was performed on cardiac endothelial cells of each mutant.
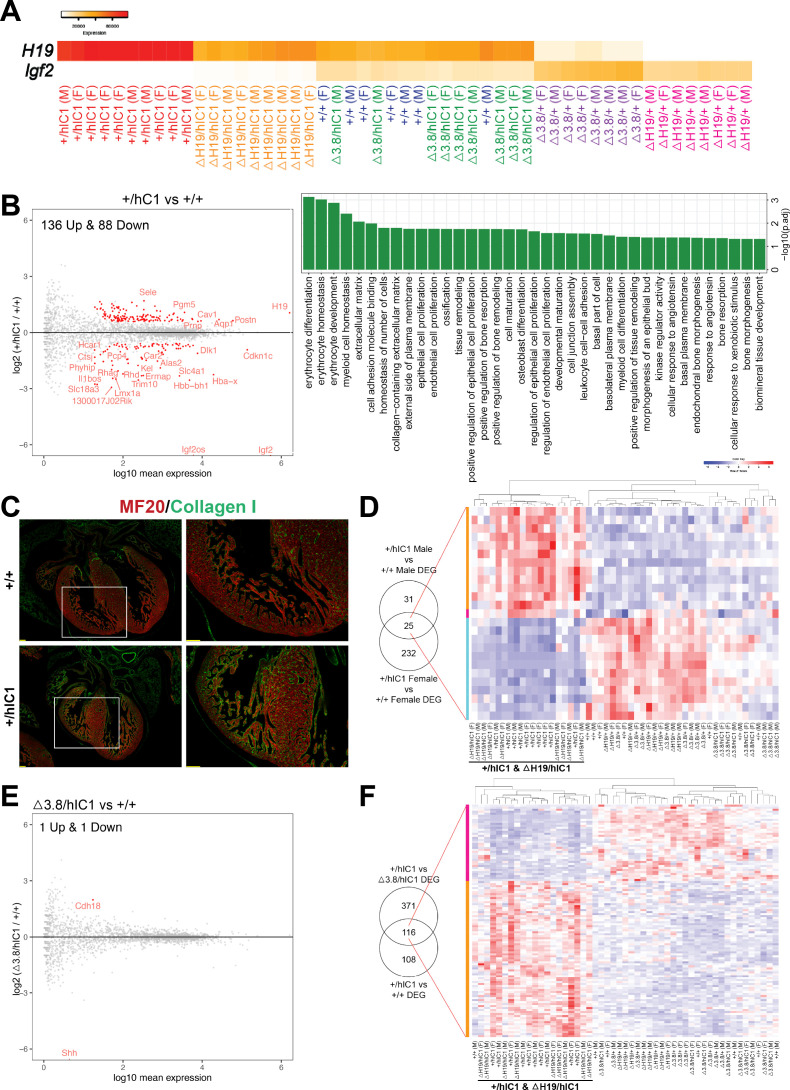
CD31+ cardiac endothelial cells from E12.5 wild-type, +/hIC1, ΔH19/+, ΔH19/hIC1, Δ3.8/+, and Δ3.8/hIC1 embryos were collected for RNA sequencing. First, we confirmed that these six groups show gradual alteration of H19/Igf2 expression (Figure 6A), which enabled us to generate multiple comparisons relative to H19 and Igf2 levels and potentially enabling attribution of phenotypes to H19 or Igf2. Notably, H19/Igf2 expression was indistinguishable in the wild-type and Δ3.8/hIC1 samples. Additionally, there were no sex-specific differences in H19/Igf2 expression across all the groups.
Figure 6. Transcriptomic analysis of E12.5 cardiac endothelial cells from wild-type and mutant embryos.
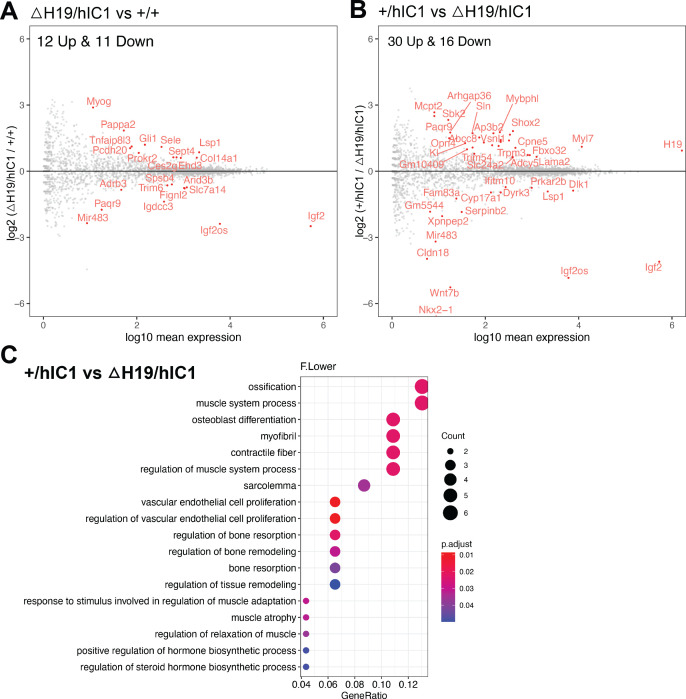
(A) A gradient H19 and Igf2 expression levels are depicted in E12.5 wild-type, +/hIC1, △H19/+, △H19/hIC1, △3.8/+, and △3.8/hIC1 cardiac endothelial cells. M: male and F: female. (B) Left: Comparison between +/hIC1 and the wild-type samples with a volcano plot shows 224 differentially expressed genes (DEGs) between +/hIC1 and the wild-type samples. Right: Gene ontology (GO) pathways that are enriched for the 224 DEGs. (C) Immunofluorescence staining for MF20 (red) and collagen (green) on E17.5 wild-type and +/hIC1 hearts. Images on the right are enlarged from the boxed area of images on the left. Scale bars = 100 µm. (D) Expression pattern of 25 genes that are differentially expressed in both male and female +/hIC1 samples is compared to wild-type. (E) A volcano plot represents two DEGs between △3.8/hIC1 and the wild-type samples. (F) Expression pattern of 116 genes that are commonly differentially expressed in +/hIC1 compared to the wild-type and △3.8/hIC1 samples.
Figure 6—figure supplement 1. Supplementary data for differential gene expression of +/hIC1 hearts.
Figure 6—figure supplement 2. Further RNA-seq analysis involving ΔH19/hIC1 endothelial cells.
Figure 6—figure supplement 3. Enrichment tests for BRIDEAU_IMPRINTED_GENES using gene set enrichment analysis (GSEA).
Figure 6—figure supplement 4. Further RNA-seq analysis utilizing Δ3.8/+ and Δ3.8/hIC1 endothelial cells.
Figure 6—figure supplement 5. Enrichment tests for HALLMARK_HYPOXIA, GROSS_HYPOXIA_VIA_HIF1A_DN using gene set enrichment analysis (GSEA).
To elucidate candidate genes and cellular processes in conferring the paternal hIC1-specific cardiac phenotypes, we compared +/hIC1 and wild-type samples. This comparison resulted in 224 significant differentially expressed genes (DEGs; Figure 6B, left). Gene ontology (GO) analysis revealed that pathways related to proliferation and remodeling of endothelial and epithelial cells are enriched in these DEGs (Figure 6B, right; Mi et al., 2019). Notably, genes involved in extracellular matrix (ECM) and specifically, collagen matrix production, were differentially enriched in E12.5 +/hIC1 samples; consistent with increased collagen in the E17.5 +/hIC1 hearts, as confirmed through immunofluorescence staining (Figure 6C, Figure 6—figure supplement 1A and B). Thus, differential gene expression in the presence of paternal hIC1 was evidenced by E12.5 and correlated with histological consequences persisting through gestation.
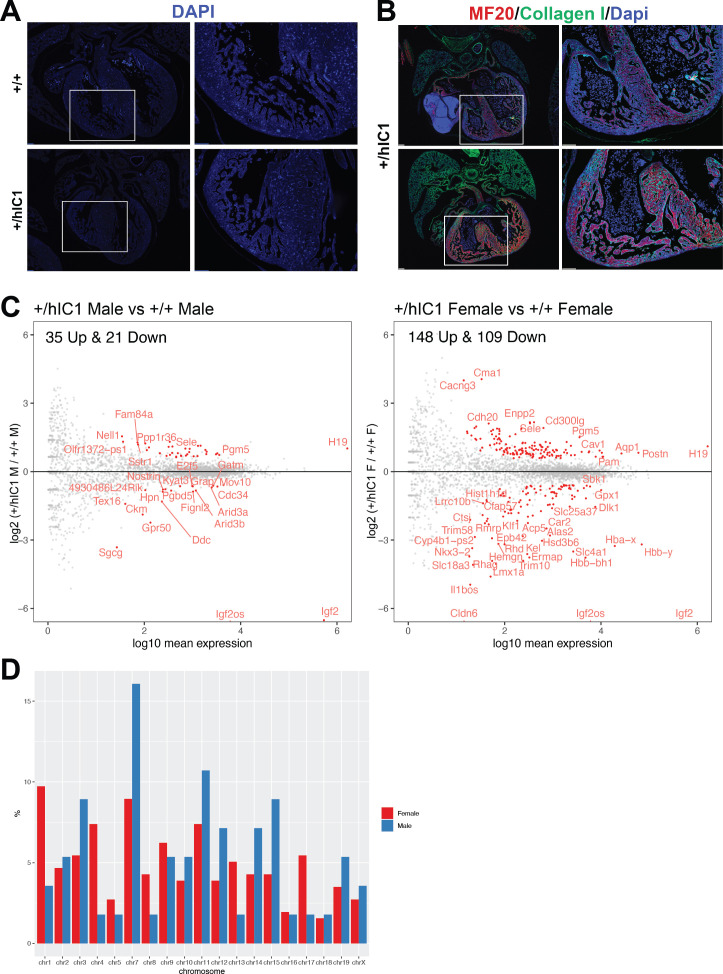
Because cardiac phenotypes were indistinguishable between males and females, we next used same-sex comparisons between +/hIC1 and wild-type to identify the hIC1-specific DEGs that are significant in both males and females (Figure 6D, left and Figure 6—figure supplement 1C). The 25 genes that overlapped between male and female +/hIC1-specific DEGs included Col14a1, which was upregulated in +/hIC1, emphasizing the importance of collagen-related ECM in hIC1-associated cardiac defects. The expression pattern of these 25 genes across all samples clustered +/hIC1 and ΔH19/hIC1, the two groups with the most severe cardiac defects and perinatal lethality (Figure 6D, right). Although the number of +/hIC1-specific DEGs largely differed between males and females, there was no sex-specific bias on the X chromosome (Figure 6—figure supplement 1D).
To separate the effect of Igf2 depletion from that of H19 overexpression, we utilized ΔH19/hIC1 samples. Consistent with previous observations from E17.5 hearts (Figure 4F), ΔH19/hIC1 endothelial cells exhibited low Igf2, but H19 expression was not significantly different from wild-type (Figure 6—figure supplement 2A). Thus, ΔH19/hIC1 samples were compared to +/hIC1 to clarify the sole effect of H19 overexpression. Here, 46 DEGs were identified (Figure 6—figure supplement 2B), which were enriched in vascular endothelial cell proliferation pathways (Figure 6—figure supplement 2C). Surprisingly, although physiologically similar to +/hIC1, the ΔH19/hIC1 transcriptome was quite different from that of +/hIC1. Compared to wild-type, ΔH19/hIC1 only had 23 DEGs (Figure 6—figure supplement 2A), in contrast to +/hIC1 showing more than 200 DEGs compared to wild-type (Figure 6B, left). This result underscores the overwhelming effect of increased H19 in transcriptomic regulation.
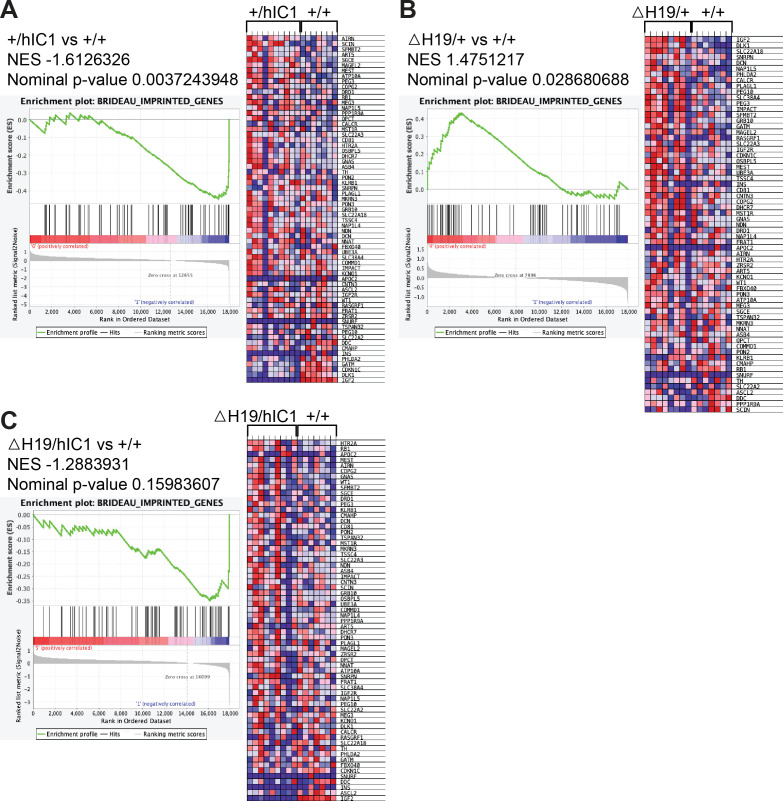
To identify the genes whose expression is solely affected by H19, we compared +/hIC1, ΔH19/hIC1, and ΔH19/+ endothelial cells. Among 224 genes that are differentially expressed in +/hIC1 endothelial cells relative to wild-type, 15 genes are also differentially expressed in ΔH19/hIC1 samples, suggesting that these 15 genes were affected by the loss of Igf2 rather than increased H19. Among the remaining 209 DEGs that are not altered in ΔH19/hIC1 samples, only Fgf10 and H19 were also differentially expressed in ΔH19/+ endothelial cells compared to wild-type. Fgf10, a key regulator of cardiac fibroblast development, mediates communication between cardiac progenitor cells and regulates cardiac myocyte proliferation (Hubert et al., 2018; Vega-Hernández et al., 2011). Consistently, Fgf10 null mouse embryos showed abnormal cardiac morphology with reduced heart size and thinned ventricular wall (Rochais et al., 2014; Vega-Hernández et al., 2011). In our samples, Fgf10 is upregulated when H19 is deleted and downregulated upon H19 overexpression, linking H19 and Fgf10 closely in the context of cardiac development. Additionally, gene set enrichment analysis revealed that the set of imprinted genes (BRIDEAU_IMPRINTED_GENES) including Cdkn1c, Dlk1, and Gatm was differentially enriched in +/hIC1 samples (Figure 6—figure supplement 3A; Mootha et al., 2003; Subramanian et al., 2005). The same set of genes was also differentially enriched in ΔH19/+ samples (Figure 6—figure supplement 3B), but not ΔH19/hIC1 (Figure 6—figure supplement 3C), underscoring a role for H19 as a master regulator of the imprinted gene network (Gabory et al., 2010).
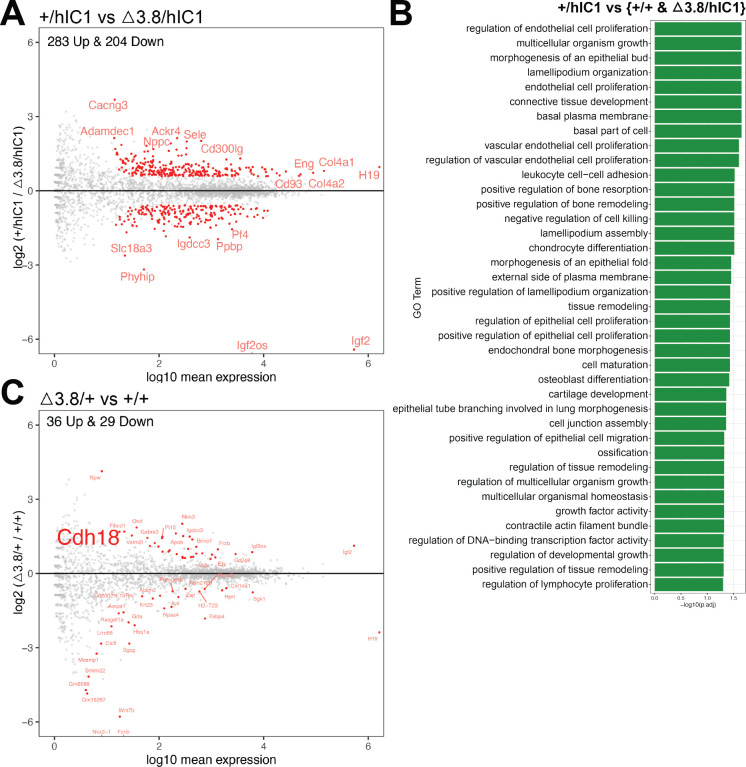
We then analyzed Δ3.8/hIC1 samples to identify cellular processes that are required to rescue the paternal hIC1-associated lethality, as Δ3.8/hIC1 mice are fully viable with occasionally observed VSD. Δ3.8/hIC1 had only two DEGs compared to wild-type (Figure 6E). However, the Shh expression was only detected in two wild-type samples, suggesting that Shh did not have significant affect in the development of our wild-type and Δ3.8/hIC1 cardiac endothelial cells at this stage. In contrast, 487 genes were differentially expressed in Δ3.8/hIC1 compared to +/hIC1 (Figure 6—figure supplement 4A). Within these DEGs, we wanted to clarify the genes that were likely involved in restoring viability. The 487 DEGs between +/hIC1 and Δ3.8/hIC1 were compared to the DEGs between +/hIC1 and wild-type to filter genes that are commonly affected in both comparisons (Figure 6F, left). GO analysis showed that the 116 overlapping genes are associated with endothelial/epithelial cell proliferation and remodeling (Figure 6—figure supplement 4B), emphasizing the importance of the proper regulation of these pathways in the rescued viability of Δ3.8/hIC1 embryos. The expression pattern of these 116 genes clustered +/hIC1 and ΔH19/hIC1, implicating these genes in the perinatal lethality characteristic of these two groups (Figure 6F, right).
Discussion
In this study, we report that the overexpression of H19 combined with Igf2 depletion leads to severe morphological defects in the heart and placenta, which are likely to be involved with the perinatal lethality and restricted growth of SRS mouse models. Genetically correcting H19 was not sufficient to fully rescue the developmental defects, indicating that the SRS-like phenotypes of paternal hIC1 transmission are not solely attributable to H19 overexpression. Unexpectedly, although moderately adjusting both H19 and Igf2 rescued the lethality, septal defects persisted in some of the Δ3.8/hIC1 embryos, suggesting that cardiac development is extremely sensitive to the dosage of H19 and Igf2. Our transcriptomic profiling of cardiac endothelial cells with various levels of H19 and Igf2 expression uncovers critical pathways driven by H19 and Igf2 that are important for cardiac structure formation. The result suggests that the regulation of ECM and proliferation of endothelial cells are tightly regulated by H19 and Igf2 and potentially responsible for the paternal hIC1-associated cardiac defects.
The function of H19 in cardiac development is understudied even though the expression of H19 is robust in the developing endocardium and epicardium throughout gestation (García-Padilla et al., 2019). Abnormal H19/Igf2 expression in +/hIC1 hearts disrupted AV cushion fusion, ventricular septation, and valve formation processes with variable penetrance. These events require properly established ECM, which accommodates endothelial-mesenchymal transition, cell proliferation, and cell-cell adhesion in developing hearts (Kruithof et al., 2007; Sullivan and Black, 2013; von Gise and Pu, 2012). In adult murine hearts, where H19 has been well implicated in cardiac fibrosis and remodeling (Greco et al., 2016; Hobuß et al., 2020; Lee et al., 2011; Wang et al., 2021), H19 overexpression led to increased ECM and fibrosis markers after myocardial injury, while deleting H19 resulted in downregulated ECM genes (Choong et al., 2019). In our +/hIC1 endothelial cells, the expression of several key ECM genes such as Periostin (Postn) (Snider et al., 2009; Sullivan and Black, 2013), Col14a1, and Adamts17 (Hubmacher and Apte, 2015) was significantly upregulated compared to wild-type cells. Combined with increased collagen in E17.5 +/hIC1 hearts (Figure 6C), we hypothesize that failing to establish proper ECM contributes significantly to the +/hIC1-associated cardiac defects during development. Additionally, regulators of cell proliferation, including E2f5, Trabd2b, and Septin4, and genes associated with inflammation such as Sele and Cd200 were also differentially expressed in +/hIC1 samples. Overall, this work provides some hints regarding the potential mechanism underlying how increased H19 expression disrupts normal cardiac development.
In contrast to the less well understood role for H19, Igf2 is the main growth factor in the developing ventricular wall. Similar to H19, Igf2 is highly expressed in the developing cardiac endocardium and epicardium from early gestation (Shen et al., 2015) before ventricular septation is completed (Savolainen et al., 2009). Deletion of Igf2 and its receptors caused decreased cardiomyocyte proliferation and ventricular hypoplasia, suggesting that Igf2 is the major regulator of ventricular wall thickening (Li et al., 2011; Shen et al., 2015). Additionally, the IVS is comprised of both mesenchymal and muscular components (Penny and Vick, 2011; Spicer et al., 2014), and a reduction in cardiomyocyte proliferation can lead to VSD (Snider and Conway, 2011). Thus, the lack of Igf2, a growth promoter for cardiomyocytes, could have contributed to the septal defects observed in +/hIC1 and ΔH19/hIC1 hearts. However, the thinned myocardium in Igf2 knockout mouse embryos was resolved by birth, resulting in normal cardiac morphology in neonates (Shen et al., 2020). In contrast, ventricular wall thinning and septal defects in +/hIC1 and ΔH19/hIC1 hearts were aggravated toward the end of gestation, indicating that these phenotypes are not exclusively attributable to the loss of Igf2 expression.
Recovery of Igf2 expression in Δ3.8/hIC1 hearts rescued ventricular hypoplasia, consistent with previous findings (Li et al., 2011; Shen et al., 2015). In contrast, septal defects persist in some Δ3.8/+ and Δ3.8/hIC1 embryos. Because Igf2 expression varied substantially among Δ3.8/+ and Δ3.8/hIC1 hearts (Figure 5D), we hypothesize that the varying penetrance of septal defects in these hearts reflects the range of H19/Igf2 levels. The only upregulated gene in Δ3.8/hIC1 endothelial cells compared to wild-type was Cadherin 18 (Cdh18) (Figure 6E), which was also upregulated in Δ3.8/+ samples compared to wild-type (Figure 6—figure supplement 4C) and clinically reported to be mutated in congenital heart defects (CHDs) including VSD (Chen et al., 2018; Soemedi et al., 2012). Although we and others showed that restoring Igf2 successfully rescues the growth restriction in SRS-like mouse models (Han et al., 2010; Liao et al., 2021), septal defects caused by H19 and Igf2 dysregulation are reported for the first time in this study. Our data provide evidence that ventricular septation may be regulated separately from the ventricular wall thickening and that both events are extremely sensitive to the level of H19 and Igf2 expression. In humans, VSDs were found in SRS patients with IC1 hypomethylation (Ghanim et al., 2013) and a patient carrying chromosomal gain of chr11p15 (Serra et al., 2012). Thus, the VSD observed in our mouse models nicely models the SRS-associated CHD in human patients. It should be noted, however, that mice are often more susceptible to VSDs than humans. Mice with VSDs show a higher neonatal mortality rate, possibly due to the higher heart rates and relatively larger size of VSD lesions (Snider and Conway, 2011). Additionally, cardiac defects that are lethal in mice can lead to spontaneous miscarriages in humans due to longer human gestation, making it difficult to observe human infants with similar defects.
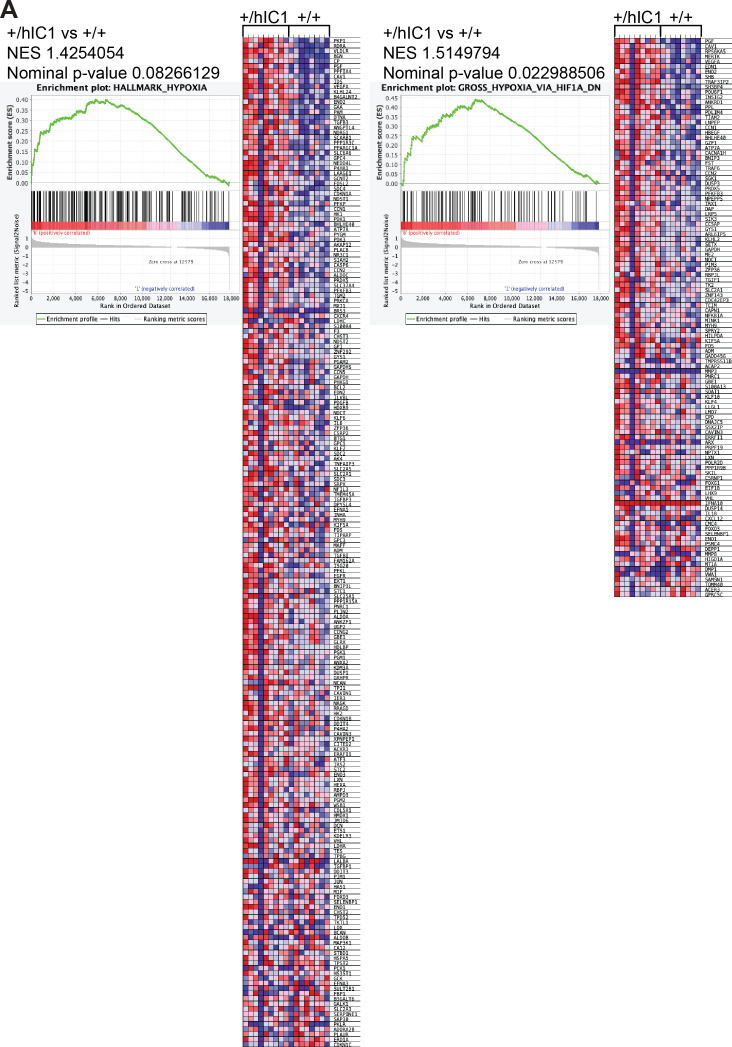
Linked through fetoplacental blood circulation, the heart and placenta are closely connected under the cardiac-placental axis, which is crucial for fetal growth and viability (Barak et al., 2019; Maslen, 2018). Both organs are responsible for supplying nutrients and oxygen for developing fetuses, and placental and cardiac defects are often coupled in mouse models (Perez-Garcia et al., 2018) and humans (Matthiesen et al., 2016; Rychik et al., 2018). Placental maintenance of a normoxic fetal environment is vital for cardiac morphogenesis, and hypoxia can lead to severe defects emerging especially in cushions and septa (Dor et al., 2001). Epicardial Igf2 expression in developing ventricles is induced by a normoxic environment that is dependent on the placental function (Shen et al., 2015), while H19 is upregulated under hypoxic conditions in mouse cardiomyocytes (Choong et al., 2019). This suggests that H19 and Igf2 are important mediators of the interaction between heart and placenta. Consistent with previous reports, gene sets of which expression is altered under hypoxic conditions (HALLMARK_HYPOXIA, GROSS_HYPOXIA_VIA_HIF1A_DN) are differentially enriched in our +/hIC1 endothelial cells compared to wild-type (Figure 6—figure supplement 5). As the heart and placenta are responsible for meeting the fetal demand for nutrients and oxygen, the malfunction of these two organs would severely constrain embryonic growth. Therefore, the precise role of H19 and Igf2 in cardiac-placental communication needs to be clarified to understand how the SRS-related growth restriction is induced by IC1 hypomethylation.
The labyrinth, where +/hIC1 placentas show abnormal vasculature morphology and thrombosis, serves as a prime location for maternal-fetal blood exchange (Woods et al., 2018). Placental thrombosis can be caused by defective labyrinth integrity, and diminished labyrinth function could limit the nutritional and oxygen supply for a fetus, which can, in turn, lead to hypoxia and growth restriction. Both H19 and Igf2 are highly expressed in fetoplacental endothelial cells in the labyrinth (Aykroyd et al., 2022; Sandovici et al., 2022). Genetically depleting Igf2 expression in the epiblast lineage led to decreased labyrinth size and caused the formation of thrombi in the labyrinth, although the lesions were smaller in size than those observed in +/hIC1 placentas (Sandovici et al., 2022). Depletion of the placental-specific Igf2 transcript in mice resulted in a smaller labyrinth and fetal growth restriction (Constância et al., 2002; Sibley et al., 2004), although these mice showed an increased fetal to placental weight ratio, which was decreased in +/hIC1 mice. This contrasting result could be explained by the effect of the increased H19 expression in +/hIC1 mice. H19 regulates vascular endothelial growth factor in human endothelial cells in vitro (Conigliaro et al., 2015), which is involved in placental angiogenesis, specifically for the branching of fetoplacental vessels beginning at mid-gestation (Woods et al., 2018). Additionally, H19 is highly expressed in trophoblasts (Marsh and Blelloch, 2020; Poirier et al., 1991), and disrupted trophoblast development leads to defective vascular branching in the labyrinth and restricted fetal growth (Ueno et al., 2013). Thus, it is possible that the morphological anomalies observed in the +/hIC1 placenta are exaggerated by abnormal H19 expression in trophoblasts. Transcriptomic analysis of fetoplacental endothelial cells from our mouse models would help us understand the role of H19/Igf2 in placental development. Moreover, generating a tissue-specific hIC1 mouse model, if possible, would allow us to determine the causal relationship between cardiac and placental phenotypes.
In summary, we provide evidence that the proper dosage of H19 and Igf2 is essential for normal cardiac and placental development. Investigation of the role of H19 and Igf2 in the cardiac-placental axis will enable a better understanding of how paternal hIC1 transmission leads to the SRS-like growth restriction and perinatal lethality. As many patients with SRS exhibit DNA methylation mosaicism, the distribution of the epimutation, which reflects the severity of patient symptoms, varies. This work provides insight into identifying organs that are most sensitive to H19 and Igf2 dysregulation, which would allow us to develop early intervention methods for critical SRS pathologies with such variabilities.
Materials and methods
Animal studies
All studies were approved by the Institutional Animal Care and Use Committee at the University of Pennsylvania. hIC1 (Hur et al., 2016) and Δ3.8 (Thorvaldsen et al., 2002; Thorvaldsen et al., 2006) mouse models were previously described. Timed breeding was performed as previously described (SanMiguel et al., 2018). Vaginal sperm plugs were checked to calculate the age, and the day of the plug was marked as E0.5. Visual staging confirmed the embryonic days at the time of dissection. All mice were maintained on C57BL/6 background for more than 10 generations if not noted otherwise.
Generation of ΔH19 allele
Two pairs of gRNA targeting the H19 gene are listed in Supplementary file 1. gRNA was prepared following a protocol from Yang et al., 2014 with modifications. px335 plasmid (Addgene, Watertown, MA, USA) was PCR amplified using Phusion high-fidelity DNA polymerase (New England Biolabs, Ipswich, MA, USA) and the primer set listed in Supplementary file 1. ~117 bp PCR product was gel-purified using the Gel Extraction kit (Qiagen, Hilden, Germany) according to the manufacturer’s instruction. Using the gel-purified product as template, in vitro transcription of gRNA was setup using T7 High Yield RNA Synthesis kit (New England Biolabs) according to manufacturer’s instructions. Transcribed gRNA was purified using the MEGAclear kit (Life Technologies, Carlsbad, CA, USA) according to manufacturer’s instructions. 50 ng/μl left and right single guide RNA (sgRNA) together with 100 ng/μl Cas9 mRNA was injected per zygote stage embryo by the Transgenic and Chimeric Mouse Facility at the University of Pennsylvania. The targeted allele was validated using Southern blot as previously described (Thorvaldsen et al., 1998) and PCR and sequencing across junctions of ΔH19 alleles. Obtained chimeras and germ line transmission animals were PCR-genotyped for the ΔH19 allele using primers (Supplementary file 1).
Genotyping
Mouse genomic DNA for PCR genotyping was isolated from each animal as previously described (SanMiguel et al., 2018). Primers used for sex genotyping and genotyping of hIC1, ΔH19, and Δ3.8 alleles are listed in Supplementary file 1. For all genotypes, the maternal allele is listed first and the paternal allele second.
Gene expression analysis
Mouse tissues were ground using pestles, syringes, and needles in either TRIzol (Thermo Fisher scientific, Waltham, MA, USA) or RLP buffer included in RNeasy Mini kit (Qiagen, Hilden, Germany). RNA was isolated according to the manufacturer’s instructions. cDNA synthesis, quantitative reverse transcription (qRT)-PCR, and allele-specific expression analysis was performed as previously described (Hur et al., 2016). Primers and PCR conditions are listed in Supplementary file 1. Total expression levels of Mir675-3p and Mir675-5p were determined relative to snoRNA202 by using a separate RT kit (TaqMan MicroRNA Reverse Transcription Kit, Thermo Fisher Scientific), qRT-PCR primers (Assay Id 001232, 001941, 001940, Thermo Fisher Scientific), and a PCR master mix (TaqMan Universal PCR Master Mix, catalog number 4304437, Thermo Fisher Scientific) according to manufacturer’s protocol.
Histological analysis
Mouse heart and placenta samples were collected in cold PBS, fixed overnight in 4% paraformaldehyde or 10% phosphate-buffered formalin and processed through ethanol dehydration. Tissues were paraffin-embedded and sectioned for further staining analysis. Hematoxylin and eosin staining was performed using a standard protocol. Immunohistochemistry for MF20 (Developmental Studies Hybridoma Bank, Iowa City, IA, USA) and Collagen I (cat# ab34710, Abcam, Cambridge, UK) was performed with primary antibody incubations overnight at 4°C. Prior to antibody incubation, antigen retrieval with citrate buffer was performed, followed by a 1 hr block in 10% normal serum. DAPI (cat#32670–5 MG-F, Sigma-Aldrich, St. Louis, MO, USA) was used as a counter stain, and slides were mounted with VECTASHILD (Vector, Burlingame, CA, USA). Images were taken on a Leica DMi8S widefield microscope. Placental CD34 staining and PAS staining was previously described (Vrooman et al., 2020). The thickness of ventricular wall was measured on hematoxylin-eosin-stained heart sections using Adobe Photoshop. A minimum of three distinct sections were quantified for each mouse of each genotype in a blinded manner. Placental Jz/Lb ratio was measured using FIJI (ImageJ v2.0.0, Schindelin et al., 2012) in a blinded manner. CD34 stained placental sections were digitally scanned using Aperio VERSA 200 platform in Comparative Pathology Core at School of Veterinary Medicine at the University of Pennsylvania. Images were analyzed via Aperio Microvessel Analysis algorithm as previously described (Vrooman et al., 2020).
RNA sequencing library preparation and analysis
E12.5 hearts were lysed with Collagenase (Sigma-Aldrich), Dispase II (Sigma-Aldrich), and DNase I (Sigma-Aldrich). Cardiac endothelial cells were collected using MACS CD31 microbeads (Miltenyi Biotec, Bergisch Gladbach, Germany), and RNA was isolated using RNeasy Micro kit (Qiagen). After confirming RNA integrity using Bioanalyzer (Agilent Technologies, Santa Clara, CA, USA), mRNA library was generated from 25 ng RNA using NEBNext Poly(A) mRNA Magnetic Isolation Module and Ultra II RNA Library Prep Kit (New England Biolabs). Library quality was assessed by Bioanalyzer (Agilent Technologies) and TapeStation (Agilent Technologies). Sequencing was performed on NovaSeq 6000 (Illumina, San Diego, CA, USA). Quality of raw fastq reads was assessed using FastQC version 0.11.5 (Andrews et al., 2015). Reads were aligned to the GRCm38/mm10 reference using STAR version 2.4.0i with default parameters and maximum fragment size of 2000 bp (Dobin et al., 2013). Properly paired primary alignments were retained for downstream analysis using Samtools version 1.9. Count matrices were generated using FeatureCounts version 1.6.2 against RefSeq gene annotation and read into DESeq2 (Love et al., 2014) to perform normalization and statistical analysis.
Statistical analysis
Differences between two groups were evaluated using Student’s t-test. For three or more groups, ordinary one-way ANOVA, followed up with Tukey’s multiple comparisons test, was used. Two-sided Fisher’s exact test was used to compare the occurrence of the thrombi in the wild-type and +/hIC1 placentas. All analyses were performed using GraphPad Prism software. *p<0.05, **p<0.01, ***p<0.001, ****p<0.0001, and n.s.=not significant.
Acknowledgements
Authors would like to express gratitude to Christopher Krapp, Lisa Vrooman, Joel Rurik, Olga Smirnova, Jonathan Schug, Klaus Kaestner, and Colin Conine for their guidance on this study. This work was supported by National Institutes of Health grant GM-051279–28 and R35HL140018-05, National Institute of Arthritis and Musculoskeletal and Skin Diseases grant 5T32AR053461.
Funding Statement
The funders had no role in study design, data collection and interpretation, or the decision to submit the work for publication.
Contributor Information
Marisa S Bartolomei, Email: bartolom@pennmedicine.upenn.edu.
Wei Yan, University of California, Los Angeles, United States.
Marianne E Bronner, California Institute of Technology, United States.
Funding Information
This paper was supported by the following grants:
National Institutes of Health GM-051279-28 to Marisa S Bartolomei.
National Institutes of Health R35HL140018-05 to Jonathan A Epstein.
National Institute of Arthritis and Musculoskeletal and Skin Diseases 5T32AR053461 to Jonathan A Epstein.
Additional information
Competing interests
No competing interests declared.
No competing interests declared.
Author contributions
Conceptualization, Resources, Data curation, Software, Formal analysis, Validation, Investigation, Visualization, Methodology, Writing – original draft, Project administration, Writing – review and editing.
Resources, Data curation, Funding acquisition, Validation, Investigation, Visualization, Methodology, Project administration, Writing – review and editing.
Conceptualization, Resources, Data curation, Investigation, Methodology.
Conceptualization, Resources, Data curation, Validation, Investigation, Visualization, Methodology, Project administration, Writing – review and editing.
Resources, Validation, Investigation.
Data curation, Software, Formal analysis, Writing – review and editing.
Resources, Data curation, Visualization, Methodology.
Validation, Investigation, Writing – review and editing.
Resources, Methodology, Writing – review and editing.
Resources, Supervision, Funding acquisition, Project administration, Writing – review and editing.
Conceptualization, Resources, Data curation, Supervision, Funding acquisition, Visualization, Methodology, Writing – original draft, Project administration, Writing – review and editing.
Ethics
All of the animals were handled according to approved institutional animal care and use committee (IACUC) protocols (#804211) of the University of Pennsylvania. All the animals were euthanized by carbon dioxide inhalation as recommended by National Institutes of Health. As a secondary method of euthanasia, either decapitation or cervical dislocation was performed, and every effort was made to minimize suffering.
Additional files
Data availability
Sequencing data have been deposited in GEO database under the accession number GSE199377.
The following dataset was generated:
Chang S, Fulmer D, Hur SK, Thorvaldsen JL, Li L, Lan Y, Rhon-Calderon EA, Chen X, Epstein JA, Bartolomei MS. 2022. Dysregulated H19/Igf2 expression disrupts cardiac-placental axis during development of Silver Russell Syndrome-like mouse models. NCBI Gene Expression Omnibus. GSE199377
References
- Abi Habib W, Brioude F, Azzi S, Salem J, Das Neves C, Personnier C, Chantot-Bastaraud S, Keren B, Le Bouc Y, Harbison MD, Netchine I. 11P15 ICR1 partial deletions associated with igf2/H19 DMR hypomethylation and silver-russell syndrome. Human Mutation. 2017;38:105–111. doi: 10.1002/humu.23131. [DOI] [PubMed] [Google Scholar]
- Andrews S, Krueger F, Seconds-Pichon A, Biggins F, Wingett S. FastQC. A Quality Control Tool for High Throughput Sequence Data. Babraham Bioinformatics. Babraham Institute; 2015. [Google Scholar]
- Aykroyd BRL, Tunster SJ, Sferruzzi-Perri AN. Loss of imprinting of the igf2-H19 ICR1 enhances placental endocrine capacity via sex-specific alterations in signalling pathways in the mouse. Development. 2022;149:dev199811. doi: 10.1242/dev.199811. [DOI] [PMC free article] [PubMed] [Google Scholar]
- Barak Y, Hemberger M, Sucov HM. Phases and mechanisms of embryonic cardiomyocyte proliferation and ventricular wall morphogenesis. Pediatric Cardiology. 2019;40:1359–1366. doi: 10.1007/s00246-019-02164-6. [DOI] [PMC free article] [PubMed] [Google Scholar]
- Barlow DP, Bartolomei MS. Genomic imprinting in mammals. Cold Spring Harbor Perspectives in Biology. 2014;6:a018382. doi: 10.1101/cshperspect.a018382. [DOI] [PMC free article] [PubMed] [Google Scholar]
- Begemann M, Zirn B, Santen G, Wirthgen E, Soellner L, Büttel HM, Schweizer R, van Workum W, Binder G, Eggermann T. Paternally inherited IGF2 mutation and growth restriction. The New England Journal of Medicine. 2015;373:349–356. doi: 10.1056/NEJMoa1415227. [DOI] [PubMed] [Google Scholar]
- Borensztein M, Viengchareun S, Montarras D, Journot L, Binart N, Lombès M, Dandolo L. Double myod and IGF2 inactivation promotes brown adipose tissue development by increasing prdm16 expression. FASEB Journal. 2012;26:4584–4591. doi: 10.1096/fj.12-208496. [DOI] [PubMed] [Google Scholar]
- Chang S, Bartolomei MS. Modeling human epigenetic disorders in mice: beckwith-wiedemann syndrome and silver-russell syndrome. Disease Models & Mechanisms. 2020;13:dmm044123. doi: 10.1242/dmm.044123. [DOI] [PMC free article] [PubMed] [Google Scholar]
- Chen CP, Chang SY, Lin CJ, Chern SR, Wu PS, Chen SW, Lai ST, Chuang TY, Chen WL, Yang CW, Wang W. Prenatal diagnosis of a familial 5p14.3-p14.1 deletion encompassing CDH18, CDH12, PMCHL1, PRDM9 and CDH10 in a fetus with congenital heart disease on prenatal ultrasound. Taiwanese Journal of Obstetrics and Gynecology. 2018;57:734–738. doi: 10.1016/j.tjog.2018.08.023. [DOI] [PubMed] [Google Scholar]
- Choong OK, Chen CY, Zhang J, Lin JH, Lin PJ, Ruan SC, Kamp TJ, Hsieh PCH. Hypoxia-induced H19/YB-1 cascade modulates cardiac remodeling after infarction. Theranostics. 2019;9:6550–6567. doi: 10.7150/thno.35218. [DOI] [PMC free article] [PubMed] [Google Scholar]
- Conigliaro A, Costa V, Lo Dico A, Saieva L, Buccheri S, Dieli F, Manno M, Raccosta S, Mancone C, Tripodi M, De Leo G, Alessandro R. Cd90+ liver cancer cells modulate endothelial cell phenotype through the release of exosomes containing H19 lncrna. Molecular Cancer. 2015;14:1–11. doi: 10.1186/s12943-015-0426-x. [DOI] [PMC free article] [PubMed] [Google Scholar]
- Constância M, Hemberger M, Hughes J, Dean W, Ferguson-Smith A, Fundele R, Stewart F, Kelsey G, Fowden A, Sibley C, Reik W. Placental-specific IGF-II is a major modulator of placental and fetal growth. Nature. 2002;417:945–948. doi: 10.1038/nature00819. [DOI] [PubMed] [Google Scholar]
- DeChiara TM, Robertson EJ, Efstratiadis A. Parental imprinting of the mouse insulin-like growth factor II gene. Cell. 1991;64:849–859. doi: 10.1016/0092-8674(91)90513-x. [DOI] [PubMed] [Google Scholar]
- Dobin A, Davis CA, Schlesinger F, Drenkow J, Zaleski C, Jha S, Batut P, Chaisson M, Gingeras TR. Star: ultrafast universal RNA-seq aligner. Bioinformatics. 2013;29:15–21. doi: 10.1093/bioinformatics/bts635. [DOI] [PMC free article] [PubMed] [Google Scholar]
- Dor Y, Camenisch TD, Itin A, Fishman GI, McDonald JA, Carmeliet P, Keshet E. A novel role for VEGF in endocardial cushion formation and its potential contribution to congenital heart defects. Development. 2001;128:1531–1538. doi: 10.1242/dev.128.9.1531. [DOI] [PubMed] [Google Scholar]
- Drewell RA, Brenton JD, Ainscough JFX, Barton SC, Hilton KJ, Arney KL, Dandolo L, Surani MA. Deletion of a silencer element disrupts H19 imprinting independently of a DNA methylation epigenetic switch. Development. 2000;127:3419–3428. doi: 10.1242/dev.127.16.3419. [DOI] [PubMed] [Google Scholar]
- Eggermann T, Buiting K, Temple IK. Clinical utility gene card for: silver-russell syndrome. European Journal of Human Genetics. 2011;19:e202. doi: 10.1038/ejhg.2010.202. [DOI] [PMC free article] [PubMed] [Google Scholar]
- Eisenberg LM, Markwald RR. Molecular regulation of atrioventricular valvuloseptal morphogenesis. Circulation Research. 1995;77:1–6. doi: 10.1161/01.res.77.1.1. [DOI] [PubMed] [Google Scholar]
- Engel N, West AG, Felsenfeld G, Bartolomei MS. Antagonism between DNA hypermethylation and enhancer-blocking activity at the H19 DMD is uncovered by cpg mutations. Nature Genetics. 2004;36:883–888. doi: 10.1038/ng1399. [DOI] [PubMed] [Google Scholar]
- Esquiliano DR, Guo W, Liang L, Dikkes P, Lopez MF. Placental glycogen stores are increased in mice with H19 null mutations but not in those with insulin or IGF type 1 receptor mutations. Placenta. 2009;30:693–699. doi: 10.1016/j.placenta.2009.05.004. [DOI] [PMC free article] [PubMed] [Google Scholar]
- Freschi A, Hur SK, Valente FM, Ideraabdullah FY, Sparago A, Gentile MT, Oneglia A, Di Nucci D, Colucci-D’Amato L, Thorvaldsen JL, Bartolomei MS, Riccio A, Cerrato F. Tissue-specific and mosaic imprinting defects underlie opposite congenital growth disorders in mice. PLOS Genetics. 2018;14:e1007243. doi: 10.1371/journal.pgen.1007243. [DOI] [PMC free article] [PubMed] [Google Scholar]
- Freschi A, Del Prete R, Pignata L, Cecere F, Manfrevola F, Mattia M, Cobellis G, Sparago A, Bartolomei MS, Riccio A, Cerrato F. The number of the CTCF binding sites of the H19/IGF2:IG-DMR correlates with DNA methylation and expression imprinting in a humanized mouse model. Human Molecular Genetics. 2021;30:1509–1520. doi: 10.1093/hmg/ddab132. [DOI] [PMC free article] [PubMed] [Google Scholar]
- Gabory A, Ripoche MA, Le Digarcher A, Watrin F, Ziyyat A, Forné T, Jammes H, Ainscough JFX, Surani MA, Journot L, Dandolo L. H19 acts as a trans regulator of the imprinted gene network controlling growth in mice. Development. 2009;136:3413–3421. doi: 10.1242/dev.036061. [DOI] [PubMed] [Google Scholar]
- Gabory A, Jammes H, Dandolo L. The H19 locus: role of an imprinted non-coding RNA in growth and development. BioEssays. 2010;32:473–480. doi: 10.1002/bies.200900170. [DOI] [PubMed] [Google Scholar]
- García-Padilla C, Domínguez JN, Aránega AE, Franco D. Differential chamber-specific expression and regulation of long non-coding rnas during cardiac development. Biochimica et Biophysica Acta. Gene Regulatory Mechanisms. 2019;1862:194435. doi: 10.1016/j.bbagrm.2019.194435. [DOI] [PubMed] [Google Scholar]
- Ghanim M, Rossignol S, Delobel B, Irving M, Miller O, Devisme L, Plennevaux JL, Lucidarme-Rossi S, Manouvrier S, Salah A, Chivu O, Netchine I, Vincent-Delorme C. Possible association between complex congenital heart defects and 11p15 hypomethylation in three patients with severe silver-russell syndrome. American Journal of Medical Genetics. Part A. 2013;161A:572–577. doi: 10.1002/ajmg.a.35691. [DOI] [PubMed] [Google Scholar]
- Gicquel C, Rossignol S, Cabrol S, Houang M, Steunou V, Barbu V, Danton F, Thibaud N, Le Merrer M, Burglen L, Bertrand AM, Netchine I, Le Bouc Y. Epimutation of the telomeric imprinting center region on chromosome 11p15 in silver-russell syndrome. Nature Genetics. 2005;37:1003–1007. doi: 10.1038/ng1629. [DOI] [PubMed] [Google Scholar]
- Greco S, Zaccagnini G, Perfetti A, Fuschi P, Valaperta R, Voellenkle C, Castelvecchio S, Gaetano C, Finato N, Beltrami AP, Menicanti L, Martelli F. Long noncoding RNA dysregulation in ischemic heart failure. Journal of Translational Medicine. 2016;14:1–14. doi: 10.1186/s12967-016-0926-5. [DOI] [PMC free article] [PubMed] [Google Scholar]
- Haley VL, Barnes DJ, Sandovici I, Constancia M, Graham CF, Pezzella F, Bühnemann C, Carter EJ, Hassan AB. Igf2 pathway dependency of the trp53 developmental and tumour phenotypes. EMBO Molecular Medicine. 2012;4:705–718. doi: 10.1002/emmm.201101105. [DOI] [PMC free article] [PubMed] [Google Scholar]
- Han L, Szabó PE, Mann JR. Postnatal survival of mice with maternal duplication of distal chromosome 7 induced by a igf2/H19 imprinting control region lacking insulator function. PLOS Genetics. 2010;6:e1000803. doi: 10.1371/journal.pgen.1000803. [DOI] [PMC free article] [PubMed] [Google Scholar]
- Harris LK, Westwood M. Biology and significance of signalling pathways activated by IGF-II. Growth Factors. 2012;30:1–12. doi: 10.3109/08977194.2011.640325. [DOI] [PubMed] [Google Scholar]
- Hobuß L, Foinquinos A, Jung M, Kenneweg F, Xiao K, Wang Y, Zimmer K, Remke J, Just A, Nowak J, Schmidt A, Pich A, Mazlan S, Reamon-Buettner SM, Ramos GC, Frantz S, Viereck J, Loyer X, Boulanger C, Wollert KC, Fiedler J, Thum T. Pleiotropic cardiac functions controlled by ischemia-induced lncrna H19. Journal of Molecular and Cellular Cardiology. 2020;146:43–59. doi: 10.1016/j.yjmcc.2020.07.001. [DOI] [PubMed] [Google Scholar]
- Hubert F, Payan SM, Rochais F. FGF10 signaling in heart development, homeostasis, disease and repair. Frontiers in Genetics. 2018;9:599. doi: 10.3389/fgene.2018.00599. [DOI] [PMC free article] [PubMed] [Google Scholar]
- Hubmacher D, Apte SS. ADAMTS proteins as modulators of microfibril formation and function. Matrix Biology. 2015;47:34–43. doi: 10.1016/j.matbio.2015.05.004. [DOI] [PMC free article] [PubMed] [Google Scholar]
- Hur SK, Freschi A, Ideraabdullah F, Thorvaldsen JL, Luense LJ, Weller AH, Berger SL, Cerrato F, Riccio A, Bartolomei MS. Humanized H19/igf2 locus reveals diverged imprinting mechanism between mouse and human and reflects silver-russell syndrome phenotypes. PNAS. 2016;113:10938–10943. doi: 10.1073/pnas.1603066113. [DOI] [PMC free article] [PubMed] [Google Scholar]
- Keniry A, Oxley D, Monnier P, Kyba M, Dandolo L, Smits G, Reik W. The H19 lincrna is a developmental reservoir of mir-675 that suppresses growth and IGF1R. Nature Cell Biology. 2012;14:659–665. doi: 10.1038/ncb2521. [DOI] [PMC free article] [PubMed] [Google Scholar]
- Kochilas LK, Li J, Jin F, Buck CA, Epstein JA. P57Kip2 expression is enhanced during mid-cardiac murine development and is restricted to trabecular myocardium. Pediatric Research. 1999;45:635–642. doi: 10.1203/00006450-199905010-00004. [DOI] [PubMed] [Google Scholar]
- Kruithof BPT, Krawitz SA, Gaussin V. Atrioventricular valve development during late embryonic and postnatal stages involves condensation and extracellular matrix remodeling. Developmental Biology. 2007;302:208–217. doi: 10.1016/j.ydbio.2006.09.024. [DOI] [PubMed] [Google Scholar]
- Lee JH, Gao C, Peng G, Greer C, Ren S, Wang Y, Xiao X. Analysis of transcriptome complexity through RNA sequencing in normal and failing murine hearts. Circulation Research. 2011;109:1332–1341. doi: 10.1161/CIRCRESAHA.111.249433. [DOI] [PMC free article] [PubMed] [Google Scholar]
- Li P, Cavallero S, Gu Y, Chen THP, Hughes J, Hassan AB, Brüning JC, Pashmforoush M, Sucov HM. Igf signaling directs ventricular cardiomyocyte proliferation during embryonic heart development. Development. 2011;138:1795–1805. doi: 10.1242/dev.054338. [DOI] [PMC free article] [PubMed] [Google Scholar]
- Liao J, Zeng TB, Pierce N, Tran DA, Singh P, Mann JR, Szabó PE. Prenatal correction of IGF2 to rescue the growth phenotypes in mouse models of beckwith-wiedemann and silver-russell syndromes. Cell Reports. 2021;34:108729. doi: 10.1016/j.celrep.2021.108729. [DOI] [PMC free article] [PubMed] [Google Scholar]
- Lopez MF, Dikkes P, Zurakowski D, Villa-Komaroff L. Insulin-like growth factor II affects the appearance and glycogen content of glycogen cells in the murine placenta. Endocrinology. 1996;137:2100–2108. doi: 10.1210/endo.137.5.8612553. [DOI] [PubMed] [Google Scholar]
- Love MI, Huber W, Anders S. Moderated estimation of fold change and dispersion for RNA-seq data with deseq2. Genome Biology. 2014;15:550. doi: 10.1186/s13059-014-0550-8. [DOI] [PMC free article] [PubMed] [Google Scholar]
- Marsh B, Blelloch R. Single nuclei RNA-seq of mouse placental labyrinth development. eLife. 2020;9:e60266. doi: 10.7554/eLife.60266. [DOI] [PMC free article] [PubMed] [Google Scholar]
- Maslen CL. Recent advances in placenta-heart interactions. Frontiers in Physiology. 2018;9:1–9. doi: 10.3389/fphys.2018.00735. [DOI] [PMC free article] [PubMed] [Google Scholar]
- Matthiesen NB, Henriksen TB, Agergaard P, Gaynor JW, Bach CC, Hjortdal VE, Østergaard JR. Congenital heart defects and indices of placental and fetal growth in a nationwide study of 924 422 liveborn infants. Circulation. 2016;134:1546–1556. doi: 10.1161/CIRCULATIONAHA.116.021793. [DOI] [PubMed] [Google Scholar]
- Mi H, Muruganujan A, Ebert D, Huang X, Thomas PD. Panther version 14: more genomes, a new panther GO-slim and improvements in enrichment analysis tools. Nucleic Acids Research. 2019;47:D419–D426. doi: 10.1093/nar/gky1038. [DOI] [PMC free article] [PubMed] [Google Scholar]
- Mootha VK, Lindgren CM, Eriksson KF, Subramanian A, Sihag S, Lehar J, Puigserver P, Carlsson E, Ridderstråle M, Laurila E, Houstis N, Daly MJ, Patterson N, Mesirov JP, Golub TR, Tamayo P, Spiegelman B, Lander ES, Hirschhorn JN, Altshuler D, Groop LC. PGC-1α-responsive genes involved in oxidative phosphorylation are coordinately downregulated in human diabetes. Nature Genetics. 2003;34:267–273. doi: 10.1038/ng1180. [DOI] [PubMed] [Google Scholar]
- Penny DJ, Vick GW. Ventricular septal defect. The Lancet. 2011;377:1103–1112. doi: 10.1016/S0140-6736(10)61339-6. [DOI] [PubMed] [Google Scholar]
- Perez-Garcia V, Fineberg E, Wilson R, Murray A, Mazzeo CI, Tudor C, Sienerth A, White JK, Tuck E, Ryder EJ, Gleeson D, Siragher E, Wardle-Jones H, Staudt N, Wali N, Collins J, Geyer S, Busch-Nentwich EM, Galli A, Smith JC, Robertson E, Adams DJ, Weninger WJ, Mohun T, Hemberger M. Placentation defects are highly prevalent in embryonic lethal mouse mutants. Nature. 2018;555:463–468. doi: 10.1038/nature26002. [DOI] [PMC free article] [PubMed] [Google Scholar]
- Poirier F, Chan CTJ, Timmons PM, Robertson EJ, Evans MJ, Rigby PWJ. The murine H19 gene is activated during embryonic stem cell differentiation in vitro and at the time of implantation in the developing embryo. Development. 1991;113:1105–1114. doi: 10.1242/dev.113.4.1105. [DOI] [PubMed] [Google Scholar]
- Rochais F, Sturny R, Chao CM, Mesbah K, Bennett M, Mohun TJ, Bellusci S, Kelly RG. Fgf10 promotes regional foetal cardiomyocyte proliferation and adult cardiomyocyte cell-cycle re-entry. Cardiovascular Research. 2014;104:432–442. doi: 10.1093/cvr/cvu232. [DOI] [PubMed] [Google Scholar]
- Rychik J, Goff D, McKay E, Mott A, Tian Z, Licht DJ, Gaynor JW. Characterization of the placenta in the newborn with congenital heart disease: distinctions based on type of cardiac malformation. Pediatric Cardiology. 2018;39:1165–1171. doi: 10.1007/s00246-018-1876-x. [DOI] [PMC free article] [PubMed] [Google Scholar]
- Sandovici I, Georgopoulou A, Pérez-García V, Hufnagel A, López-Tello J, Lam BYH, Schiefer SN, Gaudreau C, Santos F, Hoelle K, Yeo GSH, Burling K, Reiterer M, Fowden AL, Burton GJ, Branco CM, Sferruzzi-Perri AN, Constância M. The imprinted igf2-igf2r axis is critical for matching placental microvasculature expansion to fetal growth. Developmental Cell. 2022;57:63–79. doi: 10.1016/j.devcel.2021.12.005. [DOI] [PMC free article] [PubMed] [Google Scholar]
- SanMiguel JM, Abramowitz LK, Bartolomei MS. Imprinted gene dysregulation in a tet1 null mouse model is stochastic and variable in the germline and offspring. Development. 2018;145:dev160622. doi: 10.1242/dev.160622. [DOI] [PMC free article] [PubMed] [Google Scholar]
- Savolainen SM, Foley JF, Elmore SA. Histology atlas of the developing mouse heart with emphasis on E11.5 to E18.5. Toxicologic Pathology. 2009;37:395–414. doi: 10.1177/0192623309335060. [DOI] [PMC free article] [PubMed] [Google Scholar]
- Schindelin J, Arganda-Carreras I, Frise E, Kaynig V, Longair M, Pietzsch T, Preibisch S, Rueden C, Saalfeld S, Schmid B, Tinevez JY, White DJ, Hartenstein V, Eliceiri K, Tomancak P, Cardona A. Fiji: an open-source platform for biological-image analysis. Nature Methods. 2012;9:676–682. doi: 10.1038/nmeth.2019. [DOI] [PMC free article] [PubMed] [Google Scholar]
- Serra A, Eirich K, Winkler AK, Mrasek K, Göhring G, Barbi G, Cario H, Schlegelberger B, Pokora B, Liehr T, Leriche C, Henne-Bruns D, Barth TF, Schindler D. Shared copy number variation in simultaneous nephroblastoma and neuroblastoma due to fanconi anemia. Molecular Syndromology. 2012;3:120–130. doi: 10.1159/000341935. [DOI] [PMC free article] [PubMed] [Google Scholar]
- Shen H, Cavallero S, Estrada KD, Sandovici I, Kumar SR, Makita T, Lien CL, Constancia M, Sucov HM. Extracardiac control of embryonic cardiomyocyte proliferation and ventricular wall expansion. Cardiovascular Research. 2015;105:271–278. doi: 10.1093/cvr/cvu269. [DOI] [PMC free article] [PubMed] [Google Scholar]
- Shen H, Gan P, Wang K, Darehzereshki A, Wang K, Ram Kumar S, Lien CL, Patterson M, Tao G, Sucov HM. Mononuclear diploid cardiomyocytes support neonatal mouse heart regeneration in response to paracrine IGF2 signaling. eLife. 2020;9:24. doi: 10.7554/eLife.53071. [DOI] [PMC free article] [PubMed] [Google Scholar]
- Sibley CP, Coan PM, Dean W, Hughes J, Smith P, Reik W, Burton GJ. Regulates the diffusional exchange characteristics of the mouse placenta. PNAS. 2004;101:8204–8208. doi: 10.1073/pnas.0402508101. [DOI] [PMC free article] [PubMed] [Google Scholar]
- Snider P, Standley KN, Wang J, Azhar M, Doetschman T, Conway SJ. Origin of cardiac fibroblasts and the role of periostin. Circulation Research. 2009;105:934–947. doi: 10.1161/CIRCRESAHA.109.201400. [DOI] [PMC free article] [PubMed] [Google Scholar]
- Snider P, Conway SJ. Probing human cardiovascular congenital disease using transgenic mouse models. Progress in Molecular Biology and Translational Science. 2011;100:83–110. doi: 10.1016/B978-0-12-384878-9.00003-0. [DOI] [PMC free article] [PubMed] [Google Scholar]
- Soellner L, Kraft F, Sauer S, Begemann M, Kurth I, Elbracht M, Eggermann T. Search for cis-acting factors and maternal effect variants in silver-russell patients with ICR1 hypomethylation and their mothers. European Journal of Human Genetics. 2019;27:42–48. doi: 10.1038/s41431-018-0269-1. [DOI] [PMC free article] [PubMed] [Google Scholar]
- Soemedi R, Wilson IJ, Bentham J, Darlay R, Töpf A, Zelenika D, Cosgrove C, Setchfield K, Thornborough C, Granados-Riveron J, Blue GM, Breckpot J, Hellens S, Zwolinkski S, Glen E, Mamasoula C, Rahman TJ, Hall D, Rauch A, Devriendt K, Gewillig M, O’ Sullivan J, Winlaw DS, Bu’Lock F, Brook JD, Bhattacharya S, Lathrop M, Santibanez-Koref M, Cordell HJ, Goodship JA, Keavney BD. Contribution of global rare copy-number variants to the risk of sporadic congenital heart disease. American Journal of Human Genetics. 2012;91:489–501. doi: 10.1016/j.ajhg.2012.08.003. [DOI] [PMC free article] [PubMed] [Google Scholar]
- Spicer DE, Hsu HH, Co-Vu J, Anderson RH, Fricker FJ. Ventricular septal defect. Orphanet Journal of Rare Diseases. 2014;9:144. doi: 10.1186/s13023-014-0144-2. [DOI] [PMC free article] [PubMed] [Google Scholar]
- Subramanian A, Tamayo P, Mootha VK, Mukherjee S, Ebert BL, Gillette MA, Paulovich A, Pomeroy SL, Golub TR, Lander ES, Mesirov JP. Gene set enrichment analysis: a knowledge-based approach for interpreting genome-wide expression profiles. PNAS. 2005;102:15545–15550. doi: 10.1073/pnas.0506580102. [DOI] [PMC free article] [PubMed] [Google Scholar]
- Sullivan KE, Black LD. The role of cardiac fibroblasts in extracellular matrix-mediated signaling during normal and pathological cardiac development. Journal of Biomechanical Engineering. 2013;135:71001. doi: 10.1115/1.4024349. [DOI] [PubMed] [Google Scholar]
- Thorvaldsen JL, Duran KL, Bartolomei MS. Deletion of the H19 differentially methylated domain results in loss of imprinted expression of H19 and IGF2. Genes & Development. 1998;12:3693–3702. doi: 10.1101/gad.12.23.3693. [DOI] [PMC free article] [PubMed] [Google Scholar]
- Thorvaldsen JL, Mann MRW, Nwoko O, Duran KL, Bartolomei MS. Analysis of sequence upstream of the endogenous H19 gene reveals elements both essential and dispensable for imprinting. Molecular and Cellular Biology. 2002;22:2450–2462. doi: 10.1128/MCB.22.8.2450-2462.2002. [DOI] [PMC free article] [PubMed] [Google Scholar]
- Thorvaldsen JL, Fedoriw AM, Nguyen S, Bartolomei MS. Developmental profile of H19 differentially methylated domain (DMD) deletion alleles reveals multiple roles of the DMD in regulating allelic expression and DNA methylation at the imprinted H19/igf2 locus. Molecular and Cellular Biology. 2006;26:1245–1258. doi: 10.1128/MCB.26.4.1245-1258.2006. [DOI] [PMC free article] [PubMed] [Google Scholar]
- Ueno M, Lee LK, Chhabra A, Kim YJ, Sasidharan R, Van Handel B, Wang Y, Kamata M, Kamran P, Sereti KI, Ardehali R, Jiang M, Mikkola HKA. C-met-dependent multipotent labyrinth trophoblast progenitors establish placental exchange interface. Developmental Cell. 2013;27:373–386. doi: 10.1016/j.devcel.2013.10.019. [DOI] [PMC free article] [PubMed] [Google Scholar]
- Vega-Hernández M, Kovacs A, De Langhe S, Ornitz DM. FGF10/fgfr2b signaling is essential for cardiac fibroblast development and growth of the myocardium. Development. 2011;138:3331–3340. doi: 10.1242/dev.064410. [DOI] [PMC free article] [PubMed] [Google Scholar]
- von Gise A, Pu WT. Endocardial and epicardial epithelial to mesenchymal transitions in heart development and disease. Circulation Research. 2012;110:1628–1645. doi: 10.1161/CIRCRESAHA.111.259960. [DOI] [PMC free article] [PubMed] [Google Scholar]
- Vrooman LA, Rhon-Calderon EA, Chao OY, Nguyen DK, Narapareddy L, Dahiya AK, Putt ME, Schultz RM, Bartolomei MS. Assisted reproductive technologies induce temporally specific placental defects and the preeclampsia risk marker sflt1 in mouse. Development. 2020;147:dev186551. doi: 10.1242/dev.186551. [DOI] [PMC free article] [PubMed] [Google Scholar]
- Wakeling EL, Brioude F, Lokulo-Sodipe O, O’Connell SM, Salem J, Bliek J, Canton APM, Chrzanowska KH, Davies JH, Dias RP, Dubern B, Elbracht M, Giabicani E, Grimberg A, Grønskov K, Hokken-Koelega ACS, Jorge AA, Kagami M, Linglart A, Maghnie M, Mohnike K, Monk D, Moore GE, Murray PG, Ogata T, Petit IO, Russo S, Said E, Toumba M, Tümer Z, Binder G, Eggermann T, Harbison MD, Temple IK, Mackay DJG, Netchine I. Diagnosis and management of silver-russell syndrome: first international consensus statement. Nature Reviews. Endocrinology. 2017;13:105–124. doi: 10.1038/nrendo.2016.138. [DOI] [PubMed] [Google Scholar]
- Wang Y, Sun X, Sun X. The functions of lncrna H19 in the heart. In Heart Lung and Circulation. 2021 doi: 10.1016/j.hlc.2021.10.022. [DOI] [PubMed] [Google Scholar]
- Woods L, Perez-Garcia V, Hemberger M. Regulation of placental development and its impact on fetal growth-new insights from mouse models. Frontiers in Endocrinology. 2018;9:1–18. doi: 10.3389/fendo.2018.00570. [DOI] [PMC free article] [PubMed] [Google Scholar]
- Yang H, Wang H, Jaenisch R. Generating genetically modified mice using CRISPR/cas-mediated genome engineering. Nature Protocols. 2014;9:1956–1968. doi: 10.1038/nprot.2014.134. [DOI] [PubMed] [Google Scholar]


