

Abstract
Rationale
Extremes of heat and particulate air pollution threaten human health and are becoming more frequent because of climate change. Understanding the health impacts of coexposure to extreme heat and air pollution is urgent.
Objectives
To estimate the association of acute coexposure to extreme heat and ambient fine particulate matter (PM2.5) with all-cause, cardiovascular, and respiratory mortality in California from 2014 to 2019.
Methods
We used a case-crossover study design with time-stratified matching using conditional logistic regression to estimate mortality associations with acute coexposures to extreme heat and PM2.5. For each case day (date of death) and its control days, daily average PM2.5 and maximum and minimum temperatures were assigned (0- to 3-day lag) on the basis of the decedent’s residence census tract.
Measurements and Main Results
All-cause mortality risk increased 6.1% (95% confidence interval [CI], 4.1–8.1) on extreme maximum temperature-only days and 5.0% (95% CI, 3.0–8.0) on extreme PM2.5-only days, compared with nonextreme days. Risk increased by 21.0% (95% CI, 6.6–37.3) on days with exposure to both extreme maximum temperature and PM2.5. Increased risk of cardiovascular and respiratory mortality on extreme coexposure days was 29.9% (95% CI, 3.3–63.3) and 38.0% (95% CI, −12.5 to 117.7), respectively, and were more than the sum of individual effects of extreme temperature and PM2.5 only. A similar pattern was observed for coexposure to extreme PM2.5 and minimum temperature. Effect estimates were larger over age 75 years.
Conclusions
Short-term exposure to extreme heat and air pollution alone were individually associated with increased risk of mortality, but their coexposure had larger effects beyond the sum of their individual effects.
Keywords: air pollution, temperature, coexposure, mortality, all-cause
At a Glance Commentary
Scientific Knowledge on the Subject
Exposure to fine particulate matter air pollution (PM2.5) and heat are each associated with increased mortality risk. Assessment of the health impacts of coexposure to extreme air pollution and heat events is urgent, given projected increases in the frequency of heatwaves and wildfires associated with high pollution with the progression of climate change.
What This Study Adds to the Field
We report a novel evidence of the effects of exposure to co-occurring extreme heat and PM2.5 on all-cause, cardiovascular, and respiratory mortality across California, a region with frequent heatwaves and high pollution events because of wildfires. The study included 1.5 million all-cause, 0.5 million cardiovascular, and 0.14 million respiratory deaths in California from January 1, 2014, to December 31, 2019. We used a novel analytical approach considering the co-occurrence of extreme heat and pollution as its own exposure separate from exposure to extreme heat or air pollution alone. We found that acute exposure to extreme heat and air pollution were individually associated with an increased risk of mortality; however, coexposure to both extremes had a greater mortality effect beyond the sum of their individual effects. We further found that mortality risk increased with more extreme exposures.
Climate change is considered one of the greatest public health threats of the 21st century (1). As the climate crisis progresses, the planet and its inhabitants will continue to experience increased frequency and magnitude of extreme weather events (2). The Intergovernmental Panel on Climate Change reported that the increase in global mean temperature will be associated with more frequent, more intense, and longer-lasting extreme heat events (2). Compared with the 1970s, California has experienced a progressive increase in average summertime temperature of approximately 1.4°C and a fivefold increase in wildfires (3). Together with the progression of the climate crisis, extreme particulate air pollution episodes are expected to increase because of the increased frequency of wildfires (4–7). Moreover, as anthropogenic emissions of particulate matter continue to decline in the coming decades after the implementation of stricter emissions regulations (8, 9), wildfire emissions will be increasingly important drivers for extreme air pollution events (7, 10).
Temperature extremes and higher air pollution exposures both threaten human health, including increased risk of mortality (11–15). Extremes of heat and air pollution often co-occur as a result of shared underlying drivers (16) and may synergistically increase health impacts beyond the sum of individual effects. Higher air pollution and extreme temperature exposures both impact health through common biological pathways, including increased systemic inflammation and oxidative stress (17–21), making synergistic health effects plausible. With continued temperature increases and related pollution-generating events, it is important to quantify the health impacts of coexposure to extreme heat and air pollution in a warming world.
For the past 10 years, California has experienced an unprecedented period of drought (22), making the state highly prone to wildfires, most of which occur in the summer months. This presents a mechanism for fine particulate matter (PM2.5) extremes to occur during a time of year when temperature extremes are prevalent, leading to increased chances of exposure to the occurrence of simultaneous extreme episodes. In this study, we examined the effects of exposure to co-occurring extreme heat and air pollution on cardiovascular, respiratory, and all-cause mortality. We used a novel analytical framework: rather than consider heat and air pollution as independent exposures and examine interacting effects on mortality (as done in prior studies), we considered the co-occurrence of extreme heat and pollution as its own exposure separate from exposure to extreme heat or air pollution alone. Extreme heat events and pollution episodes will worsen under any future climate scenario (2, 23–25); this research is needed to develop an appropriate adaptation strategy.
Methods
Outcome Definition
Death certificate data for all deaths occurring in California from January 1, 2014, to December 31, 2019, were obtained from the California Department of Public Health’s Vital Statistics. We considered total mortality defined as all causes. The ICD-10 (International Classification of Diseases, 10th revision) was used to define the underlying causes of mortality because of cardiovascular (I00–I99) and respiratory diseases (J00–J99). This study was approved by the Committee for the Protection of Human Subjects of the state of California.
Study Design
PM2.5 was the main air pollutant of interest because its association with mortality is stronger than other ambient pollutants such as ozone and nitrogen dioxide (26). We assessed the association of coexposure to extreme heat and PM2.5 with mortality using a time-stratified case-crossover design, which has been widely used for investigating acute effects of air pollution and temperature on various health outcomes (27–29). For each decedent, the “case day” was defined as the date of death. For the same person, exposure to extreme events on the “case day” was compared with exposure to extreme events on “control days”. The control days were chosen as the same day of the week as the case day from the same year and month to control for potential confounding effects of day of the week, long-term trend, and seasonality (30–32). For example, if a person died on a Tuesday in May 2015 (the case day), all other Tuesdays in May 2015 would serve as control days. Because cases serve as their own control, this design controls for time-independent factors such as age, sex, race and ethnicity, socioeconomic status, chronic comorbidities, smoking, and other behavioral risk factors.
Environmental Data
Measurement data for PM2.5 was acquired from the United States Environmental Protection Agency’s Air Quality System (https://www.epa.gov/ttn/airs/airsaqs). The air monitoring network in California is one of the most extensive in the United States, with over 150 locations. The daily PM2.5 average was determined from hourly monitoring and 24-hour filter sampling. Concentration at each census tract was calculated using inverse distance-squared weighted observations from up to 4 nearby monitoring stations within a 50-km radius of the decedent's residence, as previously described (33). All Federal Reference Method and Federal Equivalent Method data were included except those collected less than 50 meters from a freeway that do not well-represent regional concentration. Prior work reported that this approach for California provided physically consistent spatial maps appropriate for assigning concentrations at the census tract resolution (34).
The 4-km gridded estimates of daily 1-hour maximum and minimum temperature (Tmax and Tmin) and relative humidity (RHmax and RHmin) were obtained from a published spatiotemporal reanalysis model developed at the University of Idaho (35). For each case day (date of death) and its control days, the daily average PM2.5, Tmax, Tmin, RHmax, and RHmin were assigned on the basis of the decedent’s residence census tract. We assigned exposures using a range of lags from 0 (lag-0) to 3 days (lag-3). For example, lag-0 exposure refers to the daily exposure on the same day as the index day (i.e., case or control day), and lag-3 exposure refers to the daily exposure 3 days before the index day.
Definition of Extreme Events
We used the 90th, 95th, 97th, and 99th percentiles of the daily maximum and minimum temperatures for each census tract from 2014 to 2019 to define the local (i.e., census tract level) specific extreme daily maximum temperature (“Extreme Tmax”) and extreme daily minimum temperature (“Extreme Tmin”), consistent with prior studies (13, 16, 36). Unlike temperature, there is little evidence that people can acclimate to a certain concentration of local PM2.5 exposure. Thus, to define extreme exposure for PM2.5 (“Extreme PM2.5”), we used the 90th, 95th, 97th, and 99th percentiles of daily PM2.5 from 2014 to 2019 across all of California (16). Extreme exposure to temperature and PM2.5 were combined to create a mutually exclusive categorical variable with four degrees: neither extreme temperature nor PM2.5 (referent), extreme temperature only, extreme PM2.5 only, or both extreme temperature and PM2.5. This was done separately for daily maximum and minimum temperatures.
Statistical Analysis
We estimated the increase in all-cause, cardiovascular, and respiratory mortality risk during extreme Tmax days, PM2.5 days, and co-occurrence of extreme Tmax and PM2.5 days compared with nonextreme days by fitting a conditional logistic regression to all pairs of case days and matched control days. Similarly, we fitted separate models to estimate the increase in all-cause, cardiovascular, and respiratory mortality risk during extreme high Tmin days (days with higher Tmin), PM2.5 days, and co-occurrence of extreme Tmin and PM2.5 days compared with nonextreme days (when neither the Tmin nor the PM2.5 was above to their respective thresholds). Daily maximum relative humidity was included as a covariate in the Tmax and PM2.5 model, and daily minimum relative humidity was included in the Tmin and PM2.5 model to account for potential confounding by humid weather conditions. The relative humidity was included in the models as a natural cubic spline function with three degrees of freedom (27, 28). In a post hoc data analysis, the additive interaction was assessed by relative excess risk because of interaction (RERI). RERI was estimated only for the lag with the largest and/or most statistically significant (smallest P value) effect estimates for each percentile threshold (in almost all cases, the largest effect estimate was also the most statistically significant). We also conducted stratified analyses for age to examine effect modification by age (⩽75 years and >75 years). We then performed a two-sample test for assessing statistically significant differences in the effect sizes between two age categories (e.g., ⩽75 years vs. >75 yr) on the basis of the point estimate and standard error.
The distribution of days with co-occurrence of extreme temperature and PM2.5 by month revealed that the co-occurrence of extreme heat and PM2.5 days occurred predominantly from June to September (Figure 1). Therefore, we conducted a sensitivity analysis for all-cause mortality restricting only to these months. As no extreme heat and PM2.5 days were identified from October to May, especially for the 97th and 99th percentiles, an analysis restricting to those months was not possible. Additional sensitivity analyses were conducted by examining different degrees of freedom for the spline of relative humidity in the models.
Figure 1.
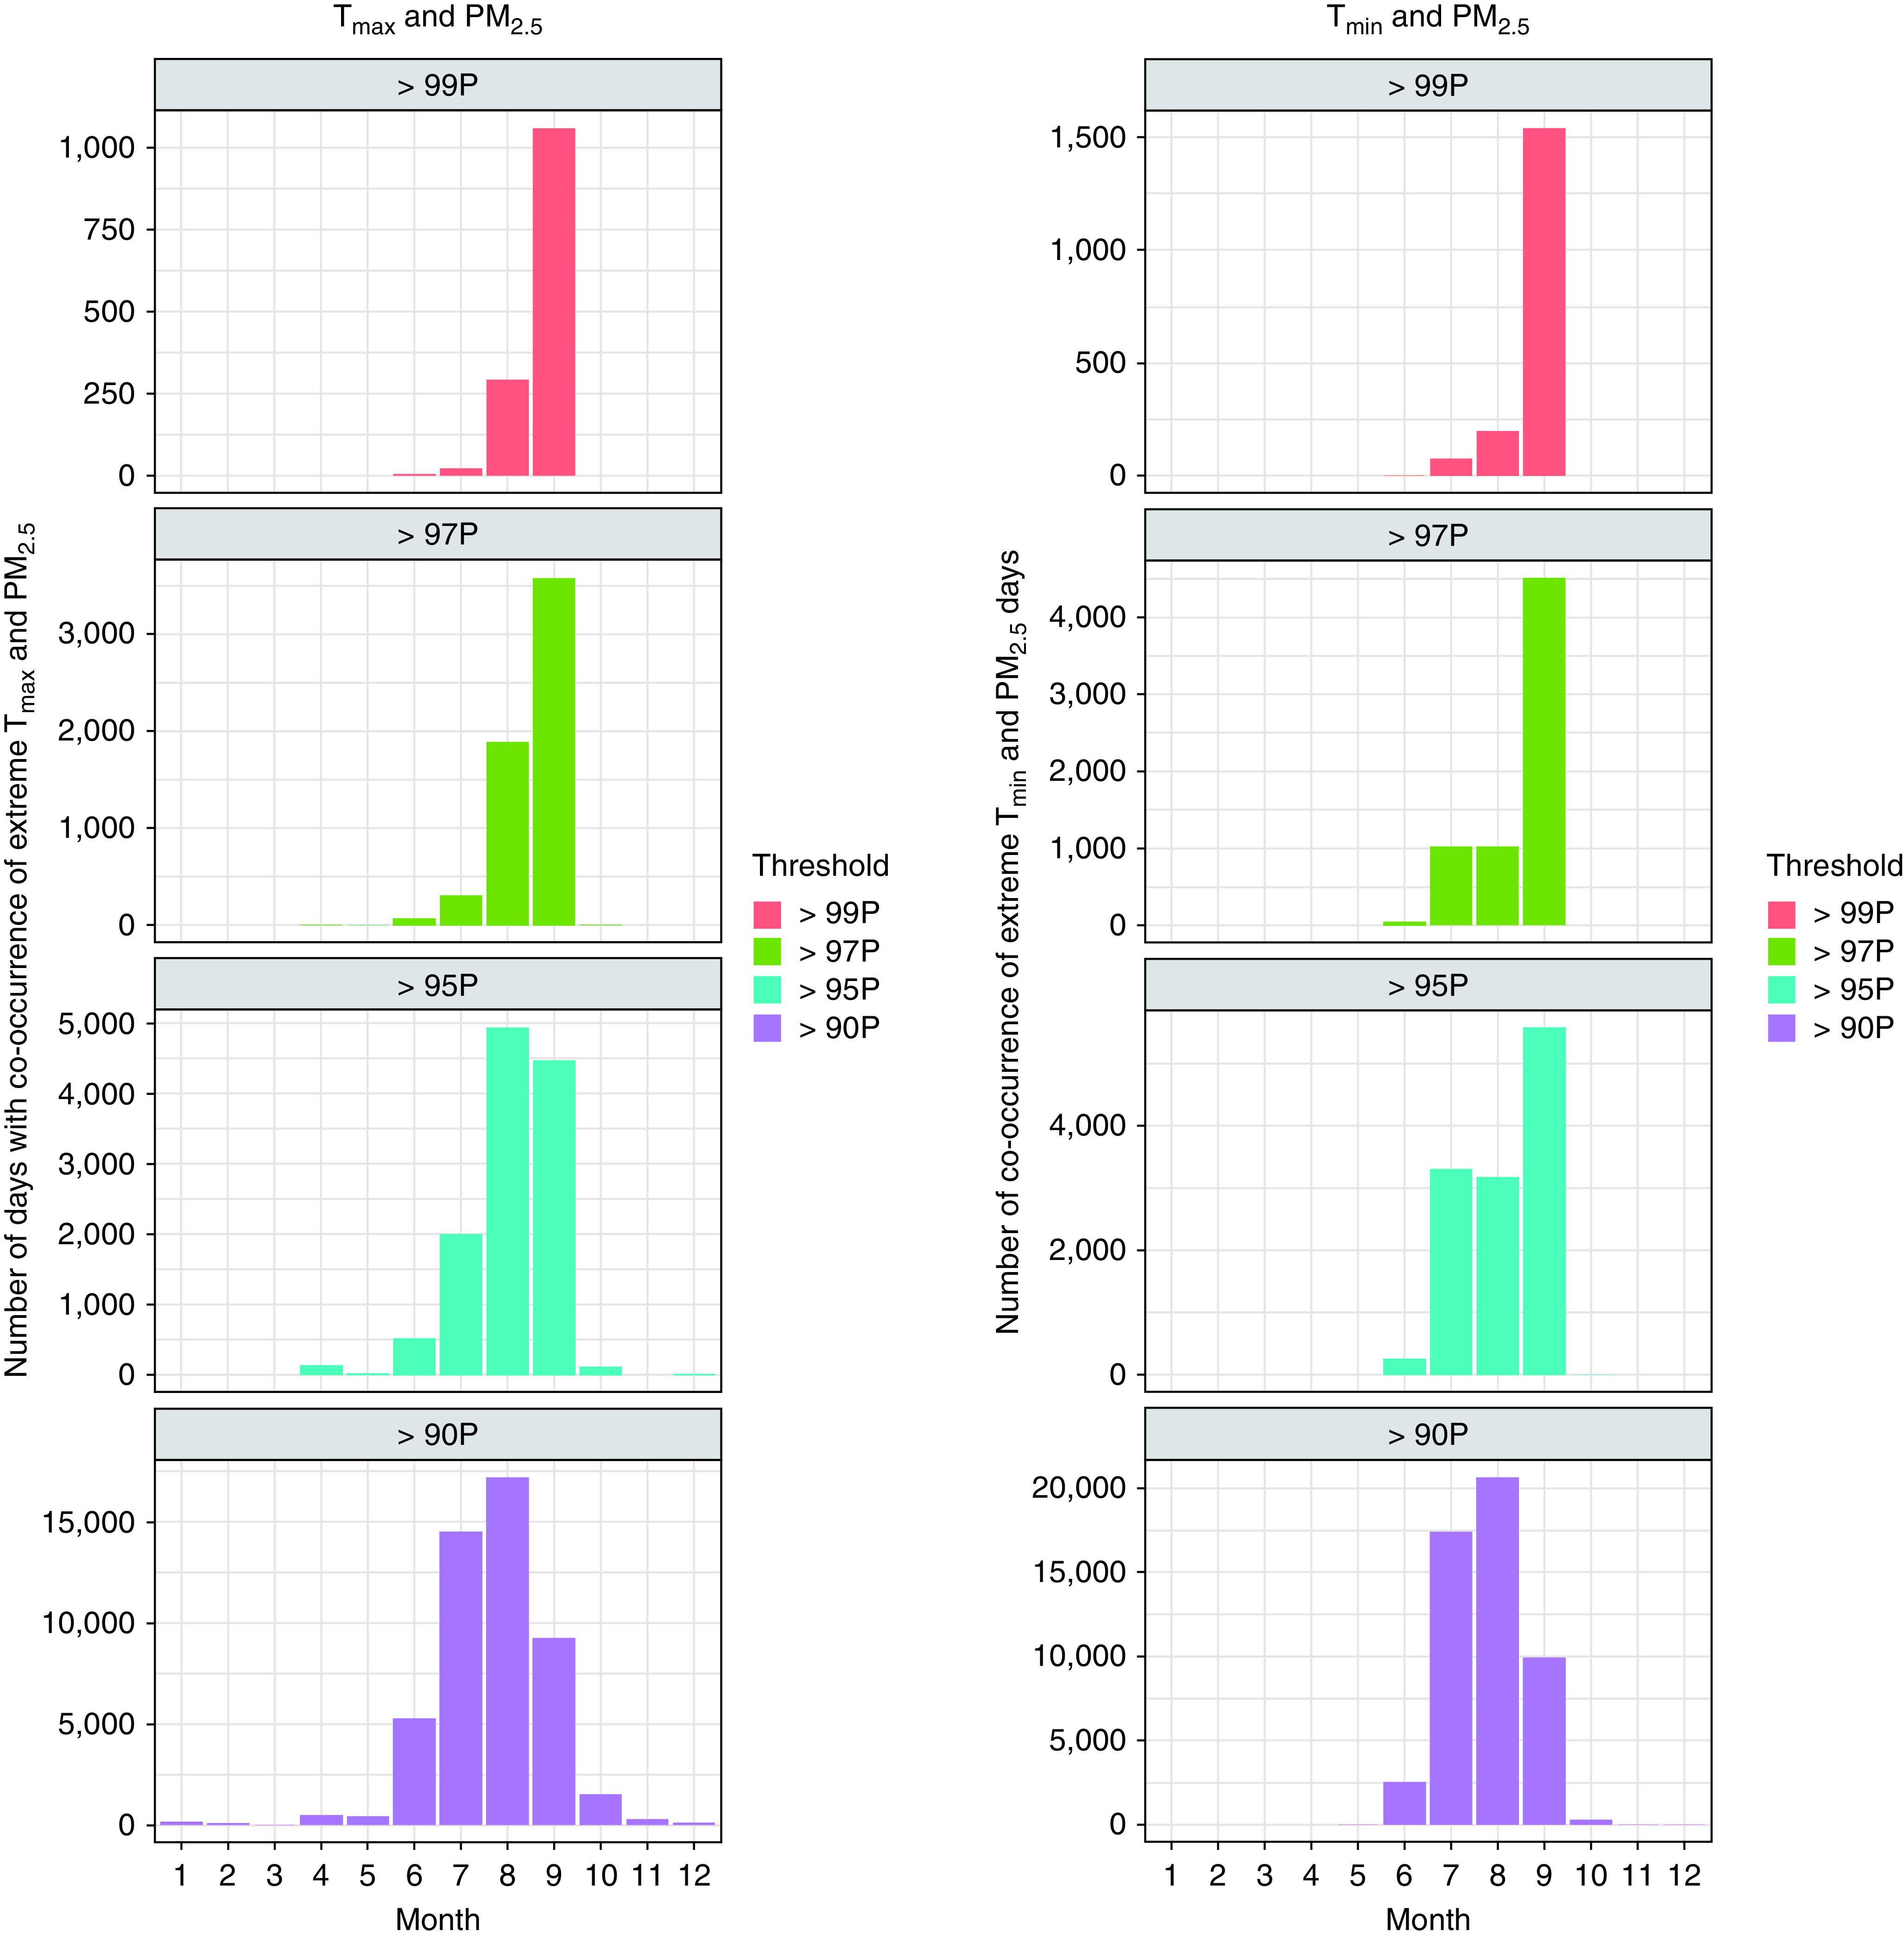
Monthly distribution of the number of co-occurrence of extreme temperature and fine particulate matter (PM2.5) days. P = percentile; Tmax = maximum temperature; Tmin = minimum temperature.
Results were reported as percentage increases in mortality risk with 95% confidence intervals (CIs) during extreme days compared with nonextreme days at lag-0 to lag-3. The percent excess risk was calculated as [(exp[β] − 1) × 100]. All analyses were performed using R Statistical Software (v3.5.2; R Core Team 2021). The epiR package was used to get the estimates for RERI (37).
Results
During the study time period, there were about 1.5 million case days (deaths) and 5.1 million control days for all-cause mortality, 0.5 million case days and 1.7 million control days for cardiovascular mortality, and 0.14 million case days and 0.5 million control days for respiratory mortality (Table 1). Figure 2 shows the distributions of daily Tmax, Tmin, and PM2.5 in our study above the four percentile threshold degrees. For our analyses, the exposure was dichotomized as being above a percentile threshold (census tract specific value for temperature and single statewide value for PM2.5) or not (i.e., whether an extreme exposure day). Although we do not use the specific exposure degree (continuous temperature or pollutant concentration) in our models, we present exposure distributions on the extreme exposure days for context. Mean (SD) of daily exposure on days above the 90th, 95th, 97th, and 99th percentiles for daily Tmax were 34.5°C (4.3), 36.0°C (4.0), 37.0°C (3.8), and 38.8°C (3.4), respectively; for daily Tmin, 19.3°C (3.1), 20.3°C (3.1), 20.9°C (3.0), and 22.2°C (2.9); and for daily PM2.5, 25.9 μg/m3 (14.4), 32.9 μg/m3 (17.4), 39.1 μg/m3 (20.7), and 57.2 μg/m3 (27.9). The number of extreme exposure days (case and control) for all-cause, cardiovascular, and respiratory mortality are shown in Table 2.
Table 1.
Baseline Characteristics of Study Population (Decedents in California, 2014–2019)
| All-Cause Mortality (n = 1,514,292) | Cardiovascular Mortality (n = 492,513) | Respiratory Mortality (n = 139,116) | |
|---|---|---|---|
| Case days, No. | 1,514,292 | 492,513 | 139,116 |
| Control days, No. | 5,146,276 | 1,673,999 | 472,234 |
| Age at death (yr), mean (±SD) | 74.0 ± 18.3 | 79.0 ± 14.5 | 78.8 ± 13.4 |
| ⩽75 yr (%) | 45.1 | 34.7 | 34.7 |
| >75 yr (%) | 54.9 | 65.3 | 65.3 |
| Sex, % | |||
| Male | 51.6 | 51.4 | 49.0 |
| Female | 48.4 | 48.6 | 51.0 |
Figure 2.

Distributions of daily (A) maximum temperature (Tmax); (B) minimum temperature (Tmin); and (C) fine particulate matter (PM2.5) on days with exposure above different percentile thresholds over the study period from January 2014 through December 2019. P = percentile.
Table 2.
Number (Percentage) of Extreme Exposure Case and Control Days for Maximum Temperature Only, Minimum Temperature, Fine Particulate Matter, Co-occurrence of Fine Particulate Matter with Maximum Temperature, and Fine Particulate Matter with Minimum Temperature
| Number of Extreme Exposures Days Above Selected Percentile Thresholds |
||||
|---|---|---|---|---|
| 90th Percentile, n (%) | 95th Percentile, n (%) | 97th Percentile, n (%) | 99th Percentile, n (%) | |
| All-cause Mortality | ||||
| Tmax | 576,633 (8.7) | 301,807 (4.5) | 182,535 (2.7) | 62,094 (0.9) |
| Tmin | 564,071 (8.5) | 298,023 (4.5) | 180,789 (2.7) | 61,421 (0.9) |
| PM2.5 | 614,612 (9.2) | 331,124 (5.0) | 207,023 (3.1) | 72,493 (1.1) |
| Tmax and PM2.5 | 49,292 (0.7) | 12,221 (0.2) | 5,873 (0.09) | 1,380 (0.02) |
| Tmin and PM2.5 | 50,843 (0.8) | 12,320 (0.2) | 6,600 (0.1) | 1,814 (0.03) |
| Cardiovascular Mortality | ||||
| Tmax | 183,665 (8.5) | 96,614 (4.5) | 58,401 (2.7) | 19,850 (0.9) |
| Tmin | 178,716 (8.2) | 94,668 (4.4) | 57,538 (2.7) | 19,542 (0.9) |
| PM2.5 | 203,845 (9.4) | 109,239 (5.0) | 67,950 (3.1) | 23,554 (1.1) |
| Tmax and PM2.5 | 15,904 (0.7) | 3,780 (0.2) | 1,769 (0.08) | 423 (0.02) |
| Tmin and PM2.5 | 16,526 (0.7) | 3,779 (0.2) | 1,959 (0.09) | 555 (0.03) |
| Respiratory Mortality | ||||
| Tmax | 47,290 (7.7) | 24,496 (4.0) | 14,717 (2.4) | 5,026 (0.8) |
| Tmin | 45,668 (7.5) | 24,039 (3.9) | 14,531 (2.4) | 5,016 (0.8) |
| PM2.5 | 60,890 (10.0) | 33,718 (5.5) | 21,413 (3.5) | 7,474 (1.2) |
| Tmax and PM2.5 | 4,024 (0.7) | 982 (0.2) | 484 (0.08) | 113 (0.02) |
| Tmin and PM2.5 | 4,160 (0.7) | 1,018 (0.2) | 532 (0.09) | 133 (0.02) |
Definition of Abbreviations: PM2.5 = fine particulate matter; TMAX = maximum temperature; TMIN = minimum temperature.
Extreme exposure thresholds were defined on the basis of distributions across the entire study period within the census tract (temperature) or across the state (PM2.5).
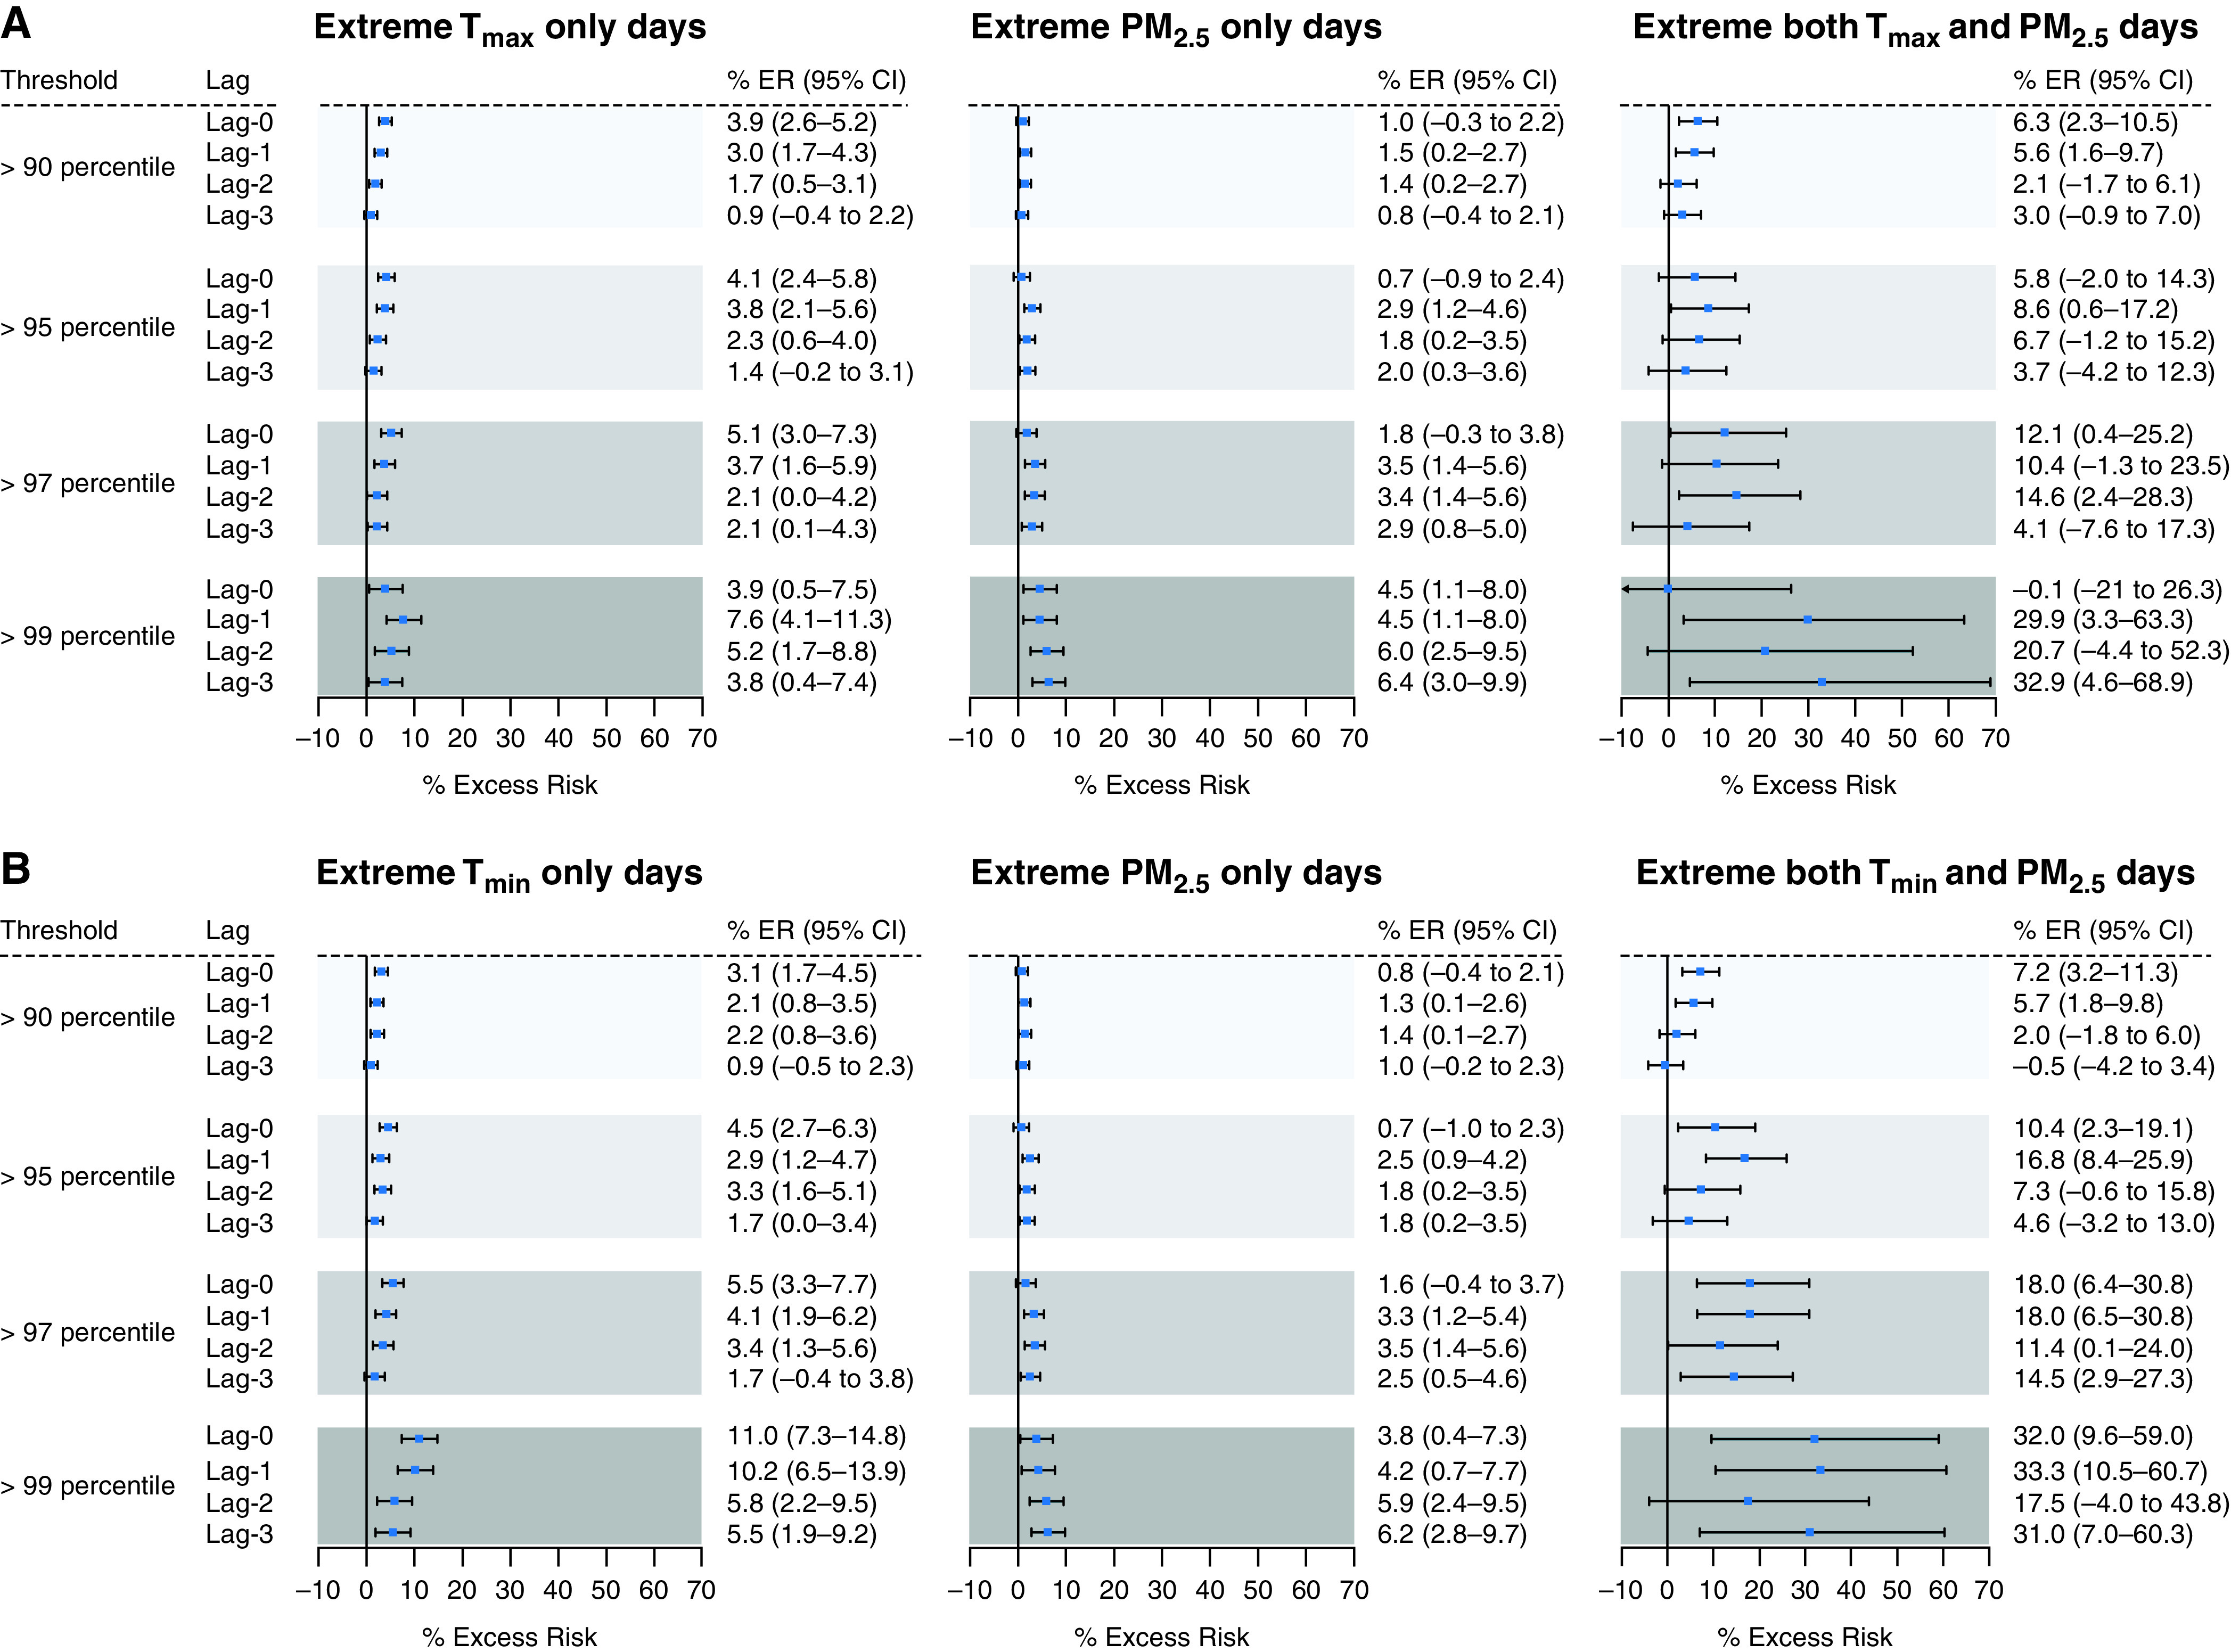
We found an increased risk of all-cause mortality on extreme exposure days compared with nonextreme exposure days (Figure 3). Compared with nonextreme exposures days, the estimated excess risks of all-cause mortality on most extreme (e.g., 99th percentile) Tmax-only days, PM2.5-only days, and on the co-occurrence of extreme Tmax and PM2.5 days were 6.1% (95% CI, 4.1–8.1), 5.0% (95% CI, 3.0–8.0), and 21.0% (95% CI, 6.6–37.3), respectively. The analysis with coexposure of extreme Tmin with PM2.5 provided similar findings but a more significant and larger association (Figure 3). Compared with nonextreme exposures days, the estimated excess risks of all-cause mortality on most extreme (e.g., 99th percentile) Tmin-only days, PM2.5-only days, and on the co-occurrence of extreme Tmin and PM2.5 days were 8.7% (95% CI, 6.6–10.8), 4.7% (95% CI, 2.7–6.7), and 23.9% (95% CI, 11.6–37.5), respectively. Our post hoc analysis provided evidence for the additive interaction, especially for the analysis with extreme Tmin and PM2.5 (Table E1 in the online supplement). RERI increased with more extreme exposures and was statistically significant for extreme exposures above the 97th percentile (at P < 0.05) and was marginally significant for the 90th, 95th, and 99th percentiles (at P < 0.1). In age-stratified analysis, we found that coexposure to extreme Tmin and PM2.5 was associated with a higher all-cause mortality risk for individuals older than 75 years (Table E4).
Figure 3.

Estimated excess risk of all-cause mortality (and 95% confidence interval [CI]) on (A) co-occurrence of extreme maximum temperature (Tmax) and fine particulate matter (PM2.5) days compared with nonextreme days; (B) co-occurrence of extreme minimum temperature (Tmin) and PM2.5 days compared with nonextreme days. Results are shown for same-day exposure (lag-0) to 3 days before exposure (lag-3). ER = excess risk.
In cause-specific analyses, we found that the exposure to extreme PM2.5 with Tmax and PM2.5 with Tmin were both associated with increased cardiovascular and respiratory mortality risk (Figures 4 and 5). The estimated effect sizes for cardiovascular and respiratory mortality tended to be higher than those for all-cause mortality. The estimated increased risks of cardiovascular and respiratory mortality were 29.9% (95% CI, 3.3–63.3) and 38.0% (95% CI, −12.5 to 117.7), respectively, on coexposure to most extreme (e.g., >99th percentile) Tmax and PM2.5 days compared with the days when both exposures were below the 99th percentile. Similar to the all-cause mortality analysis, the association of cardiovascular and respiratory mortality with coexposure to extreme Tmin and PM2.5 was larger compared with the association with coexposure to extreme Tmax and PM2.5. The estimated increased risks of cardiovascular and respiratory mortality on coexposure to most extreme (e.g., >99th percentile) Tmin and PM2.5 days were 33.3% (95% CI, 10.5–60.7) and 44.4% (95% CI, −0.4 to 109.4), respectively. Post hoc analysis for cardiovascular and respiratory mortality showed that RERI increased with more extreme exposures and was statistically significant for extreme exposure above the 95th percentile for cardiovascular mortality only (Tables E2 and E3).
Figure 4.
Estimated excess risk of cardiovascular mortality (and 95% confidence interval [CI]) on (A) co-occurrence of extreme maximum temperature (Tmax) and fine particulate matter (PM2.5) days compared with nonextreme days; (B) co-occurrence of extreme minimum temperature (Tmin) and PM2.5 days compared with nonextreme days. Results are shown for same-day exposure (lag-0) to 3 days before exposure (lag-3). ER = excess risk.
Figure 5.

Estimated excess risk of respiratory mortality (and 95% confidence interval [CI]) on (A) co-occurrence of extreme maximum temperature (Tmax) and fine particulate matter (PM2.5) days compared with nonextreme days; (B) co-occurrence of extreme minimum temperature (Tmin) and PM2.5 days compared with nonextreme days. Results are shown for same-day exposure (lag-0) to 3 days before exposure (lag-3). ER = excess risk.
The results of the sensitivity analysis restricting to the months of June through September is shown in Figure E1. Results from this analysis were not markedly different from our primary analysis reported in Figure 3. Additional analyses indicated that the results were not sensitive to changes in degrees of freedom for the smooth functions of relative humidity (Table E5).
Discussion
We examined the associations between all-cause, cardiovascular, and respiratory mortality and exposure to Tmax, Tmin, PM2.5, and co-occurrence of extreme daily maximum PM2.5 with Tmax and PM2.5 with Tmin. To the best of our knowledge, this study is the first to examine the effects of exposure to co-occurring extreme heat and particulate air pollution across California, a region with frequent heatwaves and high pollution days. In this large statewide, multiyear case-crossover study, we found associations of increased risk of all-cause, cardiovascular, and respiratory mortality with coexposure to extreme heat and air pollution days compared with nonextreme exposure days. The observed excess mortality risk associated with coexposure to extreme heat and PM2.5 was approximately 3 times larger than the estimated effect of exposure to extreme heat or PM2.5 alone. Furthermore, the multiple thresholds from the 90th to 99th percentile of extreme exposure indicated that mortality risk increased with more extreme exposures. Older adults were found to be more susceptible to these effects, possibly through mechanisms related to a higher prevalence of comorbid conditions, impaired thermoregulation (38), or behavioral and/or resource access disparities that might contribute to increased exposure to extreme heat and pollution (39).
As the climate crisis progresses, heat and air pollution degrees and extremes are projected to increase, and extreme exposures are more likely to co-occur (16). Particle-producing wildfires, for example, occur more frequently and are more intense during heatwaves. PM2.5 concentrations can also be increased as a result of stagnation events and wind or dust storms, increased photochemistry and resulting secondary organic aerosols because of higher temperature, and increased particle formation from biogenic volatile organic compounds during drier and warmer conditions. Since the early 1970s, the summertime temperature in California has increased by approximately 1.4°C, and wildfires have increased fivefold (3). Similar trends are being observed across Western North America and other areas with similar climates across the world (40, 41). The increases in mean summertime temperature are associated with more frequent, more intense, and longer-lasting extreme heat events (3, 41), which in turn can drive increases in PM2.5 concentrations (3, 40). Because of stricter emissions regulations, PM2.5 from anthropogenic sources will continue to decrease, and wildfire emissions, meteorological effects, and biogenic emissions that lead to the formation of secondary particulate matter will become increasingly important drivers of extreme PM2.5 concentrations (10, 42). Consequently, PM2.5 air quality has continued to improve in most of the United States except for areas prone to high wildfires (7). Thus, California, and areas with similar climates across the world, will continue to experience more frequent coexposure to extremes of heat and air pollution as the climate crisis progresses, and health impacts will synergistically worsen beyond the sum of individual effects of temperature and PM2.5.
Several studies have examined the interaction between heat and air pollution and found inconsistent results. Two recent systematic reviews found weak evidence for temperature effect modification by higher air pollution concentrations or vice versa (43, 44). About one-third of studies reported an interactive effect between temperature and particulate matter air pollution (44). The mortality effect of PM2.5 was greater on high-temperature days in some studies and on low-temperature days in others (43). The mortality effect of temperature has also been reported to be larger on high PM2.5 days and not to vary by pollutant concentration (43). Geographic differences in seasonal patterns could explain some inconsistencies. In many parts of the world, PM2.5 concentration is higher during the cool season, when stagnant air conditions are typically prevalent (45), but could be high on some days during summertime in wildfire-prone areas (such as Eastern Australia and the Western United States) and in desert or dust prone areas (such as the Middle East and Africa). This seasonality could minimize the chances of seeing an interaction between temperature and PM2.5 with the traditional interaction modeling framework.
In this study, we observed increased mortality risk for all-cause, cardiovascular, and respiratory diseases. Effect estimates for respiratory mortality were somewhat larger than cardiovascular and all-cause mortality. The larger association with respiratory mortality was plausible because the extreme PM2.5 days in the Western United States were mostly driven by wildfires (6). In studies of wildfires and associated PM2.5 and hospital admissions, associations with respiratory illnesses were stronger than with cardiovascular admissions (46).
Exposure to daytime high temperatures is known to increase the risk of mortality, but few studies report that high nighttime temperatures may carry an additional risk of mortality (47, 48). Consistent with some prior studies (49, 50), we used daily minimum temperatures as a proxy for nighttime heat exposure, which is sometimes criticized because of having a high correlation with daily maximum temperatures. We examined the mortality association on days with co-occurrence of extreme PM2.5 with Tmax and PM2.5 with Tmin, and the association was largest on days with co-occurrence of extreme Tmin and PM2.5. One hypothesis for this larger coexposure effect with Tmin may be because high nighttime temperatures interfere with physiological processes that regulate the sleep–wake cycle and thermoregulation (48). In addition, extreme Tmin, which likely reflects nighttime temperatures, may have lower exposure misclassification compared with extreme Tmax, which likely reflects daytime temperatures, because most people are home at night and may be away from home during the day, resulting in more robust Tmin associations for all three mortality outcomes.
This study has some limitations. First, there could be exposure measurement error as we used a residential census tract to assign temperature and air pollution exposure concentrations rather than the exact home address or place of death. Second, temperature and PM2.5 data used in this analysis were monitored outside while people usually spend more time inside during hot days. Third, we do not have information on the decedent’s air-conditioning use, which might modify the extreme temperature effects on mortality. All three of these limitations could contribute to exposure misclassification. Although we conducted the exposure assessment using the same methodology for all case and control days, a person’s behavior might be different across the month that they died (e.g., stayed indoors more in the days leading up to death or if there was a high heat or pollution event), which could affect exposure misclassification and potentially bias estimates. Fourth, a small number of days with co-occurring extreme Tmax, extreme Tmin, and extreme PM2.5 were observed in our dataset, thus, the mortality effects of coexposure to all three extremes could not be investigated. Fifth, extreme PM2.5 days could be driven by wildfires in California, but we do not have direct estimates for the PM2.5 contributed by wildfires. However, we manually matched the 1,380 co-occurring extreme (>99th percentile) Tmax and PM2.5 days by the start date, date contained, and location of wildfire events in California. Wildfire information was obtained from the CAL FIRE website (https://www.fire.ca.gov/). We found that all those identified co-occurred extreme (>99th percentile) Tmax and PM2.5 days were linked to documented wildfire events in California. A future study incorporating PM2.5 contributed by wildfires is warranted.
Conclusions
In this California statewide study from 2014 to 2019, acute exposure to extreme heat and air pollution were individually associated with increased risk of mortality; however, coexposure to both extremes had a greater mortality effect that was beyond the sum of their individual effects. Assessment of the health impacts of combined exposure to extreme air pollution and heat events is urgent, given projected increases in the frequency of heatwaves and high pollution days with the progression of climate change. These extremes will likely increasingly co-occur as a result of the shared underlying effects of climate change, so the cumulative burden of climate change-driven extreme air pollution and temperature cannot be estimated from the extreme of each acting alone but from their co-occurrences. Accurate mortality effect estimates of heat and air pollution coexposure should lead to improved climate change health impact assessments and better guide adaptation policy and interventions to reduce deaths occurring during extreme heat and particulate pollution days.
Ethical approval: This study was approved by the Committee for the Protection of Human Subjects of the state of California.
Acknowledgments
Acknowledgments
We dedicate this paper to the memory of our great colleague and friend Dr. George Ban-Weiss.
Footnotes
Supported by the University of Southern California Office of Research Strategic Development of Research Award (L.P.); the National Science Foundation (NSF) grant CBET-1752522 (G.B.-W.); and the National Institute of Environmental Health Sciences grant P30ES007048 (to R.M., G.B.-W, and E.G.).
Author Contributions: M.M.R., R.M., and E.G. conceived the study and contributed to the study design. M.M.R. wrote the original draft with the help of E.G. M.M.R. and E.G. contributed to the methodology, data curation, software use, formal data analysis, and data visualization. F.W.L. contributed exposure data sources. All authors helped revise the manuscript, commented on the manuscript, and contributed to discussion. R.M. contributed to interpreting the results and added intellectual content to the manuscript. E.G., R.M., and G.B.-W. contributed to funding acquisition. E.G. and R.M. contributed to supervision and project administration. M.M.R. and E.G. had full access to all data in the study.
This article has an online supplement, which is accessible from this issue’s table of contents at www.atsjournals.org.
Originally Published in Press as DOI: 10.1164/rccm.202204-0657OC on June 21, 2022
Author disclosures are available with the text of this article at www.atsjournals.org.
References
- 1. Watts N, Amann M, Arnell N, Ayeb-Karlsson S, Beagley J, Belesova K, et al. The 2020 report of The Lancet Countdown on health and climate change: responding to converging crises. Lancet . 2021;397:129–170. doi: 10.1016/S0140-6736(20)32290-X. [DOI] [PMC free article] [PubMed] [Google Scholar]
- 2.IPCC. Climate change 2021: The physical science basis. Contribution of Working Group I to the sixth assessment report of the Intergovernmental Panel on Climate Change (Masson-Delmotte V, Zhai P, Pirani A, Connors SL, Péan C, Berger S, et al., editors). Cambridge, United Kingdom, and New York, NY: Cambridge University Press; 2021.
- 3. Williams AP, Abatzoglou JT, Gershunov A, Guzman-Morales J, Bishop DA, Balch JK, et al. Observed impacts of anthropogenic climate change on wildfire in California. Earths Futur . 2019;7:892–910. [Google Scholar]
- 4. Xu R, Yu P, Abramson MJ, Johnston FH, Samet JM, Bell ML, et al. Wildfires, global climate change, and human health. N Engl J Med . 2020;383:2173–2181. doi: 10.1056/NEJMsr2028985. [DOI] [PubMed] [Google Scholar]
- 5. Kollanus V, Tiittanen P, Niemi JV, Lanki T. Effects of long-range transported air pollution from vegetation fires on daily mortality and hospital admissions in the Helsinki metropolitan area, Finland. Environ Res . 2016;151:351–358. doi: 10.1016/j.envres.2016.08.003. [DOI] [PubMed] [Google Scholar]
- 6. Kalashnikov DA, Schnell JL, Abatzoglou JT, Swain DL, Singh D. Increasing co-occurrence of fine particulate matter and ground-level ozone extremes in the Western United States. Sci Adv . 2022;8:eabi9386. doi: 10.1126/sciadv.abi9386. [DOI] [PMC free article] [PubMed] [Google Scholar]
- 7. McClure CD, Jaffe DA, D. MC US particulate matter air quality improves except in wildfire-prone areas. Proc Natl Acad Sci USA . 2018;115:7901–7906. doi: 10.1073/pnas.1804353115. [DOI] [PMC free article] [PubMed] [Google Scholar]
- 8. Sullivan TJ, Driscoll CT, Beier CM, Burtraw D, Fernandez IJ, Galloway JN, et al. Air pollution success stories in the United States: the value of long-term observations. Environ Sci Policy . 2018;84:69–73. [Google Scholar]
- 9. Dallmann TR, Harley RA. Evaluation of mobile source emission trends in the United States. J Geophys Res Atmos . 2010;115 [Google Scholar]
- 10. Kaulfus AS, Nair U, Jaffe D, Christopher SA, Goodrick S. Biomass burning smoke climatology of the United States: implications for particulate matter air quality. Environ Sci Technol . 2017;51:11731–11741. doi: 10.1021/acs.est.7b03292. [DOI] [PubMed] [Google Scholar]
- 11. Mazdiyasni O, AghaKouchak A, Davis SJ, Madadgar S, Mehran A, Ragno E, et al. Increasing probability of mortality during Indian heat waves. Sci Adv . 2017;3:e1700066. doi: 10.1126/sciadv.1700066. [DOI] [PMC free article] [PubMed] [Google Scholar]
- 12. D’Ippoliti D, Michelozzi P, Marino C, de’Donato F, Menne B, Katsouyanni K, et al. The impact of heat waves on mortality in 9 European cities: results from the EuroHEAT project. Environ Health . 2010;9:37. doi: 10.1186/1476-069X-9-37. [DOI] [PMC free article] [PubMed] [Google Scholar]
- 13. Son J-Y, Lee J-T, Anderson GB, Bell ML. The impact of heat waves on mortality in seven major cities in Korea. Environ Health Perspect . 2012;120:566–571. doi: 10.1289/ehp.1103759. [DOI] [PMC free article] [PubMed] [Google Scholar]
- 14. Di Q, Dai L, Wang Y, Zanobetti A, Choirat C, Schwartz JD, et al. Association of short-term exposure to air pollution with mortality in older adults. JAMA . 2017;318:2446–2456. doi: 10.1001/jama.2017.17923. [DOI] [PMC free article] [PubMed] [Google Scholar]
- 15. Liu Y, Pan J, Fan C, Xu R, Wang Y, Xu C, et al. Short-term exposure to ambient air pollution and mortality from myocardial infarction. J Am Coll Cardiol . 2021;77:271–281. doi: 10.1016/j.jacc.2020.11.033. [DOI] [PubMed] [Google Scholar]
- 16. Schnell JL, Prather MJ. Co-occurrence of extremes in surface ozone, particulate matter, and temperature over eastern North America. Proc Natl Acad Sci USA . 2017;114:2854–2859. doi: 10.1073/pnas.1614453114. [DOI] [PMC free article] [PubMed] [Google Scholar]
- 17. Kelly FJ, Fussell JC. Linking ambient particulate matter pollution effects with oxidative biology and immune responses. Ann N Y Acad Sci . 2015;1340:84–94. doi: 10.1111/nyas.12720. [DOI] [PubMed] [Google Scholar]
- 18. Leni Z, Künzi L, Geiser M. Air pollution causing oxidative stress. Curr Opin Toxicol . 2020;20–21:1–8. [Google Scholar]
- 19. Slimen IB, Najar T, Ghram A, Dabbebi H, Ben Mrad M, Abdrabbah M. Reactive oxygen species, heat stress and oxidative-induced mitochondrial damage. A review. Int J Hyperthermia . 2014;30:513–523. doi: 10.3109/02656736.2014.971446. [DOI] [PubMed] [Google Scholar]
- 20. Habashy WS, Milfort MC, Rekaya R, Aggrey SE. Cellular antioxidant enzyme activity and biomarkers for oxidative stress are affected by heat stress. Int J Biometeorol . 2019;63:1569–1584. doi: 10.1007/s00484-019-01769-z. [DOI] [PubMed] [Google Scholar]
- 21. Jacobs PJ, Oosthuizen MK, Mitchell C, Blount JD, Bennett NC. Heat and dehydration induced oxidative damage and antioxidant defenses following incubator heat stress and a simulated heat wave in wild caught four-striped field mice Rhabdomys dilectus. PLoS One . 2020;15:e0242279. doi: 10.1371/journal.pone.0242279. [DOI] [PMC free article] [PubMed] [Google Scholar]
- 22. Hardin E, AghaKouchak A, Qomi MJA, Madani K, Tarroja B, Zhou Y, et al. California drought increases CO2 footprint of energy. Sustain Cities Soc . 2017;28:450–452. [Google Scholar]
- 23.Sarofim MC, Saha S, Hawkin MD, Mills DM, Hess J, Horto R, et al. US Global Change Research Program Ch2: temperature-related death and illness. The impacts of climate change on human health in the United States: a scientific assessment. 2016. [accessed 2021 Dec 4]. Available from: https://health2016.globalchange.gov/low/ClimateHealth2016_02_Temperature_small.pdf
- 24.Reidmiller D, Avery C, Easterling D, Kunkel K, Lewis K, Maycock T, et al. US Global Change Research Program Impacts, risks, and adaptation in the United States: fourth national climate assessment, volume II. 2017. [accessed 2021 Dec 4]. Available from: https://nca2018.globalchange.gov/downloads/NCA4_Report-in-Brief.pdf.
- 25. Jacob DJ, Winner DA. Effect of climate change on air quality. Atmos Environ . 2009;43:51–63. [Google Scholar]
- 26.U.S. EPA (U.S. Environmental Protection Agency). 2019. Integrated science assessment (ISA) for particulate matter (final report, Dec. 2019). EPA/600/R-19/188. Washington, DC: U.S. EPA [accessed 2021 Nov 23]. Available from: https://cfpub.epa.gov/ncea/risk/recordisplay.cfm?deid=347534
- 27. Di Q, Dai L, Wang Y, Zanobetti A, Choirat C, Schwartz JD, et al. Association of short-term exposure to air pollution with mortality in older adults. JAMA . 2017;318:2446–2456. doi: 10.1001/jama.2017.17923. [DOI] [PMC free article] [PubMed] [Google Scholar]
- 28. Liu Y, Pan J, Zhang H, Shi C, Li G, Peng Z, et al. Short-term exposure to ambient air pollution and asthma mortality. Am J Respir Crit Care Med . 2019;200:24–32. doi: 10.1164/rccm.201810-1823OC. [DOI] [PubMed] [Google Scholar]
- 29. Carracedo-Martínez E, Taracido M, Tobias A, Saez M, Figueiras A. Case-crossover analysis of air pollution health effects: a systematic review of methodology and application. Environ Health Perspect . 2010;118:1173–1182. doi: 10.1289/ehp.0901485. [DOI] [PMC free article] [PubMed] [Google Scholar]
- 30. Maclure M, Mittleman MA. Should we use a case-crossover design? Annu Rev Public Health . 2000;21:193–221. doi: 10.1146/annurev.publhealth.21.1.193. [DOI] [PubMed] [Google Scholar]
- 31. Janes H, Sheppard L, Lumley T. Case-crossover analyses of air pollution exposure data: referent selection strategies and their implications for bias. Epidemiology . 2005;16:717–726. doi: 10.1097/01.ede.0000181315.18836.9d. [DOI] [PubMed] [Google Scholar]
- 32. Bateson TF, Schwartz J. Selection bias and confounding in case-crossover analyses of environmental time-series data. Epidemiology . 2001;12:654–661. doi: 10.1097/00001648-200111000-00013. [DOI] [PubMed] [Google Scholar]
- 33. Wong DW, Yuan L, Perlin SA. Comparison of spatial interpolation methods for the estimation of air quality data. J Expo Anal Environ Epidemiol . 2004;14:404–415. doi: 10.1038/sj.jea.7500338. [DOI] [PubMed] [Google Scholar]
- 34. Eckel SP, Cockburn M, Shu Y-H, Deng H, Lurmann FW, Liu L, et al. Air pollution affects lung cancer survival. Thorax . 2016;71:891–898. doi: 10.1136/thoraxjnl-2015-207927. [DOI] [PMC free article] [PubMed] [Google Scholar]
- 35. Abatzoglou JT. Development of gridded surface meteorological data for ecological applications and modelling. Int J Climatol . 2013;33:121–131. [Google Scholar]
- 36. Anderson GB, Bell ML. Heat waves in the United States: mortality risk during heat waves and effect modification by heat wave characteristics in 43 U.S. communities. Environ Health Perspect . 2011;119:210–218. doi: 10.1289/ehp.1002313. [DOI] [PMC free article] [PubMed] [Google Scholar]
- 37.Stevenson M, Sergeant E. Tools for the analysis of epidemiological data. R package version 2.0.19. 2021. [accessed 2022 Apr 2]. Available from: https://cran.r-project.org/package=epiR.
- 38. Millyard A, Layden JD, Pyne DB, Edwards AM, Bloxham SR. Impairments to thermoregulation in the elderly during heat exposure events. Gerontol Geriatr Med . 2020;6:2333721420932432. doi: 10.1177/2333721420932432. [DOI] [PMC free article] [PubMed] [Google Scholar]
- 39. Malmquist A, Hjerpe M, Glaas E, Karlsson H, Lassi T. Elderly people’s perceptions of heat stress and adaptation to heat: an interview study. Int J Environ Res Public Health . 2022;19:3775. doi: 10.3390/ijerph19073775. [DOI] [PMC free article] [PubMed] [Google Scholar]
- 40.Abatzoglou JT, Williams AP. Impact of anthropogenic climate change on wildfire across western US forests. Vol. 113, Proceedings of the National Academy of Sciences of the United States of America. 201611770–5. [DOI] [PMC free article] [PubMed] [Google Scholar]
- 41. Ruffault J, Curt T, Moron V, Trigo RM, Mouillot F, Koutsias N, et al. Increased likelihood of heat-induced large wildfires in the Mediterranean Basin. Sci Rep . 2020;10:13790. doi: 10.1038/s41598-020-70069-z. [DOI] [PMC free article] [PubMed] [Google Scholar]
- 42. Nussbaumer CM, Cohen RC. Impact of OA on the temperature dependence of PM 2.5 in the Los Angeles Basin. Environ Sci Technol . 2021;55:3549–3558. doi: 10.1021/acs.est.0c07144. [DOI] [PubMed] [Google Scholar]
- 43. Son JY, Liu JC, Bell ML. Temperature-related mortality: a systematic review and investigation of effect modifiers. Environ Res Lett . 2019;14:073004. [Google Scholar]
- 44. Anenberg SC, Haines S, Wang E, Nassikas N, Kinney PL. Synergistic health effects of air pollution, temperature, and pollen exposure: a systematic review of epidemiological evidence. Environ Health . 2020;19:130. doi: 10.1186/s12940-020-00681-z. [DOI] [PMC free article] [PubMed] [Google Scholar]
- 45. Hou P, Wu S. Long-term changes in extreme air pollution meteorology and the implications for air quality. Sci Rep . 2016;6:23792. doi: 10.1038/srep23792. [DOI] [PMC free article] [PubMed] [Google Scholar]
- 46. Delfino RJ, Brummel S, Wu J, Stern H, Ostro B, Lipsett M, et al. The relationship of respiratory and cardiovascular hospital admissions to the southern California wildfires of 2003. Occup Environ Med . 2009;66:189–197. doi: 10.1136/oem.2008.041376. [DOI] [PMC free article] [PubMed] [Google Scholar]
- 47. Royé D. The effects of hot nights on mortality in Barcelona, Spain. Int J Biometeorol . 2017;61:2127–2140. doi: 10.1007/s00484-017-1416-z. [DOI] [PubMed] [Google Scholar]
- 48. Murage P, Hajat S, Kovats RS. Effect of night-time temperatures on cause and age-specific mortality in London. Environ Epidemiol . 2017;1:e005. doi: 10.1097/EE9.0000000000000005. [DOI] [PMC free article] [PubMed] [Google Scholar]
- 49. Ragettli MS, Vicedo-Cabrera AM, Schindler C, Röösli M. Exploring the association between heat and mortality in Switzerland between 1995 and 2013. Environ Res . 2017;158:703–709. doi: 10.1016/j.envres.2017.07.021. [DOI] [PubMed] [Google Scholar]
- 50.Vicedo-Cabrera AM, Ragettli MS, Schindler C, Röösli M.Excess mortality during the warm summer of 2015 in Switzerland Swiss Med Wkly 2016146w14379. [DOI] [PubMed] [Google Scholar]