Keywords: diabetic bladder dysfunction; inflammation; NOD-, LRR-, and pyrin domain-containing protein 3; urothelial barrier
Abstract
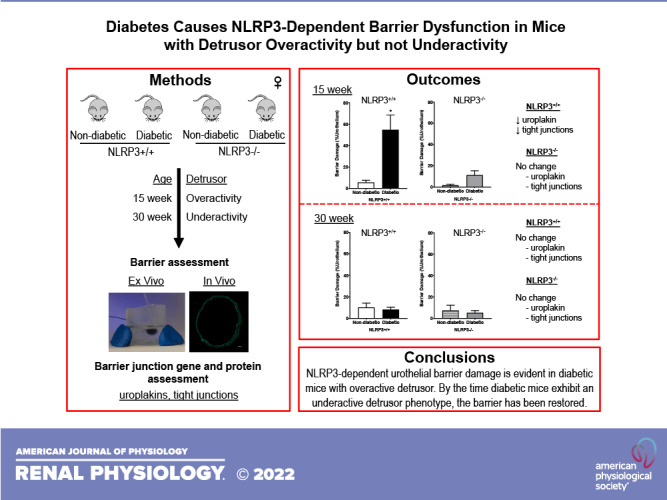
Approximately half of the patients with diabetes develop diabetic bladder dysfunction (DBD). The initiation and progression of DBD is largely attributed to inflammation due to dysregulated glucose and the production of toxic metabolites that activate the NOD-, LRR-, and pyrin domain-containing protein 3 (NLRP3) inflammasome. NLRP3 activation leads to the production and release of proinflammatory cytokines and causes urothelial pyroptosis, a form of programmed cell necrosis, which we hypothesize compromises urothelial barrier integrity. Here, we investigated how NLRP3-dependent inflammation impacts barrier function during the progression of diabetes using a type 1 diabetic female Akita mouse model that progresses from an early overactive to a late underactive detrusor phenotype at 15 and 30 wk, respectively. To determine the specific role of NLRP3, Akita mice were crossbred with mice lacking the NLRP3 gene. To determine barrier function, permeability to small molecules was assessed, ex vivo using Evans blue dye and in vivo using sulfo-NHS-biotin. Both ex vivo and in vivo permeabilities were increased in diabetic mice at 15 wk. Expression of uroplakin and tight junction components was also significantly downregulated at 15 wk. Interestingly, diabetic mice lacking the NLRP3 gene showed no evidence of barrier damage or downregulation of barrier genes and proteins. At the 30-wk time point, ex vivo and in vivo barrier damage as well as barrier component downregulation was no longer evident in diabetic mice, suggesting urothelial repair or remodeling occurs between the overactive and underactive stages of DBD. Collectively, these findings demonstrate the role of NLRP3-mediated inflammation in urothelial barrier damage associated with detrusor overactivity but not underactivity.
NEW & NOTEWORTHY This is the first study to demonstrate that NLRP3-mediated inflammation is responsible for urothelial barrier damage in type 1 diabetic female Akita mice with an overactive bladder. Eliminating the NLRP3 gene in these diabetic mice prevented barrier damage as a result of diabetes. By the time female Akita mice develop an underactive phenotype, the urothelial barrier has been restored, suggesting that inflammation is a critical causative factor early in the development of diabetic bladder dysfunction.
INTRODUCTION
An estimated 34 million adults in the United States, ∼10% of the total population, suffer from diabetes, and another 88 million Americans are prediabetic and have an increased risk of developing diabetes (1). Clearly, diabetes is a national epidemic and in 2017 was the seventh leading cause of death in the United States (1). Although the mortality of this disease is disturbing, the majority of diabetic morbidity is arguably from the plethora of complications associated with it. The possible complications are numerous, and many have their own mortality associated with them, but urological complications are the most common, with more than 50% of individuals with diabetes suffering from some type of bladder dysfunction (2, 3).
Diabetic bladder dysfunction (DBD) has profound negative impacts on quality of life, and our current understanding suggests that these progressively worsening symptoms can be grouped into two distinct temporal phases: early and late DBD (4–6). The lines defining these phases can be blurry, and not all patients follow a clear progression from one to the other. Early DBD is characterized by overactive bladder symptoms such as increased urgency, increased voiding frequency, and urge incontinence. As DBD progresses to the late phase, the detrusor becomes decompensated and unable to effectively empty the bladder. Clinically, late underactive bladder symptoms such as overflow incontinence manifest. Managing DBD symptoms is challenging since there are no targeted therapies available and little is known about the etiology underlying the temporal decline in bladder function. To develop effective therapies, we must better understand the mechanisms responsible for DBD progression.
Inflammation is recognized as a contributing factor to the progression of both type 1 and type 2 diabetes (7). Determining the cause of inflammation and subsequent pathology is critical. Polyuria is a common urological condition associated with diabetes; however, it is hyperglycemia, not polyuria, that promotes the development of DBD (8). It is well appreciated that hyperglycemia and dysregulated glucose metabolism generate toxic metabolites responsible for eliciting proinflammatory responses and subsequent cellular damage throughout the body. Many of these diabetic metabolites also accumulate in urine before excretion and provide a direct insult to apical urothelial cells within the bladder. Emerging evidence demonstrates the central mediator responsible for DBD inflammation is the NOD-, LRR-, and pyrin domain-containing protein 3 (NLRP3) inflammasome (9, 10). This component of the innate immune system is ubiquitously expressed within bladder urothelia (9, 11, 12) and can be activated in vitro by diabetic metabolites (9). Upon activation, the NLRP3 inflammasome complex oligomerizes and activates the protease caspase-1, which, in turn, generates the mature proinflammatory cytokines IL-1β and IL-18 in the cytoplasm. Caspase-1 also cleaves gasdermin D, and these cleaved fragments assemble into a pore on the plasma membrane. This pore allows water to enter the cell and the cells to lyse in a form of programmed necrosis called pyroptosis. This rupture releases proinflammatory cytokines, thereby propagating the inflammatory reaction in the bladder (13).
The precise effects of NLRP3 activation on urothelial barrier function during diabetes, or other inflammatory diseases, are not well characterized. Bladder urothelia form one of the tightest barriers in the human body. This critical function protects underlying tissues from harsh waste products, toxins, bacteria, and proinflammatory metabolites found in urine. Like other epithelia, urothelia contain structures responsible for forming and maintaining barrier function including tight junctions and adherens junctions. Tight junctions regulate paracellular transport, whereas adherens junctions serve a critical role in initiating and stabilizing cell-cell adhesions (14). Urothelia also have an additional layer of protection in the form of uroplakins. These hexagonal proteinaceous plaques cover ∼90% of the apical surface of the urothelia and help prevent urine from penetrating into the tissue (15, 16). Damage to these structures is well known to result in a breakdown of barrier function. Interestingly, temporal damage and remodeling of these urothelial structures have been demonstrated in a type 1 diabetic rat model (17). Our goal for the present study was to evaluate changes in urothelial barrier function and determine the role of NLRP3 in the progression of DBD. We hypothesized that NLRP3-dependent mechanisms, activated during the progression of diabetes, damage the urothelial barrier, resulting in an increased flux of molecules from the lumen to submucosa. Such molecules, which would include diabetic metabolites, could further exacerbate inflammation, worsen symptoms, and drive DBD progression.
To address this hypothesis, we used a type 1 diabetic Akita mouse model. Akita mice have a heterozygous mutation of the insulin 2 (Ins2) gene, which causes them to develop type 1 diabetes. Although most work with this model has used male mice, we have found that female Akita mice develop a temporal progression of bladder dysfunction, making them an ideal model to study DBD progression. Specifically, by 15 wk, female Akita mice exhibit an overactive detrusor phenotype, whereas at 30 wk, these mice have progressed to an underactive detrusor phenotype (9, 10). We examined these two time points to determine if there are changes in urothelial barrier function. To determine how NLRP3 contributes to the development and progression of DBD in Akita mice, we further crossbred them with mice lacking the NLRP3 gene and assessed barrier function at these time points.
METHODS
Animals
All animal procedures were conducted in accordance to guidelines set forth by the National Institutes of Health Guide for the Care and Use of Laboratory Animals and were approved by the Duke University Medical Center Institutional Animal Care and Use Committee. Founding mice, consisting of type 1 diabetic Akita (C57BL/6J-Ins2Akita/J, Stock No. 003548) and NLRP3−/− (B6.129S6-Nlrp3tm1Bhk/J, Stock No. 021302) strains, were purchased from Jackson Laboratory (Bar Harbor, ME). Although the origin strain of NLRP3−/− mice (129S6/SvEvTac) differs from the Akita background (C57BL/6J), these mice have been backcrossed to C57BL/6J for >11 generations before purchase. Mouse colonies were bred and maintained by the Duke University Breeding Core Facility. Mice were cohoused at 22 ± 2°C on 12:12-h light-dark cycles. Water and standard rodent chow were provided ad libitum. All mice were genotyped by Transnetyx (Cordova, TN) and were provided to the laboratory at ∼4 wk of age. Genotype results placed animals into one of the following four different experimental groups: 1) nondiabetic NLRP3+/+ (homozygous Ins2 genes, homozygous NLRP3 genes) (control), 2) diabetic NLRP3+/+ (heterozygous Ins2 genes, homozygous NLRP3 genes) (Akita), 3) nondiabetic NLRP3−/− (homozygous Ins2 genes, NLRP3 gene deletion) (NLRP3-null control), and 4) diabetic NLRP3−/− (heterozygous Ins2 genes, NLRP3 gene deletion) (NLRP3-null Akita). Female mice were used in this study and aged between 15 and 30 wk (9, 10).
Our laboratory has previously demonstrated that female Akita mice develop detrusor overactivity at 15 wk, which progresses to detrusor underactivity at 30 wk (9, 10), and we used this information to draw conclusions in the present report. We have chosen to not reproduce these published sets of data in the present set of animals to better confirm to the 3Rs (replacement, reduction, and refinement) touted by the National Institutes of Health regarding the use of experimental animals in research. Not repeating these experiments in the present set of animals to ensure continuing authenticity represents a major limitation to the present study. However, the mice used in this study were generated from the same mouse colony as these previous works and the colony has been maintained by the Duke University Breeding Core Facility. All further references to Akita mice demonstrating overactive or underactive phenotypes are direct references to our previously published work (9, 10).
Ex Vivo Barrier Permeability
To measure barrier function across the entire urothelia, we modified an existing ex vivo detrusor-denuded procedure (18). Briefly, mice were euthanized by isoflurane inhalation. Bladders were excised distal to the bladder neck and placed in cold Krebs solution consisting of 118.5 mM NaCl, 58.44 mM KCl, 1.2 mM MgCl2, 23.8 mM NaHCO3, 1.2 mM KH2PO4, 11 mM dextrose, and 1.8 mM CaCl2. Detrusors were carefully removed from the mucosal layer without damaging urothelial barrier integrity. The urothelial “balloon” was cannulated with a PE-10 catheter and tied just proximal to ureters using silk 6-0 suture to create a water-tight seal. The catheter was connected to a syringe pump (Cat. No. R-100EC, Razel, Georgia, VT), and the entire preparation was bathed in Krebs solution (37°C, 5 mL aerated with 95% O2-5% CO2) and allowed to acclimate for 30 min. Evans blue dye dissolved in Krebs solution (1 mg/mL, Cat. No. 151108, MP Biomedicals, Solon, OH) was then infused intravesically at a rate of 15 μL/min for 10 min (total volume: 150 μL). The urothelial preparations then remained inflated for an additional 30 min before the bathing Krebs solution was collected. Evans blue that permeated through urothelia and into the bathing solution was quantified spectrophotometrically using a Tecan Infinite M200 Pro plate reader with i-control 1.11 software (620 nm, Tecan, Mannedorf, Switzerland) and an Evans blue standard curve.
In Vivo Barrier Permeability
Bladder permeability was assessed in vivo using a method modified from that of Montalbetti et al. (19). Mice were anesthetized via 2–4% isoflurane inhalation (Pivetal, Liberty, MO) delivered in medical oxygen by a calibrated continuous flow isoflurane vaporizer (VetEquip, Livermore, CA). Mice remained anesthetized for the duration of the procedure. A PE-10 catheter was inserted into the urethra, and correct catheter placement was confirmed by visible urine backflow into catheter. Following placement, a 2-cm incision was made in the lower abdominal wall to expose the urethra, and a silk 6-0 suture was tied around the proximal urethra to secure the catheter and create a water-tight seal. Bladders were manually expressed before intravesical instillations. The 443-Da molecule EZ-link Sulfo-NHS-Biotin (sulfo-NHS-biotin; Cat. No. 21217, Thermo Fisher, Waltham, MA) was dissolved (1 mg/mL) in PBS, and 150 μL, a volume equivalent to the average control NLRP3+/+ urinary voiding volume, were instilled intravesically (9). After a 30-min incubation period, the biotin-containing buffer was removed. Bladders were inflated with 150 μL of 4% paraformaldehyde. Catheters were then removed, and the sutures were quickly tightened to prevent leakage before the bladders were excised and immersed in additional paraformaldehyde. Bladders underwent a 4-h fixation period followed by paraffin embedding and sectioning using standard methods.
Transverse sections (5 μm) were cut from the distal half of the bladders. Following deparaffinization and rehydration, citrate antigen retrieval was performed using standard methods. Slides were blocked in PBS containing 0.1% BSA and 5% normal goat serum (Cat. No. 005-000-121, Jackson ImmunoResearch; West Grove, PA). Slides were labeled with anti-zona occludens (ZO)1 primary antibody [1:100, Cat. No. GTX108613, Genetex; Irvine, CA; Antibody No. 1952257 in the Antibody Registry, http://137.110.114.81/ (20, 21)] and Alexa Fluor 488-conjugated secondary antibody (1:500, Cat. No. 111-545-144, Jackson ImmunoResearch). Sulfo-NHS-biotin detection was achieved by incubating slides with Texas red-conjugated streptavidin (1:500, Cat. No. S872, Invitrogen, Waltham, MA). Imaging was performed using a Zeiss Axio Imager 2 microscope and Zen 2 (blue edition) software (Zeiss, Oberkochen, Germany). Entire bladder cross sections were obtained using Zen 2 software to automatically collate and stitch individual ×20 magnification images. Images were exported as TIFF files and analyzed with NIS-Elements Basic Research software (Nikon, Melville, NY). Barrier damage was calculated as the percentage of the urothelia in which sulfo-NHS-biotin had penetrated through the apical surface. This was determined by measuring the length of apical urothelia containing sulfo-NHS-biotin in underlying lamina propria normalized as a percentage of total apical urothelia circumference.
Gene Expression
Bladders removed from euthanized mice were cut longitudinally to expose urothelia, which were then gently scraped from detrusors and collected in cold PBS (22). Cells were pelleted by centrifugation at 1,000 g for 5 min, resuspended in RNAlater solution (Cat. No. AM7024, ThermoFisher), and stored at −20°C. RNA extraction was performed using the RNeasy Mini Kit (Cat. No. 74104, Qiagen, Hilden, Germany) following manufacturer’s protocol. cDNA synthesis was performed using a reverse transcription kit (Cat. No. 4368814, Applied Biosystems, Waltham, MA) as directed by the manufacturer. cDNA was combined with PowerUp SYBR Green Master Mix (Cat. No. A25741, Applied Biosystems) and the primers shown in Table 1 to perform quantitative PCR with a CFX96 Touch Real-Time PCR Detection System (Bio-Rad, Hercules, CA). Gene expression was normalized to glyceraldehyde-3-phosphate dehydrogenase (GAPDH) and reported as the fold change between nondiabetic NLRP3+/+ and diabetic NLRP3+/+ mice as well as nondiabetic NLRP3−/− and diabetic NLRP3−/− mice using the ΔΔCt method (where Ct is threshold cycle) (23).
Table 1.
Primers used for quantitative PCR
| Gene | Forward Primer (5′-3′) | Reverse Primer (5′-3′) |
|---|---|---|
| Uroplakin 1b (UP1b) | CACTGTTCGTTGCTTCCAGG | GCTTCGAGAAGTGGGTAAAGACT |
| Uroplakin 2 (UP2) | TGCCCCTGATCCTGATTCTG | CAAGGCAATTAACAGGCTTTCTG |
| Zona occludens 1 (ZO1) | GCCGCTAAGAGCACAGCAA | TCCCCACTCTGAAAATGAGGA |
| Zona occludens 2 (ZO2) | ATGGGAGCAGTACACCGTGA | TGACCACCCTGTCATTTTCTTG |
| Claudin 4 (CL4) | GTCCTGGGAATCTCCTTGGC | TCTGTGCCGTGACGATGTTG |
| Claudin 8 (CL8) | GCAACCTACGCTCTTCAAATGG | TTCCCAGCGGTTCTCAAACAC |
| β-Catenin (BCAT) | ATGGAGCCGGACAGAAAAGC | CTTGCCACTCAGGGAAGGA |
| Glyceraldehyde-3-phosphate dehydrogenase (GAPDH) | AGGTCGGTGTGAACGGATTTG | TGTAGACCATGTAGTTGAGGTCA |
Protein Expression
Bladders were excised from euthanized mice. The muscosal layer and detrusor were carefully separated and stored at −80°C. Frozen tissue was then homogenized using brief sonication in ice-cold RIPA buffer (150 mM NaCl, 1% Triton X-100, 0.5% sodium deoxycholate, 0.1% SDS, and 50 mM Tris at pH 7.4) supplemented with a protease and phosphatase inhibitor cocktail (Halt, Thermo Fisher). Homogenates were maintained at 4°C and centrifuged at 16,000 g for 15 min. Protein concentration was determined using a bicinchoninic acid (BCA) protein assay as directed by manufacturer (Pierce BCA Assay, Thermo Fisher). Proteins (15 µg) were separated under reduced conditions on 4–12% bis-Tris SDS polyacrylamide gels (Thermo Fisher). Molecular weight of proteins was determined using Precision Plus Protein WesternC Blotting Standards (Bio-Rad). Electrophoresis was conducted at a constant 100 V for 2 h, and gels were transferred onto nitrocellulose membranes. Membranes were blocked at room temperature for 1 h in PBS containing 5% BSA.
Membranes were probed overnight at 4°C for primary antibodies against the following: ZO1 (1:1,000, Cat. No. GTX108613, Genetex), uroplakin subunit 1b (UP1b; 1:1,000, Cat. No. sc-517025, Santa Cruz Biotechnology, Dallas, TX), and GAPDH (1:1,000, Cat. No. GTX100118, GeneTex). All primary and secondary antibodies were dissolved in PBS containing 0.1% Tween and 5% BSA. Secondary antibody incubation was performed at room temperature for 1 h using goat anti-rabbit Alexa Fluor 488 (1:5,000, Cat. No. 111-545-144, Jackson Immunoresearch) or donkey anti-mouse Alexa Fluor 488 (1:5,000, Cat. No. 715-545-150, Jackson Immunoresearch). Labeled proteins were detected using the ChemiDoc MP system (Bio-Rad). Protein expression analysis was conducted using Image Lab 6.1 software (Bio-Rad), and data were normalized to GAPDH expression.
Statistical Analysis
Graphs were created and statistical analysis was performed using Prism 9 software (GraphPad, San Diego, CA). All data are reported as means ± SE. For all analysis, Student’s t tests were used to detect significance between control NLRP3+/+ versus diabetic NLRP3+/+ and control NLRP3−/− versus diabetic NLRP3−/− groups. Statistical significance was defined as P < 0.05. Results of these statistical analyses are reported in text. Additional statistical analyses were performed to determine statistical differences among all four groups. For ex vivo, in vivo, and Western blot data sets, ANOVAs with Tukey post hoc tests were performed. For gene expression data sets, Kruskal–Wallis tests followed by uncorrected Dunn’s multiple comparison tests were performed. Statistical significance was defined as P < 0.05, and the results of these multiple comparison analyses are provided in Supplemental Material (Supplemental File S1; all Supplemental material is available at https://doi.org/10.6084/m9.figshare.20565333.v1).
RESULTS
Diabetes Causes Urothelial Barrier Damage via NLRP3-Dependent Inflammation at the 15-wk Time Point
Ex vivo evidence.
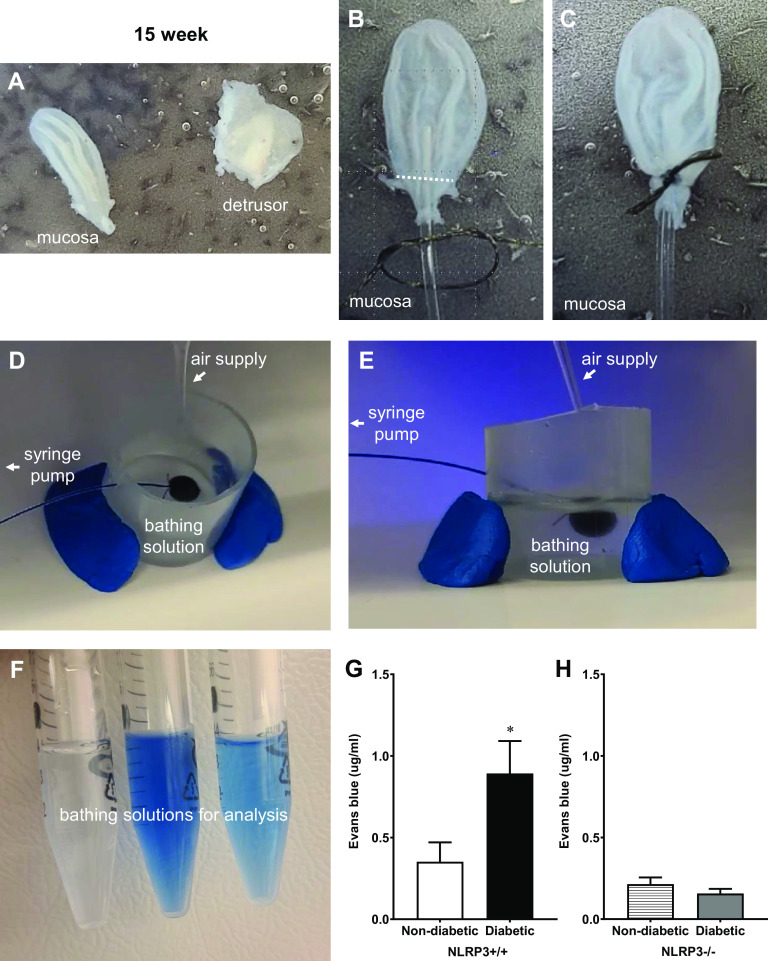
A key goal in this study was to measure barrier permeability across the entire urothelium. To do so, a novel detrusor denuded method that preserves normal urothelial anatomy (17) was modified to determine ex vivo barrier permeability. Representative images of key procedural steps are provided, starting with the critical step, which requires the mucosal layer to be separated from the detrusor without damaging it (Fig. 1A). The region proximal to the ureters where a suture is tied is indicated by the white dotted line in Fig. 1B and the suture in Fig. 1C. In Fig. 1, D and E, images of the same setup are shown from two different angles and indicate where the air supply, syringe pump, and bathing solution are in proximity to the ex vivo urothelial preparation. As detailed in the methods, Evans blue was instilled into the bladders and, after a period of incubation, the bathing solution was recovered. The resulting bathing solutions from three different samples are shown in Fig. 1F for illustration. Quantitation of the Evans blue is shown in Fig. 1, G and H. As shown in Fig. 1G, very little Evans blue permeated through control (nondiabetic NLRP3+/+) urothelia, yet a considerably higher amount of dye permeated through the urothelia of diabetic mice (NLRP3+/+), indicating significant barrier damage. NLRP3 gene deletion did not impact ex vivo barrier permeability in nondiabetic mice. In contrast, Evans blue permeation through NLRP3-null diabetic (NLRP3−/−) urothelia was not statistically different from nondiabetic controls (Fig. 1H).
Figure 1.
Diabetes increases ex vivo urothelial permeability to Evans blue dye at the 15-wk (overactive detrusor) time point through NOD-, LRR-, and pyrin domain-containing protein 3 (NLRP3)-dependent mechanisms. Representative images are shown to illustrate key steps in this procedure and are described in further detail within methods. A: detrusors were carefully removed from intact mucosal layers. B and C: the white dotted line indicates the region proximal to ureters where the suture was tied. D and E: images of a urothelial “balloon” inflated with Evans blue dissolved in Krebs solution are shown from two angles to illustrate the spacial relationship of the air supply, syringe pump, and bathing solution. F: after the balloons remained inflated for 30 min, bathing solutions from three individual samples were collected and are shown here prior to spectrophotometrical analysis. Barrier damage was identified by leakage of Evans blue dye through the mucosal layer and into the bathing solution. G: at the overactive 15-wk time point, significantly more Evans blue permeated the bladder mucosal layers isolated from diabetic NLRP3+/+ mice compared with nondiabetic NLRP3+/+ mice. H: in mice lacking the NLRP3 gene, Evans blue permeation was not significantly different between diabetic and nondiabetic mice. n = 6, 8, 4, and 6 animals, respectively. *P < 0.05 vs. nondiabetic control mice (Student’s t test).
In vivo evidence.
The barrier damage detected ex vivo was intriguing, and the next step was to determine the pattern of urothelial injury using in vivo methodology. To do so, we measured the diffusion of a small molecule (sulfo-NHS-biotin), placed intravesically, across the urothelial layer using Texas red-conjugated streptavidin. We also stained for ZO1 to identify the urothelial barrier (green) and DAPI for nuclei (blue). As shown in Fig. 2A, in 15-wk control mice (nondiabetic NLRP3+/+), the vast majority of sulfo-NHS-biotin was bound to the apical layer of urothelial cells and prevented from crossing the urothelial barrier, although small amounts could be found permeated through isolated regions of urothelia and accumulated in specific areas of the submucosa (white arrow in Fig. 2A). The surface staining was somewhat obscured by ZO1 green staining. Therefore, to aid in visualization, the same image is shown in Fig. 2B with the green channel turned off and in Fig. 2C with both green and blue channels turned off. This theme is maintained throughout Figs. 2 and 3, with the left column visualizing all channels, the middle column visualizing red and blue, and the right column showing red only. To further illustrate a representative region of nondamaged urothelia, the area indicated by the red box in Fig. 2, A–C, is magnified in Fig. 2, D–F. Figure 2D clearly shows sulfo-biotin-NHS binding to the apical surface and that it does not permeate the underlying urothelial cells (green ZO1 staining). It should be noted that our ZO1 antibody does stain the urothelia intracellularly, with the exception of umbrella cells, where staining is restricted to the tight junction between cells (Supplemental Fig. S2). This likely reflects ZO1 organization in these cells, where it remains cytoplasmic in the underlying urothelial cells that do not have tight junctions but transfers to tight junction regions in umbrella cells, which do. This staining is similar to that seen with other ZO1 antibodies (24) and allowed us to show gross bladder anatomy with clear distinctions among the urothelia, submucosa, and detrusor.
Figure 2.
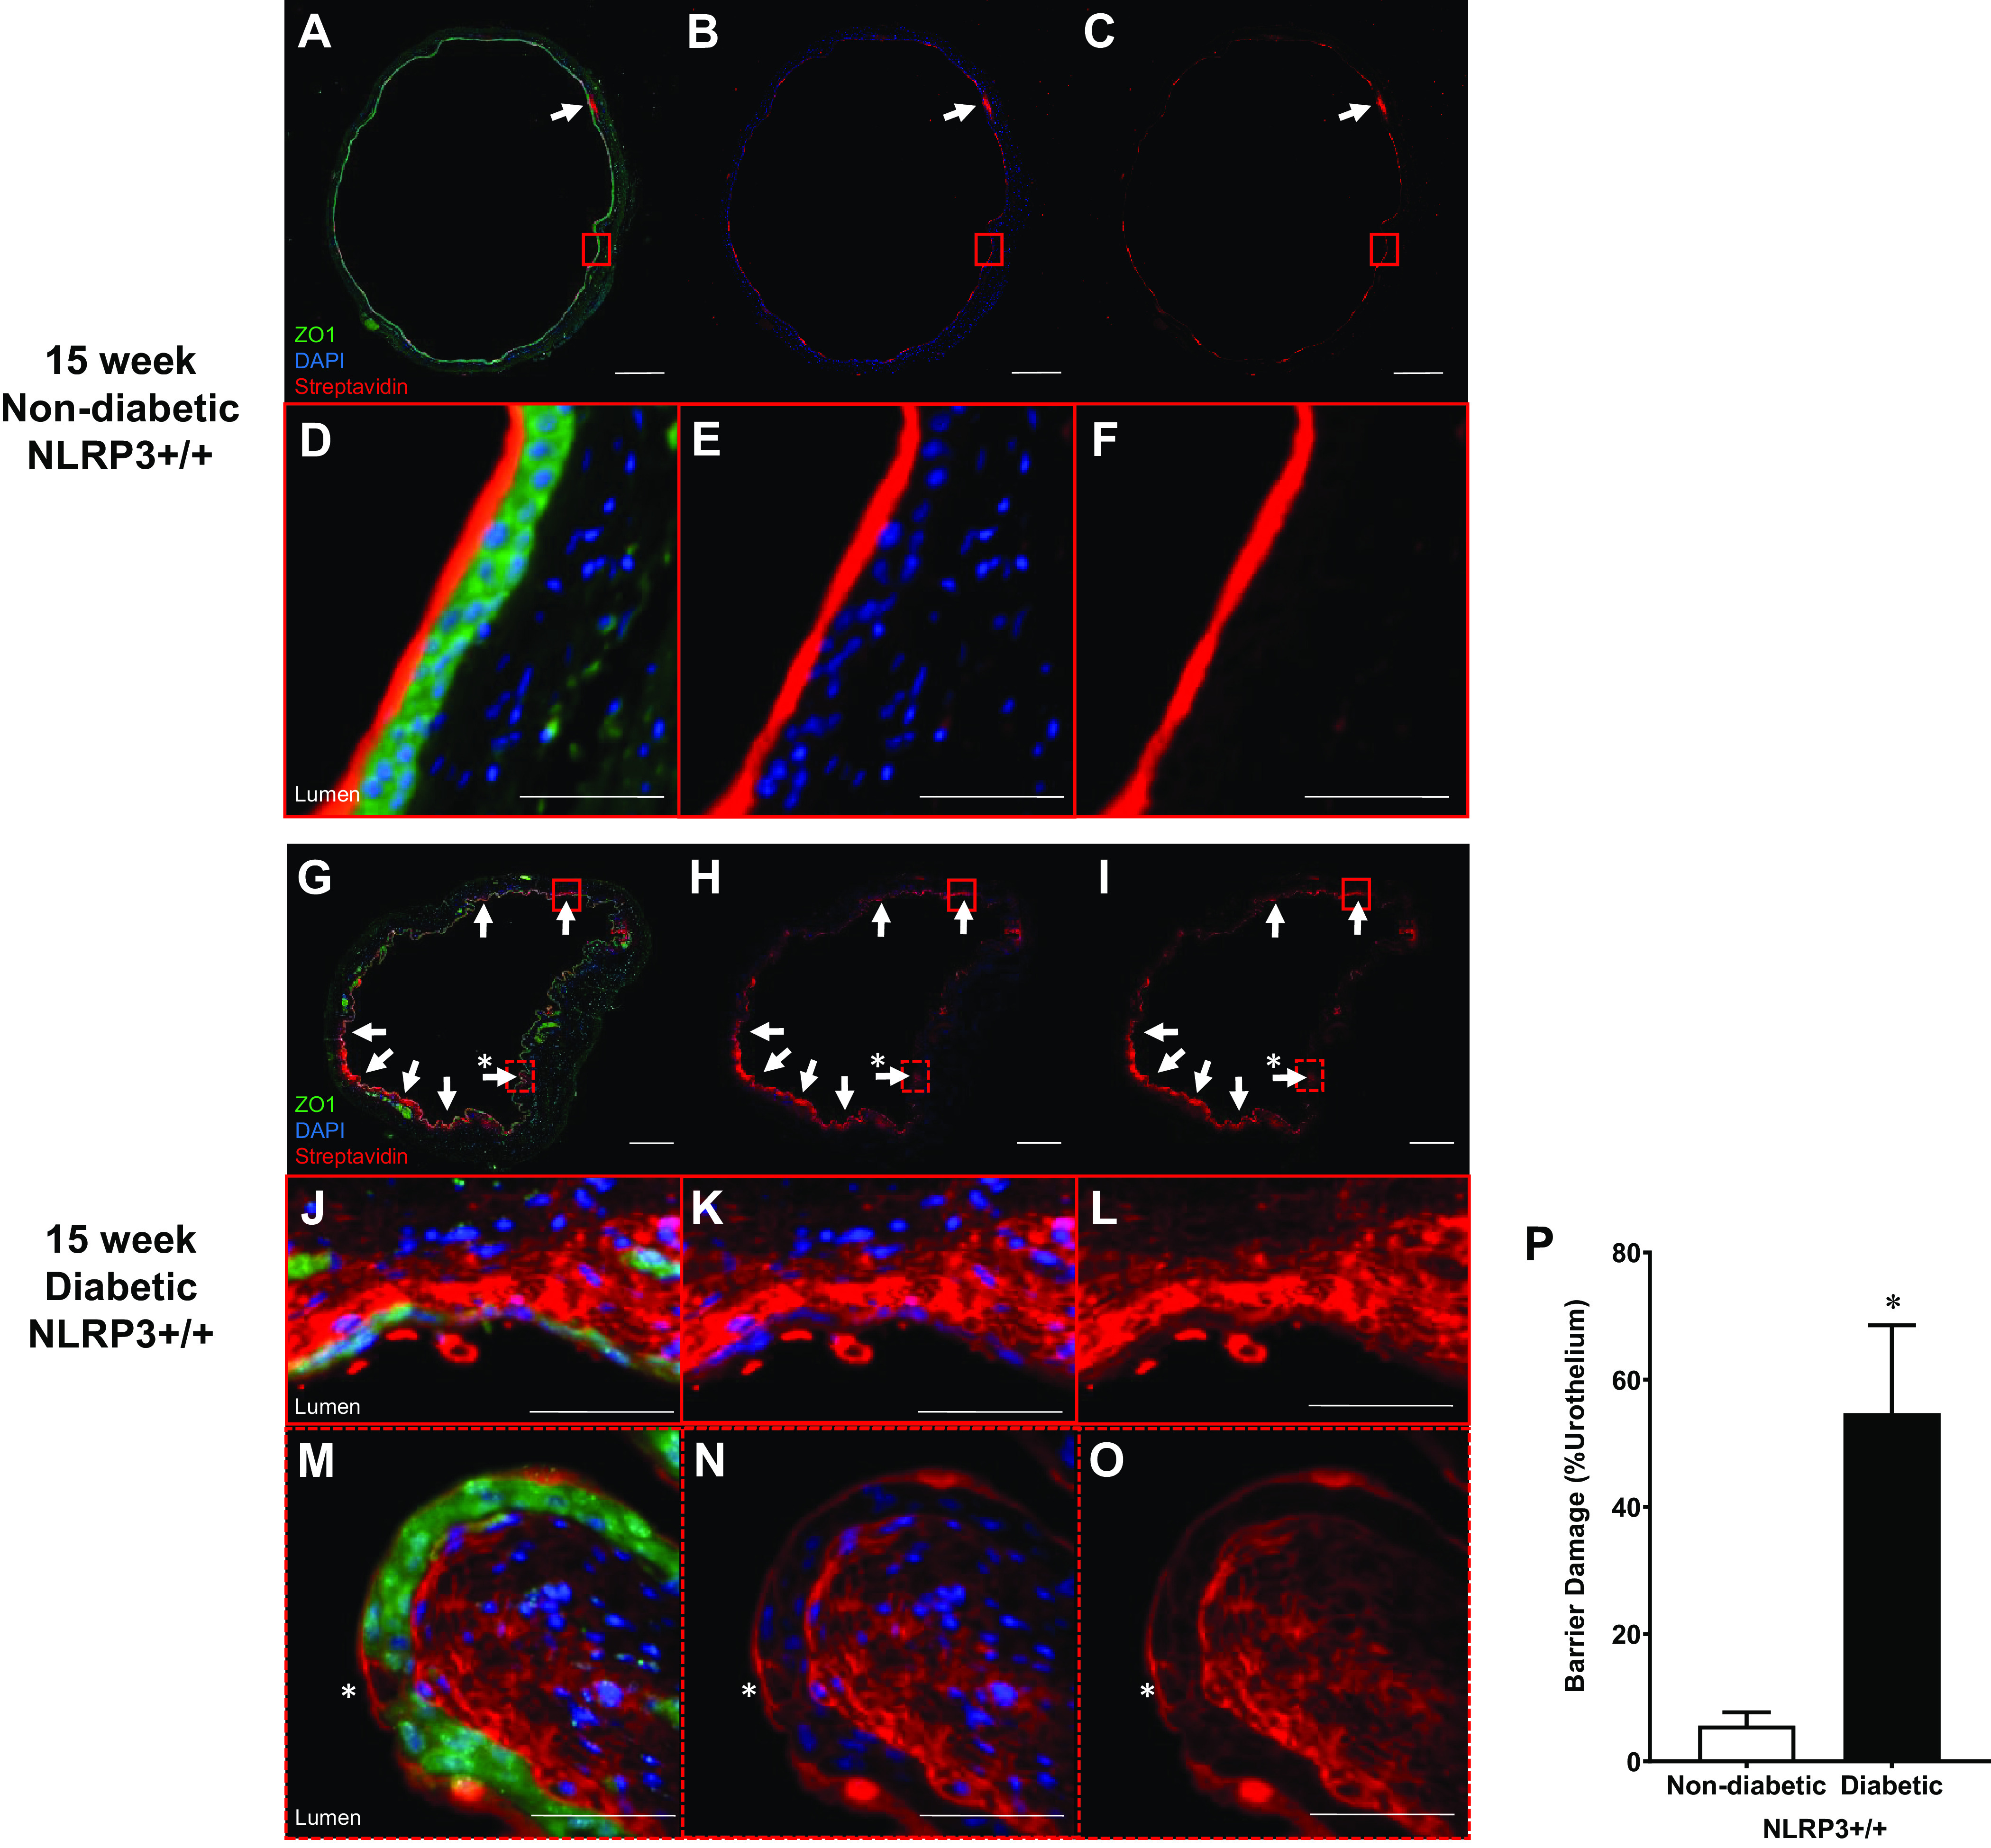
Diabetes increases in vivo urothelial permeability to sulfo-NHS-biotin at the 15-wk (overactive detrusor) time point. Sulfo-NHS-biotin was dissolved in PBS (1 mg/mL) and delivered intravesically (150 μL) through catheters placed in anesthetized mice. The sulfo-NHS-biotin solution was removed after 30 min and replaced with 150 μL of 4% paraformaldehyde. Bladders were tied proximal to ureters, excised, and paraformaldehyde fixed while inflated. Paraffin-embedded sections (5 µm) were then dehydrated and labeled with primary antibody to zona occludens 1 (ZO1) to identify urothelial cells (shown as bright green), Texas red-conjugated streptavidin for sulfo-NHS-biotin detection (red), and DAPI for nuclei (blue). Regions of urothelia (ZO1, green) considered damaged contained sulfo-NHS-biotin (streptavidin, red) in the submucosa. Representative images of bladder sections are shown. White scale bars = 500 μm. The red boxes indicate select representative regions, and the corresponding images are magnified views of these red boxes. Scale bars inside the red boxes = 50 μm. A: 15-wk nondiabetic NOD-, LRR-, and pyrin domain-containing protein 3 (NLRP3)+/+ urothelial barriers were nearly fully intact with sulfo-NHS-biotin staining on the apical surface. Limited regions of damage in which sulfo-NHS-biotin has traversed the urothelia are indicated by white arrows. B and C: to better visualize sulfo-NHS-biotin staining on the apical surface, the same slide is shown without the green ZO1 staining and blue DAPI staining. D–F: magnified micrographs of the area enclosed by the red boxes in A–C showing sulfo-NHS-biotin bound to the apical urothelial surface without any permeation into the submucosa. G–I: numerous patchy regions of sulfo-NHS-biotin were evident in the submucosa of 15-wk diabetic NLRP3+/+ mice. J–L: magnified micrographs of the area enclosed by the red boxes in G–I showing a region of desquamation with extensive submucosal penetration of sulfo-NHS-biotin evident in 15-wk diabetic NLRP3+/+ mice. M–O: magnification of the dashed red boxes in G–I identifying regions of single cell loss in the apical urothelia (*). This region contains sulfo-NHS-biotin staining and accumulation in the submucosa. P: at the 15-wk overactivity time point, over 50% of the urothelia from diabetic NLRP3+/+ mice was damaged compared with ∼5% damage in nondiabetic NLRP3+/+ mice. n = 4 and 5 animals, respectively. *P < 0.05 vs. nondiabetic NLRP3+/+ mice (Student’s t test).
In diabetic mice (15-wk diabetic NLRP3+/+; Fig. 2, G–I), sulfo-NHS-biotin permeation was extensive, as evidenced by the amount of red staining in the suburothelial areas. Interestingly, this barrier damage was not uniform, but rather many patchy areas of sulfo-NHS-biotin were noted in the submucosa (white arrows), while other areas appeared free of damage (Fig. 2, G–I). These areas were often associated with desquamation of one or more layers of the urothelium. To better illustrate this, one such area of damage, indicated by a solid red box in Fig. 2, G–I, was magnified in Fig. 2, H–J. Here, we found that the urothelial layer was reduced to a single layer of urothelial cells with extensive submucosal sulfo-NHS-biotin penetration into the submucosa. In addition to desquamation, deletion of individual cells by pyroptosis also appeared to comprise the urothelial barrier. For example, when the dashed red box shown in Fig. 2, G–I, was magnified in Fig. 2, M–O, we found evidence of single cell loss, as indicated by the asterisk. Clearly this too led to substantial sulfo-NHS-biotin staining and accumulation in the submucosa given the intense red staining immediately below the deleted cell. When barrier damage was quantified (Fig. 2P), the extent of barrier damage with diabetes is clear. Only ∼5% of the total urothelial layer circumference was damaged in nondiabetic mice, whereas >50% of the apical urothelial surface was damaged in diabetic NLRP3+/+ mice.
Deletion of the NLRP3 gene (NLRP3−/−) did not impact the small amount of sulfo-NHS-biotin that permeated control urothelia (Fig. 3, A–C, magnified in Fig. 3, D–F). Excitingly, we found a dramatic reduction in sulfo-NHS-biotin permeability in NLRP3-null diabetic mice (NLRP3−/−). Figure 3, G–I, illustrates this, as indicated by the decreased number of white arrows pointing at areas of dye permeation compared with Fig. 2, G–I. When we examined higher magnification at the areas of damage (Fig. 3, J–L), we found little to no desquamation and few, if any, deleted pyroptotic cells. Quantitation of the damaged areas (Fig. 3M) demonstrated that ablation of the NLRP3 gene completely prevented any statistically significant damage from occurring in response to diabetes with levels similar to controls. The lack of pathology in NLRP3-null diabetic mice indicated that urothelial barrier damage is a consequence of NLRP3-mediated inflammation.
Figure 3.
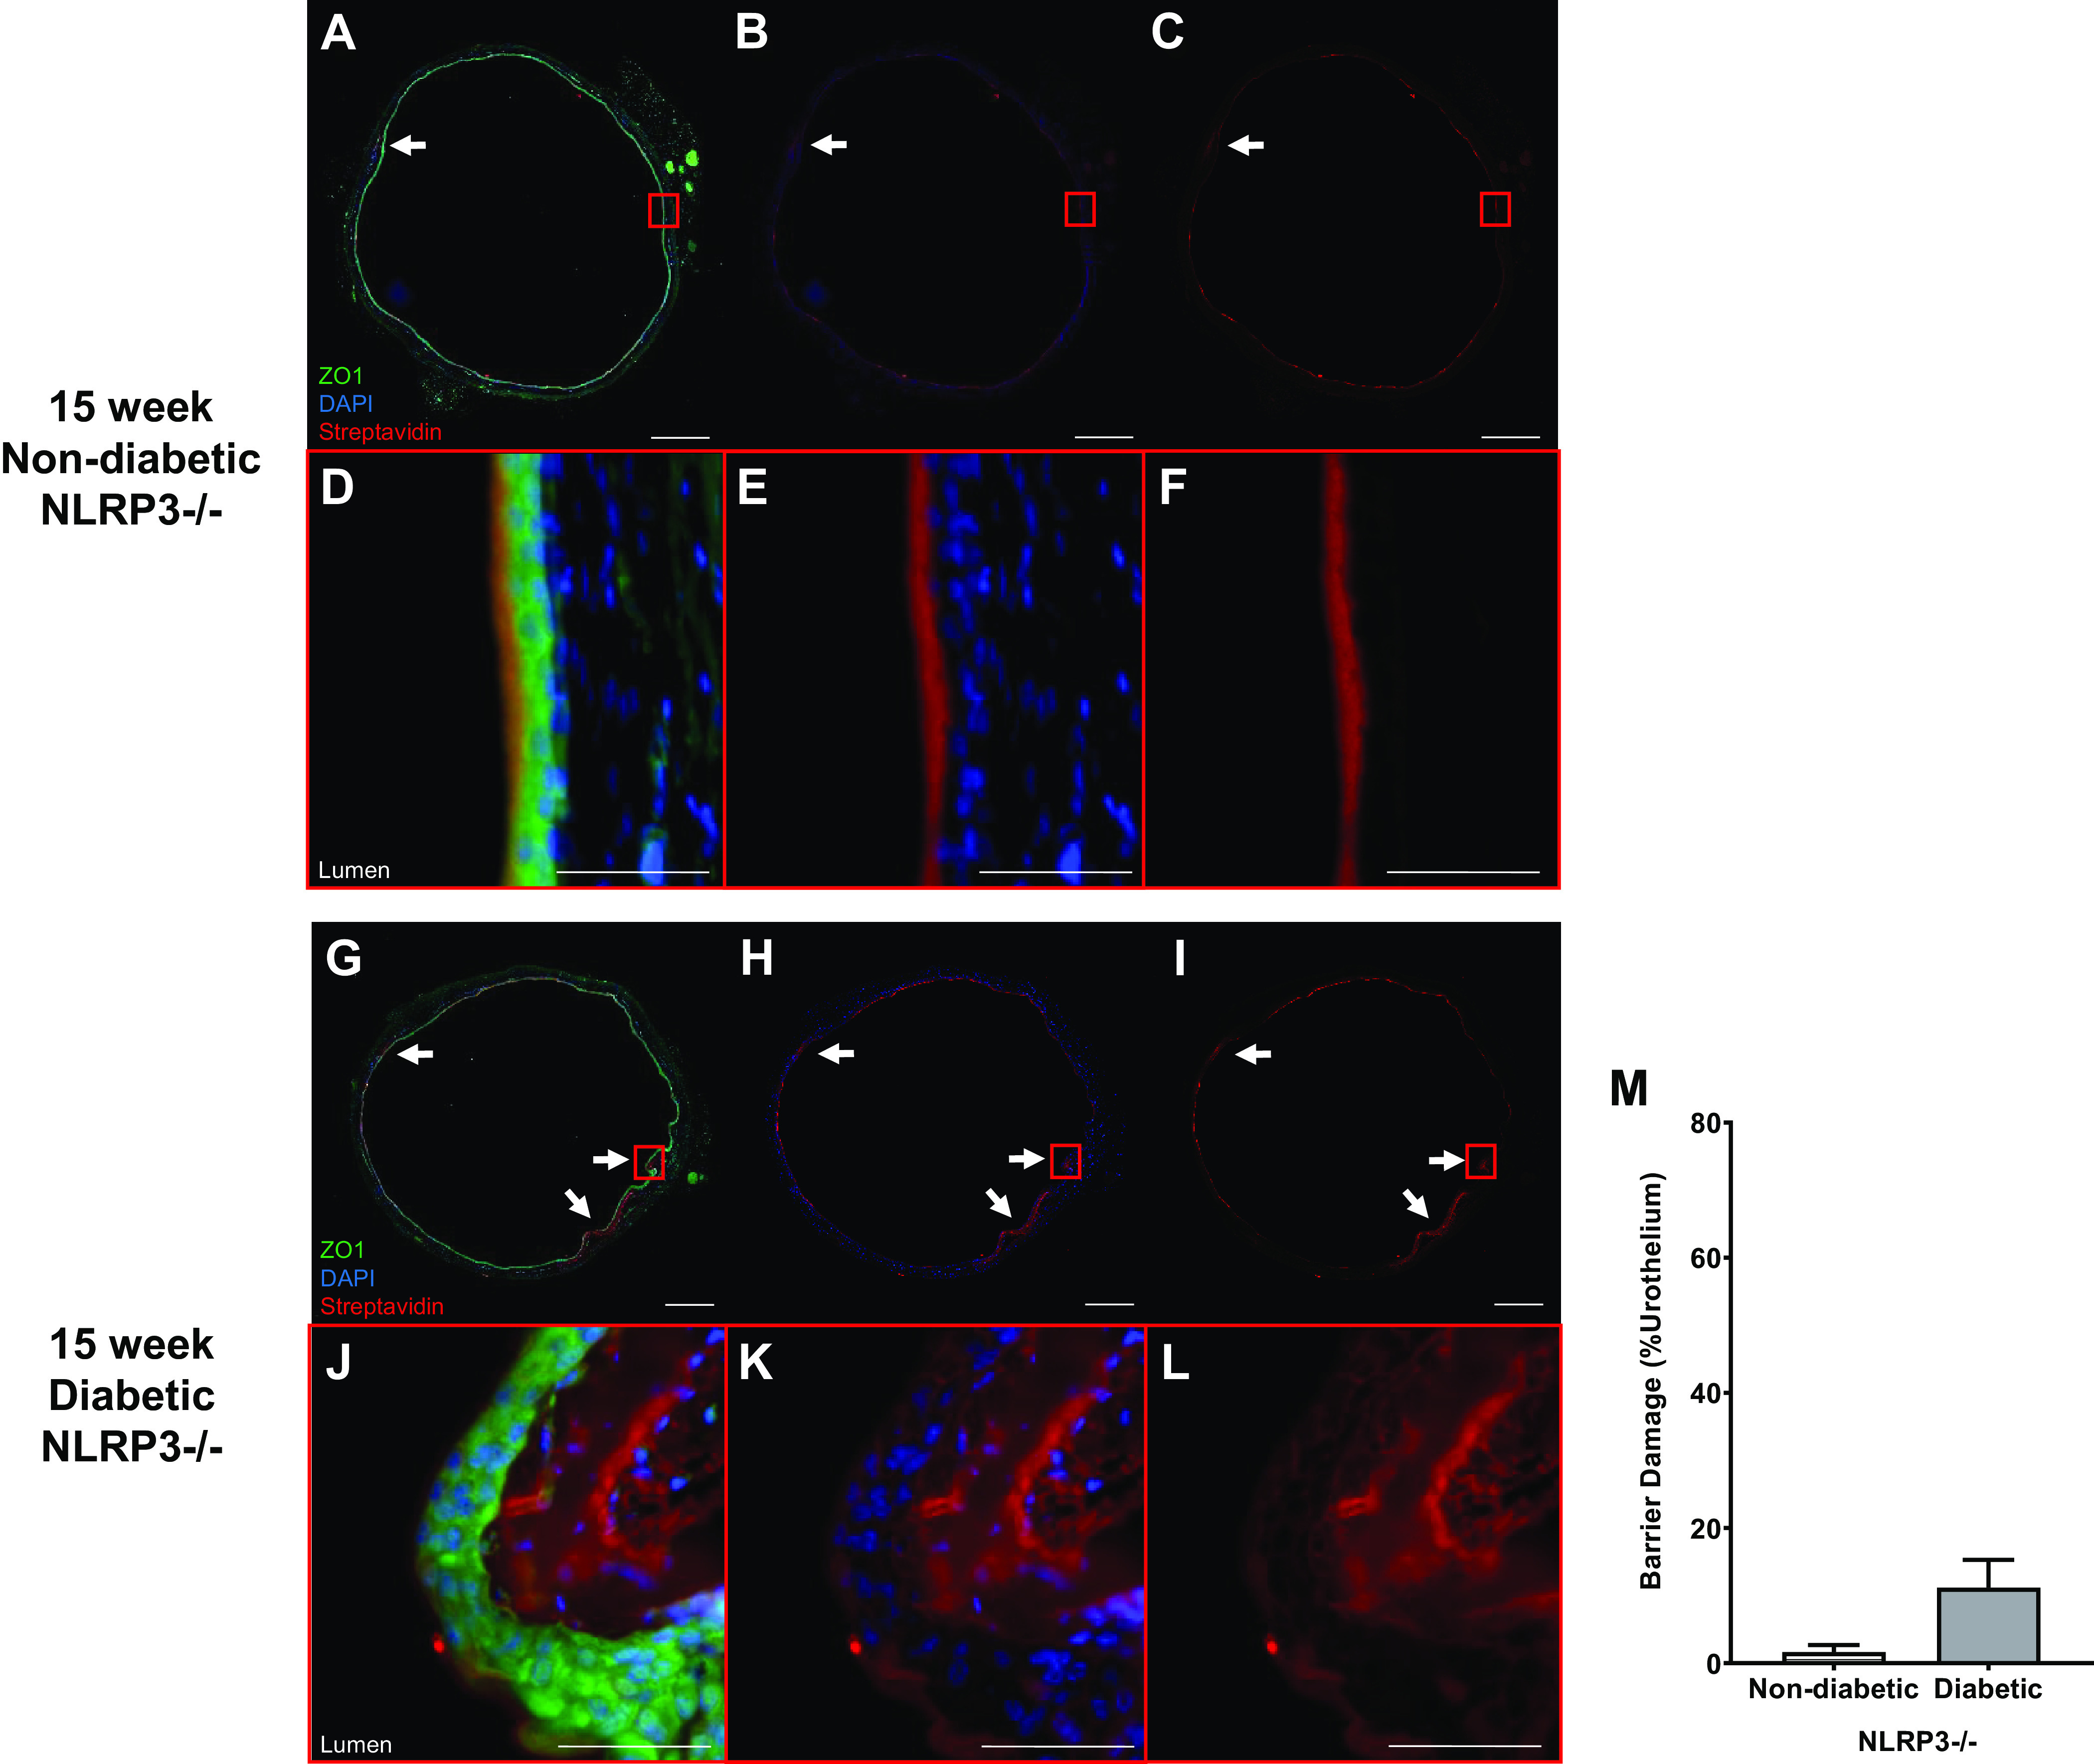
NOD-, LRR-, and pyrin domain-containing protein 3 (NLRP3) gene deletion prevents diabetes from increasing in vivo urothelial permeability to sulfo-NHS-biotin at the 15-wk (overactive detrusor) time point. Sulfo-NHS-biotin was dissolved in PBS (1 mg/mL) and delivered intravesically (150 μL) through catheters placed in anesthetized mice. The sulfo-NHS-biotin solution was removed after 30 min and replaced with 150 μL of 4% paraformaldehyde. Bladders were tied proximal to ureters, excised, and paraformaldehyde fixed while inflated. Paraffin-embedded sections (5 µm) were then dehydrated and labeled with primary antibody to zona occludens 1 (ZO1) to identify urothelial cells (shown as bright green), Texas red-conjugated streptavidin for sulfo-NHS-biotin detection (red), and DAPI for nuclei (blue). Regions of urothelia (ZO1, green) considered damaged contained sulfo-NHS-biotin (streptavidin, red) in the submucosa. Representative images of bladder sections are shown. White scale bars = 500 μm. The red boxes indicate selected representative regions for magnification. Scale bars inside the red boxes = 50 μm. A–C: 15-wk nondiabetic NLRP3+/+ urothelial barriers were nearly fully intact with sulfo-NHS-biotin staining on the apical surface. Limited regions of damage in which sulfo-NHS-biotin has traversed the urothelia are indicated by white arrows. D–F: representative magnified micrographs of the red boxes in A–C showing that sulfo-NHS-biotin bound to the apical surface without permeating the urothelial layer. G–I: in the absence of NLRP3-mediated inflammation, bladders from 15-wk diabetic NLRP3−/− mice showed few isolated regions of barrier damage indicated by white arrows. J–L: in these magnified images, we found one of those few areas of paracellular sulfo-NHS-biotin staining and submucosal accumulation. Very little urothelial desquamation or single cell pyroptotic deletion was noted. M: overall, NLRP3 gene ablation prevented statistically significant barrier damage in diabetic NLRP3−/− mice. n = 3 and 4 animals, respectively. There were no statistically significant differences (Student’s t test).
Diabetes-Mediated NLRP3-Dependent Inflammation Downregulates Barrier Gene Expression at 15 wk
Urothelial barrier permeability is regulated by key structural components such as uroplakins, tight junctions, and adherens junctions. Here, to gain insight into how NLRP3-dependent mechanisms disrupt the urothelial barrier, we measured gene expression of key components of these structures. Uroplakin subunits UP1b and UP2 were significantly downregulated in 15-wk diabetic NLRP3+/+ mice compared with control mice (nondiabetic NLRP3+/+), but in mice without NLRP3, gene expression between nondiabetic and diabetic mice was comparable (Fig. 4, A–D). Similarly, the tight junction genes ZO1, ZO2, CL4, and CL8 were downregulated in diabetic NLRP3+/+ mice (Fig. 4, E, G, I, and K), whereas NLRP3 gene deletion preserved tight junction gene expression despite the presence of diabetes (diabetic NLRP3−/−), as shown in Fig. 4, F, H, J, and L. A major component of adherens junctions is β-catenin (BCAT). At 15 wk, BCAT gene expression was not affected by diabetes and NLRP3 gene ablation did not further impact gene expression at this time point (Fig. 4, M and N).
Figure 4.
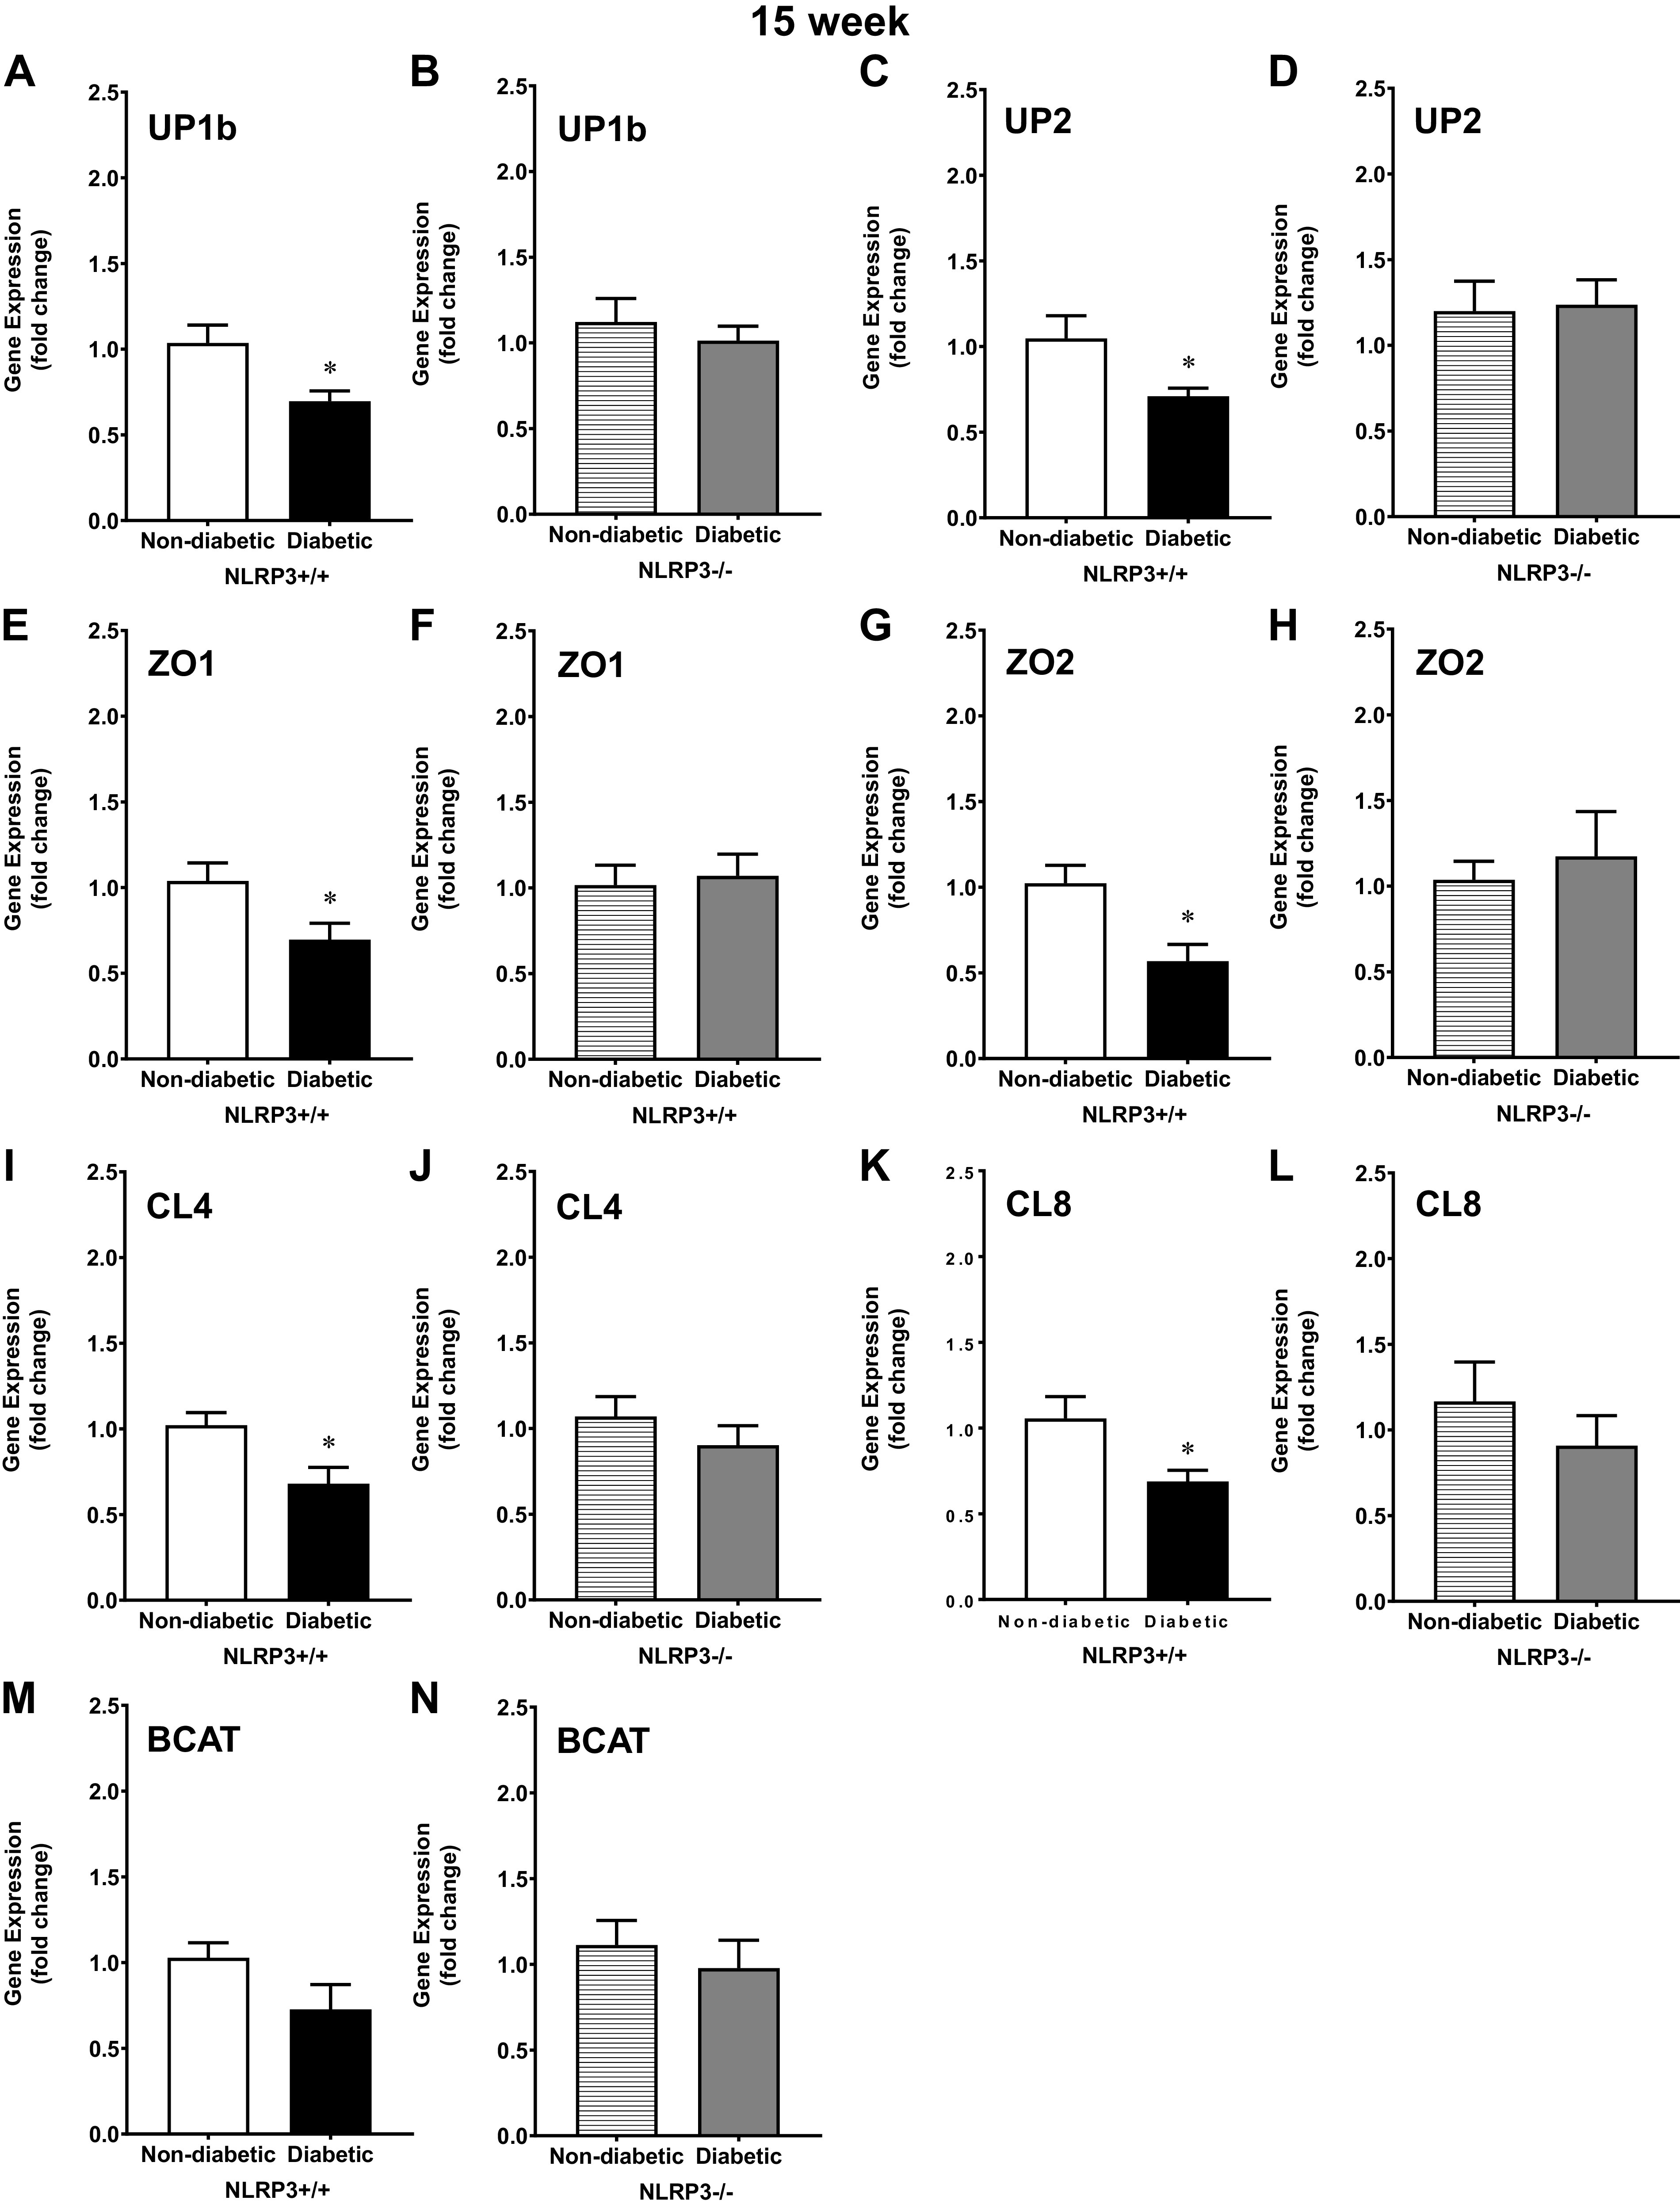
Uroplakin and tight junction gene expression is downregulated by diabetes via NOD-, LRR-, and pyrin domain-containing protein 3 (NLRP3)-dependent mechanisms at the 15-wk (overactive detrusor) time point. Urothelia were scraped from excised bladders, and quantitative PCR was used to measure gene expression of uroplakin subunits UP1b and UP2, tight junction components zona occludens 1 and 2 (ZO1 and ZO2, respectively), claudin 4 and 8 (CL4 and CL8, respectively), and the adherens junction component β-catenin (BCAT). A: at 15 wk, UP1b was downregulated in diabetic NLRP3+/+ mice. B: NLRP3 gene deletion prevented this downregulation in diabetic NLRP3−/− mice. C: at 15 wk, UP2 was downregulated in diabetic NLRP3+/+ mice. D: NLRP3 gene deletion prevented downregulation of UP2 in diabetic NLRP3−/− urothelia. E, G, I, and K: tight junction genes ZO1, ZO2, CL4, and CL8 were expressed significantly less in diabetic NLRP3+/+ mice. F, H, J, and L: however, gene expression was not significantly downregulated in diabetic NLRP3−/− mice. M and N: no statistically significant changes in BCAT gene expression were noted at 15 wk. Respective n (animals) per group, per condition = UP1b (8, 7, 12, and 10), UP2 (7, 7, 12, and 10), ZO1 (8, 7, 12, and 10), ZO2 (6, 6, 7, and 6), CL4 (8, 7, 12, and 10), CL8 (6, 6, 7, and 6), and BCAT (8, 6, 12, and 10). *P < 0.05 vs. nondiabetic control mice (Student’s t test).
Diabetes-Mediated NLRP3-Dependent Inflammation Also Downregulates Barrier Protein Expression at 15 wk
To determine if changes in gene expression were reflected at the protein level, select components of tight junction and uroplakin proteins (ZO1 and UP1b) were measured. Representative images of labeled membranes showing protein expression of UP1b, ZO1, and GAPDH in all four groups of 15-wk mice are shown in Fig. 5A. Much like the gene expression data, diabetes significantly downregulated UP1b protein expression (Fig. 5B). UP1b protein expression was preserved among diabetic animals in the absence of NLRP3-mediated inflammation (Fig. 5C). The tight junction protein ZO1 was also downregulated in diabetic animals (Fig. 5D). Ablation of the NLRP3 gene preserved ZO1 expression in 15-wk diabetic NLRP3−/− mice (Fig. 5E).
Figure 5.
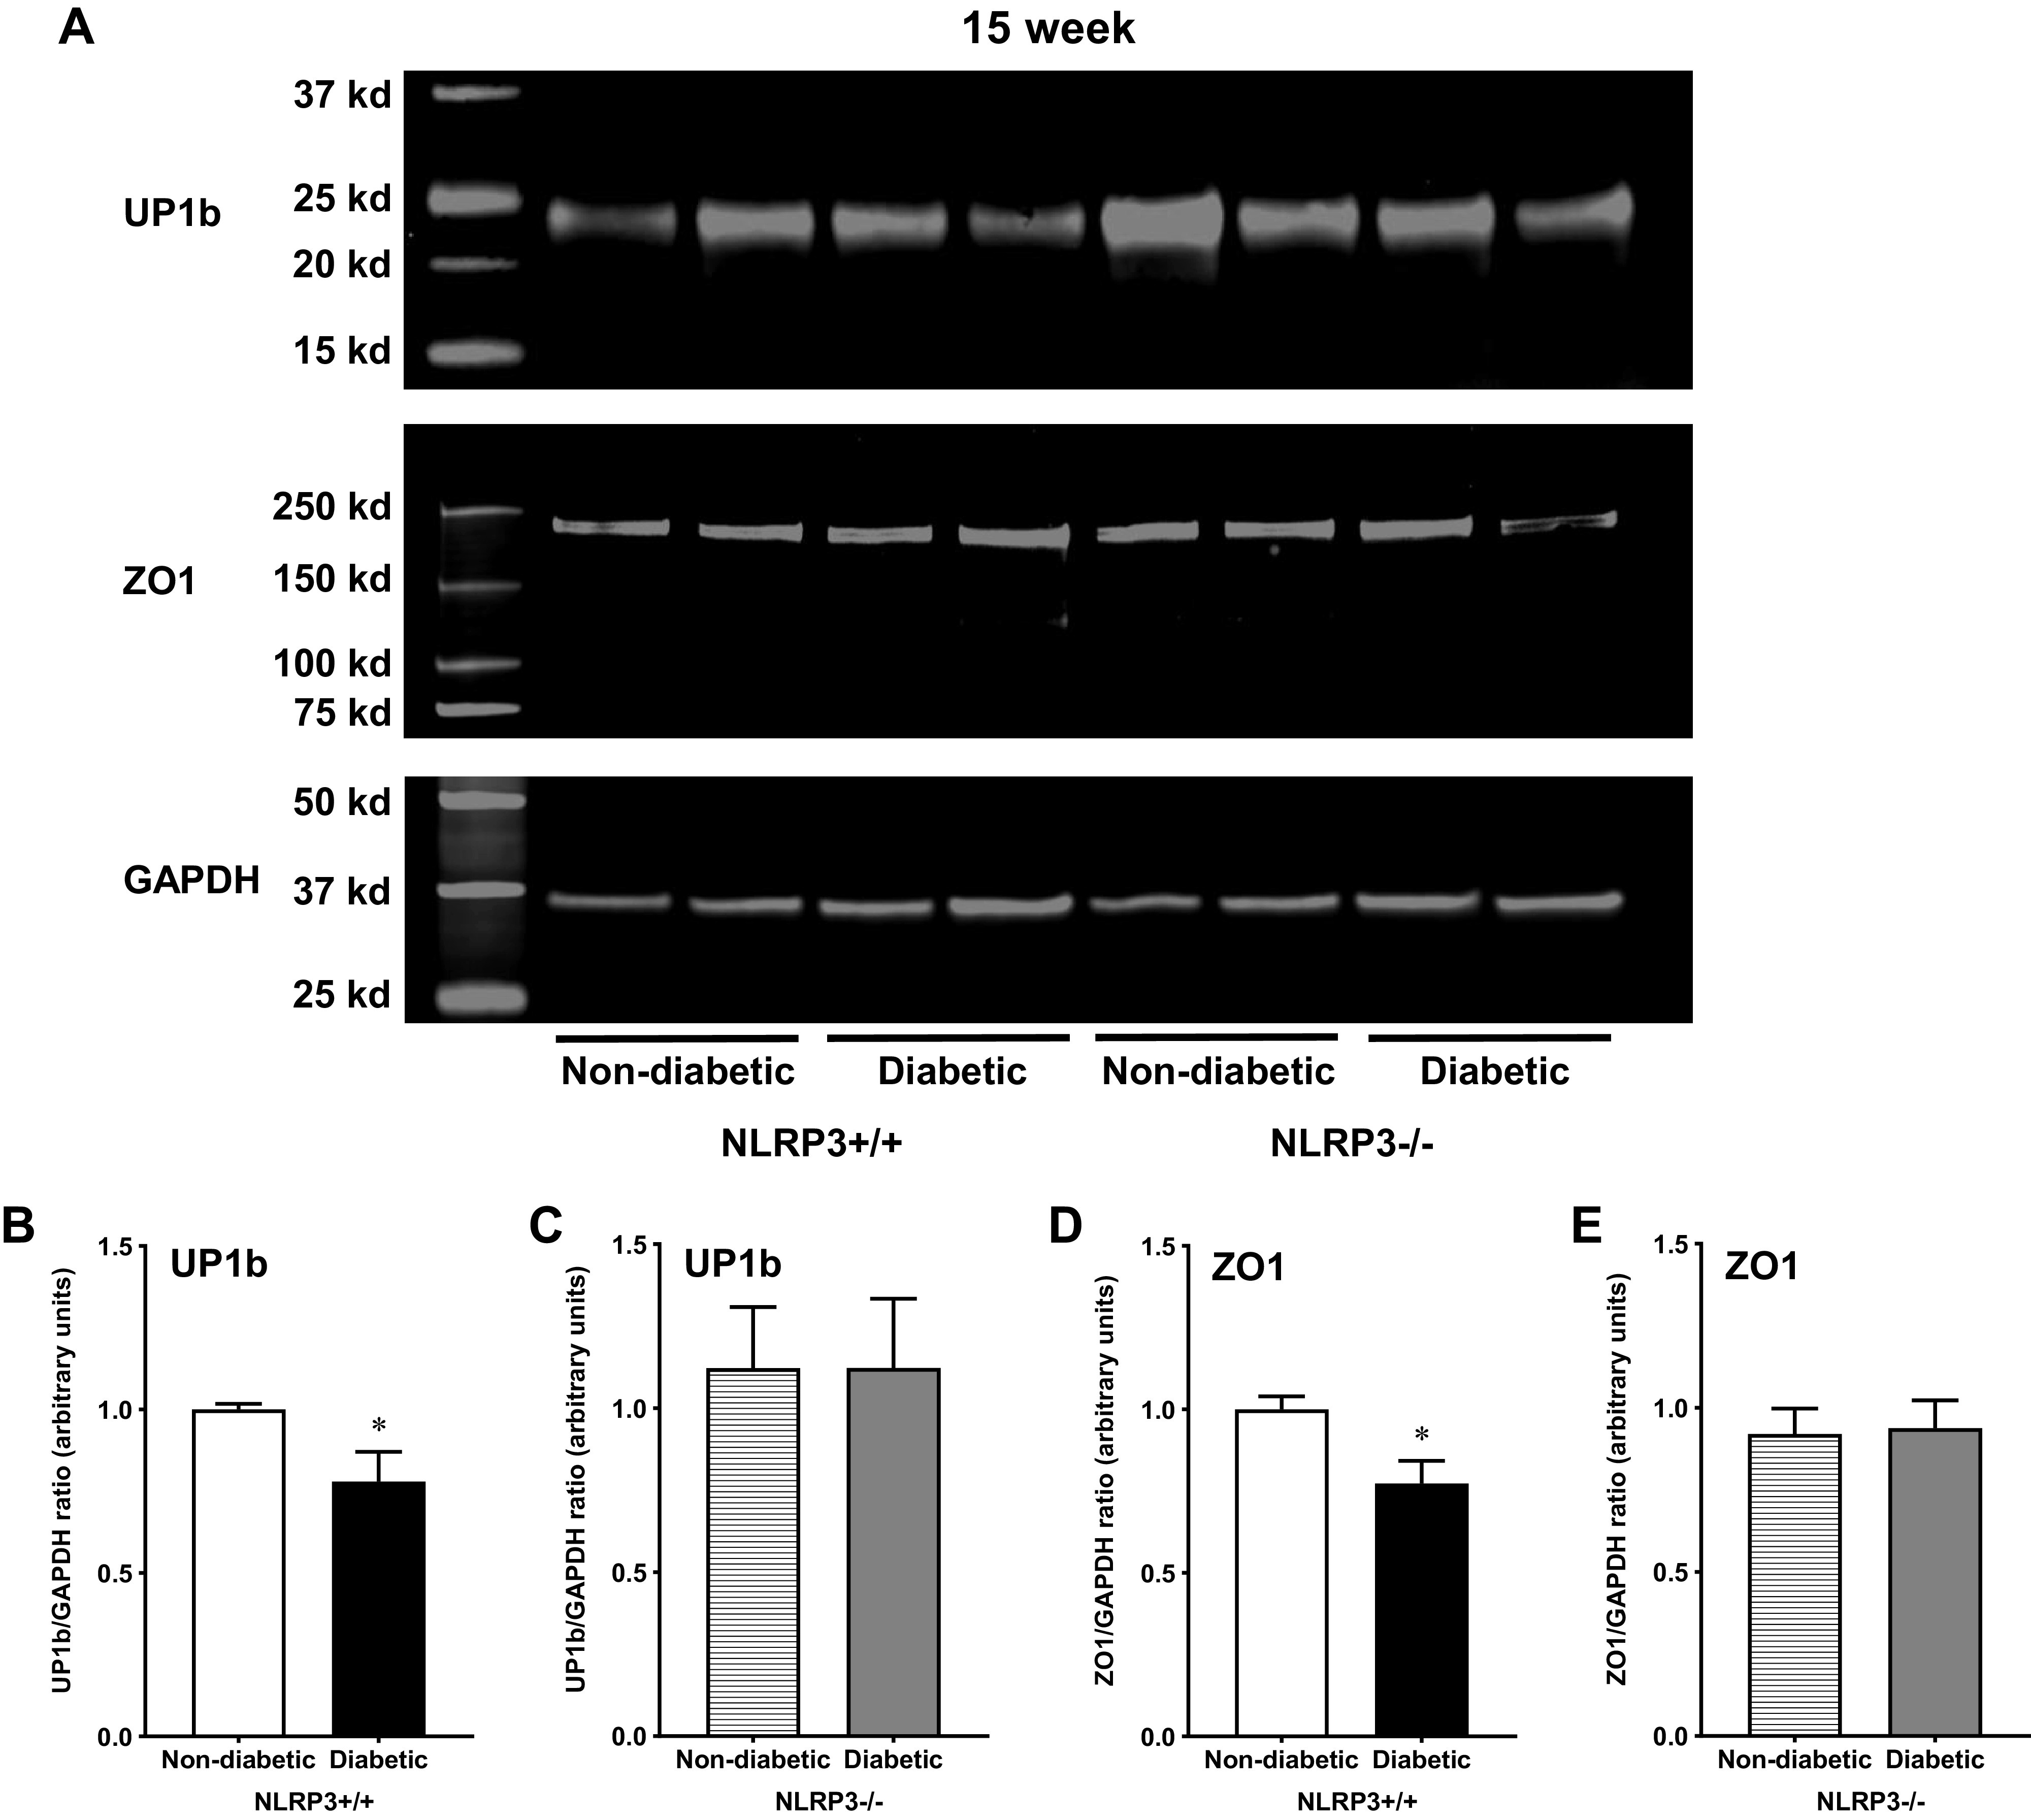
Uroplakin and tight junction proteins are downregulated by diabetes via NOD-, LRR-, and pyrin domain-containing protein 3 (NLRP3)-dependent mechanisms at the 15-wk (overactive detrusor) time point. Western blots were performed using standard techniques described in methods to determine protein expression of uroplakin subunit UP1b and zona occludens (ZO1) in mucosal layer lysates from all four groups of 15-wk mice. A: representative images showing fluorescent labeled UP1b, ZO1, and GAPDH proteins from all four groups of mice and the respective molecular weights of each protein. B: diabetes downregulated UP1b expression in mice with functional NLRP3. C: in the absence of the NLRP3 gene, diabetic NLRP3−/− mice demonstrated comparable protein expression as nondiabetic control mice. D: similarly, diabetes downregulated urothelial ZO1 protein. E: without the NLRP3 gene and subsequent NLRP3-mediated inflammation, diabetes did not impact ZO1 protein expression. n = 8 animals per group. *P < 0.05 vs. nondiabetic control mice (Student’s t test).
No Urothelial Barrier Damage in 30-wk Diabetic Mice
Ex vivo evidence.
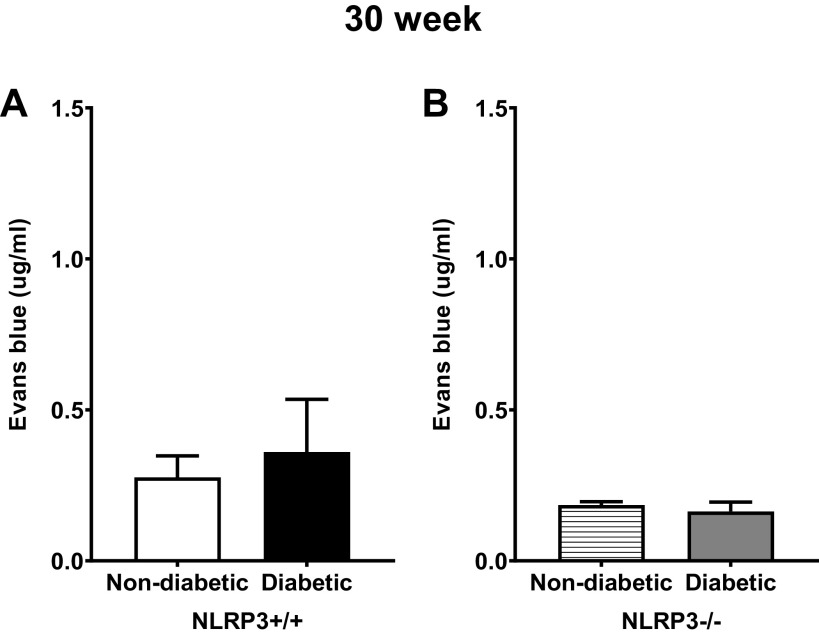
Changes in barrier permeability were anticipated as DBD continued to progress. However, as shown in Fig. 6A, the amount of Evans blue extravasation between nondiabetic and diabetic groups with NLRP3 was surprisingly comparable. Given that, it was not surprising that both nondiabetic and diabetic groups lacking NLRP3 were equivalent (Fig. 6B).
Figure 6.
Diabetes did not impact ex vivo urothelial permeability to Evans blue at the 30-wk (underactive detrusor) time point. Isolated mucosal layer preparations were inflated with Evans blue dye containing buffer and submerged in Krebs solution, as described in methods. After 30 min, the solutions were collected and quantified spectrophotometrically against a standard curve. Evans blue in these solutions that had permeated through the mucosa was indicative of barrier damage. A and B: at 30-wk time points, Evans blue permeability was not statistically different between nondiabetic and diabetic mice in the presence or absence of the NOD-, LRR-, and pyrin domain-containing protein 3 (NLRP3) gene. n = 7, 8, 4, and 6 animals, respectively. There were no statistically significant differences (Student’s t test).
In vivo evidence.
To determine what may be responsible for the lack of barrier damage at 30 wk, barrier permeability was assessed in vivo. Similar to what was seen in controls after 15 wk, bladders from 30-wk control mice (NLRP3+/+) also showed isolated regions of sulfo-NHS-biotin, as indicated by white arrows in Fig. 7, A–F. Likewise, only a few isolated regions of barrier damage were observed in 30-wk diabetic mice (NLRP3+/+; Fig. 7, G–L, with quantitation in Fig. 7M). No evidence of urothelial cell loss or desquamation was observed. In nondiabetic and diabetic mice without the NLRP3 gene, a similar pattern of isolated sulfo-NHS-biotin permeation occurred (Fig. 8, A–L). Again, no statistically significant differences in in vivo barrier function were discernable among nondiabetic or diabetic groups without the NLPR3 gene (Fig. 8M).
Figure 7.
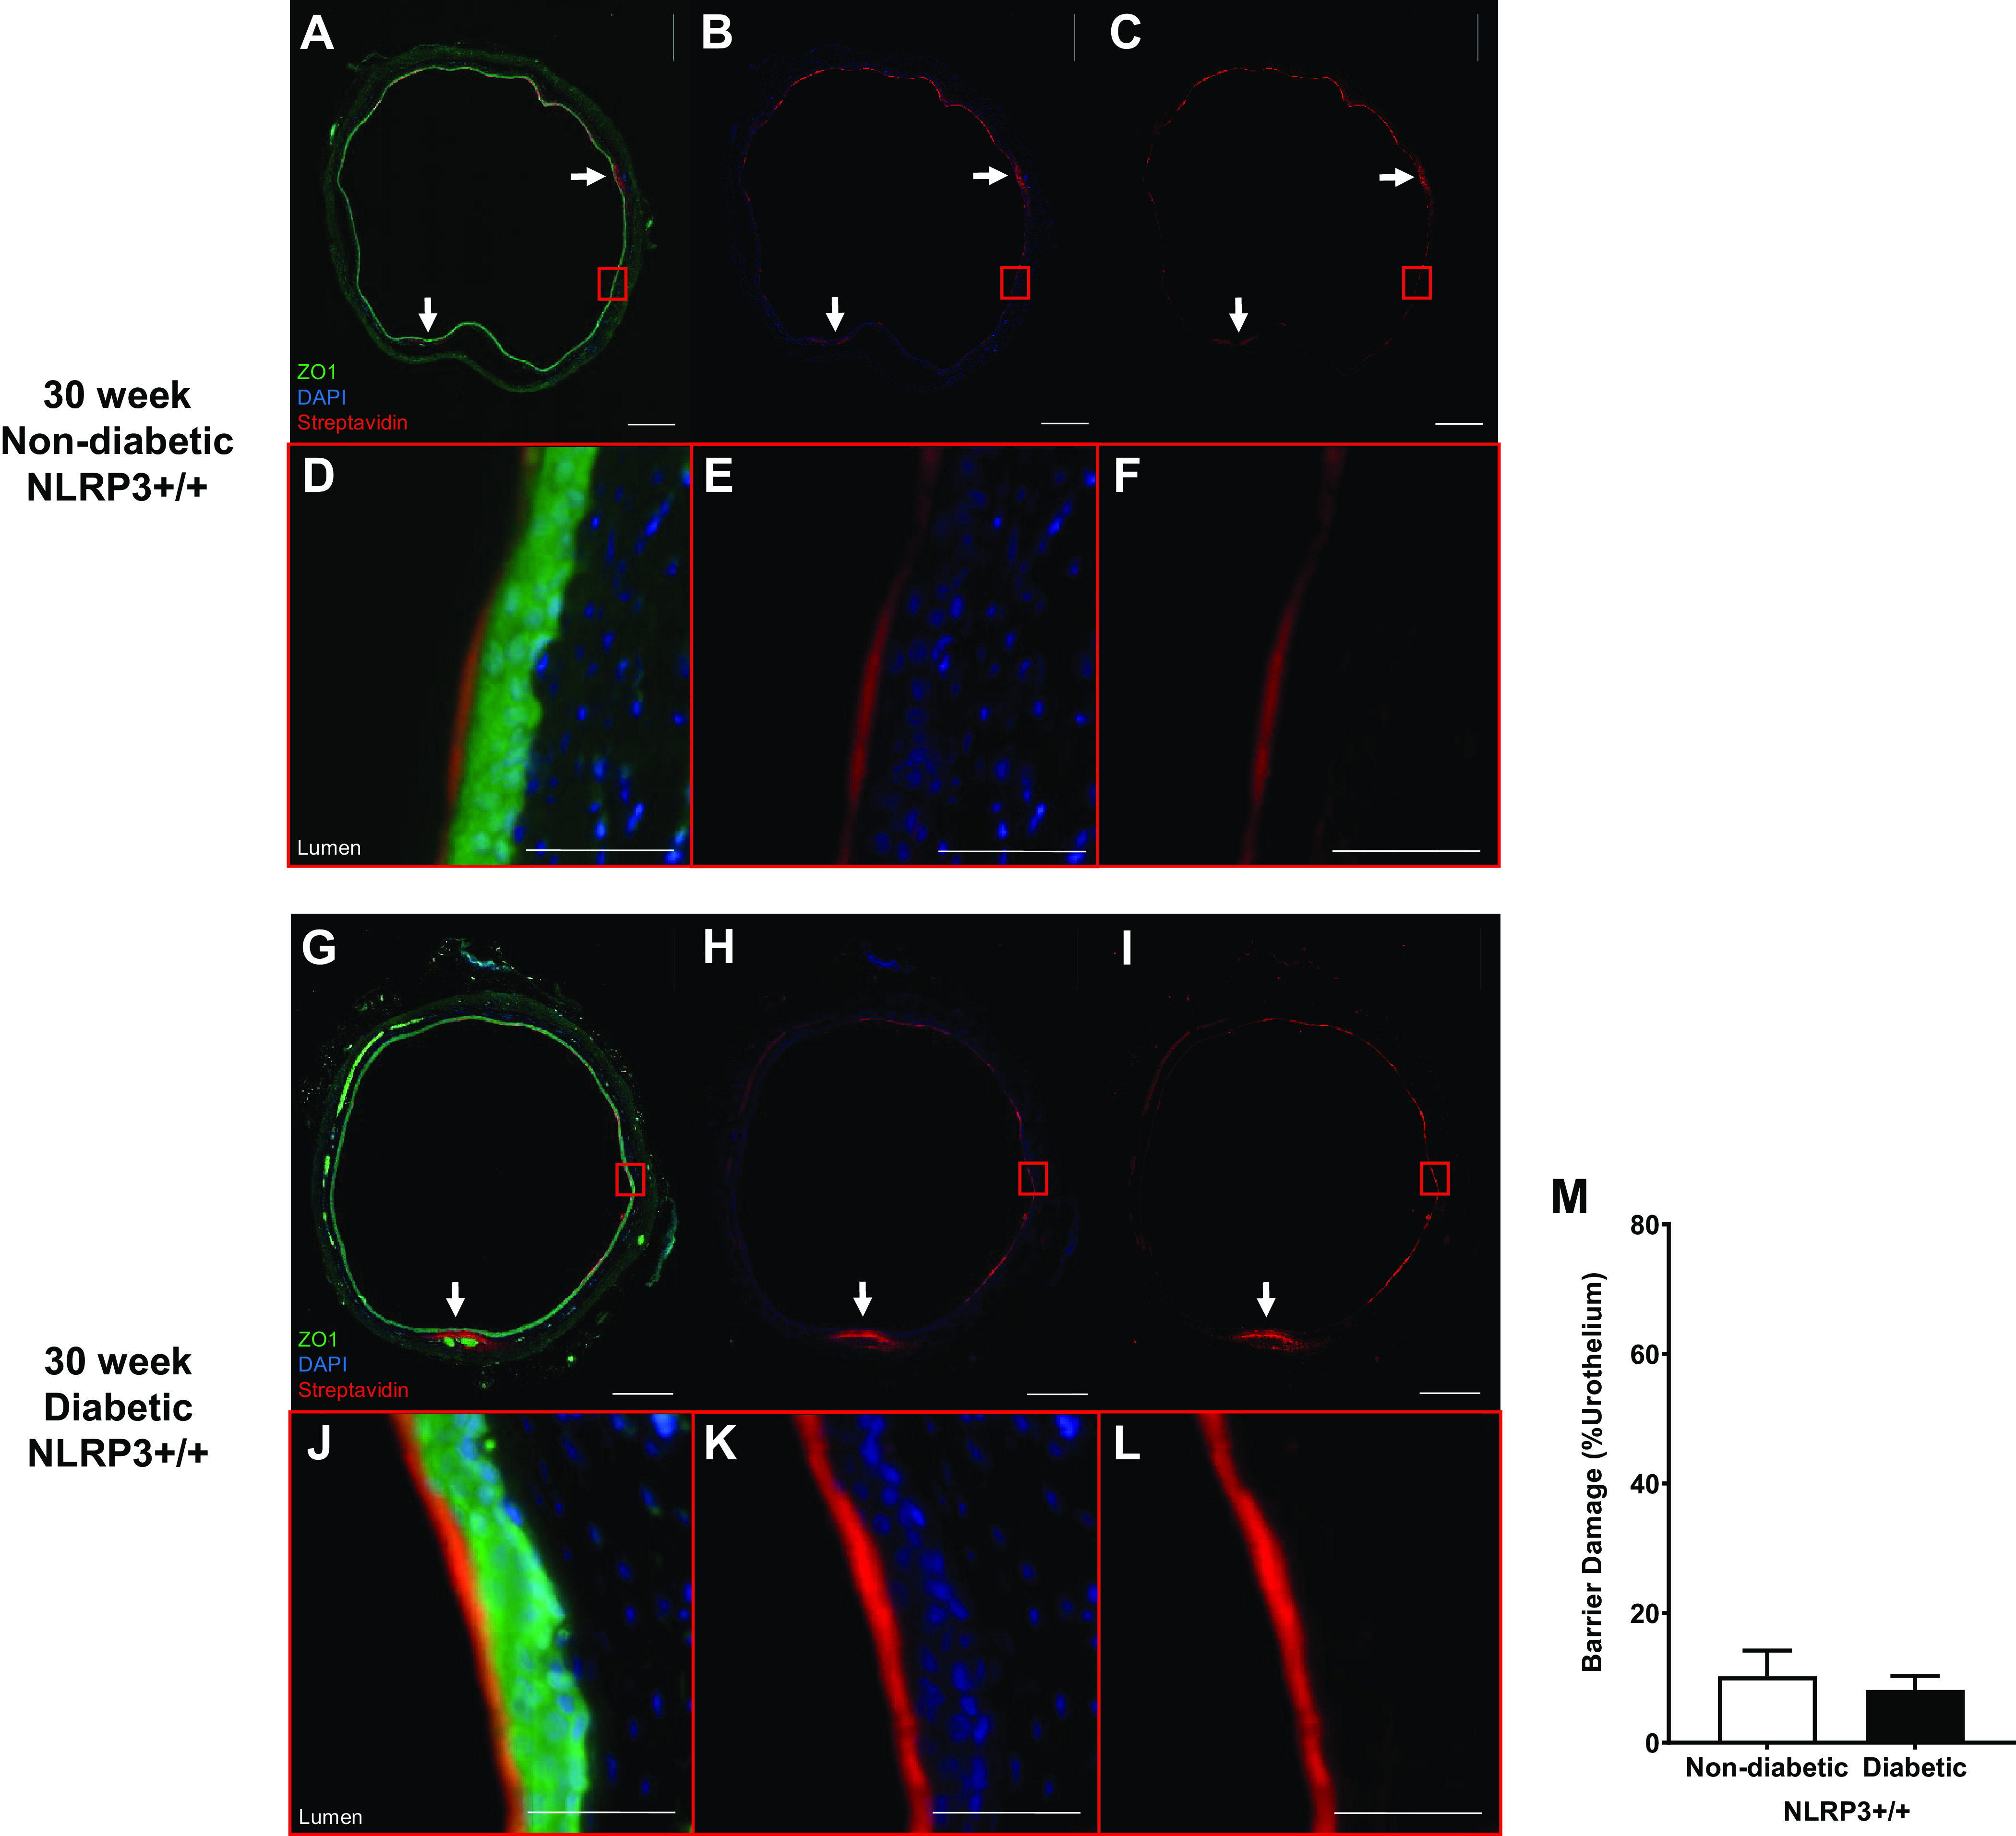
Diabetes does not impact urothelial permeability to sulfo-NHS-biotin at the 30-wk (underactive detrusor) time point. Sulfo-NHS-biotin was dissolved in PBS (1 mg/mL) and delivered intravesically (150 μL) through catheters placed in anesthetized mice. The sulfo-NHS-biotin solution was removed after 30 min and replaced with 150 μL of 4% paraformaldehyde. Bladders were tied proximal to ureters, excised, and paraformaldehyde fixed while inflated. Paraffin-embedded sections (5 µm) were then dehydrated and labeled with primary antibody to zona occludens (ZO1) to identify urothelial cells (shown as bright green), Texas red-conjugated streptavidin for sulfo-NHS-biotin detection (red), and DAPI for nuclei (blue). Regions of urothelia (ZO1, green) considered damaged contained sulfo-NHS-biotin (streptavidin, red) in the submucosa. Representative images of bladder sections are shown. White scale bars in A–C and G–I = 500 μm. In A–C and G–I, red boxes indicate select representative regions that are magnified in D–F and J–L, respectively. Scale bars in in D–F and J–L = 50 μm. A–F: 30-wk nondiabetic NOD-, LRR-, and pyrin domain-containing protein 3 (NLRP3)+/+ urothelial barriers were nearly fully intact with sulfo-NHS-biotin staining on the apical surface. Limited regions of damage in which sulfo-NHS-biotin has traversed the urothelia are indicated by white arrows. G–L: similarly, 30-wk diabetic NLRP3+/+ urothelial barriers were nearly fully intact with limited regions of damage in which sulfo-NHS-biotin has traversed the urothelia indicated by white arrows. M: no statistically significant changes in barrier permeability between diabetic and nondiabetic urothelia were evident at 30-wk time point. n = 3 and 4 animals, respectively. Statistical analysis was determined by a Student’s t test.
Figure 8.
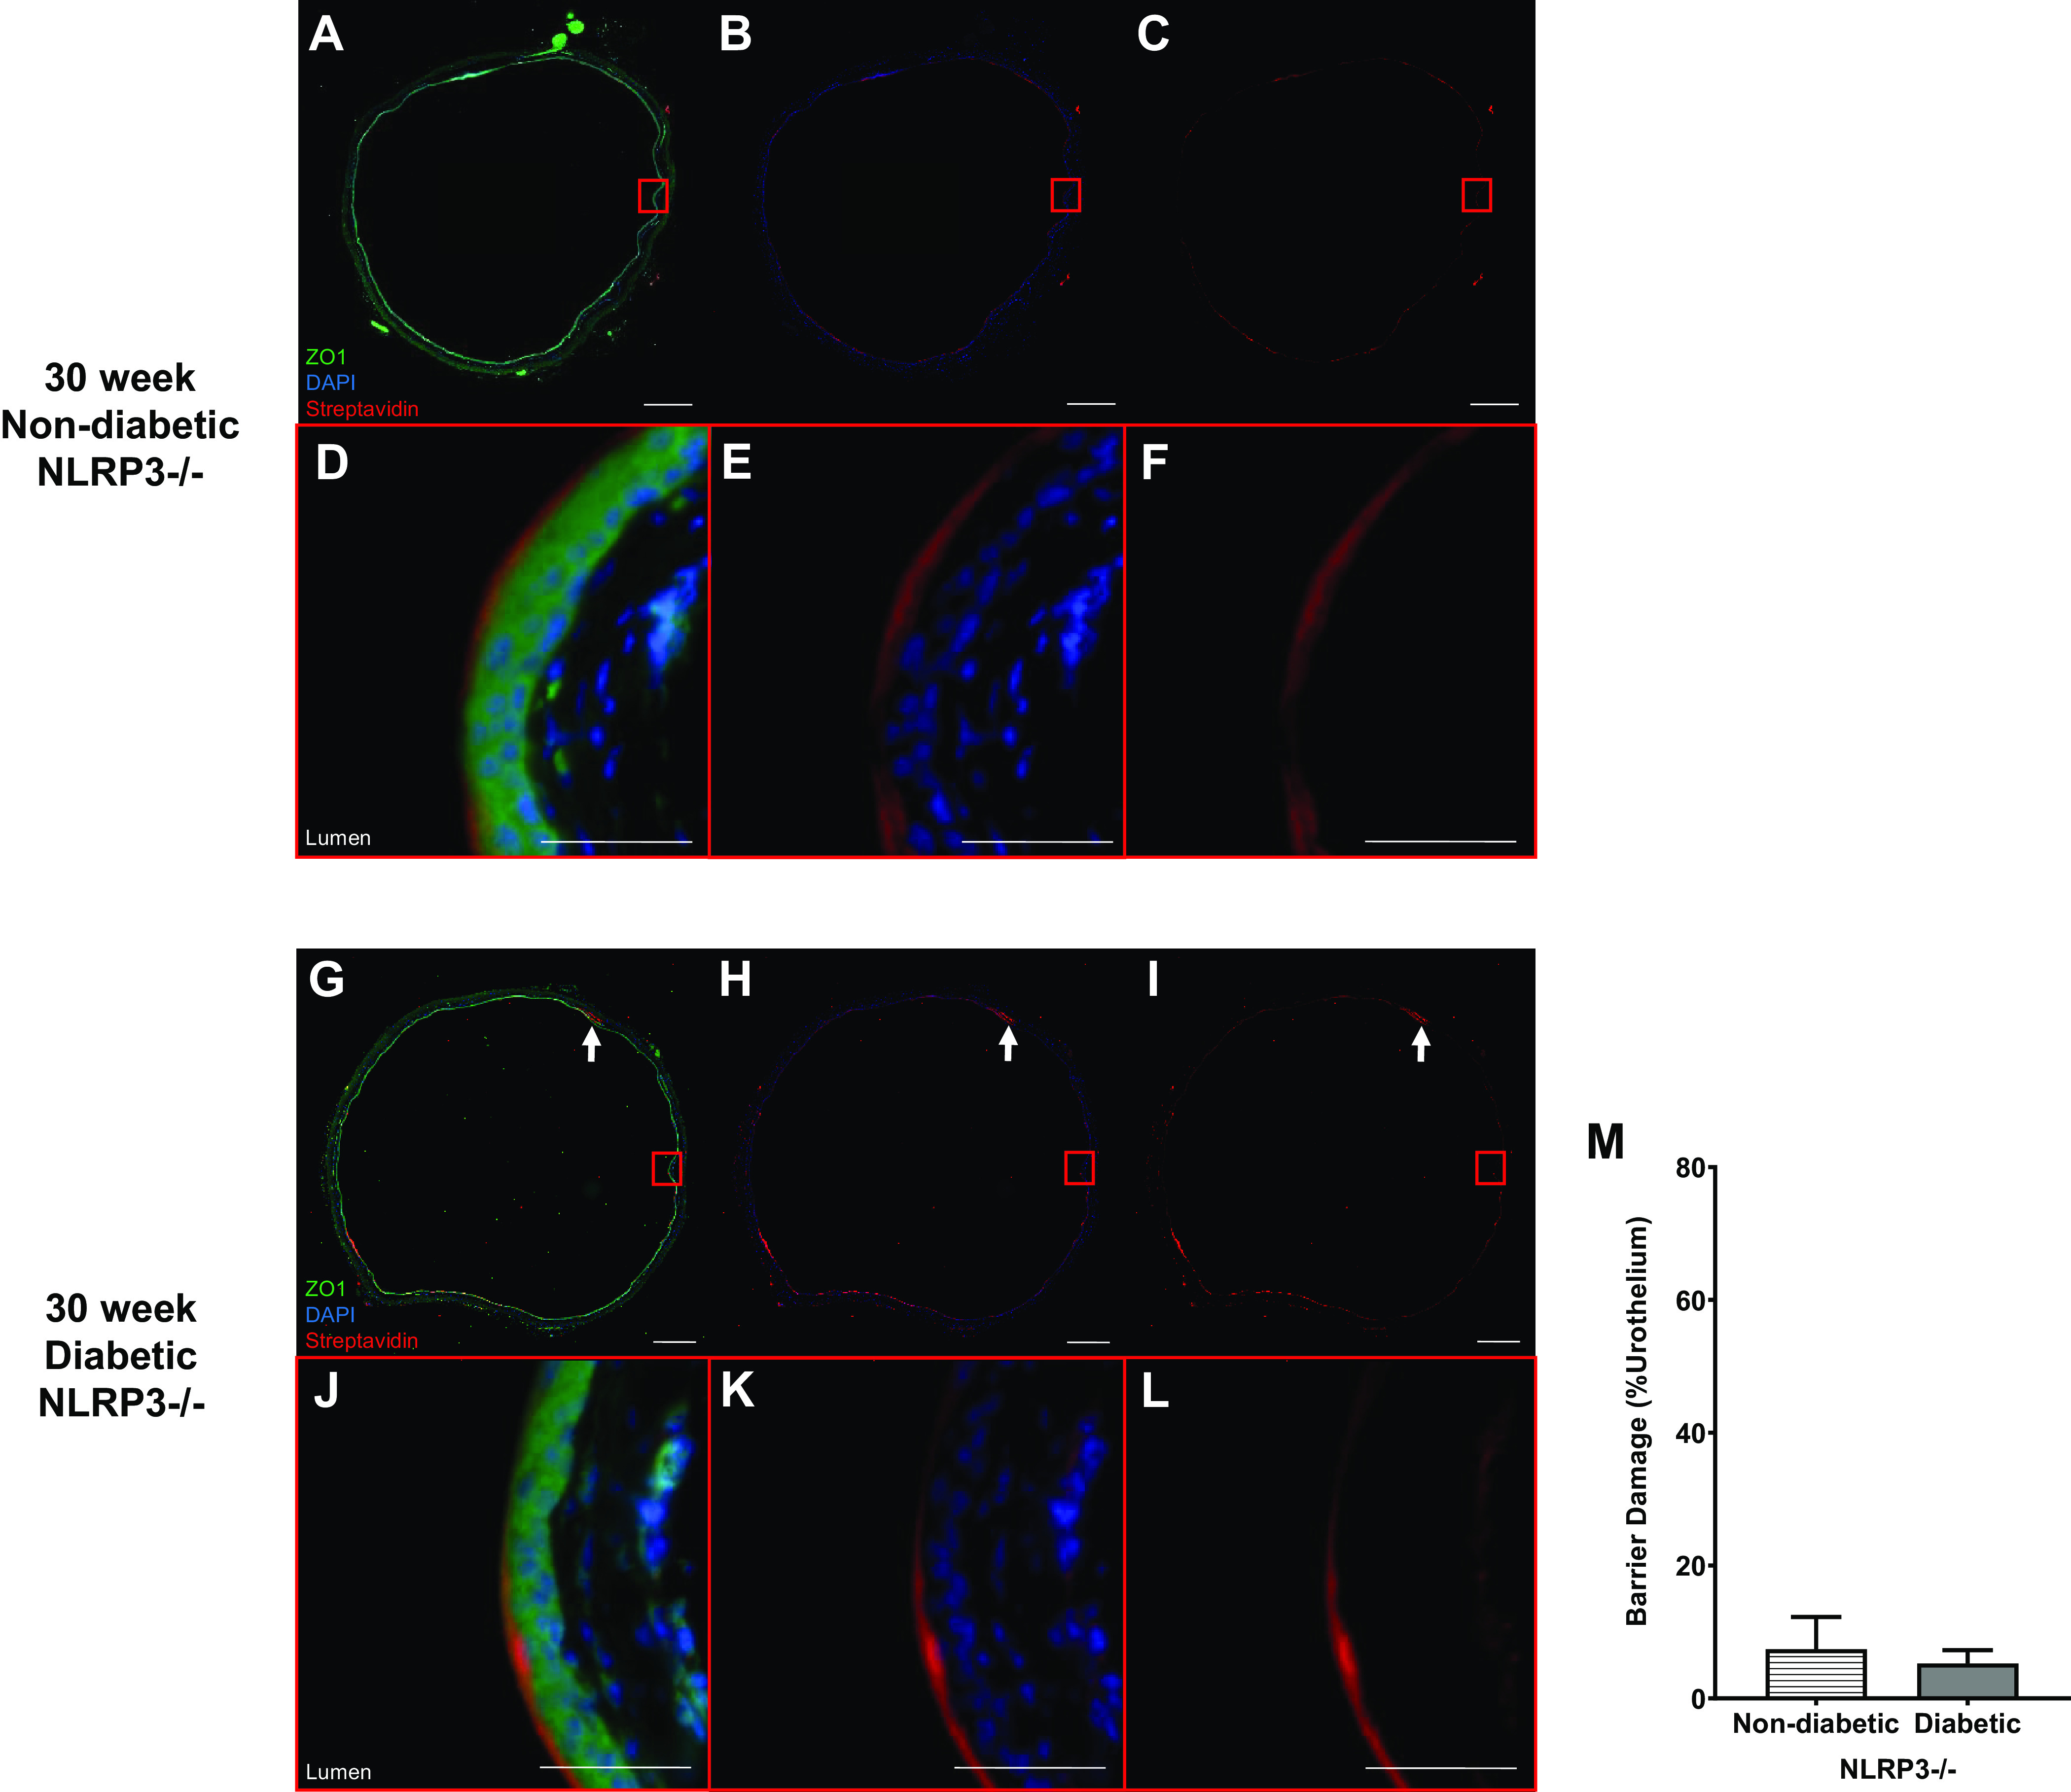
Diabetes does not impact urothelial permeability to sulfo-NHS-biotin at the 30-wk (underactive detrusor) time point in the absence of NOD-, LRR-, and pyrin domain-containing protein 3 (NLRP3). Sulfo-NHS-biotin was dissolved in PBS (1 mg/mL) and delivered intravesically (150 μL) through catheters placed in anesthetized mice. The sulfo-NHS-biotin solution was removed after 30 min and replaced with 150 µL of 4% paraformaldehyde. Bladders were tied proximal to ureters, excised, and paraformaldehyde fixed while inflated. Paraffin-embedded sections (5 µm) were then dehydrated and labeled with primary antibody to zona occludens (ZO1) to identify urothelial cells (shown as bright green), Texas red-conjugated streptavidin for sulfo-NHS-biotin detection (red), and DAPI for nuclei (blue). Regions of urothelia (ZO1, green) considered damaged contained sulfo-NHS-biotin (streptavidin, red) in the submucosa. Representative images of bladder sections are shown. White scale bars in A–C and G–I = 500 μm. In A–C and G–I, red boxes indicate select representative regions that are magnified in D–F and J–L, respectively. Scale bars in D–F and J–L = 50 μm. A–F: 30-wk nondiabetic NLRP3−/− urothelial barriers were intact with sulfo-NHS-biotin staining on the apical surface. G–L: similarly, 30-wk diabetic NLRP3−/− urothelial barriers were nearly fully intact with limited regions of damage in which sulfo-NHS-biotin has traversed the urothelia indicated by white arrows. M: no statistically significant changes in barrier permeability between NLRP3-null diabetic and nondiabetic urothelia are evident at the 30-wk time point. n = 3 and 4 animals, respectively. Statistical analysis was determined by a Student’s t test.
Barrier Gene Expression Is No Longer Downregulated in 30-wk Diabetic Mice
Even though no functional differences in barrier permeability were observed between 30-wk control and diabetic mice, it was important to understand if changes may occur at the genetic level. Gene expression of the uroplakin subunits UP1b and UP2 was not significantly different between 30-wk nondiabetic and diabetic mice, both with and without the NLRP3 gene (Fig. 9, A–D). Likewise, gene expression of the tight junction components ZO1, ZO2, CL4, and CL8 were also not statistically different between nondiabetic and diabetic mice, and NLRP3 gene ablation did not impact expression (Fig. 9, E–L). Expression of the adherens junction component BCAT was surprisingly upregulated in diabetic NLRP3+/+ mice, as shown in Fig. 9M. BCAT expression in mice lacking the NLRP3 gene, however, was not significantly different between nondiabetic and diabetic mice (Fig. 9N).
Figure 9.
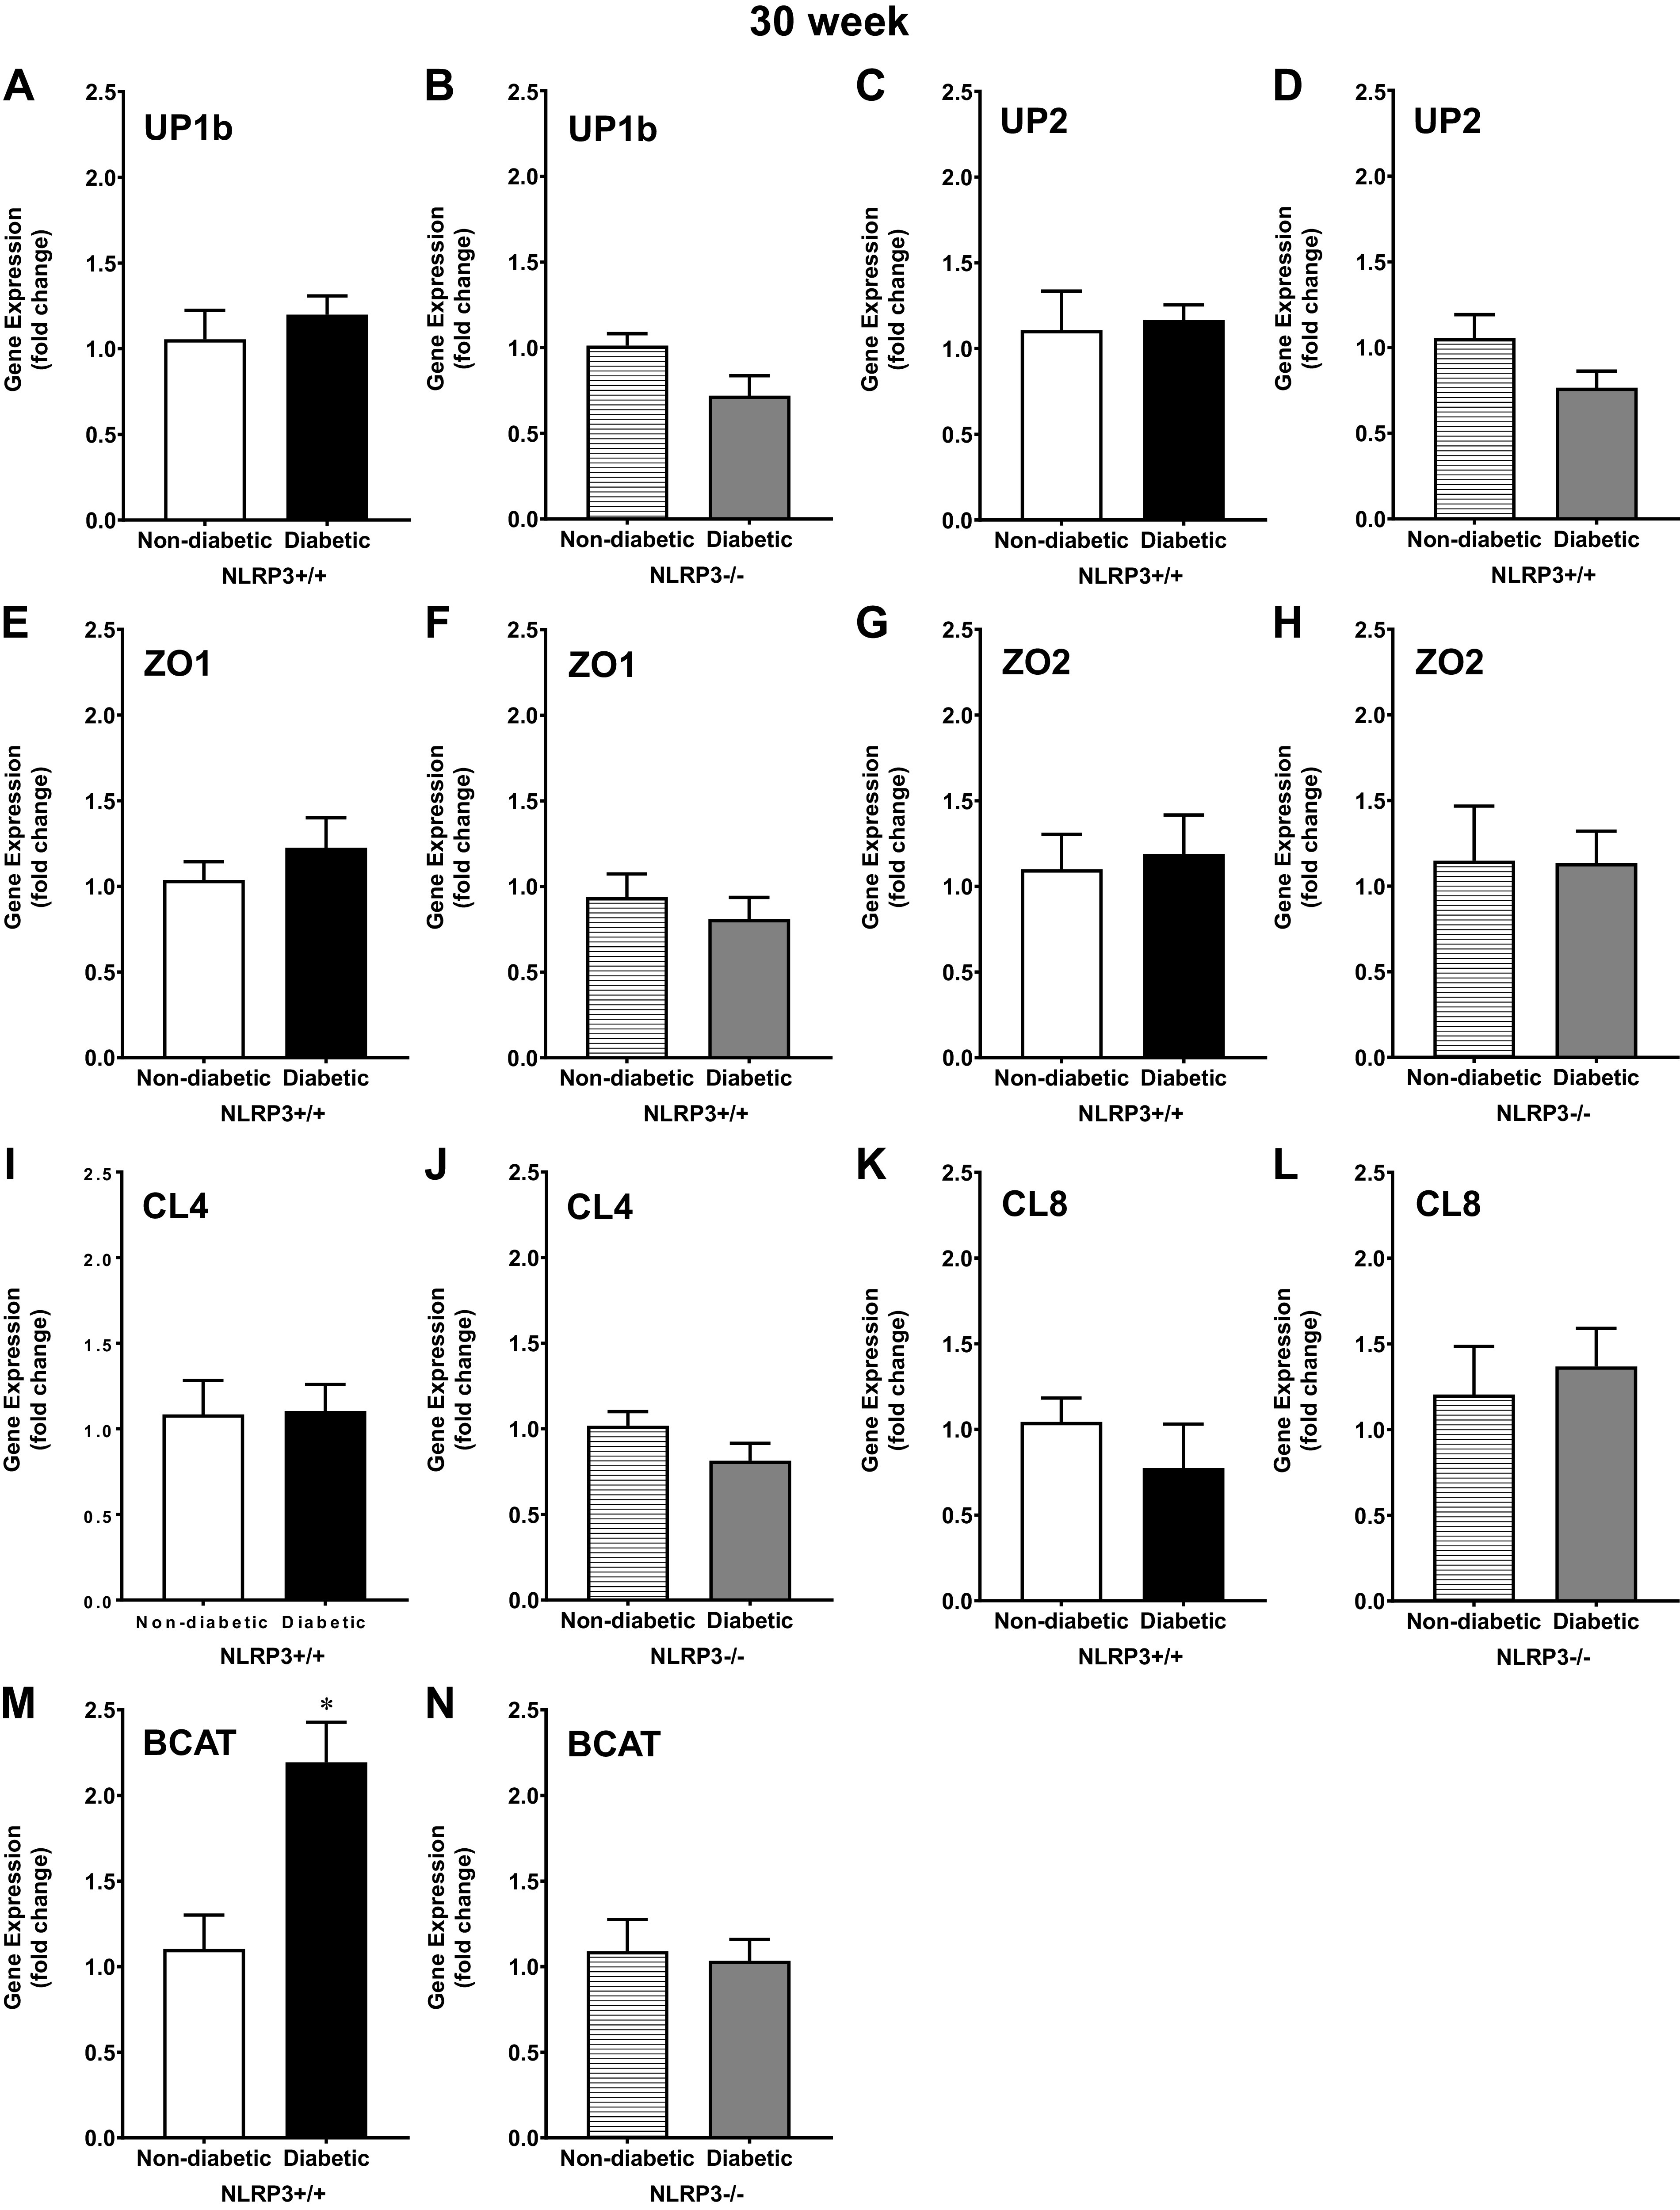
At the underactive 30-wk time point, β-catenin (BCAT) gene expression is upregulated by diabetes, but not uroplakin and tight junction gene expression. Urothelia were scraped from excised bladders, and quantitative PCR was used to measure gene expression of uroplakin subunits UP1b and UP2, tight junction components zona occludens and 2 (ZO1 and ZO2, respectively), claudin 4 and 8 (CL4 and CL8, respectively), and the adherens junction component BCAT. A–D: at 30 wk, diabetes did not significantly alter gene expression of the uroplakin subunits UP1b or UP2; NOD-, LRR-, and pyrin domain-containing protein 3 (NLRP3) gene deletion had no further impact on gene expression. E–L: similarly, at 30 wk, gene expression of tight junction components ZO1, ZO2, CL4, and CL8 were not significantly different between nondiabetic control and diabetic mice either with or without NLRP3. M: surprisingly, BCAT was upregulated in diabetic NLRP3+/+ compared with nondiabetic urothelia. N: BCAT gene expression was comparable between diabetic mice without the NLRP3 gene and nondiabetic NLRP3−/− mice. Respective n (animals) per group, per condition: UP1b (6, 7, 6, and 9), UP2 (6, 7, 6, and 9), ZO1 (6, 7, 6, and 9), ZO2 (6, 7, 7, and 8), CL4 (6, 7, 6, and 9), CL8 (6, 6, 6, and 6), and BCAT (6, 7, 6, and 9). *P < 0.05 vs. nondiabetic control mice (Student’s t test).
No Changes in Barrier Protein Expression Among 30-wk Diabetic Mice
Representative images of labeled membranes showing protein expression of UP1b, ZO1, and GAPDH in all four groups of 30-wk mice are shown in Fig. 10A. Consistent with gene expression data, we found no evidence of UP1b or ZO1 protein downregulation in 30-wk diabetic mice regardless of the presence or absence of NLRP3 (Fig. 10, B–E).
Figure 10.
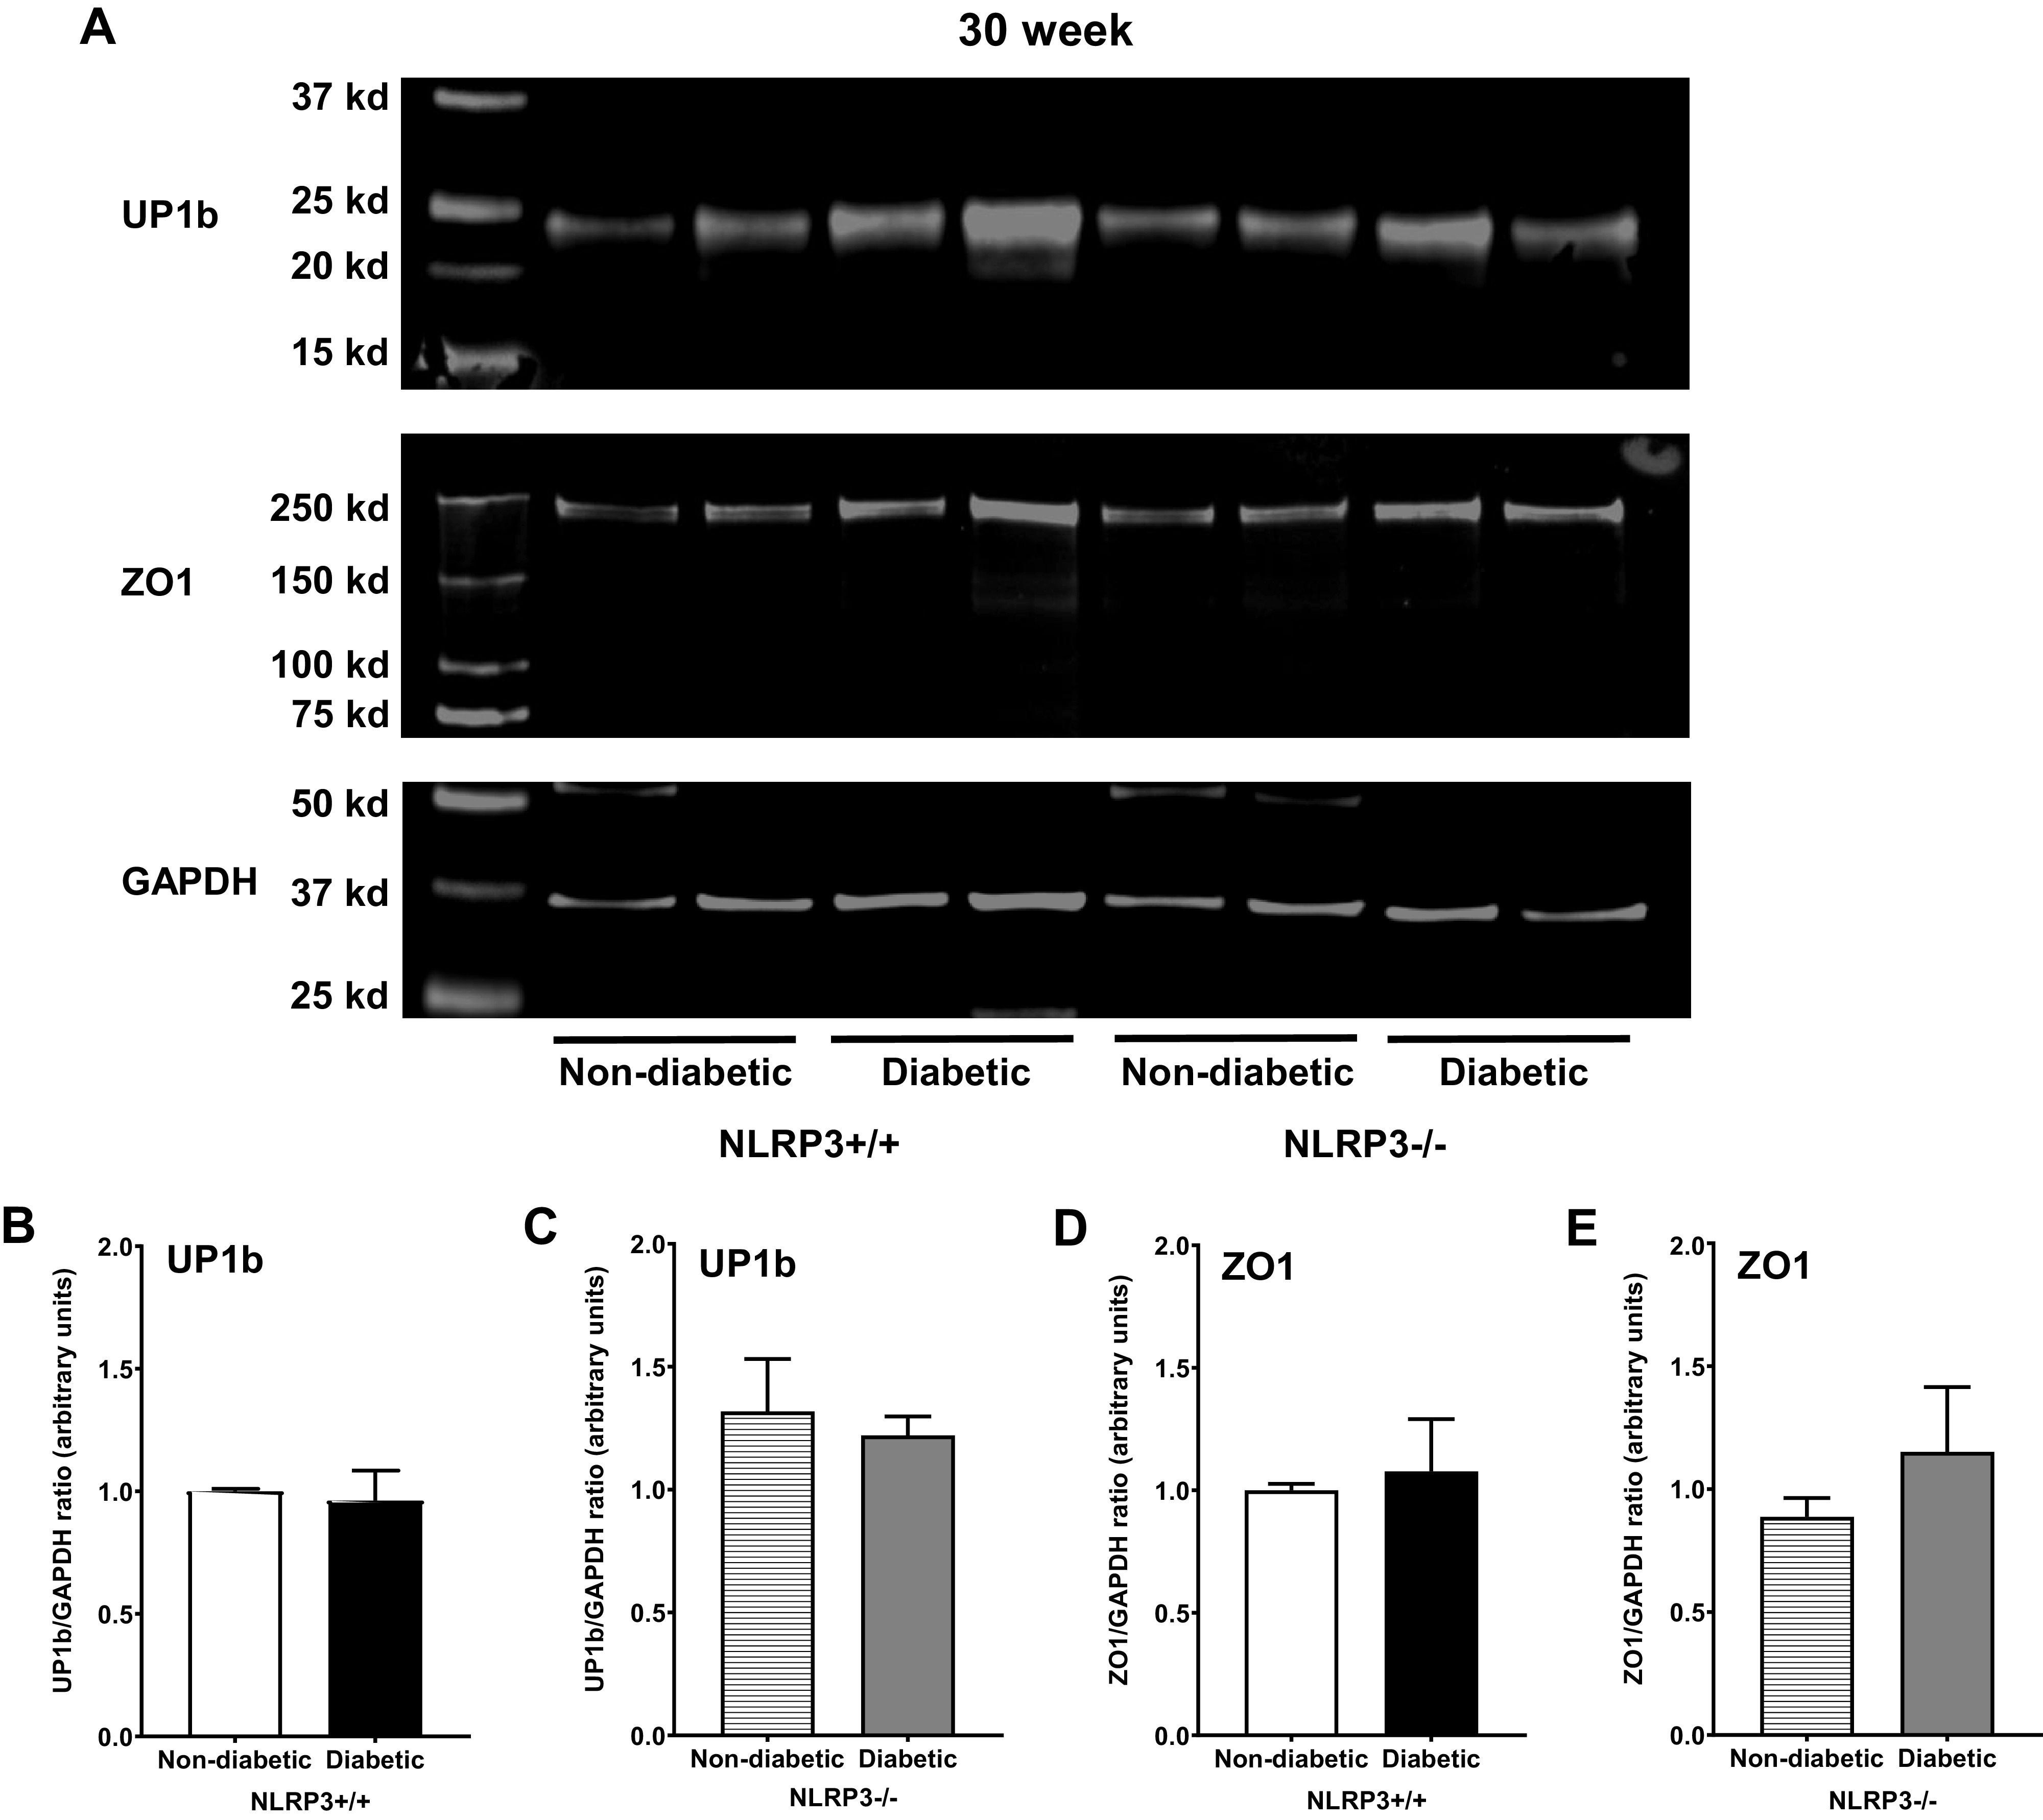
No changes in uroplakin and tight junction protein expression are observed at the 30-wk (underactive detrusor) time point. Western blots were performed using standard techniques described in methods to determine protein expression of uroplakin subunit UP1b and zona occludens 1 (ZO1) in mucosal layer lysates from all four groups of 30-wk mice. A: representative images showing fluorescent labeled UP1b, ZO1, and GAPDH proteins from all four groups of mice and the respective molecular weights of each protein. B and C: regardless of NOD-, LRR-, and pyrin domain-containing protein 3 (NLRP3) status, diabetes did not impact UP1b expression in 30-wk diabetic mice. D and E: ZO1 protein expression was also not affected by diabetes at 30 wk either in the presence or absence of NLRP3. n = 6 animals per group.
DISCUSSION
Bladder urothelia form a highly restrictive barrier that protects underlying tissue from harmful bacteria, toxins, and metabolites in the urine. Damage to the urothelial barrier permits these components to pass through and come in direct contact with underlying cells in the submucosa and detrusor. Here, we demonstrated that Akita diabetic mice with an overactive detrusor phenotype exhibit urothelial barrier damage. These mice also demonstrate a reduction in the expression of barrier genes and proteins, which helps explain the loss in barrier function. However, by the time these diabetic mice develop an underactive detrusor phenotype, no evidence of compromised barrier function is found and expression of barrier genes and proteins are no longer downregulated. Importantly, barrier damage was not detected in diabetic mice lacking the NLRP3 inflammasome at either time point. This demonstrates that NLRP3-dependent inflammation is a major contributor to urothelial barrier damage and the progression of DBD.
With functional NLRP3, diabetes has intriguing effects on urothelial barrier permeability. To measure permeability across the entire urothelium, we modified previous technology (18) to develop a novel quantitative ex vivo method. In this method, the detrusor is removed and the urothelial layer inflated with a physiological buffer containing Evans blue and the amount of the dye that permeated through the mucosal layer was measured. This study is the first to use such methodology to detect urothelial barrier damage, and it proved quite useful to quantitate the overall breakdown of the barrier at 15 wk and its repair by 30 wk. However, to ensure there was actual breakdown in vivo, we also instilled a small molecule intravesicularly and measured movement across the urothelial layer. It is important to note that the molecule used was sulfo-NHS-biotin, which does not penetrate cell membranes and thus diffuses across the urothelial barrier exclusively through paracellular routes. Once it enters tissue, it reacts with primary amine molecules to form a stable bond capable of withstanding dehydration in preparation for paraffin embedding and subsequent visualization with fluorescently coupled streptavidin. Interestingly, sulfo-NHS-biotin has a comparable molecular weight to uric acid and C6 ceramide, two important diabetic metabolites found in urine. As expected, diabetes increased sulfo-NHS-biotin permeability at 15 wk. However, the pattern of barrier damage was surprising. Although we anticipated uniform barrier damage across the entire urothelium, we instead found numerous patchy regions of barrier damage with other areas seemingly unaffected. Likewise, urothelial desquamation and pyroptotic cell loss were found sporadically throughout the diabetic bladders and associated with these areas of dye permeability. It remains unclear why certain regions of the urothelial barrier are more susceptible to inflammation and injury than others, although recent evidence with urinary tract infections offers possible insight. Uropathogenic Escherichia coli activates NLRP3 in urothelia, which attracts mast cells that migrate from the basement membrane. These cells release granules beneath superficial urothelial cells and cause localized urothelial exfoliation (25), which would create a localized area of barrier breakdown. Perhaps a similar mechanism of NLRP3 activation and subsequent mast cell-mediated exfoliation is occurring in these diabetic mice. Interestingly, in a study of patients with diabetes with overactive bladder, the number of mast cells significantly increased within the urothelial barrier (26).
The ability of urothelial cells to undergo extensive damage, repair, and remodeling in the presence of a progressive disease state such as diabetes is remarkable. It would be logical to presume that barrier damage becomes more severe as diabetes continues to progress, but perhaps the most surprising finding was an absence of barrier damage in diabetic mice with underactive detrusors. Such urothelial barrier damage and remodeling has also been noted in a streptozotocin-induced type 1 diabetic rat model (16). In that study, the authors found that 9 wk after streptozotocin treatment, apical urothelial cells were missing and tight junctions were visibly broken. In addition, there was no longer a clear distinction between intermediate and apical cells. However, 20 wk after diabetes induction, urothelial cells had reorganized into distinct layers and both tight junctions and uroplakins were again evident among apical cells. Unfortunately, these investigators did not determine if the damage and reorganization correlated with actual changes in barrier function, although it is tempting to speculate that it did. Excitingly, future studies that give a better understanding of the urothelial repair mechanisms that were active in those, and the present, studies could identify therapeutic targets to treat DBD by enhancing repair.
Dysregulated glucose metabolism and hyperglycemia generate high levels of diabetic metabolites that accumulate in tissue, blood, and urine. These proinflammatory diabetic metabolites have profound negative impacts on bladder function. For example, euglycemic mice that orally consume the diabetic metabolite methylglyoxal develop bladder inflammation and detrusor overactivity (23). We have shown that proinflammatory metabolites such as uric acid and C6 ceramide activate the NLRP3 inflammasome in urothelial cells in vitro (8). We have previously shown that preventing inflammation mediated by the NLRP3 inflammasome also prevents female Akita mice from developing detrusor overactivity and detrusor underactivity phenotypes (8, 9). However, before this study, it was unclear how NLRP3-derived urothelial inflammation would impact barrier function in these mice. Since NLRP3 gene deletion prevents bladder dysfunction, we anticipated that it would prevent other inflammation-driven pathologies thought to contribute to DBD, such as barrier dysfunction. Indeed, in mice in which NLRP3 was deleted, diabetes does not cause a breakdown in urothelia barrier permeability as measured both ex vivo and in vivo in our 15-wk mice. Moreover, signs of barrier dysfunction were still not present after 30 wk, suggesting that few, if any, redundant pathways are in place that can overcome the loss of NLRP3. This has profound implications for the future of DBD treatment and strongly suggests that NLRP3 would make an ideal candidate for the first targeted therapy for DBD.
It is interesting to consider what contributes to the breakdown of the urothelial barrier. Uroplakins cover apical urothelia and form the first line of barrier defense. The reduction in UP1b and UP2 mRNA expression that we detected in diabetic urothelia suggests that changes in these plaques may contribute to the weaker barrier. Similar results have been seen in a streptozotocin-induced rat model (17), and UP2 knockout clearly resulted in reduced barrier function (25). Components of tight junctions are also critical for maintaining the urothelial barrier since they are the principal regulators of paracellular permeability (25), and these structures have been shown to be damaged in the streptozotocin-induced diabetic model (17). Moreover, in human bladders, urothelial ZO1 expression was downregulated in patients with overactive bladder but not significantly different from controls in patients with underactive bladder (26, 27). Here, we show that the Akita model faithfully reproduces this change where ZO1 and ZO2 gene expression is downregulated only at 15 wk (overactive time point) and normalized at 30 wk (underactive time point). Finally, ZOs often colocalize with claudins at tight junctions, and we found that CL4 and CL8 [barrier-forming claudin previously identified in the bladder (25)] are downregulated at the overactive time point and normal at the underactive time point. Thus, one major way barrier function is compromised is a decreased production of barrier components leading to an increase in paracellular transport of metabolites, etc. In addition to breakdown of junctions, it seems likely that pyroptosis contributes to the change in barrier integrity, as has been detected in other tissues (28–30). As described in the introduction, NLRP3 activation leads to gasdermin D pore formation and cell lysis. The result is a literal hole in the urothelial strata, which we found in our 15-wk diabetic mice. This hole would serve to convey the flux of noxious chemicals deeper into the barrier layer as well as create a path of less resistance for invading bacteria. There these agents would engage NLRP3 in the lower urothelial layers and further propagate the inflammatory response. Together, the data suggest a multifactorial contribution to the breakdown of the urothelial barrier.
Regarding junction components, we did find an interesting result with the adherens junction gene BCAT, which regulates cell-to-cell adhesion and plays a role in urothelial proliferation. BCAT is not affected at the overactive time point but is increased by 30 wk. In response to bacterial or chemical injury, basal urothelial cells undergo rapid proliferation and differentiation due to the Wnt/BCAT signaling pathway (25). The upregulation of BCAT suggests that this signaling pathway may contribute to the restoration of barrier function observed by 30 wk.
It should be noted that in this study that we have drawn conclusions based on the assumption that the female Akita mouse shows bladder overactivity at 15 wk and progresses to underactivity at 30 wk. As mentioned in the methods, this is based on our previous publications (9, 10) documenting these changes in our colony of mice and the assumption that such changes are stable and have not shifted due to genetic drift, environmental factors, etc. Not repeating these experiments in the current set of animals to ensure its continuing authenticity represents a major limitation to the present study.
Perspectives and Significance
Finally, it is useful to consider how changes in barrier function contribute to bladder over- and underactivity. We propose that initially high systemic levels of diabetic metabolites activate the NLRP3 inflammasome in urothelial cells. Upon activation, urothelial cells undergo pyroptosis and release proinflammatory cytokines (primarily IL-1β), which exacerbate urothelial inflammation. Subsequently, reductions in barrier gene and protein expression occur, and there is an overall increase in barrier permeability. This may be due to a direct effect of IL-1β on neighboring urothelia as this cytokine is known to cause the breakdown of epithelial (31, 32) and endothelial barriers (33) and can have direct effects on tight junction proteins (34). In addition, the increase in pyroptosis would clearly damage barrier function by literally creating holes in the urothelia. NLRP3 has also recently been shown to modulate gene expression (35) by functioning as a transcriptional regulator, so we cannot rule out changes in barrier gene expression (and thus barrier permeability) directly by NLRP3, although one would have to speculate that for this to contribute significantly it would have to occur before pyroptosis or in urothelial cells that, for some reason (e.g., an insufficient insult) would not undergo pyroptosis. Finally, numerous downstream events could cause these changes. For example, IL-1β is known to release IL-6, and IL-6 is well documented to decrease epithelial and endothelial barriers and have direct effects on barrier gene expression (36, 37). Regardless of the exact cause, a decrease in barrier function would permit noxious compounds in urine to irritate underlying urothelial cell layers, activate their NLRP3, and further propagate the inflammatory response. Moreover, cells within the lamina propria and detrusor are also exposed, including the afferent nerve fibers, which are highly susceptible to injury. Persistent stimulation of afferent C-fiber nerves, which are upregulated at 15 wk in the Akita model (9), further amplify and sensitize central nervous system input responsible for bladder contractions, thereby perpetuating and exacerbating overactive bladder symptoms. Meanwhile, noxious compounds may come in direct contact with the detrusor, where they may augment smooth muscle signaling pathways to increase contraction force and frequency in an effort to rid the bladder of these compounds. During this time, however, two additional events occur. First, there is a decrease in the overall nerve density (other than C-fibers), most likely by a direct effect of IL-1β inducing apoptosis of neurons (38), and, second, the detrusor smooth muscle hypertrophies, also likely a direct result of Il-1β action on the myocytes (39). Eventually, urothelial damage triggers urothelial repair and remodeling, most likely due to the Wnt/BCAT signaling pathway. By 30 wk (in our model), urothelial cells have been able to restore barrier function. However, due to the nerve damage and detrusor hypertrophy, the organism experiences underactive bladder symptoms. Future experiments are envisioned to test the validity of this proposed sequence of events and ultimately identify pharmacological targets necessary to treat or even prevent DBD.
Conclusions
We have shown that there is a pathological increase in permeability through the urothelial layer in type 1 diabetic Akita female mice with an overactive detrusor phenotype. As these diabetic female mice progress to an underactive detrusor phenotype, this permeability is restored back to control levels. Genetic ablation of NLRP3 prevents urothelial barrier damage, demonstrating that this inflammasome plays a critical role in triggering barrier degradation. Overall, this work suggests that NLRP3 inhibition could be a promising pharmacological goal for the first targeted therapy for DBD.
SUPPLEMENTAL DATA
Supplemental Figs. S1–S10: https://doi.org/10.6084/m9.figshare.20565333.v1.
GRANTS
This work was supported by National Institute of Diabetes and Digestive and Kidney Diseases Grants RO1DK117890 and K12DK100024.
DISCLOSURES
No conflicts of interest, financial or otherwise, are declared by the authors.
AUTHOR CONTRIBUTIONS
M.R.O., F.M.H.Jr., and J.T.P. conceived and designed research; M.R.O. and H.J. performed experiments; M.R.O. analyzed data; M.R.O., F.M.H.Jr., and J.T.P. interpreted results of experiments; M.R.O. and F.M.H.Jr. prepared figures; M.R.O. drafted manuscript; M.R.O., F.M.H.Jr., H.J., and J.T.P. edited and revised manuscript; M.R.O., F.M.H.Jr., H.J., and J.T.P. approved final version of manuscript.
REFERENCES
- 1. Rittiner JE, Korboukh I, Hull-Ryde EA, Jin J, Janzen WP, Frye SV, Zylka MJ. AMP is an adenosine A1 receptor agonist. J Biol Chem 287: 5301–5309, 2012. doi: 10.1074/jbc.M111.291666. [DOI] [PMC free article] [PubMed] [Google Scholar]
- 2. Kebapci N, Yenilmez A, Efe B, Entok E, Demirustu C. Bladder dysfunction in type 2 diabetic patients. Neurourol Urodyn 26: 814–819, 2007. doi: 10.1002/nau.20422. [DOI] [PubMed] [Google Scholar]
- 3. Kaplan SA, Te AE, Blaivas JG. Urodynamic findings in patients with diabetic cystopathy. J Urol 153: 342–344, 1995. doi: 10.1097/00005392-199502000-00013. [DOI] [PubMed] [Google Scholar]
- 4. Liu G, Daneshgari F. Temporal diabetes- and diuresis-induced remodeling of the urinary bladder in the rat. Am J Physiol Regul Integr Comp Physiol 291: R837–R843, 2006. doi: 10.1152/ajpregu.00917.2005. [DOI] [PubMed] [Google Scholar]
- 5. Daneshgari F, Liu G, Birder L, Hanna-Mitchell AT, Chacko S. Diabetic bladder dysfunction: current translational knowledge. J Urol 182: S18–S26, 2009. doi: 10.1016/j.juro.2009.08.070. [DOI] [PMC free article] [PubMed] [Google Scholar]
- 6. Daneshgari F, Liu G, Imrey PB. Time dependent changes in diabetic cystopathy in rats include compensated and decompensated bladder function. J Urol 176: 380–386, 2006. doi: 10.1016/S0022-5347(06)00582-9. [DOI] [PubMed] [Google Scholar]
- 7. Tsalamandris S, Antonopoulos AS, Oikonomou E, Papamikroulis G-A, Vogiatzi G, Papaioannou S, Deftereos S, Tousoulis D. The role of inflammation in diabetes: current concepts and future perspectives. Eur Cardiol 14: 50–59, 2019. doi: 10.15420/ecr.2018.33.1. [DOI] [PMC free article] [PubMed] [Google Scholar]
- 8. Inouye BM, Hughes FM, Jin H, Lütolf R, Potnis KC, Routh JC, Rouse DC, Foo W-C, Purves JT. Diabetic bladder dysfunction is associated with bladder inflammation triggered through hyperglycemia not polyuria. Res Rep Urol 10: 219–225, 2018. doi: 10.2147/RRU.S177633. [DOI] [PMC free article] [PubMed] [Google Scholar]
- 9. Hughes FM, Hirshman NA, Inouye BM, Jin H, Stanton EW, Yun CE, Davis LG, Routh JC, Purves JT Jr.. NLRP3 promotes diabetic bladder dysfunction and changes in symptom-specific bladder innervation. Diabetes 68: 430–440, 2019. doi: 10.2337/db18-0845. [DOI] [PMC free article] [PubMed] [Google Scholar]
- 10. Hughes FM, Allkanjari A, Odom MR, Jin H, Purves JT Jr.. Diabetic bladder dysfunction progresses from an overactive to an underactive phenotype in a type-1 diabetic mouse model (Akita female mouse) and is dependent on NLRP3. Life Sci 299: 120528, 2022. doi: 10.1016/j.lfs.2022.120528. [DOI] [PMC free article] [PubMed] [Google Scholar]
- 11. Hughes FM Jr, Turner DP, Purves JT. The potential repertoire of the innate immune system in the bladder: expression of pattern recognition receptors in the rat bladder and a rat urothelial cell line (MYP3 cells). Int Urol Nephrol 47: 1953–1964, 2015. doi: 10.1007/s11255-015-1126-6. [DOI] [PMC free article] [PubMed] [Google Scholar]
- 12. Hughes FM, Hill HM, Wood CM, Edmondson AT, Dumas A, Foo W-C, Oelsen JM, Rac G, Purves JT Jr.. The NLRP3 inflammasome mediates inflammation produced by bladder outlet obstruction. J Urol 195: 1598–1605, 2016. doi: 10.1016/j.juro.2015.12.068. [DOI] [PMC free article] [PubMed] [Google Scholar]
- 13. Inouye BM, Hughes FM, Sexton SJ, Purves JT. The emerging role of inflammasomes as central mediators in inflammatory bladder pathology. Curr Urol 11: 57–72, 2018. doi: 10.1159/000447196. [DOI] [PMC free article] [PubMed] [Google Scholar]
- 14. Hartsock A, Nelson WJ. Adherens and tight junctions: structure, function and connections to the actin cytoskeleton. Biochim Biophys Acta 1778: 660–669, 2008. doi: 10.1016/j.bbamem.2007.07.012. [DOI] [PMC free article] [PubMed] [Google Scholar]
- 15. Matuszewski MA, Tupikowski K, Dołowy Ł, Szymańska B, Dembowski J, Zdrojowy R. Uroplakins and their potential applications in urology. Cent European J Urol 69: 252–257, 2016. doi: 10.5173/ceju.2016.638. [DOI] [PMC free article] [PubMed] [Google Scholar]
- 16. Wu X-R, Kong X-P, Pellicer A, Kreibich G, Sun T-T. Uroplakins in urothelial biology, function, and disease. Kidney Int 75: 1153–1165, 2009. doi: 10.1038/ki.2009.73. [DOI] [PMC free article] [PubMed] [Google Scholar]
- 17. Hanna-Mitchell AT, Ruiz GW, Daneshgari F, Liu G, Apodaca G, Birder LA. Impact of diabetes mellitus on bladder uroepithelial cells. Am J Physiol Regul Integr Comp Physiol 304: R84–R93, 2013. doi: 10.1152/ajpregu.00129.2012. [DOI] [PMC free article] [PubMed] [Google Scholar]
- 18. Durnin L, Kwok B, Kukadia P, McAvera R, Corrigan RD, Ward SM, Zhang Y, Chen Q, Koh SD, Sanders KM, Mutafova-Yambolieva VN. An ex vivo bladder model with detrusor smooth muscle removed to analyse biologically active mediators released from the suburothelium. J Physiol 597: 1467–1485, 2019. doi: 10.1113/JP276924. [DOI] [PMC free article] [PubMed] [Google Scholar]
- 19. Montalbetti N, Rued AC, Clayton DR, Ruiz WG, Bastacky SI, Prakasam HS, Eaton AF, Kullmann FA, Apodaca G, Carattino MD. Increased urothelial paracellular transport promotes cystitis. Am J Physiol Renal Physiol 309: F1070–F1081, 2015. doi: 10.1152/ajprenal.00200.2015. [DOI] [PMC free article] [PubMed] [Google Scholar]
- 20. Di Virgilio F. The therapeutic potential of modifying inflammasomes and NOD-like receptors. Pharmacol Rev 65: 872–905, 2013. doi: 10.1124/pr.112.006171. [DOI] [PubMed] [Google Scholar]
- 21. Li H, Wang P, Huang F, Jin J, Wu H, Zhang B, Wang Z, Shi H, Wu X. Astragaloside IV protects blood-brain barrier integrity from LPS-induced disruption via activating Nrf2 antioxidant signaling pathway in mice. Toxicol Appl Pharmacol 340: 58–66, 2018. doi: 10.1016/j.taap.2017.12.019. [DOI] [PubMed] [Google Scholar]
- 22. Hughes FM, Vivar NP, Kennis JG, Pratt-Thomas JD, Lowe DW, Shaner BE, Nietert PJ, Spruill LS, Purves JT Jr.. Inflammasomes are important mediators of cyclophosphamide-induced bladder inflammation. Am J Physiol Renal Physiol 306: F299–F308, 2014. doi: 10.1152/ajprenal.00297.2013. [DOI] [PMC free article] [PubMed] [Google Scholar]
- 23. Livak KJ, Schmittgen TD. Analysis of relative gene expression data using real-time quantitative PCR and the 2−ΔΔCT method. Methods 25: 402–408, 2001. doi: 10.1006/meth.2001.1262. [DOI] [PubMed] [Google Scholar]
- 24. Acharya P, Beckel J, Ruiz WG, Wang E, Rojas R, Birder L, Apodaca G. Distribution of the tight junction proteins ZO1, occludin, and claudin-4, -8, and -12 in bladder epithelium. Am J Physiol Renal Physiol 287: F305–F318, 2004. doi: 10.1152/ajprenal.00341.2003. [DOI] [PubMed] [Google Scholar]
- 25. Gunzel D, Yu AS. Claudins and the modulation of tight junction permeability. Physiol Rev 93: 525–569, 2013. doi: 10.1152/physrev.00019.2012. [DOI] [PMC free article] [PubMed] [Google Scholar]
- 26. Jiang YH, Kuo HC. Urothelial barrier deficits, suburothelial inflammation and altered sensory protein expression in detrusor underactivity. J Urol 197: 197–203, 2017. doi: 10.1016/j.juro.2016.07.071. [DOI] [PubMed] [Google Scholar]
- 27. Wang CC, Kuo HC. Urothelial dysfunction and chronic inflammation in diabetic patients with overactive bladder. Lower Urin Tract Symptoms 9: 151–156, 2017. doi: 10.1111/luts.12126. [DOI] [PubMed] [Google Scholar]
- 28. Ge X, Li W, Huang S, Yin Z, Xu X, Chen F, Kong X, Wang H, Zhang J, Lei P. The pathological role of NLRs and AIM2 inflammasome-mediated pyroptosis in damaged blood-brain barrier after traumatic brain injury. Brain Res 1697: 10–20, 2018. doi: 10.1016/j.brainres.2018.06.008. [DOI] [PubMed] [Google Scholar]
- 29. Nojkov B, Zhou S-Y, Dolan RD, Davis EM, Appelman HD, Guo X, Jackson K, Sturm MB, Wang TD, Owyang C, Liu JJ, Chey WD. Evidence of duodenal epithelial barrier impairment and increased pyroptosis in patients with functional dyspepsia on confocal laser endomicroscopy and “ex vivo” mucosa analysis. Am J Gastroenterol 115: 1891–1901, 2020. doi: 10.14309/ajg.0000000000000827. [DOI] [PMC free article] [PubMed] [Google Scholar]
- 30. Osterman MT, Gordon IO, Davis EM, Ciorba M, Glover SC, Abraham B, Khan F, Guo X, Yee EU, Allard FD, Claggett B, Shen B, Liu JJ. Mucosal biomarker of innate immune activation predicts response to vedolizumab in Crohn's disease. Inflamm Bowel Dis 26: 1554–1561, 2020. doi: 10.1093/ibd/izz222. [DOI] [PubMed] [Google Scholar]
- 31. Al-Sadi R, Guo S, Dokladny K, Smith MA, Ye D, Kaza A, Watterson DM, Ma TY. Mechanism of interleukin-1β induced-increase in mouse intestinal permeability in vivo. J Interferon Cytokine Res 32: 474–484, 2012. doi: 10.1089/jir.2012.0031. [DOI] [PMC free article] [PubMed] [Google Scholar]
- 32. Al-Sadi R, Guo S, Ye D, Dokladny K, Alhmoud T, Ereifej L, Said HM, Ma TY. Mechanism of IL-1β modulation of intestinal epithelial barrier involves p38 kinase and activating transcription factor-2 activation. J Immunol 190: 6596–6606, 2013. doi: 10.4049/jimmunol.1201876. [DOI] [PMC free article] [PubMed] [Google Scholar]
- 33. Zhai Z, Wang J, Huang B, Yin S. Low-fat yogurt alleviates the pro-inflammatory cytokine IL-1β-induced intestinal epithelial barrier dysfunction. J Dairy Sci 102: 976–984, 2019. doi: 10.3168/jds.2018-15226. [DOI] [PubMed] [Google Scholar]
- 34. Xu T, Dong Z, Wang X, Qi S, Li X, Cheng R, Liu X, Zhang Y, Gao M-Q. IL-1β induces increased tight junction permeability in bovine mammary epithelial cells via the IL-1β-ERK1/2-MLCK axis upon blood-milk barrier damage. J Cell Biochem 119: 9028–9041, 2018. doi: 10.1002/jcb.27160. [DOI] [PubMed] [Google Scholar]
- 35. Bruchard M, Rebé C, Derangère V, Togbé D, Ryffel B, Boidot R, Humblin E, Hamman A, Chalmin F, Berger H, Chevriaux A, Limagne E, Apetoh L, Végran F, Ghiringhelli F. The receptor NLRP3 is a transcriptional regulator of TH2 differentiation. Nat Immunol 16: 859–870, 2015. doi: 10.1038/ni.3202. [DOI] [PubMed] [Google Scholar]
- 36. Cohen SS, Min M, Cummings EE, Chen X, Sadowska GB, Sharma S, Stonestreet BS. Effects of interleukin-6 on the expression of tight junction proteins in isolated cerebral microvessels from yearling and adult sheep. Neuroimmunomodulation 20: 264–273, 2013. doi: 10.1159/000350470. [DOI] [PMC free article] [PubMed] [Google Scholar]
- 37. Al-Sadi R, Ye D, Boivin M, Guo S, Hashimi M, Ereifej L, Ma TY. Interleukin-6 modulation of intestinal epithelial tight junction permeability is mediated by JNK pathway activation of claudin-2 gene. PLoS One 9: e85345, 2014. doi: 10.1371/journal.pone.0085345. [DOI] [PMC free article] [PubMed] [Google Scholar]
- 38. Hughes FM, Sexton SJ, Ledig PD, Yun CE, Jin H, Purves JT Jr.. Bladder decompensation and reduction in nerve density in a rat model of chronic bladder outlet obstruction are attenuated with the NLRP3 inhibitor glyburide. Am J Physiol Renal Physiol 316: F113–F120, 2019. doi: 10.1152/ajprenal.00400.2018. [DOI] [PMC free article] [PubMed] [Google Scholar]
- 39. Haldar S, Dru C, Choudhury D, Mishra R, Fernandez A, Biondi S, Liu Z, Shimada K, Arditi M, Bhowmick NA. Inflammation and pyroptosis mediate muscle expansion in an interleukin-1β (IL-1β)-dependent manner. J Biol Chem 290: 6574–6583, 2015. doi: 10.1074/jbc.M114.617886. [DOI] [PMC free article] [PubMed] [Google Scholar]
Associated Data
This section collects any data citations, data availability statements, or supplementary materials included in this article.
Supplementary Materials
Supplemental Figs. S1–S10: https://doi.org/10.6084/m9.figshare.20565333.v1.


