

Abstract
Objectives
Pancreatic ductal adenocarcinoma (PDAC) is an aggressive disease with a poor prognosis. PDAC has poor response to immunotherapy because of its unique tumour microenvironment (TME). In an attempt to stimulate immunologically silent pancreatic cancer, we investigated the role of epigenetic therapy in modulating the TME to improve immunogenicity.
Methods
In vitro human PDAC cell lines MiaPaca2 and S2‐013 were treated with 5μ m 3‐Deazaneplanocin A (DZNep, an EZH2 inhibitor) and 5 μ m 5‐Azacytidine (5‐AZA, a DNMT1 inhibitor). In vivo orthotopic murine tumour models using both murine PAN02 cells and KPC cells inoculated in immunocompetent C56/BL7 mice were treated with anti‐PD‐L1 combined with DZNep and 5‐AZA. Short hairpin knockdown (KD) of EZH2 and DNMT1 in PAN02 cells for the orthotopic murine tumour model was established to validate the drug treatment (DZNep and 5‐AZA). qRT‐PCR and microarray assays were performed for the evaluation of Th1‐attracting chemokines and cancer‐associated antigen induction.
Results
Drug treatments induced significant upregulation of gene expressions of Th1‐attracting chemokines, CXCL9 and CXCL10, and the cancer–testis antigens, NY‐ESO‐1, LAGE and SSX‐4 (P < 0.05). In orthotopic tumour models, inoculation of PAN02 cells or KPC cells demonstrated significant tumour regression with corresponding increased apoptosis and infiltration of cytotoxic T lymphocytes in the combination treatment group. In the orthotopic Pan02‐KD model, the anti‐PD‐L1 treatment also caused significant tumour regression.
Conclusion
We demonstrate that immunotherapy for PDAC can be potentiated with epigenetic therapy by increasing cancer‐associated antigen expression and increased T‐cell trafficking across the immunosuppressive tumour microenvironment via upregulation of the repressed chemokines and increased apoptosis with subsequent tumour regression.
Keywords: checkpoint inhibitors, epigenetic modulation, immunotherapy, pancreatic ductal adenocarcinoma (PDAC)
We demonstrate that immunotherapy for pancreatic ductal adenocarcinoma can be potentiated with epigenetic therapy by increasing cancer‐associated antigen expression and increased T‐cell trafficking across the immunosuppressive tumour microenvironment via upregulation of the repressed chemokines and increased apoptosis with subsequent tumour regression.
Introduction
Pancreatic ductal adenocarcinoma (PDAC) is an aggressive cancer with a poor prognosis despite advances in multimodality therapy. 1 , 2 While there has been an improvement in overall survival with systemic chemotherapy using a combination regimen of FOLFIRINOX or Gemcitabine–Abraxane, 3 , 4 there remains a great need for more durable and yet tolerable treatment strategies. Immunotherapy has demonstrated impressive efficacy with complete durable responses in melanoma and non‐small‐cell lung cancer, 5 , 6 , 7 which raises the question of whether immunotherapy can be applicable for PDAC. However, despite initial high expectations, immunotherapy for pancreatic cancer has been met with dismal response rates. 8 Dense stromal tissue associated with PDAC contributes to this low response rate. A fibrotic immunosuppressive tumour microenvironment may ultimately inhibit cytotoxic T‐cell infiltration into the tumour. 9 , 10 , 11 Because the higher prevalence of tumour‐infiltrating lymphocytes has been associated with improved overall survival and tumour response, 11 strategies to increase T‐cell infiltration are critical to immunotherapy's success.
Recently, epigenetic aberrations have been elucidated in the immunosuppressive tumour microenvironment by inhibiting chemokines responsible for T‐cell infiltration. 11 In cancer cells, aberrant hypermethylation of CpG islands in DNA promoter regions and histone tail modifications often cause silencing of critical genes without a gene mutation present compared with healthy cells. 12 , 13 , 14 As it is known, normal epigenetic modulation is regulated at the histone tail by Polycomb Repressor Complex 2 (PRC2). However, there is an aberrant activity of PRC2 in cancer cells because of the aberrant overexpression of catalyst subunit Enhancer of Zeste Homolog 2 (EZH2). At the gene promoter level, overexpression of DNA Methyltransferase 1 (DNMT1) [13] is the driving protein that aberrantly methylates CpG island DNA promoter regions of various genes to silence them. 14 Recent analyses of pancreatic cancer by molecular subtyping have elucidated morphologically similar pancreatic cancer into several subtypes, predominantly classical, quasi‐mesenchymal, squamous and basal‐like, with variable prognoses of overall survival. 15 , 16 , 17 The transcriptional subtypes are determined by the level of epigenetic dysregulation and silencing of key genetic loci promoting classical pancreatic tumours with better survival outcome. 18 As a result, there has been an attempt to target epigenetic dysregulation in pancreatic cancer with epigenetic therapy. 19 , 20 In particular, accumulating evidence indicates that the migration of T lymphocytes into the tumour microenvironment can be suppressed by epigenetic silencing of attracting chemokines genes such as CXCL 9 and CXCL10. These attracting chemokines further control and modulate immune helper and effector T‐lymphocyte trafficking. 21 , 22 , 23 In contrast, higher infiltration of tumour‐infiltrating lymphocytes in the tumour microenvironment is observed with upregulation of associated chemokine expressions responsible for T‐cell trafficking into the tumour cell niche. 24
Regarding the efficacy of immunotherapy, it is critical for immune cells to recognise the neoantigen targets on cancer cells. 25 , 26 In fact, immunogenicity is most often correlated to the level of somatic mutation rate, that is, the highest response rates of immunotherapy in melanoma and non‐small‐cell adenocarcinoma are connected to high somatic mutation rates from ultraviolet light and cigarette smoke, respectively. 27 , 28 , 29 Although there are somatic mutations associated with smoke exposure in PDAC, 30 most of the gastrointestinal cancers, including pancreatic cancer, are associated with low somatic mutation rates 31 and often considered immunologically silent. While mutated neoantigens may be limited in pancreatic cancer, cancer–testis antigens (CTAs) can serve as potential neoantigen targets because they are expressed aberrantly in cancer cells. CTAs are expressed in testis and placenta but are protected from the immune system because they lack multiple histocompatibility complex (MHC) expression on their cell surfaces. However, the problem is that aberrant hypermethylation at the CpG promoter regions 14 causes minimal levels of expression in most gastrointestinal tumours, 32 allowing evasion of the immune response as a result.
Therefore, we aimed to investigate whether targeting aberrant epigenetic markers with epigenetic therapy in combination with immunotherapy can augment the effect of immunotherapy in PDAC by upregulation of cancer‐associated antigen expression, increasing T‐cell migration into the tumour microenvironment and ultimately causing tumour regression.
Results
Increased PD‐L1 expression in PDAC compared with normal parenchyma
To compare the immunosuppressive tumour microenvironment in PDAC to its surrounding native pancreatic tissue, we surveyed the National Cancer BioInformatics Affymetrix GEO database (https://www.ncbi.nlm.nih.gov/geoprofiles/88170422). For our dataset, a total of 45 patients' PDAC tumour samples were evaluated using a microarray gene expression kit with multiple gene outputs. This dataset was surveyed for the relative gene expression levels of PD‐L1 in PDAC compared with adjacent healthy pancreatic tissue. The patients' PDAC samples were initially analysed for genes expressed in PDAC cells compared with its own adjacent healthy pancreas parenchyma. We wanted to determine whether there was any difference in PD‐L1 expression on the tumour surface compared with the surrounding normal pancreatic parenchyma level. There was a statistically significant increase in PD‐L1 expression in the tumour tissue compared with adjacent normal pancreatic tissue (Supplementary figure 1; P < 0.01). These elevated levels of PD‐L1 expression suggest that PDAC has a predominantly immunosuppressive tumour microenvironment, contributing to a poorly immunogenic histology for immunotherapy. 33
Upregulation of chemokines CXCL9 and CXCL10
Chemokines CXCL9 and CXCL10 are known to be aberrantly methylated and play a critical role in immune trafficking across tumour microenvironments. 23 , 34 Given the epigenetically repressed CXCL9 and CXCL10 as a known barrier for immunotherapy, we demonstrated an upregulation of chemokines CXCL9 and CXCL10 in two human pancreatic adenocarcinoma cell lines, MiaPaca2 and S20‐13, by treatment of combination of 5 μm DZNep and 5 μm 5‐AZA with 10 ng mL−1 IFN‐γ. CXCL9 and CXCL10 were minimally expressed in the control group when treated with IFN‐γ alone and achieved moderate gene expression when cells were treated with either DZNep or 5‐AZA alone. However, the addition of both epigenetic drugs combined provided a significant upregulation of both CXCL9 (relative gene fold 2.3 x 10³ ± 54) and CXCL10 (relative gene fold 1.0 x 10⁵ ± 6.7 x 10³; Figure 1). The combination of inhibiting EZH2 and inhibiting DNMT1 demonstrates a valuable role in using both epigenetic agents to optimise the T‐cell infiltration effect into the tumour microenvironment by a dramatic increase in its respective chemokines.
Figure 1.

Chemokines CXCL9 and CXCL10 are associated with T‐cell trafficking into the tumour microenvironment. In vitro experiments (each performed five times) were performed using human pancreatic adenocarcinoma cell lines MiaPaca2 and S2‐013 with treatments using 5 μm DZNep and/or 5 μm 5‐Aza pulsed with 10 ng mL−1 ‐γ. Using qRT‐PCR, CXCL9 and CXCL10 were measured to determine the relative gene expression. There was an upregulation of chemokines CXCL9 and CXCL10 for the combination group of DZNep, 5‐Aza and ‐γ in human pancreatic cancer cell lines S2‐013 (CXCL9 relative fold change 2.3 x 10² ± 54.4; CXCL10 relative fold change 1.0 x 10⁵ ± 6782) and MiaPaca2 (CXCL 9 relative fold change 1.2 x 10³ ± 411.4; CXCL 10 relative fold change 4.1 x 10⁵ ± 148 961 (P < 0.01). AZA, 5‐AZA; CB, combination of 5‐AZA and DZNepCT, control; DZ, DZNep.
Upregulation of cancer‐associated antigen expression
We demonstrated the upregulation of human cancer–testis antigens that can be recognised by antigen‐presenting cells to affect T‐cells for a cytotoxic response. The expression of cancer‐associated antigen in PDAC is often inhibited by epigenetic silencing of the promoter region for this antigen and therefore evades detection by the circulating immune system. By reversing this tumour cancer‐associated antigen promoter region's epigenetic silencing, its signalling can be regulated to be available for increased tumour lysis. Treatment of the MiaPaca2 cell line with DZNep and/or 5‐AZA for 48 h demonstrated an upregulation of LAGE (relative gene fold 155 ± 41), NY‐ESO‐1 (relative gene fold 203 ± 10) and SSX‐4 (relative gene fold 63 ± 15). Repeat experiments were performed with S2‐013 and demonstrated similar upregulation. The WT1 expression was significantly upregulated (relative fold change 15.9 ± 4.6) compared with the untreated control after treatment with DZNep and 5‐AZA. The cancer‐associated antigen frequency for immune response was increased when combined with the upregulation of cancer–testis antigens as additional targets for T lymphocytes (Figure 2).
Figure 2.

Cancer–testis antigens (CTA) are primarily silent in pancreatic adenocarcinoma. In vitro experiments (each performed five times) using human pancreatic adenocarcinoma cell lines MiaPaca2 and S2‐013, with treatments using 5 μm DZNep and/or 5 μm 5‐Aza pulsed with 10 ng mL−1 ‐γ, were performed. Using qRT‐PCR, NYESO, LAGE and SSX4, relative gene expression was determined. There was an increase in antigen expression after treatment with DZNep and/or DNMT1 for all three antigens, NYESO (relative fold change 251.4 ± 4.1), LAGE (155 ± 41.5) and SSX4 (62.6 ± 15.5) with the treatment of DZNep and 5‐AZA (P < 0.01). WT1 is a known neoantigen for pancreatic adenocarcinoma that serves as a potential target for immune cells but has limited baseline expression. In vitro experiments were performed using a murine pancreatic adenocarcinoma cell line, PAN02, with treatments using 5 μm DZNep and/or 5 μm 5‐Aza and used qRT‐PCR to determine the WT1 relative gene expression. There was an additive effect of DZNep and 5‐AZA combination treatment in the increased WT1 expression (relative fold change 13.2 ± 1.86; P < 0.01) compared with untreated control. AZA, 5‐AZA; CB, combination of 5‐AZA and DZNepCT, control; DZ, DZNep.
Global epigenetic changes with DZNep and 5‐AZA treatment
The microassay showed global epigenetic changes in the MiaPaca2 cell line with DZNep and 5‐AZA treatment in the cluster heat map compared with control (Supplementary figure 2). When the cluster heat map was focussed on chemokines, (Figure 3a), it demonstrated more genes upregulated in addition to CXCL10, including the family of synovial sarcoma X (SSX) breakpoint proteins, including SSX‐4b (26.69 rel. fold), SSX8 (10.25 rel. fold), SSX3(14.24 rel. fold) and SSX5 (33.02 rel. fold) that are associated with humoral and cellular immune responses in various cancers (P < 0.01). CX3Cl1(16.42 fold change) was also upregulated, which is a known chemoattractant for T‐cells and monocytes in a soluble state but serves as a strong adhesion protein for leukocytes to endothelial cells when bound to cells, similar to SERPINB5 (21.61 fold change; P < 0.01). An additional potent chemoattractant, CCL20 (51.71‐fold change), was upregulated. Interestingly, the tumour antigen expression of the GAGE protein family that binds to autologous cytotoxic T lymphocytes undetectable on normal cells was noted; GAGE12H (18.9 rel. fold), GAGE12G (18.9 rel. fold), GAGE12G (18.9 rel. fold), GAGE4 (19.75 rel. fold), GAGE12L (28.01 rel. fold), GAGE1 (11.79 rel. fold) and GAGE2D (9.66 rel. fold; P < 0.01). The cluster heat map was further focussed on tumour antigens. As shown in Figure 3b, autologous cytotoxic T‐lymphocytes recognised GAGE2B (6.09 rel. fold), MAGE2B (4.7 rel. fold), SSX1 (87.6 rel. fold), SSX2 (106.3 rel. fold), SSX2B (78.6 rel. fold), WT1 (7.8 rel. fold) and XAGE1E (6.12 rel. fold) to varying degrees.
Figure 3.

(a) Focussed cluster heat map of chemokines demonstrates upregulation in chemoattractants, migratory adhesion proteins and tumour antigen expression with binding peptides for autologous cytotoxic T lymphocytes. (b) Focussed cluster heat map of tumour antigens.
The combination of epigenetic modulation and immunotherapy suppresses tumour growth
In the orthotopic PDAC models with either PAN02 or KPC inoculation, epigenetic therapy combined with immunotherapy was compared for the efficacy for tumour regression. Compared with the untreated group (UT), treatment with 0.2 mg kg−1 5‐AZA and 2.5 mg kg−1 showed slight tumour regression without statistical significance. However, treatment with 10 mg kg−1 anti‐PD‐L1 monoclonal antibody caused a one‐third decrease in tumour weight with statistical significance (P < 0.05). The combination treatment (0.2 mg kg−1 5‐AZA, 2.5 mg kg−1 DZNep and 10 mg kg−1 anti‐PD‐L1 monoclonal antibody) showed about 50% tumour regression, with statistical significance (P < 0.01). Consistently, the tumour weight/body weight ratio showed a similar trend with the result of tumour weight (Figure 4a). In the orthotopic PDAC model of PAN02 inoculation, a further study was performed to investigate whether the treatment of 5‐AZA and DZNep could upregulate the antigen presentation machinery. In comparison with UT and anti‐PD‐L1 treatment, Western blotting analysis showed significant increases in protein levels of transporter associated with antigen processing (TAP)‐1 and β‐2 microglobulin from both 5‐AZA/DZNep treatment and combination treatment (Figure 4b), indicating that the significant tumour regression by epigenetic modulation and immunotherapy was related to the cancer‐associated antigen‐initiated immune response.
Figure 4.

Orthotropic PDAC models in C56/BL6 mice injected with PAN02 cells or KPC cells. (a) Significantly decreased tumour weights in the mice with either anti‐PD‐L1 treatment or combination treatment compared with the untreated mice. (b) Western blotting analysis of protein levels of TAP‐1 and β‐2 microglobulin from the tumour tissues of orthotopic PDAC model with PAN02 inoculation. β‐2MG: β‐2 microglobulin. *P < 0.05; **P < 0.01. In the PAN02‐orthotropic PDAC model, animal number = 5 in each group. In the KPC‐orthotropic PDAC model, animal number = 6 in each group. This is an unreplicated experiment.
Increased T‐cell lymphocyte infiltration of the tumour microenvironment
As the upregulation of attracting chemokines and cancer‐associated antigen induction (in vitro) and upregulation of antigen presentation machinery genes (in vivo) has been demonstrated, we anticipated a higher level of T‐cell lymphocyte infiltration in the tumour microenvironment in epigenetic therapy combined with immunotherapy. To investigate T‐cell trafficking in the tumour microenvironment, we performed immunohistochemistry on the tumour tissues from the orthotopic PDAC models of PAN02 inoculation. Consistent with the tumour regression in the combination therapy group, there was a corresponding highest CD3 and CD8 T‐cell infiltration in the combination arm's tumour microenvironment compared with the untreated control arm (Figure 5a). The clinical significance of increased T‐cell migration into the tumour microenvironment is the correlated survival improvement seen in patients with resected pancreatic cancer, with the greatest prognosis associated with a higher level of tumour‐infiltrating lymphocytes. 35 , 36 Similarly, we noted a corresponding level of increased apoptosis associated with the tumour microenvironment. There is the level of highest tumour‐infiltrating lymphocytes in the combination arm, as assessed by the TUNEL assay (Figure 5). The increased apoptosis suggests the tumour‐infiltrating lymphocyte‐associated cell death of pancreatic cancer cells. 37
Figure 5.

(a) Representative images of IHC and TUNEL staining. (b–d) indexes of CD3 positive cells, CD8 positive cells and TUNEL‐positive cells. **P < 0.01; ***P < 0.001. This is an unreplicated experiment.
Knockdown model of EZH2 and DNMT1
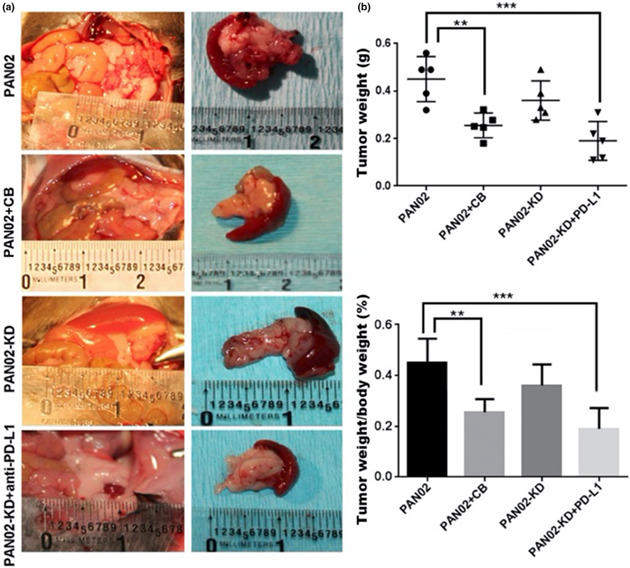
To validate the effect of EZH2 and DNMT1 inhibition in the drug model of DZNEP and 5‐AZA, a cell line of PAN02‐KD was established by a double knockdown of EZH2 and DNMT1 to eliminate the possibility of an off‐target effect. The knockdown of EZH2 and DNMT1 in PAN02 cells was validated by Western blot (Supplementary figure 3). PAN02‐KD‐PDAC model was established in C57/BL6 mice inoculated with 5.0 x 10⁵ PAN02‐KD cells. The PAN02‐KD‐PDAC mice were treated with intraperitoneal injections of murine anti‐PD‐L1 antibodies three times a week for 3 weeks, while the untreated PAN02‐PDAC mice and the PAN02‐PDAC mice with combination therapy were used as controls. Compared with the PAN02‐PDAC without treatment, double knockdown of EZH2 and DNMT1 in PAN02 cells demonstrated a modest reduction in tumour growth in the PAN02‐KD‐PDAC mice. However, the anti‐PD‐L1 treatment to the PAN02‐KD‐PDAC mice demonstrated a statistically significant reduction in tumour growth. Although statistical significance was not reached, their tumour weight was lower than that of the PAN02‐PDAC mice with combination therapy (Figure 6). The growth inhibition in the PAN02‐PDAC mice with anti‐PD‐L1 treatment recapitulated the findings of increased chemokine expression, upregulation of cancer‐associated antigen and antigen presentation machinery, and apoptosis observed in the combination arm using the epigenetic therapy with DZNep, 5‐AZA, and anti‐PD‐L1.
Figure 6.

Orthotropic PDAC models in C56/BL6 mice injected with PAN02‐KD cells generated by short hairpin lentiviral knockdown of EZH2 (shEZH2) and DNMT1 (shDNMT1). (a) Gross anatomy in four groups of orthotropic models on C56/BL6 mice with inoculation of PAN02‐KD cells (untreated and anti‐PD‐L1 treatment) and with inoculation of PAN02‐KD cells (untreated and combination treatment). (b) Tumour weights and ratio of tumour weight/body weight in four groups of orthotropic models on C56/BL6 mice with inoculation of PAN02‐KD cells (untreated and anti‐PD‐L1 treatment) and with inoculation of PAN02‐KD cells (untreated and combination treatment). **P < 0.01. ***P < 0.001. Animal number = 5 in each group. This is an unreplicated experiment.
Increased infiltration of CD4 + IL‐17+ cells in the tumour tissues
The lineages of CD4+ T‐cell subsets include pro‐inflammatory T helper (Th) cells and anti‐inflammatory regulatory T‐cells (Treg). In contrast, naïve CD4+ T‐cells differentiation is under respective Th1, Th2, Th17 and Treg polarising conditions. 38 To understand the impact on the potential T‐cell lineage after epigenetic stimulation of immune response from anti‐PD‐L1 on the surrounding tumour immune microenvironment, we performed an immune fluorescent analysis to detect induction of IL‐17‐producing helper cells (Th17) from naïve CD4 precursor cells. There was a significant increase in the number of CD4+IL‐17+ cells in the tumour tissues from PAN02‐PDAC mice with combination therapy. Knockdown of EZH2 and DNMT1 also contributed to the increase in number of CD4+IL‐17+ cells in the tumour tissues, while the number of CD4+IL‐17+ cells significantly increased when PAN02‐KD‐PDAC mice were treated with anti‐PD‐L1 therapy (Figure 7).
Figure 7.

Dual immunofluorescent staining using anti‐CD4 and anti‐IL‐17A to detect the induction of IL‐17‐producing helper cells (Th17) from naïve CD4 precursor cells in four groups of orthotropic models on C56/BL6 mice with inoculation of PAN02‐KD cells (untreated and anti‐PD‐L1 treatment) and with inoculation of PAN02‐KD cells (untreated and combination treatment). HPF: High power field. Scale bar = 100 μm. CB: combination of 5‐AZA/DZNep and anti‐PD‐L1. *P < 0.05; **P < 0.01. All experiments were repeated three times.
Discussion
There are multiple barriers to immunotherapy for PDAC, including lack of cancer‐associated antigen expression, lack of effector T‐cell trafficking and an immune‐suppressive tumour microenvironment. The role of immunotherapy in pancreatic cancer has been limited thus far and requires additional novel combination strategies to augment the treatment response 39 potentially. In the current study, we strategised to address several known obstacles for immunotherapy in pancreatic cancer modifiable by epigenetic modulation alone, acknowledging that there may be additional barriers yet to be elucidated. Our results show that specific aberrant epigenetic expression, which has been responsible for repressing cancer‐associated antigen expression on the cell surface and suppressing T‐cell trafficking into the tumour microenvironment, can be reversed by downregulation of chemokine genes. Epigenetic therapy with DZNep and 5‐AZA can augment the effect of anti‐PD‐L1 immunotherapy via upregulation of the previously repressed cancer‐associated antigen expression as immune targets towards cytotoxic T‐lymphocyte lineage and increase T‐cell infiltration into the tumour microenvironment to allow cancer‐associated antigen interaction to occur. A high frequency of cancer‐associated antigen expression on the PDAC cell surface is critical for the immune response for effective tumour regression; however, there is currently a limited immune response because of the low somatic mutations that provide foreign‐tumour‐associated antigens in PDAC. 17 , 40
Increased tumour‐infiltrating lymphocyte migration into the tumour microenvironment correlates with improved survival. 37 , 41 In this in vivo study, we demonstrate the increased migration of T lymphocytes into the tumour microenvironment by increasing previously epigenetically silenced chemokine expression, CXCL9 and CXCL10, by epigenetic modulation utilising EZH2 and DNMT1 inhibitors in PDAC. In addition to the canonical JAK‐STAT1 pathway of modulating key immune effectors, IFN‐γ also serves a role in chromatin remodelling to activate poised chromatin‐containing enhancers of immune effector genes. 42 The combination of IFN‐γ with DZNep facilitated the demethylation of the H3K27me3 on promotors of CXCL9 and CXCL10 that has been previously demonstrated. While IFN‐γ alone can decrease H3K27me3 methylation partially, the combination of DZNep provided a synergistic upregulation of CXCL9/10. 42 To further validate the epigenetic drug treatment model's specificity, we performed specific gene knockdown of the epigenetic targets EZH2 (shEZH2) and DNMT1 (shDNMT1) and demonstrated potentiation of tumour regression by anti‐PD‐L1 after shEZH2 and shDNMT1. Thus, we demonstrated that the epigenetic modulation combined with the checkpoint inhibitor enhances immune response as a result of an increase in T‐cell infiltration. This combination therapy can overcome the immunosuppressive microenvironment, thereby causing enhanced tumour regression in comparison with either immunotherapy or epigenetic therapy alone. Our finding has significant clinical relevance, as the combination of increased cancer‐associated antigen frequency and T‐cell infiltration in PDAC has been associated with prolonged survival among patients. 40
The potential use of epigenetic modulation of immunotherapy for pancreatic cancer patients does not exclude chemotherapy and radiation. Instead, it presents a potential multimodality combination: neoadjuvant chemoradiation using immunotherapy for patients with locally advanced pancreatic cancer, recurrent disease and/or metastatic setting. With a greater understanding of molecular subtypes of pancreatic cancer emerging, greater therapeutic specificity in selecting various agents with the underlying epigenetic driver of individual subtypes may be warranted. The recent Compass Trial was able to stratify patients by classical versus more chemotherapy‐resistant basal‐like subtype by the magnitude of GATA6 expression. 43 Epigenetic therapy has the potential to restore the biomarkers of poor therapeutic responses of basal‐like subtypes and subsequently improve response and survival. 18 Furthermore, there are potential benefits from the immunogenic impact of chemotherapy and radiation in creating damage‐associated molecular patterns from its treatment (cancer‐associated antigens) that can further potentiate the effect of immunotherapy by increasing MHC complex and lower Treg/TIL ratio. 39 In addition to T‐cell infiltration in the tumour microenvironment, T‐cell lineage is impacted by the change in signalling from naïve CD4 to Th17 cell induction by stimulation of RORy‐T signalling. 44 Th17 helps facilitate cytokine release and facilitates a pro‐inflammatory cascade that is potentially beneficial for converting immune silent tumour microenvironment to immunotherapy.
There are several limitations to our study. First, the PDAC model was established in mice with a standard murine immune system rather than a transgenic model with a humanised T‐cell repertoire that could have closer human model implications. Second, we acknowledge there are additional neoantigen targets that have not been elucidated in this study that could be further evaluated for possible target in the future. However, despite these limitations, we demonstrated that immunotherapy can be augmented by epigenetic modulation for a known immunosilent tumour. Our experiments utilised four different pancreatic cell lines for both in vitro and in vivo studies with similar reproducible results. In addition to using the immunocompetent models with inoculation of PAN02 cells and KPC cells to test the epigenetic and immunotherapy drugs, we further performed appropriate knockdown models of EZH2 and DNMT1 in PAN02 model to confirm their role in immunomodulation for PDAC by activating expression of previously repressed immune activating gene targets.
In conclusion, we demonstrated that immunotherapy for PDAC can be potentiated with epigenetic therapy by increasing cancer‐associated antigen expression and increased T‐cell trafficking across the immunosuppressive tumour microenvironment via upregulation of the repressed chemokines and increased apoptosis with subsequent tumour regression. Clinical trials of multimodality treatment for patients with locally advanced, recurrent and/or metastatic pancreatic cancer may be warranted.
Methods
Cell lines and drug treatments
Human pancreatic adenocarcinoma cell lines S2‐013, MiaPaca‐2 and murine PAN02 were obtained from the National Cancer Institute‐Division of Cancer Treatment and Diagnosis (NCI‐DCTD) Tumour Repository. KPC (Pdx1‐Cre, LsL‐KrasG12D/+) cell line 45 was obtained Ximbio (Item No. 153474). The Cell culture supplies included in RPMI‐1640 medium (ATCC 30–2001), Dulbecco's Modified Eagle's Medium (DMEM) (Corning Cellgro), Fetal Bovine Serum (FBS) (Sigma‐Aldrich, MO, USA) and Penicillin/Streptomycin (Pen/Strep) (Corning Cellgro). NCI‐DCTD provided validation of the cell lines upon purchase. 5‐azacytidine (5‐AZA) was obtained from Cayman Chemicals (Item No. 11164), 3‐Deazaneplanocin A (DZNep) from Sigma‐Aldrich (Item No. SML0305), INF‐gamma from Millipore (Item No. IF002) and murine anti‐PD‐L1 were obtained from BioXcell (Item No. BE0101). Anti‐TAP‐1 antibody was obtained from Proteintech (11114‐1‐AP). Anti‐microglobulin antibody (ab218230), anti‐IL‐17 antibody (ab79056), anti‐CD3 antibody [SP7] (ab16669), anti‐CD8 α antibody [EPR21769] (ab217344) and Donkey Anti‐Rabbit IgG H&L (Alexa Fluor® 594) (ab150064) were purchased from Abcam. Anti‐HLA‐A antibody (303358) was purchased from US Biological life science. Anti‐CD4 (FITC Conjugate) (96127) was purchased from Cell Signaling Technology.
Cell culture and treatments
S2013, MiaPaca‐2 and KPC cells were cultured in DMEM with 10% FBS and Pen/Strep in a 5% CO2 incubator at 37°C. PAN02 cells were maintained in RPMI 1640 supplemented with 10% FBS and 2 mmol L−1 L‐Glutamine. For the in vitro study, S2013 and MiaPaca‐2 cells were seeded in a 6‐well plate at a density of 1 × 10⁵ cells. When 80% confluence was reached, the cells were washed with PBS and treated with the culture media with or without 5 μm of 5‐AZA and/or 5 μm DZNep with/without 10 ng mL−1 IFN‐γ. The doses of 5‐AZA and DZNep have been previously utilised in the literature, effectively inhibiting DNMT1 and EZH2, respectively. 46 , 47 The cells were treated for 48 h, washed with PBS and harvested for RT‐PCR analysis. All the in vitro experiments were repeated at least three times.
Generation of stable cells expressing shRNA constructs
We used a commercially available fourth‐generation lentivirus packing system (Lenti‐X, Takara‐Clontech; Item No. 631278) for generating stable cell lines. Briefly, blasticidin‐resistant shDNMT1 (Vectorbuilder, CA, USA) and puromycin‐resistant shEZH2 (Sigma‐Aldrich) vectors were obtained, amplified and purified for packing. For generating lentivirus, Lenti‐X reagent was mixed with 6 μg of shRNA plasmid and transfected in a 293 T‐cell line for packing. Harvested lentivirus was used to transduce PAN02 cells to knockdown (KD) both EZH2 and DNMT1 using polybrene with established protocol. PAN02‐KD cell line was established by transducing with shRNA targeting EZH2 (shEZH2), DNMT1 (shDNMT1) or both sham sequences (shControl; Sigma‐Aldrich) according to the manufacturer instructions. Cell lines were selected with puromycin (Sigma‐Aldrich) and expanded after confirmation of knockdown by qRT‐PCR and immunoblot.
In vivo experiments
Eight‐week‐old male C57/BL6 mice (Jackson Laboratories, Bar Harbor, ME, USA) were housed four per cage, given rodent chow and tap water and maintained at 22°C and on a 12‐h light/dark cycle. To establish orthotopic PDAC models, a 1.5‐cm midline laparotomy incision was made under anaesthesia. PAN02/KPC/PAN02‐KD cells were injected at a concentration of 1 x 10⁵ cells/injection into the pancreas. The abdominal wall was closed in two layers using a 5–0 Vicryl suture (Ethicon, Incorporated, New Brunswick, NJ, USA). For the PAN02/KPC inoculation (Table 1), the mice were randomly assigned into four treatment groups: (1) saline; (2) drugs alone (0.2 mg kg−1 5‐AZA, 2.5 mg kg−1 DZNep); (3) anti‐PD‐L1 alone (10 mg kg−1 anti‐PD‐L1 monoclonal antibody) and (4) combination (0.2 mg kg−1 5‐AZA, 2.5 mg kg−1 DZNep, 10 mg kg−1 anti‐PD‐L1 monoclonal antibody). An equal amount of 250 μL solution for treatment via intraperitoneal injection was performed every Monday, Wednesday and Friday for 3 weeks. For the PAN02‐KD inoculation (Table 1), the mice were randomly assigned to receive either saline or anti‐PD‐L1 alone (10 mg kg−1 anti‐PD‐L1 monoclonal antibody) via 250 μL solution i.p. every Monday, Wednesday and Friday for 3 weeks, while the PAN02 inoculated mice with the treatment of saline and anti‐PD‐L1 were used as controls. For all mice with tumour inoculation, tumour growth was monitored weekly by ultrasound with a small linear probe array. 48 , 49 After a 3‐week treatment, the mice were observed for an additional 3 weeks for a total of 6 weeks in duration. They were euthanised, tumours excised, weighed and processed for histology and immunohistochemistry (IHC). The proposal for animal models was approved by the Institutional Animal Care and Use Committee (IACUC) of the University of Louisville. An IACUC number was obtained by IACUC prior to beginning any work with live animals.
Table 1.
Treatment in three models by grouping
| Model | Group | Number |
|---|---|---|
| PAN02 cell inoculation | Saline (untreated) | 10 |
| DZNep+5‐AZA | 5 | |
| anti‐PD‐L1 | 5 | |
| DZNep+5‐AZA + anti‐PD‐L1 | 10 | |
| KPC cell inoculation | Saline (untreated) | 6 |
| DZNep+5‐AZA | 6 | |
| anti‐PD‐L1 | 6 | |
| DZNep+5‐AZA + anti‐PD‐L1 | 6 | |
| PAN02‐KD cell inoculation | Saline (untreated) | 5 |
| DZNep+5‐AZA + anti‐PD‐L1 | 5 |
RNA isolation, real‐time quantitative reverse transcription PCR
RNA isolation was performed using a commercially available kit (Qiagen RNEasy kit, Qiagen, Japan) per the manufacturer instructions. RNA levels were quantified using NanoDrop (Thermo Fisher Scientific), and 1 μg RNA was used to prepare cDNA using a commercially available kit (qScript, Quanta Biosciences). The qRT‐PCR was performed using TaqMan primers CXCL9 (Item No. NM_002416), CXCL10 (Item No. NM_001565; Sigma‐Aldrich) to analyse chemokine response after treatment with 10 ng mL−1 IFN‐ γ with or without 5‐AZA and DZNep. Cancer–testis antigen expression was analysed for LAGE (Item No. NM_020994), SSX‐4 (Item No. NM_005636), NY‐ESO‐1 (Item No. NM_001327) and WT1 (Item No. NM_000378) using TaqMan primers per the manufacturer's instructions.
Microarray
Tumour samples were obtained for MiaPaca cells treated with a combination 5‐AZA and DZNep in vitro according to the cell culture assay methods described above. The treatment group, as well as the controls, was tested in triplicate. The samples were stored at −80°C until used in treatments. Total RNA from each sample was quantified using NanoDrop ND‐100. Clarion S assay was used to perform a microarray analysis of global genetic changes by comparing the four experimental groups.
Western blot
The protein levels for the biomarkers were semiquantified by Western blot analysis as described previously. Electrophoresis was performed on 12% SDS‐PAGE gel, and the proteins were transformed into nitrocellulose membrane. The membranes were incubated with the primary antibodies (Anti‐TAP‐1 antibody; anti‐β‐2 microglobulin antibody; and anti‐HLA‐A antibody) overnight at 4°C and with secondary antibody for 1 h at room temperature. The antigen–antibody complexes were then visualised using an ECL kit (Amersham, Piscataway, NJ, USA). The protein bands were quantified by densitometry analysis.
Immunohistochemistry and immunofluorescent staining
Immunohistochemistry (IHC) staining was performed on 20‐μm, paraffin‐embedded sections of the specimen using DAKO EnVision+ System Kit (DAKO EnVision+ System, HRP, Carpinteria, CA, USA) as previously reported. 50 In brief, sections were de‐paraffinised and hydrated, and antibodies of CD‐3 and CD88 were applied and incubated with labelled polymer for 30 min at room temperature. The substrate‐chromogen solution (diaminobenzidine) was added as a visualisation reagent; 0.25% bovine serum albumin in phosphate‐buffered saline without antibody was used as a negative control. Immunofluorescent staining was performed for the tumour tissues of the orthotopic PDAC mouse models. In brief, the OCT‐embedded frozen tissue sections were used for immunofluorescent analysis. The slides of tissues were fixed in 1:1 acetone/methanol for 10 min. After washing with PBS, then incubated with the antibodies of CD4 (RM4‐5, mAb, FITC Conjugate, #96127, Cell Signaling; 1:100 dilution) and IL‐17A (ab79056, Abcam) (1:100 dilution) at room temperature for 2 h. After washing with PBS, the tissues were incubated with donkey Anti‐Rabbit IgG H&L (Alexa Fluor® 594, ab150064, Abcam) (1:200 dilution) at room temperature for 2 h. DAPI staining was performed as counterstaining, and images were captured using an Olympus IX51‐DP72 image system (Olympus, Pittsburgh, PA, USA). Digital images were acquired with the Olympus 1×51 microscope (Olympus) at 20× magnification using the Olympus DP72 digital camera. Computer image analysis of staining intensity was performed via the cellSense Dimension imaging system (Olympus Life Science, Tokyo, Japan).
Terminal deoxynucleotidyl transferase‐mediated dUTP nick end labelling (TUNEL) assay
TUNEL staining was performed using an ApopTag Peroxidase In Situ Apoptosis Detection Kit (Chemicon, Billerica, CA, USA). After de‐paraffin and hydration, the sections were treated with proteinase K (20 mg L−1) for 15 min and then incubated with terminal deoxynucleotidyl transferase (TdT) and digoxigenin‐11‐dUTP for 1 h at 37°C. Anti‐digoxigenin antibody conjugated with horseradish peroxidase (HRP) along with the substrate (DAB‐H2O2) was used for visualisation. Apoptotic cell death was quantitatively analysed by counting the TUNEL‐positive cells in 10 fields for each section at 20× magnification. The apoptotic index was presented as TUNEL‐positive cells per 100 cells.
Statistical analysis
SEM is indicated by bars on all figures and was calculated using Microsoft Office Excel 2018. All experiments were done with a minimum of triplicate samples, and P‐values were calculated with 2‐tailed t‐tests unless otherwise indicated.
Funding
No outside funding was received for these studies or the resulting article.
Conflict of interest
The authors declare no conflict of interest.
Author contributions
Young Hong, Yan Li and Robert Martin conceived and designed the study. Material preparation, data collection and analysis were performed by Young Hong. Harshul Pandit worked on the gene knockdown of EZH2 and DNMT1 in PAN02 cells. Young Hong and Zachary Pulliam worked on cell culture and treatment. Xingtong Wang, Youxi Yu, Yujia Chen, Min Tan and Qianqian Zheng worked on the animal model, IHC and Western blot. Andrew Lin, Jeremy Badach and Ping Zhang worked on microarray and data analysis. The first draft of the manuscript was written by Young Hong, Yan Li and Neal Bhutiani, and all authors commented on versions of the manuscript. All authors read and approved the final manuscript.
Supporting information
Supplementary figures 1‐3
Data Availability Statement
The data that support the findings of this study are available on request from the corresponding author. The data are not publicly available due to privacy or ethical restrictions.
References
- 1. Ferlay J, Colombet M, Soerjomataram I et al. Cancer statistics for the year 2020: an overview. Int J Cancer 2021; 149: 778–789. [DOI] [PubMed] [Google Scholar]
- 2. MacCurtain BM, Quirke NP, Thorpe SD, Gallagher TK. Pancreatic ductal adenocarcinoma: relating biomechanics and prognosis. J Clin Med 2021; 10: 2711. [DOI] [PMC free article] [PubMed] [Google Scholar]
- 3. Brown ZJ, Cloyd JM. Trends in the utilization of neoadjuvant therapy for pancreatic ductal adenocarcinoma. J Surg Oncol 2021; 123: 1432–1440. [DOI] [PubMed] [Google Scholar]
- 4. Chapman BC, Gleisner A, Rigg D et al. Perioperative and survival outcomes following neoadjuvant FOLFIRINOX versus gemcitabine Abraxane in patients with pancreatic adenocarcinoma. JOP 2018; 19: 75–85. [PMC free article] [PubMed] [Google Scholar]
- 5. Voelker R. Reducing lung cancer progression with immunotherapy. JAMA 2018; 319: 1314. [DOI] [PubMed] [Google Scholar]
- 6. Wolchok JD, Chiarion‐Sileni V, Gonzalez R et al. Overall survival with combined nivolumab and ipilimumab in advanced melanoma. N Engl J Med 2017; 377: 1345–1356. [DOI] [PMC free article] [PubMed] [Google Scholar]
- 7. Long GV, Weber JS, Larkin J et al. Nivolumab for patients with advanced melanoma treated beyond progression: analysis of 2 phase 3 clinical trials. JAMA Oncol 2017; 3: 1511–1519. [DOI] [PMC free article] [PubMed] [Google Scholar]
- 8. Sahin IH, Askan G, Hu ZI, O'Reilly EM. Immunotherapy in pancreatic ductal adenocarcinoma: an emerging entity? Ann Oncol 2017; 28: 2950–2961. [DOI] [PMC free article] [PubMed] [Google Scholar]
- 9. Du W, Pasca di Magliano M, Zhang Y. Therapeutic potential of targeting stromal crosstalk‐mediated immune suppression in pancreatic cancer. Front Oncol 2021; 11: 682217. [DOI] [PMC free article] [PubMed] [Google Scholar]
- 10. Chen Y, Kim J, Yang S et al. Type I collagen deletion in αSMA+ myofibroblasts augments immune suppression and accelerates progression of pancreatic cancer. Cancer Cell 2021; 39: 548–565 e546. [DOI] [PMC free article] [PubMed] [Google Scholar]
- 11. Diana A, Wang LM, D'Costa Z et al. Prognostic role and correlation of CA9, CD31, CD68 and CD20 with the desmoplastic stroma in pancreatic ductal adenocarcinoma. Oncotarget 2016; 7: 72819–72832. [DOI] [PMC free article] [PubMed] [Google Scholar]
- 12. Samulitis BK, Pond KW, Pond E et al. Gemcitabine resistant pancreatic cancer cell lines acquire an invasive phenotype with collateral hypersensitivity to histone deacetylase inhibitors. Cancer Biol Ther 2015; 16: 43–51. [DOI] [PMC free article] [PubMed] [Google Scholar]
- 13. Jiao F, Hu H, Yuan C et al. Histone deacetylase 3 promotes pancreatic cancer cell proliferation, invasion and increases drug‐resistance through histone modification of P27, P53 and Bax. Int J Oncol 2014; 45: 1523–1530. [DOI] [PubMed] [Google Scholar]
- 14. Berdasco M, Esteller M. Aberrant epigenetic landscape in cancer: how cellular identity goes awry. Dev Cell 2010; 19: 698–711. [DOI] [PubMed] [Google Scholar]
- 15. Moffitt RA, Marayati R, Flate EL et al. Virtual microdissection identifies distinct tumor‐ and stroma‐specific subtypes of pancreatic ductal adenocarcinoma. Nat Genet 2015; 47: 1168–1178. [DOI] [PMC free article] [PubMed] [Google Scholar]
- 16. Albertini JJ, Lyman GH, Cox C et al. Lymphatic mapping and sentinel node biopsy in the patient with breast cancer. JAMA 1996; 276: 1818–1822. [PubMed] [Google Scholar]
- 17. Bailey P, Chang DK, Forget MA et al. Exploiting the neoantigen landscape for immunotherapy of pancreatic ductal adenocarcinoma. Sci Rep 2016; 6: 35848. [DOI] [PMC free article] [PubMed] [Google Scholar]
- 18. Eyres M, Lanfredini S, Xu H et al. TET2 drives 5hmc marking of GATA6 and epigenetically defines pancreatic ductal adenocarcinoma transcriptional subtypes. Gastroenterology 2021; 161: 653–668 e616. [DOI] [PubMed] [Google Scholar]
- 19. Han T, Zhuo M, Hu H, Jiao F, Wang LW. Synergistic effects of the combination of 5‐AzaCdR and suberoylanilide hydroxamic acid on the anticancer property of pancreatic cancer. Oncol Rep 2018; 39: 264–270. [DOI] [PubMed] [Google Scholar]
- 20. Susanto JM, Colvin EK, Pinese M et al. The epigenetic agents suberoylanilide hydroxamic acid and 5AZA2' deoxycytidine decrease cell proliferation, induce cell death and delay the growth of MiaPaCa2 pancreatic cancer cells in vivo . Int J Oncol 2015; 46: 2223–2230. [DOI] [PubMed] [Google Scholar]
- 21. Wierda RJ, van den Elsen PJ. Genetic and epigenetic regulation of CCR5 transcription. Biology (Basel) 2012; 1: 869–879. [DOI] [PMC free article] [PubMed] [Google Scholar]
- 22. Nancy P, Tagliani E, Tay CS, Asp P, Levy DE, Erlebacher A. Chemokine gene silencing in decidual stromal cells limits T cell access to the maternal‐fetal interface. Science 2012; 336: 1317–1321. [DOI] [PMC free article] [PubMed] [Google Scholar]
- 23. Peng D, Kryczek I, Nagarsheth N et al. Epigenetic silencing of TH1‐type chemokines shapes tumour immunity and immunotherapy. Nature 2015; 527: 249–253. [DOI] [PMC free article] [PubMed] [Google Scholar]
- 24. Aires DJ, Yoshida M, Richardson SK et al. T‐cell trafficking plays an essential role in tumor immunity. Lab Invest 2019; 99: 85–92. [DOI] [PMC free article] [PubMed] [Google Scholar]
- 25. Wang Y, Shi T, Song X, Liu B, Wei J. Gene fusion neoantigens: emerging targets for cancer immunotherapy. Cancer Lett 2021; 506: 45–54. [DOI] [PubMed] [Google Scholar]
- 26. Schumacher TN, Schreiber RD. Neoantigens in cancer immunotherapy. Science 2015; 348: 69–74. [DOI] [PubMed] [Google Scholar]
- 27. Mar VJ, Wong SQ, Li J et al. BRAF/NRAS wild‐type melanomas have a high mutation load correlating with histologic and molecular signatures of UV damage. Clin Cancer Res 2013; 19: 4589–4598. [DOI] [PubMed] [Google Scholar]
- 28. Hodis E, Watson IR, Kryukov GV et al. A landscape of driver mutations in melanoma. Cell 2012; 150: 251–263. [DOI] [PMC free article] [PubMed] [Google Scholar]
- 29. Yang D, Han X, Li D et al. Molecular diagnosis and clinical outcome of a lung cancer patient with TP53‐E285K mutated Li‐Fraumeni syndrome harboring a somatic EGFR‐KDD mutation. Am J Transl Res 2020; 12: 6689–6693. [PMC free article] [PubMed] [Google Scholar]
- 30. Blackford A, Parmigiani G, Kensler TW et al. Genetic mutations associated with cigarette smoking in pancreatic cancer. Cancer Res 2009; 69: 3681–3688. [DOI] [PMC free article] [PubMed] [Google Scholar]
- 31. Lawrence MS, Stojanov P, Polak P et al. Mutational heterogeneity in cancer and the search for new cancer‐associated genes. Nature 2013; 499: 214–218. [DOI] [PMC free article] [PubMed] [Google Scholar]
- 32. Park TS, Groh EM, Patel K, Kerkar SP, Lee CC, Rosenberg SA. Expression of MAGE‐A and NY‐ESO‐1 in primary and metastatic cancers. J Immunother 2016; 39: 1–7. [DOI] [PMC free article] [PubMed] [Google Scholar]
- 33. Foucher ED, Ghigo C, Chouaib S, Galon J, Iovanna J, Olive D. Pancreatic ductal adenocarcinoma: a strong imbalance of good and bad immunological cops in the tumor microenvironment. Front Immunol 2018; 9: 1044. [DOI] [PMC free article] [PubMed] [Google Scholar]
- 34. Yasmin R, Siraj S, Hassan A, Khan AR, Abbasi R, Ahmad N. Epigenetic regulation of inflammatory cytokines and associated genes in human malignancies. Mediators Inflamm 2015; 2015: 201703. [DOI] [PMC free article] [PubMed] [Google Scholar]
- 35. Tahkola K, Mecklin JP, Wirta EV et al. High immune cell score predicts improved survival in pancreatic cancer. Virchows Arch 2018; 472: 653–665. [DOI] [PubMed] [Google Scholar]
- 36. Diana A, Wang LM, D'Costa Z et al. Prognostic value, localization and correlation of PD‐1/PD‐L1, CD8 and FOXP3 with the desmoplastic stroma in pancreatic ductal adenocarcinoma. Oncotarget 2016; 7: 40992–41004. [DOI] [PMC free article] [PubMed] [Google Scholar]
- 37. Lianyuan T, Dianrong X, Chunhui Y, Zhaolai M, Bin J. The predictive value and role of stromal tumor‐infiltrating lymphocytes in pancreatic ductal adenocarcinoma (PDAC). Cancer Biol Ther 2018; 19: 296–305. [DOI] [PMC free article] [PubMed] [Google Scholar]
- 38. Wang J, Niu X, Wu C, Wu D. Naringenin modifies the development of lineage‐specific effector CD4+ T cells. Front Immunol 2018; 9: 2267. [DOI] [PMC free article] [PubMed] [Google Scholar]
- 39. Murakami T, Homma Y, Matsuyama R et al. Neoadjuvant chemoradiotherapy of pancreatic cancer induces a favorable immunogenic tumor microenvironment associated with increased major histocompatibility complex class I‐related chain a/B expression. J Surg Oncol 2017; 116: 416–426. [DOI] [PubMed] [Google Scholar]
- 40. Balachandran VP, Luksza M, Zhao JN et al. Identification of unique neoantigen qualities in long‐term survivors of pancreatic cancer. Nature 2017; 551: 512–516. [DOI] [PMC free article] [PubMed] [Google Scholar]
- 41. Nejati R, Goldstein JB, Halperin DM et al. Prognostic significance of tumor‐infiltrating lymphocytes in patients with pancreatic ductal adenocarcinoma treated with neoadjuvant chemotherapy. Pancreas 2017; 46: 1180–1187. [DOI] [PMC free article] [PubMed] [Google Scholar]
- 42. Ivashkiv LB. IFNγ: signalling, epigenetics and roles in immunity, metabolism, disease and cancer immunotherapy. Nat Rev Immunol 2018; 18: 545–558. [DOI] [PMC free article] [PubMed] [Google Scholar]
- 43. O'Kane GM, Grunwald BT, Jang GH et al. GATA6 expression distinguishes classical and basal‐like subtypes in advanced pancreatic cancer. Clin Cancer Res 2020; 26: 4901–4910. [DOI] [PubMed] [Google Scholar]
- 44. Ivanov II, McKenzie BS, Zhou L et al. The orphan nuclear receptor RORγt directs the differentiation program of proinflammatory IL‐17+ T helper cells. Cell 2006; 126: 1121–1133. [DOI] [PubMed] [Google Scholar]
- 45. Hingorani SR, Wang L, Multani AS et al. Trp53R172H and KrasG12D cooperate to promote chromosomal instability and widely metastatic pancreatic ductal adenocarcinoma in mice. Cancer Cell 2005; 7: 469–483. [DOI] [PubMed] [Google Scholar]
- 46. Landman S, Cruijsen M, Urbano PCM et al. DNA methyltransferase inhibition promotes Th1 polarization in human CD4+ CD25high FOXP3+ regulatory T cells but does not affect their suppressive capacity. J Immunol Res 2018; 2018: 4973964–4973913. [DOI] [PMC free article] [PubMed] [Google Scholar]
- 47. Kemp CD, Rao M, Xi S et al. Polycomb repressor complex‐2 is a novel target for mesothelioma therapy. Clin Cancer Res 2012; 18: 77–90. [DOI] [PMC free article] [PubMed] [Google Scholar]
- 48. Pandit H, Tinney JP, Li Y et al. Utilizing contrast‐enhanced ultrasound imaging for evaluating fatty liver disease progression in pre‐clinical mouse models. Ultrasound Med Biol 2019; 45: 549–557. [DOI] [PubMed] [Google Scholar]
- 49. Cui G, Martin RC, Liu X et al. Serological biomarkers associate ultrasound characteristics of steatohepatitis in mice with liver cancer. Nutr Metab (Lond) 2018; 15: 71. [DOI] [PMC free article] [PubMed] [Google Scholar]
- 50. Zheng Q, Martin RC, Shi X et al. Lack of FGF21 promotes NASH‐HCC transition via hepatocyte‐TLR4‐IL‐17A signaling. Theranostics 2020; 10: 9923–9936. [DOI] [PMC free article] [PubMed] [Google Scholar]
Associated Data
This section collects any data citations, data availability statements, or supplementary materials included in this article.
Supplementary Materials
Supplementary figures 1‐3
Data Availability Statement
The data that support the findings of this study are available on request from the corresponding author. The data are not publicly available due to privacy or ethical restrictions.