Abstract
Comparative genomic analysis was performed on eight species of lactic acid bacteria (LAB)—Lactococcus (L.) lactis, Lactobacillus (Lb.) plantarum, Lb. casei, Lb. brevis, Leuconostoc (Leu.) mesenteroides, Lb. fermentum, Lb. buchneri, and Lb. curvatus—to assess their glutamic acid production pathways. Glutamic acid is important for umami taste in foods. The only genes for glutamic acid production identified in the eight LAB were for conversion from glutamine in L. lactis and Leu. mesenteroides, and from glucose via citrate in L. lactis. Thus, L. lactis was considered to be potentially the best of the species for glutamic acid production. By biochemical analyses, L. lactis HY7803 was selected for glutamic acid production from among 17 L. lactis strains. Strain HY7803 produced 83.16 pmol/μl glutamic acid from glucose, and exogenous supplementation of citrate increased this to 108.42 pmol/μl. Including glutamic acid, strain HY7803 produced more of 10 free amino acids than L. lactis reference strains IL1403 and ATCC 7962 in the presence of exogenous citrate. The differences in the amino acid profiles of the strains were illuminated by principal component analysis. Our results indicate that L. lactis HY7803 may be a good starter strain for glutamic acid production.
Keywords: Lactic acid bacteria, Lactococcus lactis, comparative genome, glutamic acid
Introduction
The flavor of food influences dietary selection and intake. Flavor compounds occur naturally, or are produced during food processing such as cooking or fermentation. Taste is classified into five types based on different taste receptors: sweet, bitter, sour, salty, and umami. Umami is an essential savory taste, contributed by free glutamic acid. The formation of glutamic acid during fermentation, curing, and ripening enhances the umami in foods. Free glutamic acid exists in various foodstuffs and glutamic acid occurs in proteins. The average glutamic acid content of casein in milk, gluten in wheat, glycinin in soybean, and myosin in muscle is 21%–35% [1, 2]. Although glutamic acid in proteins does not contribute umami taste, proteins can be hydrolyzed by proteolytic activity during fermentation and produce high levels of free glutamic acid, which is stable [1].
Lactic acid bacteria (LAB) are involved in fermentation of various foods, such as cheese, sauerkraut, soybean, and wine [3], and are used as starter cultures in dairy, meat, and alcohol fermentation [4]. LAB fermentation through carbohydrate breakdown produces lactic acid as the major metabolite [5]. These cultures also contribute to organoleptic properties, such as texture and flavor, and provide essential micronutrients such as minerals and vitamins. LAB undoubtedly benefit carbohydrate fermentation, enhance nutritional value, enhance production of volatile compounds and bacteriocins, and inhibit the growth of pathogenic and contaminating bacteria. However, not much research has been performed into glutamic acid production by LAB compared with the huge number of functional reports on LAB. Some studies have focused on selection of glutamic acid-producing LAB [6]. Tanous et al. proved the existence of the glutamic acid dehydrogenase (gdh) gene in LAB, which is responsible for the production of glutamic acid from α-ketoglutarate and ammonia [7]. However, a comprehensive picture of the cellular components and metabolic pathways involved in glutamic acid production has not been obtained for LAB using comparative genomic analysis. Therefore, in this study, we examined the amino acid synthesis, including glutamic acid, of eight LAB species and performed a comparative genomic analysis to compare the metabolic pathways. Additionally, we selected a glutamic acid-producing strain based on biochemical analyses arising from the comparative genomic analysis.
Materials and Methods
Comparison of Genomes to Assess Glutamic Acid Production
For comparative genomic analyses, genome sequence data for eight LAB strains was obtained from the NCBI database (http://ncbi.nlm.nih.gov/genomes) (Table 1); the eight species were identified when “glutamic acid” and “LAB” were used as keywords to search the NCBI database. For metabolic pathway analysis based on protein coding genes, genome sequences of the eight strains were uploaded to the Rapid Annotations using Subsystems Technology (RAST) server for SEED-based automated annotation, and subjected to whole-genome sequence-based comparative analysis and Kyoto Encyclopedia of Genes and Genomes pathway analysis [8]. The generated metabolic pathways of the strains were verified using the iPath (ver. 3) module [9]. The Efficient Database framework for comparative Genome Analyses using BLAST score Ratios (EDGAR) was used for core genome, pan-genome and singleton analyses [10]. Further comparative analyses were performed for specific regions and genes-of-interest using the BLASTN, BLASTX, and BLASTP tools.
Table 1.
Lactic acid bacteria used for genomic analysis in this study.
| Species | Strain | NCBI Accession No. |
|---|---|---|
| Lactobacillus brevis | ATCC 367 | NC_008497.1 |
| Lactobacillus buchneri | CD034 | NC_018610 |
| Lactobacillus casei | ATCC 393 | NZ_AP012544 |
| Lactobacillus curvatus | MRS6 | NZ_CP022474 |
| Lactobacillus fermentum | IFO 3956 | NC_010610 |
| Lactobacillus plantarum | WCFS1 | NC_004567 |
| Lactococcus lactis | IL1403 | NC_002662 |
| Leuconostoc mesenteroides | ATCC 8293 | NZ_008531.1 |
Bacterial Strains and Cultures
Seventeen Lactococcus (L.) lactis strains from fermented seafood or dairy products were screened to identify glutamic acid-producing strains (Table 2). L. lactis IL1403 (KCTC 3115) [11] and L. lactis ATCC 7962 [12] were used as reference strains. L. lactis strains were cultured in M17 (Difco, USA) broth or agar supplemented with 0.25% glucose at 30°C for 24 h.
Table 2.
Citrate use and glutamate production by Lactococcus lactis isolates.
| Strain | Citrate fermentation | Glutamate concentrationa (ng/μl) | Reference | Origin |
|---|---|---|---|---|
| ATCC 7962 | + | 9.74 | [12] | Control |
| IL1403 | + | 16.91 | [11] | Control |
| KS3075 | + | 5.33 | [19] | Fermented seafood |
| HY7803 | + | 17.31 | This study | Dairy product |
| Y2 | − | 8.66 | This study | Dairy product |
| Y4 | − | 7.04 | This study | Dairy product |
| Y6 | − | 6.91 | This study | Dairy product |
| Y7 | − | 7.16 | This study | Dairy product |
| Y8 | − | 9.35 | This study | Dairy product |
| Y19 | − | 9.38 | This study | Dairy product |
| Y20 | − | 7.92 | This study | Dairy product |
| Y21 | − | 6.81 | This study | Dairy product |
| Y22 | − | 7.12 | This study | Dairy product |
| Y23 | − | 6.51 | This study | Dairy product |
| Y25 | + | 9.19 | This study | Dairy product |
| Y26 | + | 10.40 | This study | Dairy product |
| Y28 | − | 7.56 | This study | Dairy product |
| Y32 | − | 7.37 | This study | Dairy product |
| Y33 | − | 6.98 | This study | Dairy product |
aDetermined using a glutamate assay kit (Sigma-Aldrich).
Screening of Citrate-Using and Glutamic Acid-Producing Strains
Citrate-using strains were detected on Kempler and McKay media [13]. L. lactis strains cultured on M17 agar supplemented with 0.25% glucose were transferred to the Kempler and McKay media using toothpicks and incubated at 30°C for 2 days.
Glutamic Acid Assay
L. lactis strains were grown in M17 broth supplemented with 0.25% glucose at 30°C to OD600 = 0.6. Then culture supernatant was collected, and 50 μl were used for glutamate assay. Glutamic acid-producing strains were detected using a glutamate assay kit (Sigma-Aldrich, USA) according to the manufacturer’s recommendations. The assay was repeated in triplicate.
Analysis of Free Amino Acids Including Analysis of Glutamic Acid Production
L. lactis strain HY7803 from an overnight culture was inoculated into M17 broth containing 0.25% glucose (w/v) and 0.5% citrate (w/v) or 0.5% glutamine (w/v) and was cultured to OD600 = 1.0. As a negative control, strain HY7803 was inoculated into M17 broth containing 0.25% glucose (w/v). Culture (1 ml) was disrupted by an ultrasonic oscillator (VCX 130, Sonics & Materials, Inc., USA) and then supernatant was obtained by centrifugation (14,000 ×g, 1 min, 4°C). Supernatants after sterilization using 0.2-μm syringe filters (Sartorius Stedim Biotech GmbH, Germany) were treated with the AccQ-Fluor Reagent Kit (Waters Corporation, USA) according to the manual. The fluorescent derivatives (10 μl) were used for high-performance liquid chromatography (HPLC). The free amino acid content, including glutamic acid, was calculated using amino acid calibration curves determined at five concentrations with Amino Acid Standard (WAT088122, Waters Corporation). All experiments were conducted three times on two independent samples prepared in the same way.
A JASCO HPLC system (JASCO LC-2000 Plus Series, USA) with a photodiode array detector (detection was at 254 nm in this study), an autosampler (JASCO AS-2055 Plus), and an AccQ-Tag reversed-phase column (4 μm, 150 × 3.9 mm; Waters Corporation) was used for chromatographic separation at 37°C. Eluent A was 10% AccQ-Tag Eluent A Concentrate (Waters Corporation) in water, and eluent B was 60% acetonitrile in water. The gradient elution program began with 100% eluent A at a flow rate of 1 ml/min for the first 9 min, followed by a linear increase to 0%:100% (v/v) eluent A:eluent B for 34 min, and then a decrease to 100%:0% A:B during the next 4 min.
Statistical Analysis
One-way analysis of variance followed by Duncan’s multiple range test was used to evaluate significant differences between the average values obtained in free amino acid analyses. Values of p < 0.05 were considered statistically significant. To visualize the differences between the amino acids produced from sterilized soybeans by the inoculated bacteria, principal component analysis (PCA) was applied with maximum variation rotation. All statistical analysis was performed using the SPSS software package (version 22.0; SPSS, IBM, USA).
Results and Discussion
Genomic Analysis of Glutamic Acid Production by LAB
L. lactis, Lactobacillus (Lb.) plantarum, Lb. casei, Lb. brevis, Lb. fermentum, Lb. buchneri, Lb. curvatus, and Leuconostoc (Leu.) mesenteroides were associated with glutamic acid production in the NCBI search engine. Therefore, published, complete genomes of these species were used for comparative genomic analysis (Table 1).
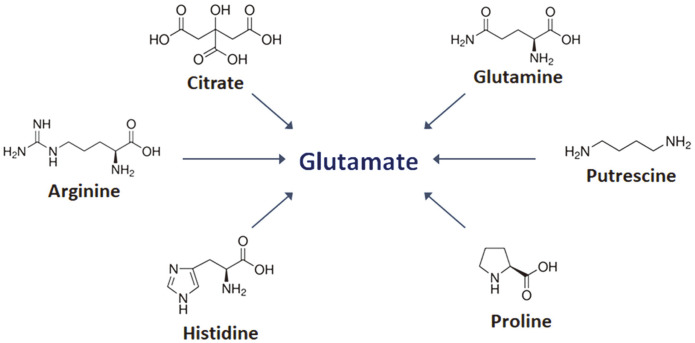
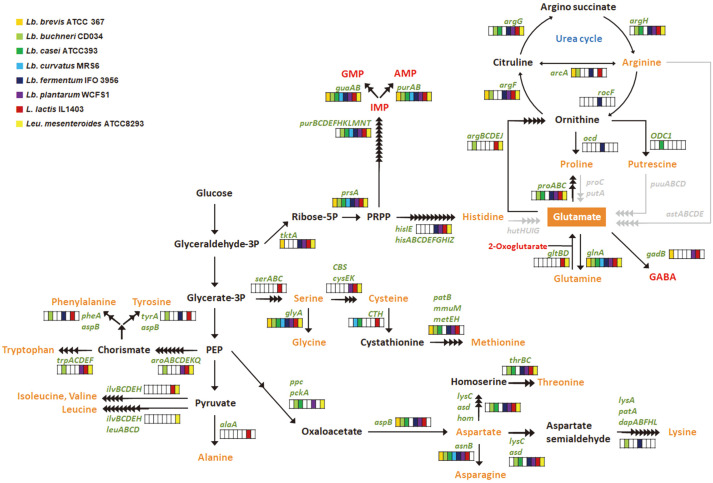
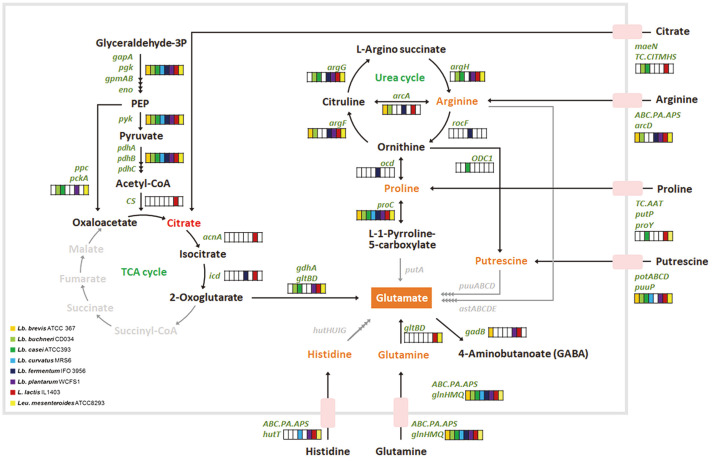
There are five pathways for glutamic acid production—from the precursors citrate, glutamine, histidine, proline, and putrescine (Fig. 1). Glutamic acid can be produced from arginine via proline or putrescine (Figs. 1 and 2). Other than citrate, these precursors are amino acids or an amino acid derivative. So, in silico prediction of the amino acid biosynthesis pathways in the eight LAB species was performed (Fig. 2 and Table S1). The genome of L. lactis IL1403 contained the genes for synthesis of 11 amino acids; Lb. buchneri CD034 contained genes for the synthesis of seven amino acids. None of the genomes of the eight species possessed genes for the synthesis of glutamic acid from histidine or putrescine. Proline, a potential precursor of glutamic acid, was not synthesized directly by any of the species, but it could be synthesized from arginine. None of the genomes included genes for arginine synthesis, but they included the gene encoding a transporter for intake of proline and arginine. None of the genomes contained genes for the synthesis of glutamine, but the genomes of L. lactis IL1403 and Leu. mesenteroides ATCC 8293 possessed genes for synthesis of glutamic acid from glutamine. Glutamine may be obtained from exogenous sources; transporters of glutamine were identified in all eight genomes (Fig. 3). Citrate could be synthesized from pyruvate in L. lactis strain IL1403, and this bacterium has genes encoding a specific transporter for exogenous citrate (Fig. 3).
Fig. 1.
Precursors for glutamate biosynthesis.
Fig. 2. Predicted amino acid synthesis pathways in lactic acid bacteria.
The names of enzyme-encoding genes are depicted in green. Metabolites involved in fermentation pathways are depicted in orange. Black arrows correspond to potential enzymatic reactions catalyzed by gene products encoded in eight lactic acid bacterial genomes. Putative inactive pathways are depicted with gray arrows.
Fig. 3. Predicted membrane transport systems related to glutamate synthesis pathways in lactic acid bacteria.
The names of enzyme-encoding genes are depicted in green. Metabolites involved in fermentation pathways are depicted in orange. Black arrows correspond to potential enzymatic reactions catalyzed by gene products encoded in eight lactic acid bacterial genomes. Putative inactive pathways are depicted with gray arrows.
In summary, the genomes of L. lactis IL1403 and Leu. mesenteroides ATCC 8293 possessed genes required for the synthesis of glutamic acid from glutamine, and the genome of L. lactis IL1403 possessed genes required for the synthesis of glutamic acid from citrate. Therefore, based on comparative genomic analysis, we suggest that L. lactis IL1403 may produce glutamic acid.
Screening of Glutamic Acid-Producing Strains
We screened 17 L. lactis strains, which were originally isolated from fermented seafood and dairy products, to select glutamic acid-producing strains based on citrate-utilization activity and a glutamic acid assay kit (Table 2). Three strains—KS3075, HY7803, and Y25—used citrate, as did reference strain ATCC 7962. Among them, strain HY7803 produced the most glutamic acid.
Effect of Citrate and Glutamine as External Materials on Glutamic Acid Production
Based on comparative genomic analysis (see section 3.1), citrate and glutamine might be used as precursors for glutamic acid production by L. lactis. We quantitatively determined glutamic acid production by L. lactis HY7803 using HPLC; 0.5% (w/v) citrate or 0.5% (w/v) glutamine were added to the culture medium to test their effect on glutamic acid production. For strain HY7803, the presence of citrate increased the glutamic acid production to 108.42 ± 0.47 pmol/μl from 83.16 ± 2.19 pmol/μl in the control (no added citrate). For strain IL1403, citrate decreased the glutamic acid production to 59.08 ± 3.26 pmol/μl from 75.15 ± 3.89 pmol/μl in the control (Table 3). Exogenous glutamine decreased the glutamic acid production in three strains. Through these experiments, we showed that L. lactis HY7803 may be able to enhance glutamic acid production during fermentation, especially in the presence of citrate as an exogenous precursor.
Table 3.
Free amino acid profiles of three L. lactis strains under citrate or glutamine pressure. (unit: pmol/μl)
| L. lactis HY7803 | L. lactis ATCC7962 | L. lactis IL1403 | |||||||
|---|---|---|---|---|---|---|---|---|---|
|
|
|
|
|||||||
| Control | Citrate | Glutamine | Control | Citrate | Glutamine | Control | Citrate | Glutamine | |
| Aspartic acid | 26.70bc | 49.27f | 19.63a | 30.52cd | 31.52cd | 23.25ab | 39.03e | 73.55g | 32.81d |
| Glutamic acid | 83.16de | 108.42f | 60.65a | 80.61cde | 88.01e | 62.54ab | 75.15cd | 59.08a | 71.67bc |
| Serine | 80.54e | 99.08f | 66.12bcd | 58.97b | 69.82cd | 47.35a | 73.65de | 82.47e | 61.24bc |
| Histidine | 30.65b | 35.89cd | 29.49b | 31.82bc | 35.28cd | 21.66a | 30.71b | 39.27d | 25.22a |
| Glycine | 55.05bc | 68.52d | 43.19a | 52.07b | 60.65c | 42.31a | 60.80c | 68.55d | 50.83b |
| Threonine | 80.28de | 88.48e | 64.78b | 67.32bc | 76.60cd | 51.62a | 71.64bcd | 74.15bcd | 52.82a |
| Arginine | 16.02d | 20.20e | 13.07b | 11.95b | 13.26bd | 9.29a | 15.67cd | 13.94bcd | 8.83a |
| Alanine | 80.77b | 96.19c | 63.21a | 99.59c | 86.36b | 66.39a | 82.09b | 98.97c | 68.28a |
| Tyrosine | 51.33b | 61.97c | 40.77a | 52.06b | 60.00c | 37.67a | 52.55b | 50.78b | 40.24a |
| Valine | 69.27cd | 76.06d | 54.76a | 68.09cd | 71.90cd | 50.41a | 65.02bc | 70.96cd | 55.84ab |
| Methionine | 20.03abc | 25.60d | 16.72a | 26.56d | 22.68cd | 15.96a | 21.19bc | 23.99cd | 17.37ab |
| Phenylalanine | 76.14b | 111.51d | 60.66a | 77.17bc | 88.58c | 56.53a | 79.13bc | 77.68bc | 60.83a |
| Isoleucine | 53.20d | 63.76e | 41.61abc | 48.83cd | 53.74d | 36.06a | 46.60bcd | 46.71bcd | 39.83ab |
| Leucine | 115.86cd | 143.87e | 91.19ab | 133.64de | 116.84cd | 82.73a | 107.42bc | 111.41c | 91.17ab |
| Lysine | 42.99de | 46.54ef | 33.77ab | 43.35de | 36.32bc | 31.29a | 39.24cd | 50.47f | 36.01bc |
| Proline | 38.84bc | 35.50bc | 31.02ab | 39.74c | 39.05bc | 26.40a | 34.74bc | 41.11c | 33.35abc |
Lactococcus lactis inoculated into M17 broth supplemented with 0.25% glucose (control). Citrate (0.5% w/v) or glutamine (0.5% w/v) was used as external pressure. Different superscripts within a row denote a significant difference between mean values (p < 0.05) according to Duncan’s multiple range test.
Free Amino Acid Production by Three L. lactis Strains
Amino acids, including glutamic acid, affect the sensory properties of food, so we checked the free amino acid production by L. lactis strains. Sixteen free amino acids were identified in the M17 broth (Table 3). Citrate significantly changed the free amino acid production by strains HY7803, ATCC 7962, and IL1403, while glutamine generally decreased the amino acid production. These results indicated that glutamine was not an efficient exogenous material for amino acid production. Under citrate exposure, 10 amino acids were produced by strain HY7803 at higher levels than the other two strains (Table 3).
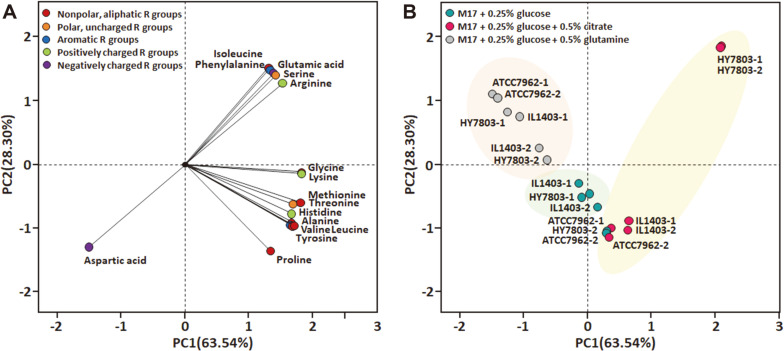
Statistics on the 16 free amino acids produced by the three L. lactis strains were subjected to PCA (Fig. 4). In a PCA factor loading plot, isoleucine, phenylalanine, serine, arginine, and glutamic acid were located in the positive part of the PC2 dimension. The 15 free amino acids other than aspartic acid were positively correlated with PC1 (Fig. 4A). The PCA scores for the three L. lactis strains cultured in the presence of citrate or glutamine are shown in Fig. 4B. The factor scores for cultures grown in the presence of glutamine clustered separately from those of control samples. The data indicate that exogenous glutamine negatively affects amino acid production in L. lactis. In the presence of citrate, strains ATCC 7962 and IL1403 showed similar scores. Strain HY7803 exhibited the highest production of arginine, isoleucine, phenylalanine, serine, and glutamic acid by significant amounts, and these results affect the factor scores. Therefore, strain HY7803 might be used to produce amino acids, including glutamic acid.
Fig. 4.
Principal component analysis loadings for three Lactococcus lactis strains grown in the presence of citrate, glutamine, or neither for (A) amino acids identified (represented according to their classifications), and (B) factor scores (numbers indicate independent samples).
In conclusions, most approaches to selecting starter candidates screen large libraries of bacteria [14-18]. However, the current study aimed to select suitable bacteria based on comparative genomic analysis. Such analysis of eight LAB species suggested that L. lactis may be suitable for glutamic acid production. Glutamic acid production through fermentation was showed low yield and purity compared with traditional methods such as extraction. However, fermented products added L. lactis for glutamic acid enhancement would have an additional advantage such as health benefits, as well as safety aspects. Biochemical analysis identified L. lactis strain HY7803 as a starter candidate; L. lactis HY7803 exhibited glutamic acid production, and citrate induced the glutamic acid production. Therefore, we suggest that L. lactis HY7803 displays desirable properties of a starter culture for enhancing taste properties in fermented foods.
Supplemental Materials
Supplementary data for this paper are available on-line only at http://jmb.or.kr.
Acknowledgments
This research was supported by the Korea Yakult Co., Ltd. We thank James Allen, DPhil, from Edanz Group (https://en-author-services.edanzgroup.com/ac) for editing a draft of this manuscript.
Footnotes
Conflict of Interest
The authors have no financial conflicts of interest to declare.
REFERENCES
- 1.Rafiq S, Huma N, Pasha I, Sameen A, Mukhtar O, Khan MI. Chemical composition, nitrogen fractions and amino acids profile of milk from different animal species. Asian-Australas. J. Anim. Sci. 2016;29:1022–1028. doi: 10.5713/ajas.15.0452. [DOI] [PMC free article] [PubMed] [Google Scholar]
- 2.Wookey N. Wheat gluten as a protein ingredient. J. Am. Oil Chem. Soc. 1979;56:306–309. doi: 10.1007/BF02671482. [DOI] [PubMed] [Google Scholar]
- 3.Rezac S, Kok CR, Heermann M, Hutkins R. Fermented foods as a dietary source of live organisms. Front. Microbiol. 2018;9:1785. doi: 10.3389/fmicb.2018.01785. [DOI] [PMC free article] [PubMed] [Google Scholar]
- 4.Leroy F, Vuyst LD. Lactic acid bacteria as functional starter cultures for the food fermentation industry. Trends Food Sci. Technol. 2004;15:67–78. doi: 10.1016/j.tifs.2003.09.004. [DOI] [Google Scholar]
- 5.Gänzle MG. Lactic metabolism revisited: metabolism of lactic acid bacteria in food fermentations and food spoilage. Curr. Opin. Food Sci. 2015;2:106–117. doi: 10.1016/j.cofs.2015.03.001. [DOI] [Google Scholar]
- 6.Zareian M, Ebrahimpour A, Bakar FA, Mohamed AK, Forghani B, Ab-Kadir MS, et al. A glutamic acid-producing lactic acid bacteria isolated from Malaysian fermented foods. Int. J. Mol. Sci. 2012;13:5482–5497. doi: 10.3390/ijms13055482. [DOI] [PMC free article] [PubMed] [Google Scholar]
- 7.Tanous C, Chambellon E, Sepulchre AM, Yvon M. The gene encoding the glutamate dehydrogenase in Lactococcus lactis is part of a remnant Tn3 transposon carried by a large plasmid. J. Bacteriol. 2005;187:5019–5022. doi: 10.1128/JB.187.14.5019-5022.2005. [DOI] [PMC free article] [PubMed] [Google Scholar]
- 8.Aziz RK, Bartels D, Best AA, DeJongh M, Disz T, Edwards RA, et al. The RAST Server: rapid annotations using subsystems technology. BMC Genomics. 2008;9:75. doi: 10.1186/1471-2164-9-75. [DOI] [PMC free article] [PubMed] [Google Scholar]
- 9.Darzi Y, Letunic I, Bork P, Yamada T. iPath3.0: interactive pathways explorer v3. Nucleic Acids Res. 2018;46:W510–W513. doi: 10.1093/nar/gky299. [DOI] [PMC free article] [PubMed] [Google Scholar]
- 10.Blom J, Albaum SP, Doppmeier D, Puhler A, Vorholter FJ, Zakrzewski M, et al. EDGAR: a software framework for the comparative analysis of prokaryotic genomes. BMC Bioinformatics. 2009;10:154. doi: 10.1186/1471-2105-10-154. [DOI] [PMC free article] [PubMed] [Google Scholar]
- 11.Bolotin A, Wincker P, Mauger S, Jaillon O, Malarme K, Weissenbach J, et al. The complete genome sequence of the lactic acid bacterium Lactococcus lactis ssp. lactis IL1403. Genome Res. 2001;11:731–753. doi: 10.1101/gr.GR-1697R. [DOI] [PMC free article] [PubMed] [Google Scholar]
- 12.Gasson MJ. Plasmid complements of Streptococcus lactis NCDO 712 and other lactic streptococci after protoplast-induced curing. J. Bacteriol. 1983;154:1–9. doi: 10.1128/JB.154.1.1-9.1983. [DOI] [PMC free article] [PubMed] [Google Scholar]
- 13.Kempler GM, McKay LL. Improved medium for detection of citrate-fermenting Streptococcus lactis subsp. diacetylactis. Appl. Environ. Microbiol. 1980;39:926–927. doi: 10.1128/AEM.39.4.926-927.1980. [DOI] [PMC free article] [PubMed] [Google Scholar]
- 14.Jeong DW, Lee B, Lee H, Jeong K, Jang M, Lee JH. Urease characteristics and phylogenetic status of Bacillus paralicheniformis. J. Microbiol. Biotechnol. 2018;28:1992–1998. doi: 10.4014/jmb.1809.09030. [DOI] [PubMed] [Google Scholar]
- 15.Lee JH, Shin D, Lee B, Lee H, Lee I, Jeong DW. Genetic diversity and antibiotic resistance of Enterococcus faecalis isolates from traditional Korean fermented soybean foods. J. Microbiol. Biotechnol. 2017;27:916–924. doi: 10.4014/jmb.1612.12033. [DOI] [PubMed] [Google Scholar]
- 16.Jeong DW, Kim HR, Jung G, Han S, Kim CT, Lee JH. Bacterial community migration in the ripening of doenjang, a traditional Korean fermented soybean food. J. Microbiol. Biotechnol. 2014;24:648–660. doi: 10.4014/jmb.1401.01009. [DOI] [PubMed] [Google Scholar]
- 17.Zou Z, Zhao Y, Zhang T, Xu J, He A, Deng Y. Efficient isolation and characterization of a cellulase hyperproducing mutant strain of Trichoderma reesei. J. Microbiol. Biotechnol. 2018;28:1473–1481. doi: 10.4014/jmb.1805.05009. [DOI] [PubMed] [Google Scholar]
- 18.Song CW, Rathnasingh C, Park JM, Lee J, Song H. Isolation and evaluation of Bacillus strains for industrial production of 2,3-Butanediol. J. Microbiol Biotechnol. 2018;28:409–417. doi: 10.4014/jmb.1710.10038. [DOI] [PubMed] [Google Scholar]
- 19.Guan L, Cho KH, Lee JH. Analysis of the cultivable bacterial community in jeotgal, a Korean salted and fermented seafood, and identification of its dominant bacteria. Food Microbiol. 2011;28:101–113. doi: 10.1016/j.fm.2010.09.001. [DOI] [PubMed] [Google Scholar]
Associated Data
This section collects any data citations, data availability statements, or supplementary materials included in this article.


