Abstract
Background
Gut microbiome and inflammatory bowel disease (IBD) are implicated in the development of depression, but the effect of their interactions on the risk of depression remains unclear. We aim to analyze the effect of interactions between gut microbiome and IBD on the risk of depression, and explore candidate genes involving the interactions.
Methods
Using the individual genotype and depression traits data from the UK Biobank, we calculated the polygenetic risk scores (PRS) of 114 gut microbiome, ulcerative colitis (UC), Crohn's disease (CD), and total IBD (CD + UC) respectively. The effects of interactions between gut microbiome and IBD on depression were assessed through a linear regression model. Moreover, for observed significant interactions between gut microbiome PRS and IBD PRS, PLINK software was used to test pair-wise single nucleotide polymorphisms (SNPs) interaction of corresponding gut microbiome PRS and IBD PRS on depression.
Results
We found 64 candidate interactions between gut microbiome and IBD on four phenotypes of depression, such as F_Lachnospiraceae (RNT) × (CD + UC) for patient health questionnaire-9 (PHQ-9) score (P = 1.48 × 10⁻³), F_Veillonellaceae (HB) × UC for self-reported depression (P = 2.83 × 10⁻³) and P_Firmicutes (RNT) × CD for age at first episode of depression (P = 8.50 × 10⁻³). We observed interactions of gut-microbiome-associated SNPs × IBD-associated SNPs, such as G_Alloprevotella (HB)-associated rs147650986 (GPM6A) × IBD-associated rs114471990 (QRICH1) (P = 2.26 × 10⁻⁴).
Conclusion
Our results support the effects of interactions between gut microbiome and IBD on depression risk, and reported several novel candidate genes for depression.
Keywords: Gut microbiome, Inflammatory bowel disease (IBD), Depression
Abbreviations: IBD, Inflammatory bowel disease; PRS, Polygenetic risk scores; UC, Ulcerative colitis; CD, Crohn's disease; SNPs, Single nucleotide polymorphisms; PNT, Rank normal transformed; HB, Hurdle binary; SCFAs, Short-chain fatty acids; GWAS, Genome-wide associations study; CI, Confidence interval; PHQ-9, Patient health questionnaire-9; HRC, Haplotype reference consortium; QC, Quality control; PCs, Principal components; FGFP, Flemish gut flora project; LD, Linkage disequilibrium; TDI, Townsend deprivation index; HPA, Hypothalamic-pituitary-adrenal; ASD, Autism spectrum disorders; SCZ, Schizophrenia; ENS, Enteric nervous system; CNS, Central nervous system; ER, Endoplasmic reticulum
Highlights
-
•
The first large-scale integrative study of the interaction between the gut microbiome and IBD on the risk of depression.
-
•
PLINK calculate the PRS of gut microbiome, ulcerative colitis, and Crohn's disease by using the individual SNP genotype data.
-
•
Our results reported several novel candidate genes for depression.
-
•
We detected a significant effect of the interactions between gut microbiome and IBD on the risk of depression.
1. Introduction
Depression is a common mental illness characterized by persistent low mood and diminished interest (Chand et al., 2021). The prevalence of depression has increased over the past few decades. It is estimated that 322 million people are suffering from depression, and the World Health Organization has identified it as one of the most significant contributors to global disability (Moreno-Agostino et al., 2021). Depression also seriously affects the life and employment of patients and brings heavy burdens to their families and society (Malhi and Mann, 2018).
The gut microbiome consists of a diverse consortium of bacteria, archaea, fungi, protozoa, viruses, and their collective genome found on and within the body (Barko et al., 2018), which play a crucial role in maintaining normal intestinal physiology and health (Gomaa, 2020). A growing number of researches have demonstrated that gut microbiome dysbiosis is an influential factor in depression (Capuco et al., 2020). The brain-gut axis is a bidirectional communication channel between gut microbiome and the brain, involving neuroimmune, endocrine and inflammatory mechanisms (Osadchiy et al., 2019). A lot of evidence indicated that the abundance and diversity of gut microbiota were altered in depression patients. For example, the abundance of the family Prevotellaceae, genus Coprococcus, and genus Faecalibacterium were significantly decreased in patients with depression (Sanada et al., 2020). In addition, Simpson et al. found a higher abundance of proinflammatory species (e.g., family Enterobacteriaceae and genus Desulfovibrio), and lower short-chain fatty acids (SCFAs) producing-bacteria (e.g., genus Faecalibacterium) in depression and anxiety (Simpson et al., 2021). Inflammatory bowel disease (IBD) is a chronic and recurrent inflammatory disease of the gastrointestinal tract, including ulcerative colitis (UC), which involves continuous inflammation of the colonic mucosa, and Crohn's disease (CD), which can cause ulceration anywhere in the gastrointestinal tract (McDowell et al., 2021). According to previous studies, IBD was correlated with depression. A cohort study based on the UK population found that depressive disorders were more prevalent in people with IBD than in those without IBD (CD patients: 12.9% vs. 17.5%, UC patients: 12.4% vs.14.2%) (Irving et al., 2021). Patients with depression were 2.11 times more likely to develop CD (95% confidence interval [CI]: 1.65–2.70) and 2.23 times more likely to develop UC (95%CI: 1.92–2.60) than those without depression (Frolkis et al., 2019). Inflammatory responses, autoimmunity, and the microbiome-gut-brain axis were identified as shared pathogenic mechanisms for IBD and depression by Martin-Subero et al. (2016).
Gut microbiome dysbiosis can lead to IBD, and IBD can in turn disrupt the gut microbiome. Much evidence suggests that transferring fecal microbiota from mice with IBD to healthy mice could result in colitis (Schirmer et al., 2019). Furthermore, compared with the microbiome of healthy participants, patients with IBD had reduced diversity of the gut microbiome and abundance of phylum Firmicutes, fewer bacteria with anti-inflammatory capacity, and more bacteria with an inflammatory ability (Glassner et al., 2020). Ni et al. suggested that chronic inflammation could alter the oxidative and metabolic environment in the gut, leading to dysbiosis of the intestinal microbes (Ni et al., 2017). Although there are interactions between the gut microbiome and IBD, few studies focused on the effect of their interactions on the risk of depression, which needs to be further investigated.
Polygenic risk scores (PRS) can provide an overall estimate of the genetic propensity of a trait at the individual level by calculating the sum of the effects of risk alleles (Crouch and Bodmer, 2020; Dudbridge, 2016). Estimates for each of these risk alleles were derived from the effect size weighting of single nucleotide polymorphisms (SNPs) found by an independent large-scale genome-wide associations study (GWAS) (Crouch and Bodmer, 2020). The effect sizes of multiple SNPs are combined into a single aggregated score that can be used to predict disease risk in humans (Dudbridge, 2016). The PRS has been used to estimate an individual's risk of inflammatory bowel disease (Chen et al., 2017), and the potential use of the microbiome in human disease (Wang et al., 2022). However, limited efforts were made to explore the effect of the interaction between the gut microbiome and IBD on the risk of depression through the application of PRS analysis. SNPs are the major genetic variants in GWAS, and most GWAS analyses follow a single-locus test procedure for SNP marginal effects (Zhang et al., 2019a). SNP-SNP interactions are very important in biological systems (Wang et al., 2019a), several studies conducted using SNP-SNP interactions to determine the genetics of diseases including atherosclerotic ischemic stroke (Shen et al., 2021), schizophrenia (Lee et al., 2020a) and CD (Dinu et al., 2012), whereas some SNPs with weak marginal effects but strong interaction effects cannot be found by marginal effect detection (Zhang et al., 2019a). PLINK software performs a series of basic, large-scale analyses in a computationally efficient manner and is well able to assess SNP interaction effects (Purcell et al., 2007).
In this study, we calculated the PRS for gut microbiome and IBD using published GWAS datasets, and subsequently applied linear regression models to assess the effect of interactions between gut microbiome PRS and IBD PRS on the risk of depression. Finally, for the top 10 gut microbiome PRS × IBD PRS interactions, the PLINK software was used to perform SNPs interactions analysis. We aim to analyze the association between gut microbiome × IBD interactions and depression, and further explore the corresponding genetic mechanisms underlying depression.
2. Methods
2.1. UK biobank cohort
This study used the genotype and phenotype data from the UK Biobank prospective cohort (Application 46478), which collected genome-wide data and health-related information from approximately 500,000 individuals aged 40–69 from all over the UK in 2006–2010 (Bycroft et al., 2018). The information of participants was collected through self-completed touch-screen questionnaires, computer-assisted interviews, and anthropometric measurements. All participants signed an electronic consent and allowed the UK Biobank to access their health-related records and agreed to use their anonymous data and samples in any health-related research (Sudlow et al., 2015).
2.2. Definition of depression phenotypes
In this study, we defined four depression phenotypes. The phenotype of patient health questionnaire-9 (PHQ-9) score was measured according to the PHQ-9 (Davis et al., 2019). PHQ-9 is a classification algorithm with a total score of 0–27 that focuses on nine signs and symptoms of depression (Kroenke et al., 2010). Self-reported depression was defined based on self-reported disease status in the UK Biobank (Davis et al., 2019). Age at first episode of depression was defined based on the age at which participants first experienced depressive symptoms for two weeks or more. Depression possibly related to childbirth was defined by the presence of depressive symptoms within months of giving birth or post-natal depression. The detailed definitions are provided in the Supplementary materials.
2.3. Genotyping, imputation and quality control
The UK Biobank cohort included genotypic data for 488,377 participants (Bycroft et al., 2018). Genotyping was performed by two very similar genotyping arrays, the UK BiLEVE Axiom array and the UK Biobank Axiom array (Bycroft et al., 2018). Imputation was carried out with the IMPUTE4 program, and the Haplotype Reference Consortium (HRC) and UK10K and 1000 Genomes phase 3 as imputation reference panels (McCarthy et al., 2016; UK 10K Consortium et al., 2015). Quality control (QC) included two parts: mark-based quality control and sample-based quality control (Bycroft et al., 2018). Briefly, statistical tests for batch effects, plate effects, departures from Hardy-Weinberg equilibrium, sex effects, array effects, and discordance across control replicates were performed to identify poor-quality markers. Poor-quality samples were detected using deletion rates and heterozygosity calculations. For sex chromosomes, specific quality controls were performed using 15,766 high-quality markers on the X and Y chromosomes. Principal components (PCs) were calculated by the UK Biobank from genome-wide genotypic data and could be representative of an individual's ethnic background (Bycroft et al., 2018). FastPCA (Galinsky et al., 2016) was applied to calculate PCs using a set of 407,219 unrelated, high-quality samples and 147,604 high-quality SNPs. Individuals with similar principal component scores have similar self-reported ethnic backgrounds (Bycroft et al., 2018). For example, the first two principal components separate out individuals with sub-Saharan African ancestry, European ancestry and East Asian ancestry (Bycroft et al., 2018). In this study, we chose the first 10 PCs as covariates because they can explain sufficient ancestry genetic characteristics for the UK Biobank participants (Frank et al., 2020). Detailed information about genotyping, imputation and QC could be found in the published study (Bycroft et al., 2018).
2.4. GWAS data of gut microbiome
The gut microbiome GWAS data were derived from a large-scale study, which performed genomic analysis on 2,223 individuals from Flemish Gut Flora Project (FGFP) cohort (Hughes et al., 2020). In brief, DNA was extracted from the collected fecal samples, and was sequenced after amplifying the V4 region of 16rRNA. A total of 499 taxa were counted, 139 of which met the standards of association analysis, and 92 taxa were finally analyzed after removing the correlation coefficients greater than 0.985. Genotyping was performed on two different arrays of Human Core Exome v1.0 and v1.1. Microbial taxa were described as relative abundance curves using the rank normal transformed (RNT) model, whereas those taxa with zero abundance distribution were described using the hurdle binary (HB) model. The α-diversity, abundance, and presence/absence correlation of microbiome were analyzed using snptest.2.5.0. Finally, 3,321 linkage disequilibrium (LD) independent loci were identified to be associated with 16S gut microbiome phenotypes. In our study, we selected SNPs loci with P < 1.0 × 10⁻⁴ for subsequent PRS analysis, and finally calculated the PRS of 114 gut-microbiome-associated traits. Detailed information about the human gut microbiome GWAS has been published in previous study (Hughes et al., 2020).
2.5. GWAS data of IBD
The IBD GWAS summary data were derived from subjects recruited at the outpatient IBD clinic of the University Hospitals Leuven, Belgium (Vancamelbeke et al., 2017). Briefly, 1,696 patients with CD, 884 patients with UC and 849 controls were genotyped by Immunochip. SNPs located within 50 kb up- or downstream of the transcription start/end site were extracted, and highly correlated SNPs (SNPs in high linkage disequilibrium, r2 > 0.7) were excluded. Finally, correlated SNPs were identified and used for PRS calculation. Detailed information of genetic data for IBD was described in the published study (Vancamelbeke et al., 2017).
2.6. PRS calculation
We calculated gut microbiome PRS and IBD PRS using GWAS data from gut microbiome and IBD and genotype data from UK Biobank cohort. The PRS was calculated by PLINK2.0 (Purcell et al., 2007; Lewis and Vassos, 2020). Let PRSn denote the PRS value of gut microbiome for the nth subject, defined as:
Where l denotes the total number of gut microbiome analyzed in this study; Ei denotes the effect size of the significant gut microbiome associated SNP i; Din denotes the dosage of the risk allele of the ith SNP for the nth individual (0 is coded for homozygous protective genotype, 1 for heterozygous and 2 for homozygous polymorphic genotypes). CD PRS, UC PRS, and total PRS (CD + UC) were calculated in the same way.
2.7. Gut microbiome PRS × IBD PRS interaction analysis
The linear regression model was developed using R software to evaluate the effects of interactions between gut microbiome PRS and IBD PRS on the depression phenotypes.
Where Y stands for depressive phenotypes; Χ1 represents PRS of the gut microbiome, Χ2 denotes UC PRS, CD PRS, or CD + UC PRS, and Χ1 × Χ2 denotes the interaction of gut microbiome × IBD.
Age, sex, townsend deprivation index (TDI), smoking frequency daily, alcohol frequency weekly and top 10 PCs of population structure were set as covariates in the analysis of PHQ-9 score, self-reported depression, and age at first episode of depression. The analysis for depression possibly related to childbirth was only conducted in females, and age, TDI, smoking frequency daily, alcohol frequency weekly and top 10 PCs were set as covariates. Furthermore, we performed subgroup analysis by sex and age respectively. For the age subgroup analysis, we divided the subjects into three age groups: youth group (<50 years old), middle-aged group (50–59 years old) and elderly group (≥60 years old), and age was not set as a covariate. For the sex subgroup analysis, sex was not set as a covariate. In this study, the significant threshold was set as P = 0.05.
2.8. SNP × SNP interaction analysis
According to the results of PRS, the top 10 significant interactions of gut microbiome PRS × IBD PRS were further selected for SNP × SNP interactions analysis. The “epistasis” command of PLINK was used to test the interactions of gut-microbiome-associated SNPs and IBD-associated SNPs, according to the regression model:
Where y represents depression phenotypes; A and B denote the SNPs associated with corresponding gut microbiome and IBD respectively. The depression phenotypes were adjusted by age, sex, TDI, smoking frequency daily, alcohol frequency weekly and top 10 PCs of population structure. The interactions with P < 0.05 were considered as significant.
3. Results
3.1. Characteristics of study participants
Totally, 84,805, 85,073, 43,664 and 26,696 individuals were included in analyses for PHQ-9 score, self-reported depression, age at first episode of depression and depression possibly related to childbirth, respectively. For depression possibly related to childbirth, the study samples were all females. The basic characteristics of study subjects are presented in Table 1.
Table 1.
The basic characteristics of study participants.
| PHQ-9 score | Self-reported depression | Age at first episode of depression | Depression possibly related to childbirth | |
|---|---|---|---|---|
| Participants | 84,805 | 85,073 | 43,664 | 26,696 |
| Females, n (%) | 45,866 (54.1) | 46,457 (54.6) | 27,358 (62.7) | 26,696 (100.0) |
| Age (years) | 56.23 ± 7.58 | 56.44 ± 7.62 | 55.63 ± 7.55 | 55.44 ± 7.45 |
| Alcohol frequency weekly | 10.02 ± 9.17 | 10.02 ± 9.88 | 9.76 ± 9.18 | 7.92 ± 7.05 |
| Smoking frequency daily | 5.68 ± 9.86 | 6.14 ± 10.23 | 6.01 ± 10.03 | 4.94 ± 8.60 |
| Townsend deprivation index | −1.97 ± 2.67 | −1.79 ± 2.77 | −1.82 ± 2.74 | −1.88 ± 2.69 |
Notes: PHQ: Patient Health Questionnaire. Age, Alcohol frequency weekly, Smoking frequency daily and Townsend deprivation index were described as Mean ± standard deviation.
3.2. Interactions of gut microbiome PRS and IBD PRS
We detected multiple interactions between gut microbiome PRS and IBD PRS for depression phenotypes. The details were shown in Supplementary Table 1. For PHQ-9 score, we identified 7 candidate interactions of gut microbiome PRS and CD PRS, such as G_Dialister (HB) × CD (P = 3.05 × 10⁻³) and F_Ruminococcaceae (RNT) × CD (P = 9.80 × 10⁻³). Four candidate interactions of gut microbiome PRS and UC PRS were detected, such as G_Blautia (RNT) × UC (P = 3.86 × 10⁻²) and F_Coriobacteriaceae (HB) × UC (P = 4.02 × 10⁻²). We also discovered 7 significant interactions between gut microbiome PRS and CD + UC PRS, such as F_Lachnospiraceae (RNT) × CD + UC (P = 1.48 × 10⁻³) and G_Acidaminococcus (RNT) × CD + UC (P = 5.92 × 10⁻³).
For self-reported depression, 6 candidate interactions between gut microbiome PRS and CD PRS were detected, such as G_Streptococcus (HB) × CD (P = 1.21 × 10⁻²) and G_Desulfovibrio (RNT) × CD (P = 1.66 × 10⁻²), and 6 promising candidate interactions between gut microbiome PRS and UC PRS were observed, such as F_Veillonellaceae (HB) × UC (P = 2.83 × 10⁻³), G_Alloprevotella (HB) × UC (P = 5.25 × 10⁻³). In addition, we identified 6 interactions between gut microbiome PRS and CD + UC PRS, such as G_Streptococcus (HB) × CD + UC (P = 1.62 × 10⁻²) and F_Veillonellaceae (HB) × CD + UC (P = 1.94 × 10⁻²).
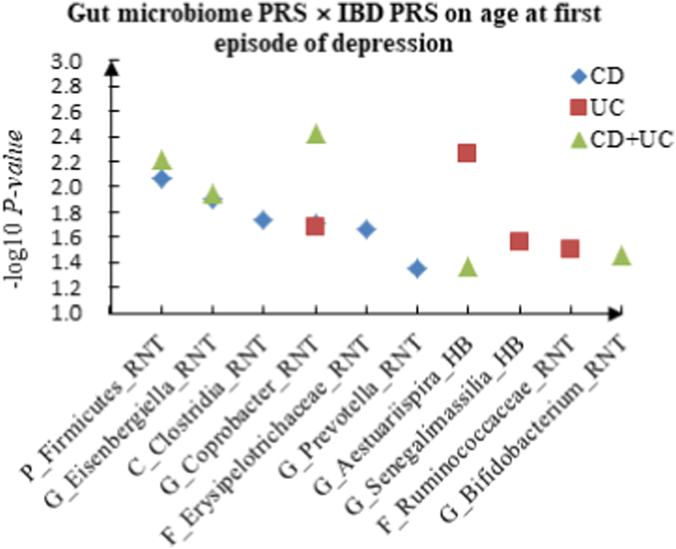
For age at first episode of depression, we discovered 6 candidate interactions of gut microbiome PRS and CD PRS, such as P_Firmicutes (RNT) × CD (P = 8.50 × 10⁻³) and G_Eisenbergiella (RNT) × CD (P = 1.26 × 10⁻²). Four candidate interactions of gut microbiome PRS and UC PRS were identified, such as G_Aestuariispira (HB) × UC (P = 5.58 × 10⁻³) and G_Coprobacter (RNT) × UC (P = 2.11 × 10⁻²), and 5 interactions between gut microbiome PRS and CD + UC PRS were detected, such as G_Coprobacter (RNT) × CD + UC (P = 3.74 × 10⁻³), P_Firmicutes (RNT) × CD + UC (P = 6.18 × 10⁻³). Table 2 summarized the top 10 significant interactions, and Fig. 1 showed the scatter plots of the interactions.
Table 2.
The top ten significant interactions of gut microbiome PRS and IBD PRS on depression.
| Depression phenotypes | IBD phenotypes | Gut microbiome | Gut microbiome PRS |
IBD PRS |
Interaction |
|||
|---|---|---|---|---|---|---|---|---|
| T | P | T | P | T | P | |||
| PHQ-9 score | CD + UC | F_Lachnospiraceae_RNT | 2.684 | 0.007 | 3.365 | 0.001 | −3.179 | 0.001 |
| Self-reported depression | UC | F_Veillonellaceae_HB | −3.101 | 0.002 | 3.173 | 0.002 | 2.986 | 0.003 |
| PHQ-9 score | CD | G_Dialister_HB | −2.022 | 0.043 | 2.619 | 0.009 | −2.963 | 0.003 |
| Age at first episode of depression | CD + UC | G_Coprobacter_RNT | 2.100 | 0.036 | −1.009 | 0.313 | −2.900 | 0.004 |
| Self-reported depression | UC | G_Alloprevotella_HB | −2.603 | 0.009 | −0.118 | 0.906 | 2.791 | 0.005 |
| Age at first episode of depression | UC | G_Aestuariispira_HB | 2.226 | 0.026 | 1.503 | 0.133 | −2.772 | 0.006 |
| PHQ-9 score | CD + UC | G_Acidaminococcus_RNT | 2.395 | 0.017 | 2.429 | 0.015 | −2.752 | 0.006 |
| Age at first episode of depression | CD + UC | P_Firmicutes_RNT | −2.635 | 0.008 | 0.661 | 0.508 | 2.738 | 0.006 |
| Age at first episode of depression | CD | P_Firmicutes_RNT | 0.149 | 0.882 | 0.720 | 0.471 | 2.632 | 0.009 |
| PHQ-9 score | CD | F_Lachnospiraceae_RNT | −0.982 | 0.326 | 2.355 | 0.019 | −2.626 | 0.009 |
Notes: P: Phylum. F: Family. G: Genus. PRS: Polygenic risk scores. PHQ: Patient Health Questionnaire. IBD: Inflammatory bowel disease. UC: Ulcerative colitis. CD: Crohn's disease.
Fig. 1.
A The scatter plot of the interactions of gut microbiome PRS and IBD PRS on PHQ-9 Score. B The scatter plot of the interactions of gut microbiome PRS and IBD PRS on self-reported depression. C The scatter plot of the interactions of gut microbiome PRS and IBD PRS on age at first episode of depression.
3.3. Interactions of gut microbiome PRS and IBD PRS in males
We tested the effects of the gut microbiome PRS × IBD PRS interactions on depression phenotypes in males. The details could be seen in Supplementary Table 2. For PHQ-9 score, 7 candidate interactions between gut microbiome PRS and CD PRS were identified, such as F_Ruminococcaceae (RNT) × CD (P = 1.75 × 10⁻²) and G_Collinsella (RNT) × CD (P = 2.38 × 10⁻²). F_Ruminococcaceae (RNT) × UC (P = 6.43 × 10⁻³) and F_Lachnospiraceae (RNT) × UC (P = 2.24 × 10⁻²) were detected as candidate interactions between gut microbiome PRS and UC PRS. We also discovered 6 potential interactions between gut microbiome PRS and CD + UC PRS, such as G_Collinsella (RNT) × CD + UC (P = 2.12 × 10⁻²) and F_Porphyromonadaceae (RNT) × CD + UC (P = 2.71 × 10⁻²).
For self-reported depression, we found 5 candidate interactions between gut microbiome PRS and CD PRS, such as C_Gammaproteobacteria (HB) × CD (P = 6.45 × 10⁻³) and P_Firmicutes (HB) × CD (P = 1.58 × 10⁻²), and 3 candidate interactions between gut microbiome PRS and UC PRS, such as G_Phascolarctobacterium (RNT) × UC (P = 2.47 × 10⁻³) and G_Escherichia_Shigella (RNT) × UC (P = 1.41 × 10⁻²). In addition, we detected 3 interactions of gut microbiome PRS and CD + UC PRS, such as G_Acidaminococcus (HB) × CD + UC (P = 1.19 × 10⁻²) and O_Selenomonadales (RNT) × CD + UC (P = 3.23 × 10⁻²).
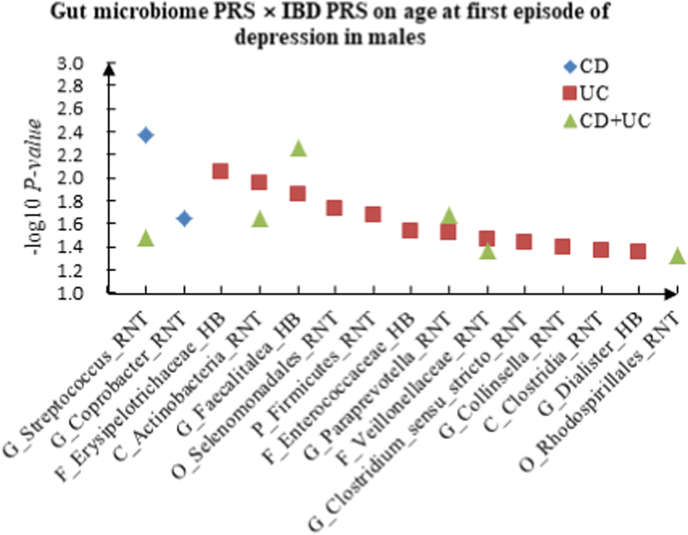
For age at first episode of depression, G_Streptococcus (RNT) × CD (P = 4.33 × 10⁻³) and G_Coprobacter (RNT) × CD (P = 2.28 × 10⁻²) were found as candidate interactions between gut microbiome PRS and CD PRS. We identified 12 candidate interactions between gut microbiome PRS and UC PRS, such as F_Erysipelotrichaceae (HB) × UC (P = 8.97 × 10⁻³), C_Actinobacteria (RNT) × UC (P = 1.13 × 10⁻²). We also detected 6 interactions between gut microbiome PRS and CD + UC PRS, such as G_Faecalitalea (HB) × CD + UC (P = 5.44 × 10⁻³) and G_Paraprevotella (RNT) × CD + UC (P = 2.14 × 10⁻²). Table 3 summarized the top 10 significant interactions in different sex, and Fig. 2 showed the scatter plots of the interactions in males.
Table 3.
The top ten significant interactions of gut microbiome PRS and IBD PRS on depression in different sex.
| Depression phenotypes | IBD phenotypes | Gut microbiome | Gut microbiome PRS |
IBD PRS |
Interaction |
||||
|---|---|---|---|---|---|---|---|---|---|
| T | P | T | P | T | P | ||||
| Male | |||||||||
| PHQ-9 score | CD + UC | F_Ruminococcaceae_RNT | 2.844 | 0.004 | 3.210 | 0.001 | −3.202 | 0.001 | |
| Self-reported depression | UC | G_Phascolarctobacterium_RNT | −3.053 | 0.002 | 3.062 | 0.002 | 3.027 | 0.002 | |
| Age at first episode of depression | CD | G_Streptococcus_RNT | 0.666 | 0.506 | −2.111 | 0.035 | 2.854 | 0.004 | |
| Age at first episode of depression | CD + UC | G_Faecalitalea_HB | 2.520 | 0.012 | −2.483 | 0.013 | −2.781 | 0.005 | |
| PHQ-9 score | UC | F_Ruminococcaceae_RNT | 2.582 | 0.010 | 2.683 | 0.007 | −2.725 | 0.006 | |
| Self-reported depression | CD | C_Gammaproteobacteria_HB | 0.757 | 0.449 | −0.922 | 0.357 | −2.724 | 0.006 | |
| Age at first episode of depression | UC | F_Erysipelotrichaceae_HB | −2.335 | 0.020 | −2.254 | 0.024 | 2.614 | 0.009 | |
| Age at first episode of depression | UC | C_Actinobacteria_RNT | −2.603 | 0.009 | −1.644 | 0.100 | 2.534 | 0.011 | |
| Self-reported depression | CD + UC | G_Acidaminococcus_HB | 2.288 | 0.022 | 2.695 | 0.007 | −2.514 | 0.012 | |
| Age at first episode of depression | UC | G_Faecalitalea_HB | 2.376 | 0.018 | −1.897 | 0.058 | −2.464 | 0.014 | |
| Female | |||||||||
| Self-reported depression | UC | G_Sporobacter_HB | −2.996 | 0.003 | −2.423 | 0.015 | 3.419 | 0.001 | |
| Age at first episode of depression | CD | G_Eisenbergiella_RNT | −1.712 | 0.087 | 2.230 | 0.026 | −2.868 | 0.004 | |
| Self-reported depression | CD | F_Erysipelotrichaceae_RNT | 0.190 | 0.849 | −1.016 | 0.310 | −2.776 | 0.006 | |
| Self-reported depression | CD + UC | F_Erysipelotrichaceae_RNT | 2.736 | 0.006 | −0.290 | 0.771 | −2.689 | 0.007 | |
| PHQ-9 score | CD + UC | G_Intestinibacter_HB | 2.309 | 0.021 | 0.502 | 0.616 | −2.679 | 0.007 | |
| PHQ-9 score | CD + UC | O_Bacteroidales_HB | 2.051 | 0.040 | 1.026 | 0.305 | −2.663 | 0.008 | |
| Depression possibly related to childbirth | CD | G_Anaerostipes_RNT | 1.079 | 0.281 | −0.273 | 0.785 | −2.628 | 0.009 | |
| PHQ-9 score | CD | G_Intestinibacter_HB | −0.652 | 0.514 | 0.696 | 0.487 | −2.599 | 0.009 | |
| Age at first episode of depression | UC | G_Barnesiella_HB | −2.208 | 0.027 | −2.234 | 0.025 | 2.566 | 0.010 | |
| Self-reported depression | CD + UC | G_Sporobacter_HB | −1.860 | 0.063 | −2.039 | 0.041 | 2.529 | 0.011 | |
Notes: C, Class. O, Order. F, Family. G, Genus. PRS: Polygenic risk scores. PHQ: Patient Health Questionnaire. IBD: Inflammatory bowel disease. UC: Ulcerative colitis. CD: Crohn's disease.
Fig. 2.
A The scatter plot of the interactions of gut microbiome PRS and IBD PRS on PHQ-9 Score in males. B The scatter plot of the interactions of gut microbiome PRS and IBD PRS on self-reported depression in males. C The scatter plot of the interactions of gut microbiome PRS and IBD PRS on age at first episode of depression in males.
3.4. Interactions of gut microbiome PRS and IBD PRS in females
In females, for PHQ-9 score, we identified 2 candidate interactions between gut microbiome PRS and CD PRS: G_Intestinibacter (HB) × CD (P = 9.35 × 10⁻³) and G_Coprobacter (RNT) × CD (P = 3.62 × 10⁻²), and 7 candidate interactions between gut microbiome PRS and UC PRS, such as F_Prevotellaceae (RNT) × UC (P = 1.42 × 10⁻²) and O_Bacteroidales (HB) × UC (P = 2.25 × 10⁻²). We also found 3 interactions between gut microbiome PRS and CD + UC PRS, such as G_Intestinibacter (HB) × CD + UC (P = 7.39 × 10⁻³) and O_Bacteroidales (HB) × CD + UC (P = 7.74 × 10⁻³).
For self-reported depression, 5 candidate interactions between gut microbiome PRS and CD PRS were discovered, such as F_Erysipelotrichaceae (RNT) × CD (P = 5.50 × 10⁻³) and G_Paraprevotella (RNT) × CD (P = 1.94 × 10⁻²). We also observed 6 candidate interactions between gut microbiome PRS and UC PRS, such as G_Sporobacter (HB) × UC (P = 6.31 × 10⁻⁴), G_Holdemanella (HB) × UC (P = 1.60 × 10⁻²), and 3 interactions between gut microbiome PRS and CD + UC PRS, such as F_Erysipelotrichaceae (RNT) × CD + UC (P = 7.17 × 10⁻³) and G_Sporobacter (HB) × CD + UC (P = 1.15 × 10⁻²).
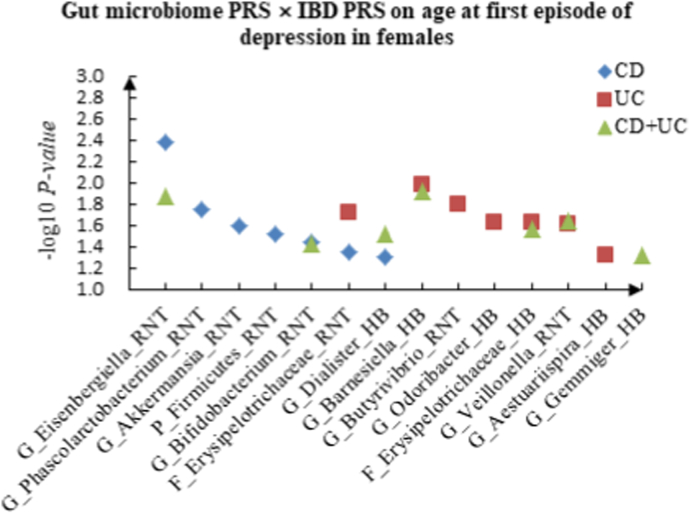
For age at first episode of depression, we found 7 candidate interactions between gut microbiome PRS and CD PRS, such as G_Eisenbergiella (RNT) × CD (P = 4.14 × 10⁻³) and G_Phascolarctobacterium (RNT) × CD (P = 1.76 × 10⁻²). Seven candidate interactions between gut microbiome PRS and UC PRS were identified, such as G_Barnesiella (HB) × UC (P = 1.03 × 10⁻²) and G_Butyrivibrio (RNT) × UC (P = 1.62 × 10⁻²), and 7 interactions between gut microbiome PRS and CD + UC PRS were detected, such as G_Barnesiella (HB) × CD + UC (P = 1.22 × 10⁻²) and G_Eisenbergiella (RNT) × CD + UC (P = 1.35 × 10⁻²).
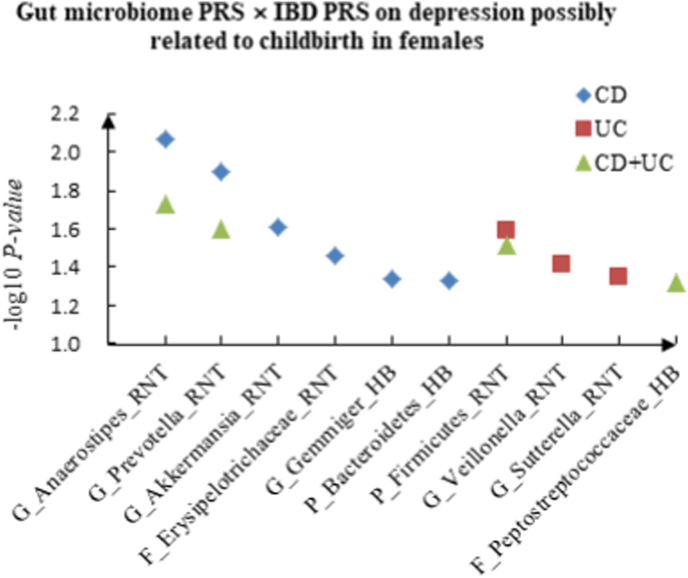
For depression possibly related to childbirth, we observed 6 candidate interactions between gut microbiome PRS and CD PRS, such as G_Anaerostipes (RNT) × CD (P = 8.59 × 10⁻³) and G_Prevotella (RNT) × CD (P = 1.28 × 10⁻²), and 3 candidate interactions between gut microbiome PRS and UC PRS, such as P_Firmicutes (RNT) × UC (P = 2.57 × 10⁻²) and G_Veillonella (RNT) × UC (P = 3.88 × 10⁻²). We also detected 4 interactions between gut microbiome PRS and CD + UC PRS, such as G_Anaerostipes (RNT) × CD + UC (P = 1.86 × 10⁻²) and G_Prevotella (RNT) × CD + UC (P = 2.49 × 10⁻²). The scatter plots of the interactions in females are shown in Fig. 3.
Fig. 3.
A The scatter plot of the interactions of gut microbiome PRS and IBD PRS on PHQ-9 Score in females. B The scatter plot of the interactions of gut microbiome PRS and IBD PRS on self-reported depression in females. C The scatter plot of the interactions of gut microbiome PRS and IBD PRS on age at first episode of depression in females. D The scatter plot of the interactions of gut microbiome PRS and IBD PRS on depression possibly related to childbirth in females.
3.5. Interactions of gut microbiome PRS and IBD PRS in age subgroups
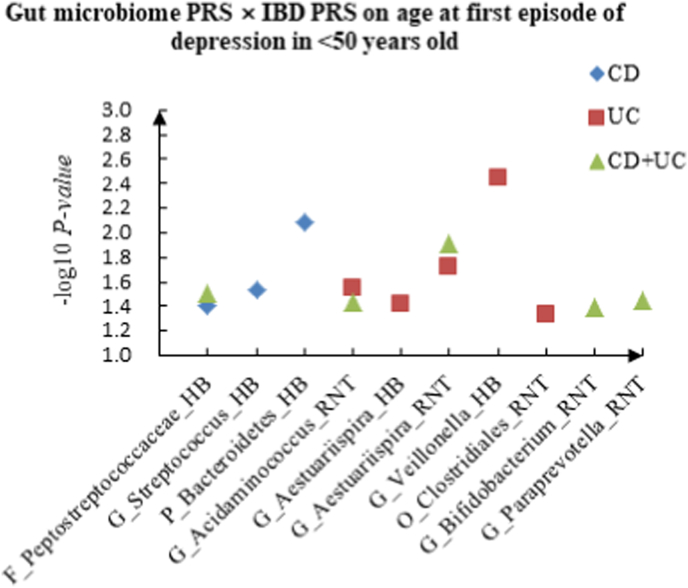
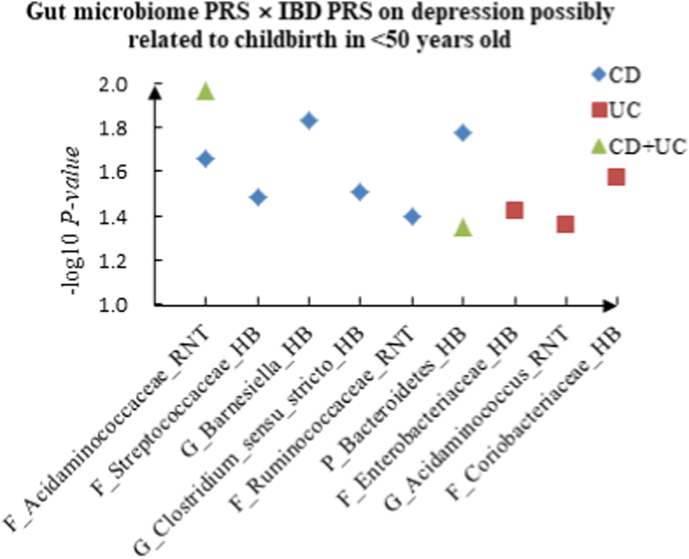
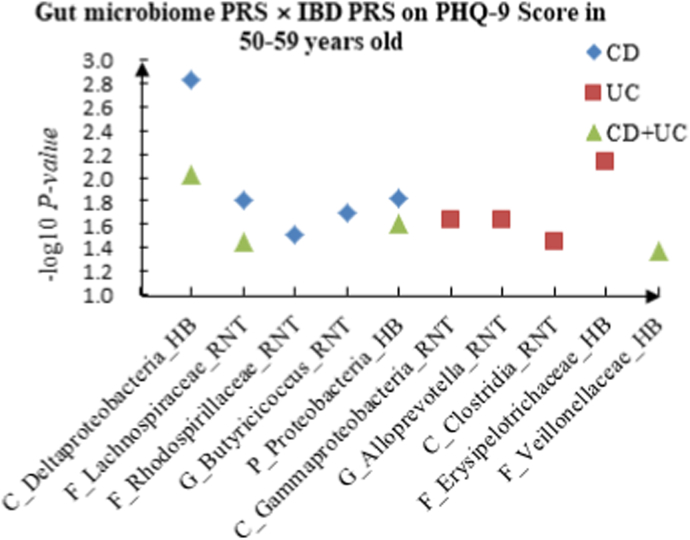
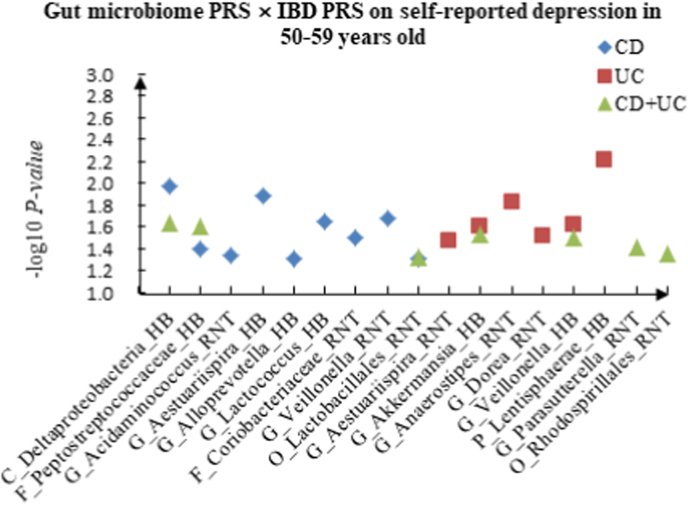
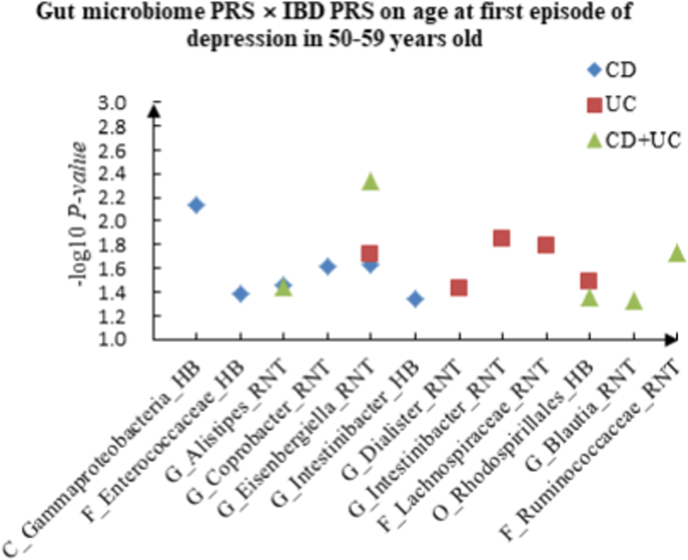
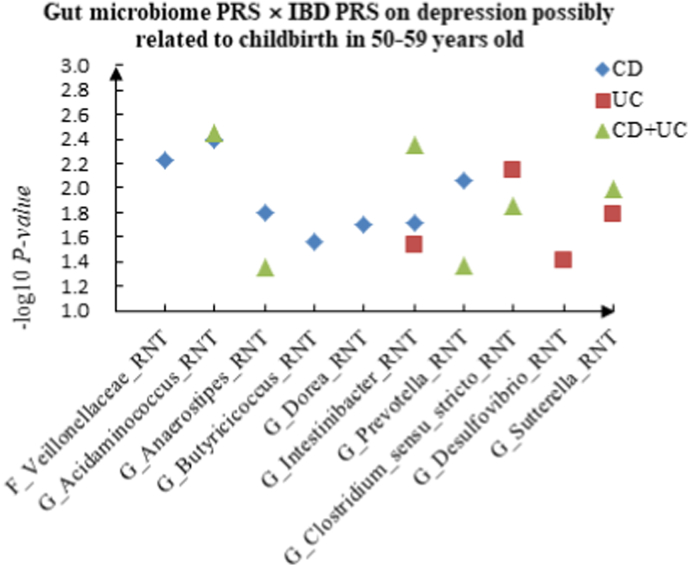
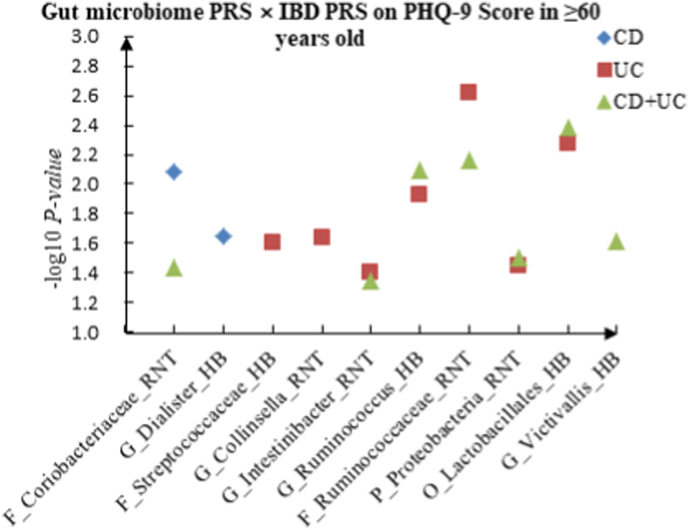
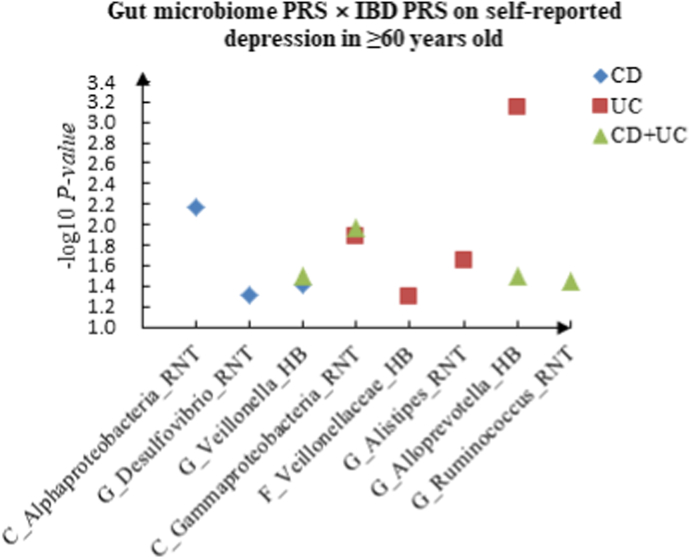
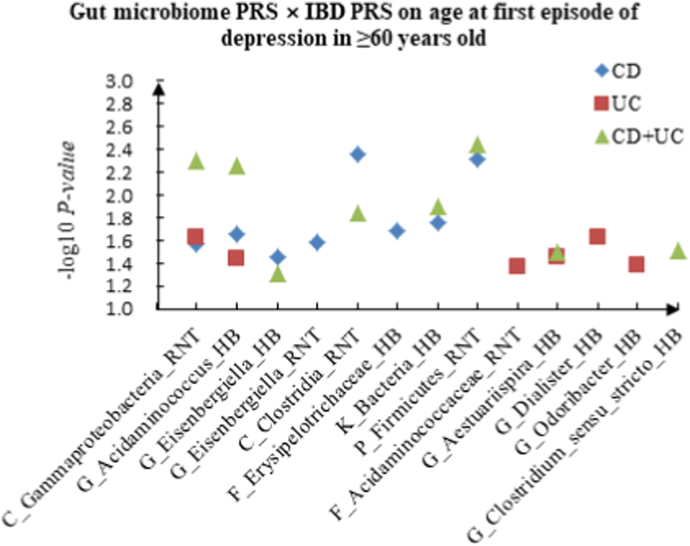
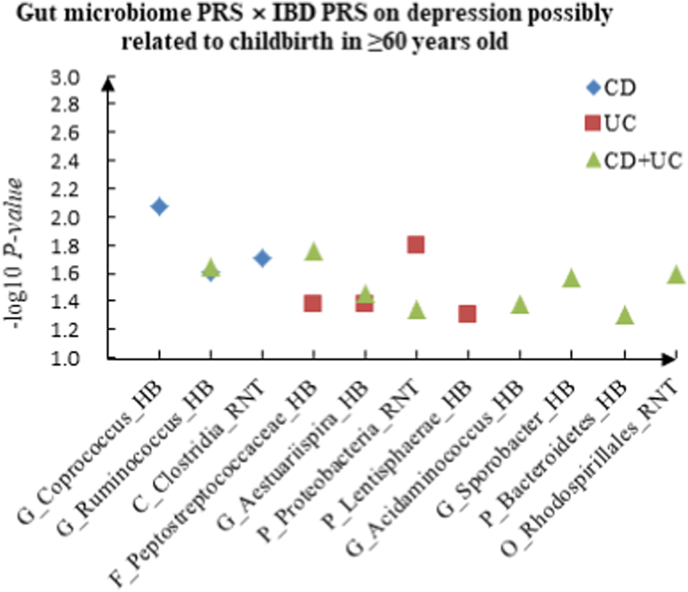
In this study, the age range of participants was 38–71 years old. Thus, we divided the subjects into three age groups: youth group (<50 years old), middle-aged group (50–59 years old) and elderly group (≥60 years old). Totally, we found 193 interactions between gut microbiome PRS and IBD PRS associated with four depression phenotypes in all age groups. The details are shown in Supplementary Table 3. Table 4 summarized the top 10 significant interactions in different ages. Scatter plots of significant interactions across age groups were shown in Fig. 4, Fig. 5, Fig. 6.
Table 4.
The top ten significant interactions of gut microbiome PRS and IBD PRS on depression in different ages.
| Depression phenotypes | IBD phenotypes | Gut microbiome | Gut microbiome PRS |
IBD PRS |
Interaction |
||||
|---|---|---|---|---|---|---|---|---|---|
| T | P | T | P | T | P | ||||
| <50 years old | |||||||||
| PHQ-9 score | CD | G_Clostridium_sensu_stricto_HB | 0.867 | 0.386 | −1.864 | 0.062 | 3.787 | <0.001 | |
| PHQ-9 score | UC | G_Akkermansia_RNT | −3.479 | 0.001 | −2.648 | 0.008 | 3.613 | <0.001 | |
| PHQ-9 score | CD + UC | G_Clostridium_sensu_stricto_HB | −2.812 | 0.005 | −1.068 | 0.285 | 3.195 | 0.001 | |
| Self-reported depression | CD + UC | F_Porphyromonadaceae_RNT | 3.082 | 0.002 | 2.535 | 0.011 | −3.138 | 0.002 | |
| Age at first episode of depression | UC | G_Veillonella_HB | 3.275 | 0.001 | −0.452 | 0.651 | −2.919 | 0.004 | |
| PHQ-9 score | UC | F_Desulfovibrionaceae_HB | −3.003 | 0.003 | −2.578 | 0.010 | 2.807 | 0.005 | |
| Self-reported depression | CD | F_Rhodospirillaceae_HB | 0.495 | 0.621 | 1.250 | 0.211 | 2.774 | 0.006 | |
| PHQ-9 score | CD | F_Ruminococcaceae_RNT | 0.852 | 0.394 | 1.792 | 0.073 | −2.651 | 0.008 | |
| PHQ-9 score | CD + UC | G_Akkermansia_RNT | −2.408 | 0.016 | −1.872 | 0.061 | 2.644 | 0.008 | |
| Age at first episode of depression | CD | P_Bacteroidetes_HB | −1.678 | 0.093 | 1.664 | 0.096 | −2.644 | 0.008 | |
| 50–59 years old | |||||||||
| PHQ-9 score | CD | C_Deltaproteobacteria_HB | −0.022 | 0.982 | 1.321 | 0.187 | −3.179 | 0.001 | |
| Depression possibly related to childbirth | CD + UC | G_Acidaminococcus_RNT | −2.289 | 0.022 | −0.674 | 0.500 | 2.912 | 0.004 | |
| Depression possibly related to childbirth | CD | G_Acidaminococcus_RNT | 1.438 | 0.151 | −1.029 | 0.304 | 2.874 | 0.004 | |
| Depression possibly related to childbirth | CD + UC | G_Intestinibacter_RNT | 3.151 | 0.002 | −0.339 | 0.734 | −2.844 | 0.004 | |
| Age at first episode of depression | CD + UC | G_Eisenbergiella_RNT | 1.570 | 0.116 | 0.922 | 0.357 | −2.837 | 0.005 | |
| Depression possibly related to childbirth | CD | F_Veillonellaceae_RNT | −0.394 | 0.693 | 0.959 | 0.338 | 2.757 | 0.006 | |
| Self-reported depression | UC | P_Lentisphaerae_HB | −2.237 | 0.025 | −0.237 | 0.812 | 2.742 | 0.006 | |
| Depression possibly related to childbirth | UC | G_Clostridium_sensu_stricto_RNT | −2.653 | 0.008 | −0.382 | 0.702 | 2.686 | 0.007 | |
| Age at first episode of depression | CD | C_Gammaproteobacteria_HB | 1.184 | 0.237 | 1.308 | 0.191 | 2.683 | 0.007 | |
| PHQ-9 score | UC | F_Erysipelotrichaceae_HB | −2.002 | 0.045 | −2.392 | 0.017 | 2.678 | 0.007 | |
| ≥60 years old | |||||||||
| Self-reported depression | UC | G_Alloprevotella_HB | −2.911 | 0.004 | −1.380 | 0.168 | 3.390 | 0.001 | |
| PHQ-9 score | UC | F_Ruminococcaceae_RNT | 2.772 | 0.006 | 1.737 | 0.082 | −3.035 | 0.002 | |
| Age at first episode of depression | CD + UC | P_Firmicutes_RNT | −3.048 | 0.002 | 0.678 | 0.498 | 2.911 | 0.004 | |
| PHQ-9 score | CD + UC | O_Lactobacillales_HB | 2.747 | 0.006 | −1.573 | 0.116 | −2.866 | 0.004 | |
| Age at first episode of depression | CD | C_Clostridia_RNT | 1.299 | 0.194 | −2.272 | 0.023 | −2.846 | 0.004 | |
| Age at first episode of depression | CD | P_Firmicutes_RNT | −0.390 | 0.697 | 0.777 | 0.437 | 2.813 | 0.005 | |
| Age at first episode of depression | CD + UC | C_Gammaproteobacteria_RNT | −2.468 | 0.014 | −2.379 | 0.017 | 2.808 | 0.005 | |
| PHQ-9 score | UC | O_Lactobacillales_HB | 2.771 | 0.006 | −0.628 | 0.530 | −2.784 | 0.005 | |
| Age at first episode of depression | CD + UC | G_Acidaminococcus_HB | 2.666 | 0.008 | −0.057 | 0.955 | −2.774 | 0.006 | |
| Self-reported depression | CD | C_Alphaproteobacteria_RNT | 1.465 | 0.143 | −2.840 | 0.005 | −2.704 | 0.007 | |
Notes: P, Phylum. C, Class. O, Order. F, Family. G, Genus. PRS: Polygenic risk scores. PHQ: Patient Health Questionnaire. IBD: Inflammatory bowel disease. UC: Ulcerative colitis. CD: Crohn's disease.
Fig. 4.
A The scatter plot of the interactions of gut microbiome PRS and IBD PRS on PHQ-9 Score in <50 years old. B The scatter plot of the interactions of gut microbiome PRS and IBD PRS on self-reported depression in <50 years old. C The scatter plot of the interactions of gut microbiome PRS and IBD PRS on age at first episode of depression in <50 years old. D The scatter plot of the interactions of gut microbiome PRS and IBD PRS on depression possibly related to childbirth in <50 years old.
Fig. 5.
A The scatter plot of the interactions of gut microbiome PRS and IBD PRS on PHQ-9 Score in 50–59 years old. B The scatter plot of the interactions of gut microbiome PRS and IBD PRS on self-reported depression in 50–59 years old. C The scatter plot of the interactions of gut microbiome PRS and IBD PRS on age at first episode of depression in 50–59 years old. D The scatter plot of the interactions of gut microbiome PRS and IBD PRS on depression possibly related to childbirth in 50–59 years old.
Fig. 6.
A The scatter plot of the interactions of gut microbiome PRS and IBD PRS on PHQ-9 Score in ≥60 years old. B The scatter plot of the interactions of gut microbiome PRS and IBD PRS on self-reported depression in ≥60 years old. C The scatter plot of the interactions of gut microbiome PRS and IBD PRS on age at first episode of depression in ≥60 years old. D The scatter plot of the interactions of gut microbiome PRS and IBD PRS on depression possibly related to childbirth in ≥60 years old.
For PHQ-9 score, 21 interactions were discovered in the youth group, such as C_Alphaproteobacteria (RNT) × CD (P = 2.67 × 10⁻²), F_Desulfovibrionaceae (HB) × UC (P = 5.01 × 10⁻³) and C_Alphaproteobacteria (RNT) × CD + UC (P = 4.23 × 10⁻²). Thirteen correlations were identified in the middle-aged group, such as C_Deltaproteobacteria (HB) × CD (P = 1.48 × 10⁻³), C_Gammaproteobacteria (RNT) × UC (P = 2.31 × 10⁻²) and F_Lachnospiraceae (RNT) × CD + UC (P = 3.60 × 10⁻²), and we observed 16 candidate interactions in the elderly group, such as F_Coriobacteriaceae (RNT) × CD (P = 8.17 × 10⁻³), F_Streptococcaceae (HB) × UC (P = 2.45 × 10⁻²) and G_Intestinibacter (RNT) × CD + UC (P = 4.46 × 10⁻²).
For self-reported depression, 16 candidate interactions were discovered in the youth group, such as F_Acidaminococcaceae (HB) × CD (P = 4.20 × 10⁻²), F_Desulfovibrionaceae (HB) × UC (P = 1.88 × 10⁻²) and F_Erysipelotrichaceae (RNT) × CD + UC (P = 4.34 × 10⁻²). We also observed 22 interactions in the middle-aged group, such as C_Deltaproteobacteria (HB) × CD (P = 1.05 × 10⁻²), G_Aestuariispira (RNT) × UC (P = 3.40 × 10⁻²) and F_Peptostreptococcaceae (HB) × CD + UC (P = 2.47 × 10⁻²), and 11 interactions in the elderly group, such as C_Alphaproteobacteria (RNT) × CD (P = 6.86 × 10⁻³), C_Gammaproteobacteria (RNT) × UC (P = 1.30 × 10⁻²) and G_Ruminococcus (RNT) × CD + UC (P = 3.63 × 10⁻²).
For age at first episode of depression, we found 13 candidate interactions in the youth group, such as F_Peptostreptococcaceae (HB) × CD (P = 3.89 × 10⁻²), G_Acidaminococcus (RNT) × UC (P = 2.85 × 10⁻²) and G_Aestuariispira (RNT) × CD + UC (P = 1.24 × 10⁻²). Sixteen interactions were identified in the middle-aged group, such as C_Gammaproteobacteria (HB) × CD (P = 7.31 × 10⁻³), G_Dialister (RNT) × UC (P = 3.77 × 10⁻²) and G_Alistipes (RNT) × CD + UC (P = 3.58 × 10⁻²). Furthermore, we also detected 22 interactions in the elderly group, such as C_Gammaproteobacteria (RNT) × CD (P = 2.75 × 10⁻²), F_Acidaminococcaceae (RNT) × UC (P = 4.29 × 10⁻²) and G_Acidaminococcus (HB) × CD + UC (P = 5.54 × 10⁻³).
For depression possibly related to childbirth, we observed 11 interactions in the youth group, such as F_Acidaminococcaceae (RNT) × CD (P = 2.20 × 10⁻²), F_Enterobacteriaceae (HB) × UC (P = 3.78 × 10⁻²) and P_Bacteroidetes (HB) × CD + UC (P = 4.51 × 10⁻²), and 17 candidate interactions were detected in the middle-aged group, such as F_Veillonellaceae (RNT) × CD (P = 5.84 × 10⁻³), G_Desulfovibrio (RNT) × UC (P = 3.84 × 10⁻²) and G_Acidaminococcus (RNT) × CD + UC (P = 3.60 × 10⁻³). We also found 15 interactions in the elderly group, such as G_Coprococcus (HB) × CD (P = 8.52 × 10⁻³), F_Peptostreptococcaceae (HB) × UC (P = 4.14 × 10⁻²) and G_Acidaminococcus (HB) × CD + UC (P = 4.18 × 10⁻²).
3.6. SNP interaction analysis results
For identified candidate PRS interactions, we further conducted single SNP interaction analysis between the top 10 gut microbiome PRS × IBD PRS interactions for depression phenotypes. And we identified several candidate genes corresponding to the SNP locus through GWAS4D (http://mulinlab.org/gwas4d).
For PHQ-9 score, we detected 3 interactions between gut-microbiome-associated SNP × IBD-associated SNP, such as G_Alloprevotella (HB)-associated rs147650986 (GPM6A) × IBD-associated rs114471990 (QRICH1) (P = 2.26 × 10⁻⁴), G_Aestuariispira (HB)-associated rs10882795 (TLL2) × IBD-associated rs2517523 (HCG22) (P = 1.01 × 10⁻⁴).
For self-reported depression, we identified 3 interactions between gut-microbiome-associated SNP × IBD-associated SNP, such as G_Alloprevotella (HB)-associated rs181338468 (4q31.21) × IBD-associated rs911359 (LINC01620) (P = 2.35 × 10⁻⁴) and G_Aestuariispira (HB)-associated rs140132254 (FER1L6) × IBD-associated rs9262636 (HCG22) (P = 5.14 × 10⁻⁴).
For age at first episode of depression, two interactions between gut-microbiome-associated SNP × IBD-associated SNP were discovered: G_Alloprevotella (HB)-associated rs147377160 (2q14.3) × IBD-associated rs9308261 (1p13.2) (P = 1.41 × 10⁻⁴), F_Veillonellaceae (HB)-associated rs117748831 (16p13.2) × IBD-associated rs11168249 (HDAC7) (P = 5.39 × 10⁻⁴).
For depression possibly related to childbirth, we found 3 interactions between gut-microbiome-associated SNP × IBD-associated SNP, such as G_Alloprevotella (HB)-associated rs116712055 (WDR64) × IBD-associated rs117987337 (12q12) (P = 1.06 × 10⁻⁴) and G_Dialister (HB)-associated rs11001120 (10q22.2) × IBD-associated rs3213673 (DLD) (P = 1.40 × 10⁻⁴). The detailed results are shown in Table 5.
Table 5.
The interactions of SNPs on depression.
| Depression phenotypes | Gut microbiome | Gut microbiome related SNPs |
IBD related SNPs |
SNP × SNP interaction P value |
||||
|---|---|---|---|---|---|---|---|---|
| ID | Gene locus | ID | Gene locus | |||||
| PHQ-9 score | ||||||||
| G_Alloprevotella_HB | rs139744914 | OBP2B | rs911359 | LINC01620 | 4.77 × 10⁻⁴ | |||
| rs147650986 | GPM6A | rs114471990 | QRICH1 | 2.26 × 10⁻⁴ | ||||
| rs148583470 | 3p12.1 | rs76970129 | 18p11.21 | 8.43 × 10⁻⁴ | ||||
| rs77408394 | CACNA1C | rs28894977 | 6p21.33 | 7.00 × 10⁻⁴ | ||||
| G_Aestuariispira_HB | rs10882795 | TLL2 | rs2517523 | HCG22 | 1.01 × 10⁻⁴ | |||
| rs939983 | 15q13.1 | 1.25 × 10⁻⁴ | ||||||
| rs9262636 | HCG22 | 4.03 × 10⁻⁴ | ||||||
| rs2517474 | 6p21.33 | 8.03 × 10⁻⁴ | ||||||
| rs140132254 | FER1L6 | rs3809133 | ESYT1, ZC3H10 | 4.89 × 10⁻⁴ | ||||
| G_Anaerostipes_RNT | rs117662630 | 14q21.1 | rs114471990 | QRICH1 | 1.02 × 10⁻⁴ | |||
| rs147118406 | C3orf84 | 1.61 × 10⁻⁴ | ||||||
| Self-reported depression | ||||||||
| G_Alloprevotella_HB | rs181338468 | 4q31.21 | rs911359 | LINC01620 | 2.35 × 10⁻⁴ | |||
| rs2844670 | 6p21.33 | 3.67 × 10⁻⁴ | ||||||
| G_Aestuariispira_HB | rs140132254 | FER1L6 | rs9262636 | HCG22 | 5.14 × 10⁻⁴ | |||
| P_Firmicutes_RNT | rs11788336 | ELP1 | rs2254210 | VDR | 9.73 × 10⁻⁴ | |||
| Age at first episode of depression | ||||||||
| G_Alloprevotella_HB | rs147377160 | 2q14.3 | rs9308261 | 1p13.2 | 1.41 × 10⁻⁴ | |||
| rs147650986 | GPM6A | rs11564168 | MUC19,AC107023.1 | 5.73 × 10⁻⁴ | ||||
| rs181338468 | 4q31.21 | rs117987337 | 12q12 | 7.95 × 10⁻⁴ | ||||
| F_Veillonellaceae_HB | rs117748831 | 16p13.2 | rs11168249 | HDAC7 | 5.39 × 10⁻⁴ | |||
| Depression possibly related to childbirth | ||||||||
| G_Alloprevotella_HB | rs116712055 | WDR64 | rs117987337 | 12q12 | 1.06 × 10⁻⁴ | |||
| rs78681519 | SLC13A3 | rs1538580 | 9q21.11 | 4.87 × 10⁻⁴ | ||||
| rs9282699 | CSHL1,GH1 | rs2853564 | VDR,AC121338.1 | 6.39 × 10⁻⁴ | ||||
| P_Firmicutes_RNT | rs11788336 | ELP1 | rs12179536 | MUC22 | 9.88 × 10⁻⁴ | |||
| G_Dialister_HB | rs10249533 | PDE1C | rs10401439 | SYMPK | 3.06 × 10⁻⁴ | |||
| rs11001120 | 10q22.2 | rs3213673 | DLD,LAMB1 | 1.40 × 10⁻⁴ | ||||
Notes: P, Phylum. F, Family. G, Genus. SNP: Single nucleotide polymorphisms. PHQ: Patient Health Questionnaire. IBD: Inflammatory bowel disease.
4. Discussion
Previous studies have revealed that gut microbiome and IBD involve in the development of depression (Barandouzi et al., 2020; Abautret-Daly et al., 2018). However, the biological mechanisms behind the impact of interactions between gut microbiome and IBD on depression risk remain to be elucidated. In this study, we examined the interactions between IBD and the gut microbiome, and then observed the effects of the interactions on depression risk. We also reported several novel candidate genes for depression through SNPs interaction analysis.
We found a significant association between the interactions of gut microbiome × IBD and depression. Previous studies have illustrated that gut microbiome and IBD can influence the pathogenesis of depression. The gut microbiome plays a direct role in mental disorders and can affect the brain and behavior through the microbiome-gut-brain axis (Liang et al., 2018; Lima-Ojeda et al., 2020). Communication between the gut microbiome and the brain includes modulation of the hypothalamic-pituitary-adrenal (HPA) axis, activation of the immune system and the inflammatory response system (Abautret-Daly et al., 2018). IBD can affect the pathogenesis of depression through immune inflammation, gut-brain pathways, tryptophan catabolites, and oxidative and nitrosating stress (Martin-Subero et al., 2016; Abautret-Daly et al., 2018). In addition, IBD can influence the composition of the microbiome, while microorganisms can influence the occurrence of IBD. For example, people with CD or UC have different gut microbiota with healthy individuals (Guarner, 2011). In contrast, the gut microbiota metabolizes complex dietary carbohydrates through a wide range of enzymes, resulting in the production of organic acids, gases, and large amounts of SCFAs (Martin-Gallausiaux et al., 2021), SCFAs promote the differentiation of naive T lymphocytes in the intestine into Treg cells (Martin-Gallausiaux et al., 2021). When the number of SCFAs-producing microorganisms is reduced, the number of Treg cells is reduced, which can lead to IBD (Martin-Gallausiaux et al., 2021; Dalile et al., 2019; Yan et al., 2020; Ueno et al., 2018). However, whether the relationship between gut microbiota and IBD is related to the pathogenesis of depression remains uncertain and requires further investigation.
We identified several significant gut microbiome and IBD interactions, such as G_Dialister (HB) × CD, G_Anaerostipes (RNT) × CD, G_Alloprevotella (HB) × UC, F_Veillonellaceae (HB) × UC and F_Lachnospiraceae (RNT) × CD + UC. Previous studies showed an increased abundance of genus Anaerostipes (Cheung et al., 2019) and family Lachnospiraceae (Cheung et al., 2019; Chen et al., 2018a) and decreased abundance of genus Alloprevotella (Zheng et al., 2021), family Veillonellaceae (Barandouzi et al., 2020) and genus Dialister (Cheung et al., 2019; Valles-Colomer et al., 2019) in depressed patients compared to non-depressed patients, suggesting that depression may be associated with specific gut microbiome phenotypes (Liang et al., 2018). Interestingly, genus Dialister decreased in CD patients (Kowalska-Duplaga et al., 2019) and family Veillonellaceae decreased in UC patients (Lee et al., 2020b), which may act through the microbiome-gut-brain axis, leading to the psychiatric disorders of autism spectrum disorders (ASD) and schizophrenia (SCZ), respectively (Andreo-Martinez et al., 2020; Zheng et al., 2019). In addition, family Lachnospiraceae and genus Anaerostipes can alleviate intestinal inflammation in IBD patients by producing butyrate and inhibiting proinflammatory cytokines (Vacca et al., 2020; Lee et al., 2021). Wang et al. observed that the increase of genus Alloprevotella was not conducive to the relief of intestinal inflammation (Wang et al., 2019b).
The effect of the gut microbiome PRS × IBD PRS interactions on depression risk differed across sex and age. Some pieces of evidence suggested that sex can affect gut microbiota diversity and may play a role in depression (Manosso et al., 2021). For example, the relative abundance of Actinobacteria increased in female-depressed individuals, while that of Bacteroidetes decreased in male-depressed individuals (Chen et al., 2018b). Notably, there appears to be a reciprocal interaction between gut microbiota and sex hormones, and sex differences in gut microbiota do not appear until puberty (Kim et al., 2020; Jaggar et al., 2020). In addition, the composition of the gut microbiome and the relative abundance of specific bacterial taxa are affected with age (Ratto et al., 2022). Specifically, changes in microbiota composition could be caused by maladaptive and dysbiosis conditions in the gut microbiota in the delicate balance between inflammation, immune senescence and ecological homeostasis, such as changes in the relative abundance of Lachnospiraceae and Ruminococcaceae (DeJong et al., 2020). It was believed that increasing age can affect the gut-brain axis by causing alterations in the gut microbiome, thereby impeding neural, endocrine, nutritional and immune signals between the gut and brain via the enteric nervous system (ENS), and may play a role in central nervous system (CNS) disorders such as depression and anxiety (Nagpal et al., 2018).
Moreover, we detected several candidate genes for depression phenotypes, such as HDAC7, GPM6A, VDR, and QRICH1. HDAC7 is a major histone deacetylase, which can drive macrophage-mediated inflammatory response and increase the proinflammatory mediators IL-1β and Ccl2 (Das Gupta et al., 2020; Ramnath et al., 2021; Shakespear et al., 2013). GPM6A promotes the formation of synapses and is involved in the brain signaling pathways of psychiatric disorders such as depression and schizophrenia (Aparicio et al., 2020; Fuchsova et al., 2015). GPM6A mRNA level in the hippocampus of patients with depression is significantly decreased, and down-regulated GPM6A expression may be associated with morphological alterations in the depressed human brain (Fuchsova et al., 2015). Additionally, VDR has the function of regulating T cells and has been shown to influence the relationship between the intestinal flora and the host (Battistini et al., 2020). For example, mice knocked out of the VDR had severe colitis and increased intestinal mucosal permeability (Zhang et al., 2019b). QRICH1 plays a key role in the unfolded response to endoplasmic reticulum (ER) stress through transcriptional control of protein status, and QRICH1 variants contribute to neurodevelopmental disorders through dysregulation of the ER stress response (Kumble et al., 2022).
In this study, we conducted the first large-scale PRS-based analysis to detect the effect of gut microbiome × IBD interactions on depression. The PRS was generated using the latest GWAS summary data of gut microbiome and IBD, and genotype data from the UK Biobank cohort. We indicated significant gut microbiome PRS × IBD PRS interactions for depression. In addition, we conducted SNP × SNP interaction analysis and found a significant effect of interactions between gut-microbiome-associated SNPs and IBD-associated SNPs on depression. Our findings may contribute to a more detailed understanding of the pathogenesis of depression and provide novel therapeutic targets. However, certain limitations should be noted. First, the samples in this study were drawn entirely from the European population aged 38–71 years old, so the findings should be extended with caution to other ethnic groups or other age groups. Second, given that our study is a cross-sectional study, we would be unable to prove a causal relationship between gut microbiome × IBD interactions and depression. Third, we focused on the interaction between IBD and 64 gut microbiota that significantly affect the risk of depression, and further experimental studies are needed to verify the underlying molecular biological mechanisms.
In conclusion, we conducted a comprehensive analysis to test the effect of gut microbiome × IBD on depression risk, and explore the potential role of SNPs interactions in the pathogenesis of depression. We detected multiple significant gut microbiome PRS × IBD PRS interactions and identified several candidate genes for depression. Our findings provide novel clues for the pathogenesis and therapy of depression. Further research is needed to elucidate and validate the biological mechanisms in the future.
Authors’ contributions
XQ and FZ conceived and designed the study; XQ and CP wrote the manuscript; All authors collected the data and CP carried out the statistical analysis; QC, YZ, DH, WW, NZ, SS and XC made preparations for the manuscript at first. All authors reviewed and approved the final manuscript.
Sources of funding
This work was supported by the National Natural Scientific Foundation of China: 81922059 and the Natural Science Basic Research Plan in Shaanxi Province of China: 2021JCW-08.
Declaration of competing interest
The authors declare that they have no known competing financial interests or personal relationships that could have appeared to influence the work reported in this paper.
Acknowledgements
This research was conducted under UK Biobank application 46478. The authors would like to thank all the participants of this study for their time and effort.
Footnotes
Supplementary data to this article can be found online at https://doi.org/10.1016/j.bbih.2022.100557.
Appendix A. Supplementary data
The following are the Supplementary data to this article:
Data availability
Data will be made available on request.
References
- Abautret-Daly A., Dempsey E., Parra-Blanco A., Medina C., Harkin A. Gut-brain actions underlying comorbid anxiety and depression associated with inflammatory bowel disease. Acta Neuropsychiatr. 2018;30:275–296. doi: 10.1017/neu.2017.3. [DOI] [PubMed] [Google Scholar]
- Andreo-Martinez P., Garcia-Martinez N., Sanchez-Samper E.P., Martinez-Gonzalez A.E. An approach to gut microbiota profile in children with autism spectrum disorder. Environ Microbiol Rep. 2020;12:115–135. doi: 10.1111/1758-2229.12810. [DOI] [PubMed] [Google Scholar]
- Aparicio G.I., Formoso K., Leon A., Frasch A.C., Scorticati C. Identification of potential interacting proteins with the extracellular loops of the neuronal glycoprotein M6a by TMT/MS. Front. Synaptic Neurosci. 2020;12:28. doi: 10.3389/fnsyn.2020.00028. [DOI] [PMC free article] [PubMed] [Google Scholar]
- Barandouzi Z.A., Starkweather A.R., Henderson W.A., Gyamfi A., Cong X.S. Altered composition of gut microbiota in depression: a systematic review. Front. Psychiatr. 2020;11:541. doi: 10.3389/fpsyt.2020.00541. [DOI] [PMC free article] [PubMed] [Google Scholar]
- Barko P.C., McMichael M.A., Swanson K.S., Williams D.A. The gastrointestinal microbiome: a review. J. Vet. Intern. Med. 2018;32:9–25. doi: 10.1111/jvim.14875. [DOI] [PMC free article] [PubMed] [Google Scholar]
- Battistini C., Ballan R., Herkenhoff M.E., Saad S.M.I., Sun J. Vitamin D modulates intestinal microbiota in inflammatory bowel diseases. Int. J. Mol. Sci. 2020;22 doi: 10.3390/ijms22010362. [DOI] [PMC free article] [PubMed] [Google Scholar]
- Bycroft C., et al. The UK Biobank resource with deep phenotyping and genomic data. Nature. 2018;562:203–209. doi: 10.1038/s41586-018-0579-z. [DOI] [PMC free article] [PubMed] [Google Scholar]
- Capuco A., et al. Current perspectives on gut microbiome dysbiosis and depression. Adv. Ther. 2020;37:1328–1346. doi: 10.1007/s12325-020-01272-7. [DOI] [PMC free article] [PubMed] [Google Scholar]
- Chand S.P., Arif H., Kutlenios R.M. StatPearls. Treasure Island (FL; 2021. [Google Scholar]
- Chen G.B., et al. Performance of risk prediction for inflammatory bowel disease based on genotyping platform and genomic risk score method. BMC Med. Genet. 2017;18:94. doi: 10.1186/s12881-017-0451-2. [DOI] [PMC free article] [PubMed] [Google Scholar]
- Chen Z., et al. Comparative metaproteomics analysis shows altered fecal microbiota signatures in patients with major depressive disorder. Neuroreport. 2018;29:417–425. doi: 10.1097/WNR.0000000000000985. [DOI] [PubMed] [Google Scholar]
- Chen J.J., et al. Sex differences in gut microbiota in patients with major depressive disorder. Neuropsychiatric Dis. Treat. 2018;14:647–655. doi: 10.2147/NDT.S159322. [DOI] [PMC free article] [PubMed] [Google Scholar]
- Cheung S.G., et al. Systematic review of gut microbiota and major depression. Front. Psychiatr. 2019;10:34. doi: 10.3389/fpsyt.2019.00034. [DOI] [PMC free article] [PubMed] [Google Scholar]
- Crouch D.J.M., Bodmer W.F. Polygenic inheritance, GWAS, polygenic risk scores, and the search for functional variants. Proc. Natl. Acad. Sci. U. S. A. 2020;117:18924–18933. doi: 10.1073/pnas.2005634117. [DOI] [PMC free article] [PubMed] [Google Scholar]
- Dalile B., Van Oudenhove L., Vervliet B., Verbeke K. The role of short-chain fatty acids in microbiota-gut-brain communication. Nat. Rev. Gastroenterol. Hepatol. 2019;16:461–478. doi: 10.1038/s41575-019-0157-3. [DOI] [PubMed] [Google Scholar]
- Das Gupta K., et al. Class IIa histone deacetylases drive toll-like receptor-inducible glycolysis and macrophage inflammatory responses via pyruvate kinase M2. Cell Rep. 2020;30:2712–2728 e2718. doi: 10.1016/j.celrep.2020.02.007. [DOI] [PubMed] [Google Scholar]
- Davis K.A.S., et al. Indicators of mental disorders in UK Biobank-A comparison of approaches. Int. J. Methods Psychiatr. Res. 2019;28 doi: 10.1002/mpr.1796. [DOI] [PMC free article] [PubMed] [Google Scholar]
- DeJong E.N., Surette M.G., Bowdish D.M.E. The gut microbiota and unhealthy aging: disentangling cause from consequence. Cell Host Microbe. 2020;28:180–189. doi: 10.1016/j.chom.2020.07.013. [DOI] [PubMed] [Google Scholar]
- Dinu I., et al. SNP-SNP interactions discovered by logic regression explain Crohn's disease genetics. PLoS One. 2012;7 doi: 10.1371/journal.pone.0043035. [DOI] [PMC free article] [PubMed] [Google Scholar]
- Dudbridge F. Polygenic epidemiology. Genet. Epidemiol. 2016;40:268–272. doi: 10.1002/gepi.21966. [DOI] [PMC free article] [PubMed] [Google Scholar]
- Frank P., Ajnakina O., Steptoe A., Cadar D. Genetic susceptibility, inflammation and specific types of depressive symptoms: evidence from the English Longitudinal Study of Ageing. Transl. Psychiatry. 2020;10:140. doi: 10.1038/s41398-020-0815-9. [DOI] [PMC free article] [PubMed] [Google Scholar]
- Frolkis A.D., et al. Depression increases the risk of inflammatory bowel disease, which may be mitigated by the use of antidepressants in the treatment of depression. Gut. 2019;68:1606–1612. doi: 10.1136/gutjnl-2018-317182. [DOI] [PubMed] [Google Scholar]
- Fuchsova B., Alvarez Julia A., Rizavi H.S., Frasch A.C., Pandey G.N. Altered expression of neuroplasticity-related genes in the brain of depressed suicides. Neuroscience. 2015;299:1–17. doi: 10.1016/j.neuroscience.2015.04.057. [DOI] [PMC free article] [PubMed] [Google Scholar]
- Galinsky K.J., et al. Fast principal-component analysis reveals convergent evolution of ADH1B in europe and East asia. Am. J. Hum. Genet. 2016;98:456–472. doi: 10.1016/j.ajhg.2015.12.022. [DOI] [PMC free article] [PubMed] [Google Scholar]
- Glassner K.L., Abraham B.P., Quigley E.M.M. The microbiome and inflammatory bowel disease. J. Allergy Clin. Immunol. 2020;145:16–27. doi: 10.1016/j.jaci.2019.11.003. [DOI] [PubMed] [Google Scholar]
- Gomaa E.Z. Human gut microbiota/microbiome in health and diseases: a review. Antonie Leeuwenhoek. 2020;113:2019–2040. doi: 10.1007/s10482-020-01474-7. [DOI] [PubMed] [Google Scholar]
- Guarner F. [The intestinal microbiota and inflammatory bowel disease] Gastroenterol. Hepatol. 2011;34:147–154. doi: 10.1016/j.gastrohep.2010.11.009. [DOI] [PubMed] [Google Scholar]
- Hughes D.A., et al. Genome-wide associations of human gut microbiome variation and implications for causal inference analyses. Nat. Microbiol. 2020;5:1079–1087. doi: 10.1038/s41564-020-0743-8. [DOI] [PMC free article] [PubMed] [Google Scholar]
- Irving P., Barrett K., Nijher M., de Lusignan S. Evid Based Ment Health; 2021. Prevalence of Depression and Anxiety in People with Inflammatory Bowel Disease and Associated Healthcare Use: Population-Based Cohort Study. [DOI] [PMC free article] [PubMed] [Google Scholar]
- Jaggar M., Rea K., Spichak S., Dinan T.G., Cryan J.F. You've got male: sex and the microbiota-gut-brain axis across the lifespan. Front. Neuroendocrinol. 2020;56 doi: 10.1016/j.yfrne.2019.100815. [DOI] [PubMed] [Google Scholar]
- Kim Y.S., Unno T., Kim B.Y., Park M.S. Sex differences in gut microbiota. World J. Mens Health. 2020;38:48–60. doi: 10.5534/wjmh.190009. [DOI] [PMC free article] [PubMed] [Google Scholar]
- Kowalska-Duplaga K., et al. Differences in the intestinal microbiome of healthy children and patients with newly diagnosed Crohn's disease. Sci. Rep. 2019;9 doi: 10.1038/s41598-019-55290-9. [DOI] [PMC free article] [PubMed] [Google Scholar]
- Kroenke K., Spitzer R.L., Williams J.B., Lowe B. The patient health questionnaire somatic, anxiety, and depressive symptom scales: a systematic review. Gen. Hosp. Psychiatr. 2010;32:345–359. doi: 10.1016/j.genhosppsych.2010.03.006. [DOI] [PubMed] [Google Scholar]
- Kumble S., et al. The clinical and molecular spectrum of QRICH1 associated neurodevelopmental disorder. Hum. Mutat. 2022;43:266–282. doi: 10.1002/humu.24308. [DOI] [PubMed] [Google Scholar]
- Lee K.Y., et al. Genome-wide search for SNP interactions in GWAS data: algorithm, feasibility, replication using schizophrenia datasets. Front. Genet. 2020;11:1003. doi: 10.3389/fgene.2020.01003. [DOI] [PMC free article] [PubMed] [Google Scholar]
- Lee A.A., et al. Temporal gut microbial changes predict recurrent clostridiodes difficile infection in patients with and without ulcerative colitis. Inflamm. Bowel Dis. 2020;26:1748–1758. doi: 10.1093/ibd/izz335. [DOI] [PMC free article] [PubMed] [Google Scholar]
- Lee J.Y., et al. Anaerostipes hominis sp. nov., a novel butyrate-producing bacteria isolated from faeces of a patient with Crohn's disease. Int. J. Syst. Evol. Microbiol. 2021;71 doi: 10.1099/ijsem.0.005129. [DOI] [PubMed] [Google Scholar]
- Lewis C.M., Vassos E. Polygenic risk scores: from research tools to clinical instruments. Genome Med. 2020;12:44. doi: 10.1186/s13073-020-00742-5. [DOI] [PMC free article] [PubMed] [Google Scholar]
- Liang S., Wu X., Hu X., Wang T., Jin F. Recognizing depression from the Microbiota(-)Gut(-)Brain Axis. Int. J. Mol. Sci. 2018;19 doi: 10.3390/ijms19061592. [DOI] [PMC free article] [PubMed] [Google Scholar]
- Lima-Ojeda J.M., Rupprecht R., Baghai T.C. [Gut microbiota and depression: pathophysiology of depression: hypothalamic-pituitary-adrenal axis and microbiota-gut-brain axis] Nervenarzt. 2020;91:1108–1114. doi: 10.1007/s00115-020-01029-1. [DOI] [PubMed] [Google Scholar]
- Malhi G.S., Mann J.J. Depression. Lancet. 2018;392:2299–2312. doi: 10.1016/S0140-6736(18)31948-2. [DOI] [PubMed] [Google Scholar]
- Manosso L.M., et al. Sex-related patterns of the gut-microbiota-brain axis in the neuropsychiatric conditions. Brain Res. Bull. 2021;171:196–208. doi: 10.1016/j.brainresbull.2021.04.001. [DOI] [PubMed] [Google Scholar]
- Martin-Gallausiaux C., Marinelli L., Blottiere H.M., Larraufie P., Lapaque N. SCFA: mechanisms and functional importance in the gut. Proc. Nutr. Soc. 2021;80:37–49. doi: 10.1017/S0029665120006916. [DOI] [PubMed] [Google Scholar]
- Martin-Subero M., Anderson G., Kanchanatawan B., Berk M., Maes M. Comorbidity between depression and inflammatory bowel disease explained by immune-inflammatory, oxidative, and nitrosative stress; tryptophan catabolite; and gut-brain pathways. CNS Spectr. 2016;21:184–198. doi: 10.1017/S1092852915000449. [DOI] [PubMed] [Google Scholar]
- McCarthy S., et al. A reference panel of 64,976 haplotypes for genotype imputation. Nat. Genet. 2016;48:1279–1283. doi: 10.1038/ng.3643. [DOI] [PMC free article] [PubMed] [Google Scholar]
- McDowell C., Farooq U., Haseeb M. StatPearls. Treasure Island (FL); 2021. [Google Scholar]
- Moreno-Agostino D., et al. Global trends in the prevalence and incidence of depression: a systematic review and meta-analysis. J. Affect. Disord. 2021;281:235–243. doi: 10.1016/j.jad.2020.12.035. [DOI] [PubMed] [Google Scholar]
- Nagpal R., et al. Gut microbiome and aging: physiological and mechanistic insights. Nutr. Healthy Aging. 2018;4:267–285. doi: 10.3233/NHA-170030. [DOI] [PMC free article] [PubMed] [Google Scholar]
- Ni J., Wu G.D., Albenberg L., Tomov V.T. Gut microbiota and IBD: causation or correlation? Nat. Rev. Gastroenterol. Hepatol. 2017;14:573–584. doi: 10.1038/nrgastro.2017.88. [DOI] [PMC free article] [PubMed] [Google Scholar]
- Osadchiy V., Martin C.R., Mayer E.A. The gut-brain Axis and the microbiome: mechanisms and clinical implications. Clin. Gastroenterol. Hepatol. 2019;17:322–332. doi: 10.1016/j.cgh.2018.10.002. [DOI] [PMC free article] [PubMed] [Google Scholar]
- Purcell S., et al. PLINK: a tool set for whole-genome association and population-based linkage analyses. Am. J. Hum. Genet. 2007;81:559–575. doi: 10.1086/519795. [DOI] [PMC free article] [PubMed] [Google Scholar]
- Ramnath D., et al. The histone deacetylase Hdac7 supports LPS-inducible glycolysis and Il-1beta production in murine macrophages via distinct mechanisms. J. Leukoc. Biol. 2021 doi: 10.1002/JLB.2MR1021-260R. [DOI] [PubMed] [Google Scholar]
- Ratto D., et al. The many ages of microbiome-gut-brain Axis. Nutrients. 2022;14 doi: 10.3390/nu14142937. [DOI] [PMC free article] [PubMed] [Google Scholar]
- Sanada K., et al. Gut microbiota and major depressive disorder: a systematic review and meta-analysis. J. Affect. Disord. 2020;266:1–13. doi: 10.1016/j.jad.2020.01.102. [DOI] [PubMed] [Google Scholar]
- Schirmer M., Garner A., Vlamakis H., Xavier R.J. Microbial genes and pathways in inflammatory bowel disease. Nat. Rev. Microbiol. 2019;17:497–511. doi: 10.1038/s41579-019-0213-6. [DOI] [PMC free article] [PubMed] [Google Scholar]
- Shakespear M.R., et al. Histone deacetylase 7 promotes Toll-like receptor 4-dependent proinflammatory gene expression in macrophages. J. Biol. Chem. 2013;288:25362–25374. doi: 10.1074/jbc.M113.496281. [DOI] [PMC free article] [PubMed] [Google Scholar]
- Shen C., et al. Single nucleotide polymorphisms in the ANGPTL4 gene and the SNP-SNP interactions on the risk of atherosclerotic Ischaemic stroke. BMC Neurol. 2021;21:108. doi: 10.1186/s12883-021-02138-3. [DOI] [PMC free article] [PubMed] [Google Scholar]
- Simpson C.A., et al. The gut microbiota in anxiety and depression - a systematic review. Clin. Psychol. Rev. 2021;83 doi: 10.1016/j.cpr.2020.101943. [DOI] [PubMed] [Google Scholar]
- Sudlow C., et al. UK biobank: an open access resource for identifying the causes of a wide range of complex diseases of middle and old age. PLoS Med. 2015;12 doi: 10.1371/journal.pmed.1001779. [DOI] [PMC free article] [PubMed] [Google Scholar]
- Ueno A., et al. Th17 plasticity and its relevance to inflammatory bowel disease. J. Autoimmun. 2018;87:38–49. doi: 10.1016/j.jaut.2017.12.004. [DOI] [PubMed] [Google Scholar]
- UK 10K Consortium, et al. The UK10K project identifies rare variants in health and disease. Nature. 2015;526:82–90. doi: 10.1038/nature14962. [DOI] [PMC free article] [PubMed] [Google Scholar]
- Vacca M., et al. The controversial role of human gut Lachnospiraceae. Microorganisms. 2020;8 doi: 10.3390/microorganisms8040573. [DOI] [PMC free article] [PubMed] [Google Scholar]
- Valles-Colomer M., et al. The neuroactive potential of the human gut microbiota in quality of life and depression. Nat. Microbiol. 2019;4:623–632. doi: 10.1038/s41564-018-0337-x. [DOI] [PubMed] [Google Scholar]
- Vancamelbeke M., et al. Genetic and transcriptomic bases of intestinal epithelial barrier dysfunction in inflammatory bowel disease. Inflamm. Bowel Dis. 2017;23:1718–1729. doi: 10.1097/MIB.0000000000001246. [DOI] [PMC free article] [PubMed] [Google Scholar]
- Wang M.H., Cordell H.J., Van Steen K. Statistical methods for genome-wide association studies. Semin. Cancer Biol. 2019;55:53–60. doi: 10.1016/j.semcancer.2018.04.008. [DOI] [PubMed] [Google Scholar]
- Wang C., et al. Saccharomyces boulardii alleviates ulcerative colitis carcinogenesis in mice by reducing TNF-alpha and IL-6 levels and functions and by rebalancing intestinal microbiota. BMC Microbiol. 2019;19:246. doi: 10.1186/s12866-019-1610-8. [DOI] [PMC free article] [PubMed] [Google Scholar]
- Wang C., et al. bioRxiv; 2022. Microbial Risk Score for Capturing Microbial Characteristics, Integrating Multi-Omics Data, and Predicting Disease Risk. [DOI] [PMC free article] [PubMed] [Google Scholar]
- Yan J.B., Luo M.M., Chen Z.Y., He B.H. The function and role of the Th17/treg cell balance in inflammatory bowel disease. J. Immunol. Res. 2020;2020 doi: 10.1155/2020/8813558. [DOI] [PMC free article] [PubMed] [Google Scholar]
- Zhang S., Jiang W., Ma R.C., Yu W. Region-based interaction detection in genome-wide case-control studies. BMC Med. Genom. 2019;12:133. doi: 10.1186/s12920-019-0583-7. [DOI] [PMC free article] [PubMed] [Google Scholar]
- Zhang Y.G., et al. Lack of vitamin D receptor leads to hyperfunction of claudin-2 in intestinal inflammatory responses. Inflamm. Bowel Dis. 2019;25:97–110. doi: 10.1093/ibd/izy292. [DOI] [PMC free article] [PubMed] [Google Scholar]
- Zheng P., et al. The gut microbiome from patients with schizophrenia modulates the glutamate-glutamine-GABA cycle and schizophrenia-relevant behaviors in mice. Sci. Adv. 2019;5:eaau8317. doi: 10.1126/sciadv.aau8317. [DOI] [PMC free article] [PubMed] [Google Scholar]
- Zheng S., et al. A correlation study of intestinal microflora and first-episode depression in Chinese patients and healthy volunteers. Brain Behav. 2021;11 doi: 10.1002/brb3.2036. [DOI] [PMC free article] [PubMed] [Google Scholar]
Associated Data
This section collects any data citations, data availability statements, or supplementary materials included in this article.
Supplementary Materials
Data Availability Statement
Data will be made available on request.


