

Abstract
Background and Aim:
The optimal imaging test for gross tumor volume (GTV) delineation in non-spine bone metastases has not been defined. The use of stereotactic body radiotherapy (SBRT) requires accurate target delineation. Magnetic resonance imaging (MRI) and/or 18fludesoxyglucose positron emission tomography (18FDG-PET) allow for better visualization of the extent of bone metastases and optimizes the accuracy of tumor delineation for stereotactic radiotherapy compared to computed tomography (CT) alone. We evaluated the interobserver agreement in GTV of non-spine bone metastases in a single center and compared MRI and/or 18FDG-PET and CT in GTV delineation.
Methods:
Anonymous CT and MRI and/or 18FDG-PET obtained from 10 non-spine bone metastases were analyzed by six radiation oncologists at our center. Images acquired by CT and MRI and/or 18FDG-PET were used to delineate 10 GTVs of non-spine bone metastases in the pelvis, extremities, and skull. The cases showed different characteristics: blastic and lytic metastases, and different primary cancers (lung, breast, prostate, rectum, urothelial, and biliary). In both CT and MRI and/or 18FDG-PET, the GTV volumes were compared. The index of agreement was evaluated according to Landis and Koch protocol.
Results:
The GTV volume as defined on MRI was in all cases larger or at least as large as the GTV volume on CT (P=0.25). The median GTV volume on MRI was 3.15 cc (0.027-70.64 cc) compared to 2.8 cc on CT (0.075-77.95 cc). Interobserver variance and standard deviation were lower in CT than MRI (576.3 vs. 722.2 and 24.0 vs. 26.9, respectively). The level of agreement was fair (kappa=0.36) between CT and MRI. The median GTV volume on 18FDG-PET in five patients was 5.8 cc (0.46-64.17 cc), compared to 4.1 cc on CT (0.99-54.2 cc) (P=0.236). Interobserver variance and standard deviation in CT, MRI, and 18FDG-PET were 576.3 versus 722.2 versus 730.5 and 24 versus 26.9 versus 27.0, respectively. The level of agreement was slight (kappa=0.08) between CT and 18FDG-PET.
Conclusions:
Interobserver variance in non-spine bone metastases was equal when MRI and PET were compared to CT. CT was associated with the lowest variance and standard deviation. Compared to CT GTVs, the GTVs rendered from MRI images had fair agreement, while the GTVs rendered from 18FDG-PET had only slight agreement.
Relevance for Patients:
The delimitation of the treatment volume in non-spine bone metastases with SBRT is important for the results determining its efficacy. It is therefore essential to know the variability and to manage it to achieve the highest quality of treatment.
Keywords: stereotactic body radiotherapy, non-spine bone metastases, contouring, gross tumor volume, variability
1. Introduction
The use of stereotactic body radiotherapy (SBRT) is in constant development. SBRT is a high-precision irradiation technique that allows very high doses to be administered to the tumor in a limited number of fractions, with a highly cytotoxic ablative biological effect and minimal doses to the surrounding healthy tissues [1-3]. This technique is employed in the treatment of tumors of the lung, liver, pancreas, bone, or lymph node metastases, among others, obtaining excellent local control [4,5].
In the radiotherapy planning process, the radiation oncologist defines the irradiation volumes. Dose calculations in external radiotherapy are performed by analysis of computed tomography (CT) images. However, the diagnostic imaging modality that offers the best information on the location and extension of the tumor is not always a CT. On occasions, the best tool for a correct definition of the tumor volume may include magnetic resonance imaging (MRI) or 18fludesoxyglucose positron emission tomography (18FDG-PET), among other imaging techniques [6].
The safety and efficacy of SBRT treatment requires precise localization of the GTV, ensuring local control, and limiting the irradiation of healthy tissue. In bone SBRT, the ideal imaging test for the delineation of non-spine bone tumors have not been established; it seems that MRI may be useful, although the ideal MRI sequence is not clear [7-9]. The aim of this study was to quantify the interobserver variability in gross tumor volume (GTV) delineation in patients with non-spine bone metastases on CT, MRI, and 18FDG-PET by determining the imaging modality with the least interobserver variability.
2. Material and Methods
From January 2019 to December 2019, images of seven patients with ten bone metastases were included in the study. In total, ten CT, ten MRI, and five 18FDG-PET scans were analyzed. The images were transferred, fused to the Pinnacle planner system, and delineated therein. Image fusion was performed with rigid registration, available in the planner, and was consistent for oncologists. No oncologists received assistance from radiologists. The oncologists were not able to visualize the volumes defined by the other study participants. Delineation was performed by six experienced radiation oncologists (mean 8.6 years [5-13 years]). Each image study had at least three contours by three different oncologists. The radiation oncology delineated each image only once. The study was approved by the center’s Institutional Review Board.
2.1. Inclusion/exclusion criteria
In the study, patients with tumors with radiological and in some cases also histological diagnosis were included in the study. Those patients were older than 18 years. Patients included had to have CT and MRI (T1, T2, and diffusion sequences) and/or 18FDG-PET within routine clinical practice with no additional tests required by the study, performed in a time interval of <30 days. In that period, patients did not receive any treatment that could alter tumor morphology in different positions. No direct intervention was performed on the patients.
2.2. Image acquisition
Images were acquired by a Toshiba Aquileon multislice helical CT (64 slices), with a Philips Achieva 1.5 Tesla MRI and Siemens mct biograph 18FDG-PET. In 18FDG-PET images, we used to define tumor SUVmax ≥5 g/mL. CT, MRI, and PET slices were performed every 3 mm. MRI sequences included T1, T2, and diffusion. For the study of contours in MRI, different sequences were included using the one that showed the least variability and compared with CT and PET.
2.3. Image analysis and contouring
The radiation oncologist had the patient’s clinical history and the radiological report corresponding to each test to assist in the delineation of the GTVs, which included the following information: (1) the fusion of the MRI and/or 18FDG-PET and CT; (2) the window level was preset in the most of cases (bone window); (3) the craniocaudal and coronal reconstructions were available in the planner; (4) the radiation oncologist did not comment on or view their colleagues’ contours; and (5) contour of organs at risk was not necessary.
2.4. Statistical analysis
GTV volumes in cc were calculated for each contour group for each patient including minimum, maximum, and median volumes as well as variance and standard deviation. The correlation coefficient gave information on quantifying the strength of the linear relationship between two variables in a correlation analysis. The kappa index was calculated as the ratio of the intersection of the contours delineated for a given observer with the corresponding contours of another observer and their mean. A kappa statistic including Fleiss’ Kappa was used to account for multiple observers [10]. The Landis and Koch interpretation was used for assessment agreement within each group of bone metastasis images. Values from 0.0 to 0.2 indicate slight agreement, 0.21 to 0.40 indicate fair agreement, 0.41 to 0.60 indicate moderate agreement, 0.61 to 0.80 indicate substantial agreement, and 0.81 to 1.0 indicate almost perfect or perfect agreement. GTV volumes comparisons among groups were performed with the student’s t-test. Differences were considered significant when P≤0.05.
To establish the ideal test in each of the cases, the variability index obtained in each of the tests, the correlation coefficient, and the kappa index were evaluated.
3. Results
The mean age was 66 years (range 40-89). The location of bone metastases was pelvis (n=5), extremities (n=1) and skull (n=4). The cases show different characteristics: blastic and lytic metastases, and different primaries (lung, breast, prostate, rectum, urothelial, and cholangiocarcinoma).
The volumes in the different MRI sequences are presented in Table 1.
Table 1. Median tumor volume on MRI sequences.
| Patient | Location | Volume MRI T1 [cc] | Volume MRI T2 [cc] | Volume MRI diffusion [cc] |
|---|---|---|---|---|
| 1-a | Femoral neck | - | 9.46 | 8.9 |
| 1-b | Pelvis | - | 2.62 | 3.03 |
| 1-c | Pelvis | - | 9.56 | 9.3 |
| 2 | Pelvis | 63.39 | 54.8 | 63.12 |
| 3 | Pubis | - | 2.3 | - |
| 4 | Calotte | 0.12 | 0.065 | - |
| 5-a | Left orbit | 0.42 | 0.3 | - |
| 5-b | Clivus | 0.045 | 0.43 | - |
| 6 | Left occipital tubercle | 0.39 | - | - |
| 7 | Calotte | - | 59.14 | 63.46 |
MRI: Magnetic resonance imaging
The median volumes in CT and MRI were 2.8 cc (0.075-77.95 cc) and 3.15 cc (0.027-70.64 cc) in the ten cases, respectively (P=0.25) (Table 2). Interobserver standard deviation was minor in CT than MRI (24 cc vs. 26.9 cc, respectively). Differences were found between CT and MRI with a median of 0.7 cc (0.07-1.55 cc). The median index of kappa indicated fair agreement (0.36) between CT and MRI.
Table 2. Median tumor volume on CT and MRI.
| Patient | Location | Volume CT [cc] | Volume MRI [cc] | Difference (CT-MRI) [cc] | Correlation coefficient |
|---|---|---|---|---|---|
| 1-a | Femoral neck | 8.09 | 8.9 | −0.81 | 0.78 |
| 1-b | Pelvis | 1.05 | 3.03 | −1.98 | 0.41 |
| 1-c | Pelvis | 4.1 | 9.3 | −5.2 | 0.06 |
| 2 | Pelvis | 54.2 | 54.8 | −0.6 | 0.35 |
| 3 | Pubis | 0.99 | 2.3 | −1.31 | 0.1 |
| 4 | Calotte | 0.1 | 0.12 | −0.02 | 0.37 |
| 5-a | Left orbit | 0.37 | 0.3 | 0.07 | 0.99 |
| 5-b | Clivus | 1.03 | 0.43 | 0.6 | 0.99 |
| 6 | Left occipital tubercle | 0.52 | 0.39 | 0.13 | 0.99 |
| 7 | Calotte | 58.01 | 59.14 | −1.13 | 0.98 |
CT: Computed tomography, MRI: Magnetic resonance imaging
In five patients with CT and 18FDG-PET, the median volume was 4.1 cc on CT (range 0.99-54.2 cc) and 5.8 cc (range 0.46-64.17 cc) on 18FDG-PET (P=0.236) (Table 3). Interobserver standard deviation was minor for CT than for MRI and 18FDG-PET (24 cc vs. 26.9 cc vs. 27.02 cc, respectively). Differences were found between CT and 18FDG-PET/CT with a median of 1.7 cc (range 0.04-9.97 cc). The median index of kappa indicated slight agreement (0.08) between CT and 18FDG-PET.
Table 3. Median tumor volume on CT and 18FDG-PET/CT and comparison.
| Patient | Location | Volume CT [cc] | Volume 18FDG-PET [cc] | Difference (CT-PET) [cc] | Correlation coefficient |
|---|---|---|---|---|---|
| 1-a | Femoral neck | 8.09 | 10.49 | −2.4 | 0.46 |
| 1-b | Pelvis | 1.05 | 0.46 | 0.59 | 0.3 |
| 1-c | Pelvis | 4.1 | 5.8 | −1.7 | 0.4 |
| 2 | Pelvis | 54.2 | 64.17 | −9.97 | 0.89 |
| 3 | Pubis | 0.99 | 0.95 | 0.04 | 0.01 |
CT: Computed tomography, 18FDG PET/CT: 18 fludesoxyglucose positron emission tomography/computed tomography
The largest variances and standard deviations were observed in patients 1c, 2, and 7 in CT, patients 1b, 2, and 7 in MRI, and patients 1c and 2 in 18FDG-PET/CT (Figure 1; patient 7). The lowest variability among observers was observed for patient 5 and 6 in CT, 4, 5b, and 6 in MRI, and patient 3 in 18FDG-PET/CT (Table 4). The lowest variability was observed for patient 4 in both CT and MRI. The highest variability among median volumes of the different tests was observed in patient 2 and in patient 7 in all imaging tests. Correlation coefficients were low in the majority of cases.
Figure 1. Patient with metastasis in calotte (CT and MRI sequences) (case number 7).
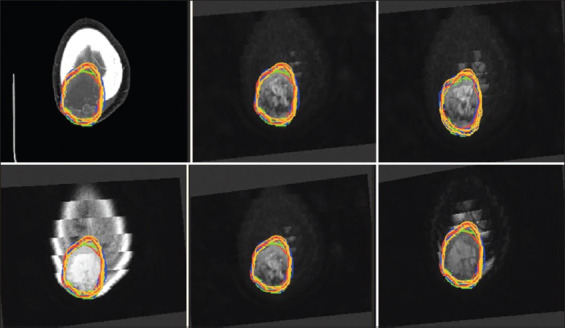
Table 4. Variance and standard deviation of CT, MRI, and 18FDG-PET/CT volumes.
| Patient | CT | MRI | 18FDG-PET | |||
|---|---|---|---|---|---|---|
|
|
|
|
||||
| Variance | Standard deviation | Variance | Standard deviation | Variance | Standard deviation | |
| 1-a | 6.5 | 2.5 | 12.96 | 3.6 | 7.65 | 2.77 |
| 1-b | 1.1 | 1.05 | 17.03 | 4.1 | 1.06 | 1.03 |
| 1-c | 16.2 | 4.03 | 15.5 | 3.9 | 37.2 | 6.1 |
| 2 | 412.8 | 20.3 | 207.4 | 14.4 | 828.03 | 28.8 |
| 3 | 13.8 | 3.71 | 0.4 | 0.6 | 0.06 | 0.25 |
| 4 | 0.001 | 0.03 | 0.0003 | 0.02 | ||
| 5-a | 0.5 | 0.7 | 0.8 | 0.92 | ||
| 5-b | 0.5 | 0.7 | 0.003 | 0.06 | ||
| 6 | 0.02 | 0.14 | 0.01 | 0.1 | ||
| 7 | 59.2 | 7.7 | 18.5 | 4.3 | ||
CT: Computed tomography; MRI: Magnetic resonance imaging; 18 FDG PET/CT: 18fludesoxyglucose positron emission tomography/computed tomography
4. Discussion
Despite the use of different imaging modalities, there is still no clear strategy for volume delineation in non-spine bone SBRT [9].
In bone, the sensitivity of MRI is greater than that of CT. MRI could identify extraosseous disease extension, not requiring cortical destruction or a reactivation process to define the tumor, as demonstrated in a meta-analysis [6]. The most recommended sequence is T1 [11,12], the value of the T2 sequence is not defined. However, MRI is less sensitive than CT for detecting cortical destruction, appearing hypointense in T1 and T2, and its contour is more complex for a radiation oncology.
Prins et al. compared contouring with CT and CT and MRI in patients with bone metastases of renal carcinoma in nine patients with 11 metastases [13]. MRI contouring was better in large lesions compared to CT, being statistically significant. It is concluded that MRI seems to represent the extent of GTV more adequately than CT. CT-only delineation could result in an underestimation of tumor volume. Renal carcinoma metastases seem to be more visible in diffusion being this sequence useful in delineation. Our study demonstrated a larger volume in MRI delineated lesions in most cases as in Prins’ study (Table 1). However, this study includes in its analysis spine bone metastases and a specific histology which could be influencing the results obtained. It is possible that each histology is related to a more appropriate sequence for lesion delineation, as it was observed in the large variability of patient 7, where the lesion was delineated in five MRI sequences and the volumes ranged from 51.9 to 63.9 cc. This could be due to the existence of different cell clones in each of them that make their translation in the image different.
Raman et al. studied the interobserver variability between contouring in CT and MRI in T1 and T2 sequences in ten patients [14]. CT, CT, and MRI in T1, CT, and MRI in T1 and in T2, of six pelvic, two chest, and two shoulder metastases were compared. The authors concluded that the addition of MRI T1 sequence showed advantages in decreasing interobserver variability among radiation oncologists without a significant change in contours contrary to our study, where the lowest variability was observed with CT followed by MRI. Gerlich et al. included that 11 spine and nine non-spine bone metastases delineated with CT alone, MRI alone, and CT and MRI [15]. Treatment volumes were higher and more concordant with MRI unlike in our study which was higher but less concordant, although there were no significant differences among imaging modalities as in our study. In 2020, in a survey with international experts, Nguyen et al. determined the usual clinical practice in non-spine bone metastases, 56% of the respondents used fusion MRI for lesion delineation although its role is still unclear [16]. It is possible that gadolinium dose in the use of MRI helps in lesion delineation as has been reported in a recently published study [17].
Some studies have observed the role of 18FDG-PET in bone lesion delineation [18]. The threshold SUV level and accuracy of this technique for lesion delineation are not defined. In our study, it was the test with the highest interobserver variability and lowest correlation coefficient probably due to these problems.
Some studies have suggested to use a clinical target volume (CTV) to address the possible microscopic extension of the tumor in the static planning image. The magnitude of the expansion to create the CTV could vary depending on the characteristics of the lesion such as its intraosseous or extraosseous extension [16].
MRI protocols for bone lesion delineation tailored to tumor location and histology need to be defined. It is possible that these improvements will facilitate the adequate delineation of lesions. Training programs for resident physicians and radiation oncology practitioners are needed through adequate training programs that include MRI and 18FDG-PET studies.
The study has several limitations such as the number of patients and the absence of a gold standard showing the true extent of the tumor. Another limitation is the use of different MRI sequences and the possibility of changing the window.
5. Conclusions
Interobserver variance in non-spine bone metastases was equal when MRI and PET were compared to CT. CT was associated with the lowest variance and standard deviation. Compared to CT GTVs, the GTVs rendered from MRI images had fair agreement, while the GTVs rendered from 18FDG-PET had slight agreement. Radiation oncologists are not trained in delineation of images produced by MRI and 18FDG-PET as they are in terms of CT images. For this reason, the authors have designed an action plan using a training platform for radiation oncologists. There is a need for standardization and protocols with contouring guidelines for MRI and PET scans, which will become increasingly frequent in clinical practice.
Acknowledgment
None.
Funding
None.
Conflicts of Interest
The authors declare no conflict of interest.
References
- [1].Potters L, Kavanagh B, Galvin JM, Hevezi JM, Janjan NA, Larson DA, et al. American society for therapeutic radiology and oncology (ASTRO) and American college of radiology (ACR) practice guideline for the perfomance of stereotactic body radiation therapy. Int J Radiat Oncol Biol Phys. 2010;76:326–32. doi: 10.1016/j.ijrobp.2009.09.042. [DOI] [PubMed] [Google Scholar]
- [2].Garcia-Barros M, Paris F, Cordon-Cardo C, Lyden D, Rafii S, Haimovitz-Friedman A, et al. Tumor response to radiotherapy regulated by endothelial cell apoptosis. Science. 2003;300:1155–9. doi: 10.1126/science.1082504. [DOI] [PubMed] [Google Scholar]
- [3].Fuks Z, Kolesnick R. Engaging the vascular component of the tumor response. Cancer Cell. 2005;8:89–91. doi: 10.1016/j.ccr.2005.07.014. [DOI] [PubMed] [Google Scholar]
- [4].Tree A, Khoo VS, Eeles RA, Ahmed M, Dearnaley DP, Hawkins MA, et al. Stereotactic body radiotherapy for oligometastases. Lancet Oncol. 2013;14:e28–37. doi: 10.1016/S1470-2045(12)70510-7. [DOI] [PubMed] [Google Scholar]
- [5].Videtic GM. The role of stereotactic radiotherapy in the treatment of oligometastases. Curr Oncol Rep. 2014;16:391. doi: 10.1007/s11912-014-0391-3. [DOI] [PubMed] [Google Scholar]
- [6].Yang HL, Liu T, Wang XM, Xu Y, Deng SM. Diagnosis of bone metastases:A meta-analysis comparing 18FDG PET, CR, MRI and bone scintigraphy. Eur Radiol. 2011;21:2604–17. doi: 10.1007/s00330-011-2221-4. [DOI] [PubMed] [Google Scholar]
- [7].Zimmer WD, Berquist TH, McLeod RA, Sim FH, Pritchard DJ, Shives TC, et al. Bone tumors:Magnetic resonance imaging versus computed tomography. Radiology. 1985;155:709–18. doi: 10.1148/radiology.155.3.4001374. [DOI] [PubMed] [Google Scholar]
- [8].Vanel D. MRI of bone metastases:The choice of the sequence. Cancer Imaging. 2004;4:30–5. doi: 10.1102/1470-7330.2003.0029. [DOI] [PMC free article] [PubMed] [Google Scholar]
- [9].De la Pinta C. SBRT in non-spine bone metastases:A literature review. Med Oncol. 2020;37:119. doi: 10.1007/s12032-020-01442-1. [DOI] [PubMed] [Google Scholar]
- [10].Zijdenbos AP, Dawan BM, Margolin RA, Palmer AC. Morphometric analysis of white matter lesions in MR images:Method and validation. IEEE Trans Med Imaging. 1194;13:716–24. doi: 10.1109/42.363096. [DOI] [PubMed] [Google Scholar]
- [11].Zhou J, Gou Z, Wu R, Yuan Y, Yu G, Zhao Y. Comparison of PSMA-PET/CT, choline-PET/CT, NaF-PET/CT, MRI, and bone scintigraphy in the diagnosis of bone metastases in patients with prostate cancer:A systematic review and meta-analysis. Skeletal Radiol. 2019;48:1915–24. doi: 10.1007/s00256-019-03230-z. [DOI] [PubMed] [Google Scholar]
- [12].Schmidt GP. In Magnetic Resonance Imaging of the Bone Marrow. Berlin, Heidelberg: Springer; 2013. pp. 73–90. [Google Scholar]
- [13].Prins FM, van der Velden JM, Gerlich AS, Kotte A, Eppinga W, Kasperts N, et al. Superior target delineation for stereotactic body radiotherapy of bone metastases from renal cell carcinoma on MRI compared to CT. Ann Palliat Med. 2017;6:S147–54. doi: 10.21037/apm.2017.06.07. [DOI] [PubMed] [Google Scholar]
- [14].Raman S, Chin L, Erler D, Atenafu EG, Cheung P, Chu W, et al. Impact of magnetic resonance imaging on gross tumor volume delineation in non-spine bony metastasis treated with stereotactic body radiation therapy. Int J Radiat Oncol Biol Phys. 2018;102:735–43. doi: 10.1016/j.ijrobp.2018.03.010. [DOI] [PubMed] [Google Scholar]
- [15].Gerlich AS, van der Velden JM, Kotte AN, Tseng CL, Fanetti G, Eppinga WS, et al. Inter-observer agreement in GTV delineation of bone metastases on CT and impact of MR imaging:A multicenter study. Radiother Oncol. 2018;126:534–40. doi: 10.1016/j.radonc.2017.08.030. [DOI] [PubMed] [Google Scholar]
- [16].Nguyen TK, Sahgal A, Dagan R, Eppinga W, Guckenberger M, Kim JH, et al. Stereotactic body radiation therapy for nonspine bone metastases:International practice patterns to guide treatment planning. Pract Radiat Oncol. 2020;10:e452–60. doi: 10.1016/j.prro.2020.02.011. [DOI] [PubMed] [Google Scholar]
- [17].Mouawad M, Biernaski H, Brackstone M, Lock M, Yaremko B, Sexton T, et al. Reducing the dose of gadolinium-based contrast agents for DCE-MRI guided SBRT:The effects on inter and intra observer variability for preoperative target volume delineation in early-stage breast cancer patients. Radiother Oncol. 2019;131:60–5. doi: 10.1016/j.radonc.2018.11.020. [DOI] [PubMed] [Google Scholar]
- [18].Mercier C, Dirix P, Ost P, Billiet C, Joye I, Vermeulen P, et al. A phase III randomized-controlled, single-blind trial to improve quality of life with stereotactic body radiotherapy for patients with painful bone metastases (ROBOMET) BMC Cancer. 2019;19:876. doi: 10.1186/s12885-019-6097-z. [DOI] [PMC free article] [PubMed] [Google Scholar]