

Abstract
Carbonic anhydrases (CAs) are zinc-metalloenzymes that catalyze the interconversion of CO2 and . In heterotrophic organisms, CAs provide for metabolic pathways requiring a carboxylation step. Arabidopsis (Arabidopsis thaliana) has 14 α- and β-type CAs, two of which are plastid CAs designated as βCA1 and βCA5. To study their physiological properties, we obtained knock-out (KO) lines for βCA1 (SALK_106570) and βCA5 (SALK_121932). These mutant lines were confirmed by genomic PCR, RT-PCR, and immunoblotting. While βca1 KO plants grew normally, growth of βca5 KO plants was stunted under ambient CO2 conditions of 400 µL L−1; high CO2 conditions (30,000 µL L−1) partially rescued their growth. These results were surprising, as βCA1 is more abundant than βCA5 in leaves. However, tissue expression patterns of these genes indicated that βCA1 is expressed only in shoot tissue, while βCA5 is expressed throughout the plant. We hypothesize that βCA5 compensates for loss of βCA1 but, owing to its expression being limited to leaves, βCA1 cannot compensate for loss of βCA5. We also demonstrate that βCA5 supplies required for anaplerotic pathways that take place in plastids, such as fatty acid biosynthesis.
Plastid carbonic anhydrase activity supplies the required for anaplerotic pathways occurring in plastids and enables normal growth in Arabidopsis.
Introduction
Carbonic anhydrases (CAs) are ubiquitous in nature, catalyzing the interconversion of CO2 and . While most CAs are zinc metalloenzymes, there are multiple structurally and sequentially distinct families found across many different species. In fact, at least eight different CA families (alpha—iota) have been described, with some of the CAs having structural as well as catalytic functions (Hewett-Emmett and Tashian, 1996; DiMario et al., 2017; Jensen et al., 2020). CAs aid a variety of different biological functions. For example, in mammals, where the internal CO2 concentration is very high (30,000 µL L−1 in air), the CO2 to interconversion acts as a major buffer in the blood. However, plants and many microorganisms operate at ambient levels of CO2 (400 µL L−1 in air). In these organisms, a major function of CAs is to supply CO2 or for various metabolic pathways. Photosynthesis is the best example of a pathway requiring CO2, while reactions in nucleic acid, amino acid and fatty acid biosynthesis all require . Without CAs, these pathways can be starved for carbon. For example, Escherichia coli has two CAs, while Saccharomyces cerevisiae has one CA isoform. Knocking out all the CAs in either E. coli or S. cerevisiae results in strains that can no longer grow on ambient levels of CO2. These CA knock-out (KO) lines can still grow on elevated CO2 levels. Supplementing the S. cerevisiae KO lines with nucleic acids and fatty acids restores growth at ambient levels of CO2 (Aguilera et al., 2005). The synthesis of fatty acids, purines, and pyrimidines all require a carboxylation step. Adding the nucleic or fatty acids allow the yeast to bypass the carboxylation step needed. Hoang and Chapman (2002) also showed that inhibiting CA inhibited lipid biosynthesis in cotton (Gossypium hirsutum) embryos. In the case of lipid biosynthesis, the carboxylation catalyzed by Acetyl-CoA carboxylase (ACCase) is the affected step because the enzyme has low affinity for . The working hypothesis is that CA activity is needed to supply for fatty acid biosynthesis since the Km() is in the range of 1–2 mM (DiMario et al., 2017). At ambient levels of CO2 and pH 7, the concentration would only be 100–200 μM, or well below the Km(). In the absence of CA, the concentration would be reduced even below that level.
Flowering plants possess members of the αCA, βCA, and γCA families (Hewett-Emmett and Tashian, 1996). αCAs are generally monomers with the zinc atom coordinated by three histidine residues and one water molecule organized in a tetrahedral conformation (Liljas et al., 1972). The active unit of the βCA is a dimer where the active site is located at the interface of the two monomers (Kimber and Pai, 2000). In βCAs, the zinc is coordinated by two cysteine residues, one histidine residue, and a water molecule. In contrast, γCAs are trimers that have their active site zinc ion situated at the interface of two subunits coordinated by histidine residues from both subunits (Kisker et al., 1996; Iverson et al., 2000).
The Arabidopsis (Arabidopsis thaliana) genome has eight αCA genes, six βCA genes, and five genes that encode three γCA proteins and two γ-like proteins. The γCA genes are highly expressed, with the γCA proteins and γ-like proteins interacting to form an extra structure on complex I of the mitochondrial electron transport chain (DiMario et al., 2016). In most plant tissues, the αCAs are poorly expressed or are not expressed at all. Only αCA1, αCA2, and αCA3 are expressed in leaf tissue. In contrast, the βCA genes are highly expressed, with the βCA proteins making up as much as 1% of the soluble protein in leaves (Tobin, 1970). The six βCA isoforms are found in several subcellular locations. βCA1 and βCA5 have been localized to the chloroplast (Fabre et al., 2007; Hu et al., 2010), while βCA2, βCA3, and βCA4.2 are found in the cytosol (Fabre et al., 2007; DiMario et al., 2016). The other two βCAs, βCA4.1 and βCA6, have been reported to be localized in the plasma membrane (DiMario et al., 2016) and the mitochondria (Fabre et al., 2007) respectively. However, even though the βCA genes are highly expressed, single KO lines for most of the βCA genes do not display significant growth phenotypes (Medina-Puche et al., 2017). This might be because more than one CA is present in a compartment within the plant cell. For example, βCA2, βCA3, and βCA4.2 are all present in the cytoplasm and reduced growth is only seen if more than one of the proteins are disrupted (DiMario et al., 2016). While most single KO lines do not show a strong growth phenotype, knocking out only the βCA5 gene in Arabidopsis results in stunted, sterile plants when grown on ambient CO2 (Medina-Puche et al., 2017). The purpose of this communication is to report why βCA5 is so important for normal plant growth.
Results
Subcellular location of βCA1 and βCA5
Both βCA1 and βCA5 are predicted to be chloroplast proteins and proteomics data indicate that both βCA1 and βCA5 are found in the chloroplast (Sun et al., 2009). Studies using GFP fusions have also shown that βCA1 and βCA5 are localized to the chloroplast (Fabre et al., 2007). Transient expression assays, however, also indicated that βCA1 might be present on the plasma membrane (Hu et al., 2010). To confirm that βCA1 and βCA5 are both chloroplast proteins, the eGFP coding region was fused to the 3′-end of the βCA1 and βCA5 genomic regions and transformed into Arabidopsis. Protoplasts generated from stably transformed Arabidopsis plants expressing either 35S::βCA1-eGFP or 35S::βCA5-eGFP clearly showed that βCA1 and βCA5 are found in the chloroplast, as the CA-eGFP signals co-localized with the chlorophyll autofluorescence (Figure 1 and Supplemental Figure S1).
Figure 1.

Both βCA1 and βCA5 are chloroplast proteins. Protoplasts from stably—expressing βCA1-eGFP and βCA5-eGFP Arabidopsis lines were imaged using confocal microscopy.
Plants with T-DNA insertions in βCA1 or βCA5 no longer express that CA
Alleles containing T-DNA disruptions to each gene, SALK_106570 for the βca1 line and SALK_121932 for the βca5 line, were obtained from TAIR to determine the effect of βCA1 and βCA5 on plant growth. The SALK_106570 insert is located within the ninth exon of the βCA1 gene, and the SALK_121932 insert is located in the eighth exon of the βCA5 gene (Figure 2A). Genomic polymerase chain reaction (PCR) using βCA1 or βCA5 gene-specific primers was used to confirm the specific T-DNA gene disruptions. In addition, a primer specific to the T-DNA insert was paired with a gene-specific primer to confirm the location of each T-DNA in its respective gene (Supplemental Figure S2A). To confirm that these mutants are T-DNA KO lines, reverse transcription PCR (RT-PCR) was performed (Supplemental Figure S2B). The results indicated that βCA1 and βCA5 transcripts were present in the wild-type but absent in their respective mutant lines. Western blots were also performed using antibodies directed against either Arabidopsis βCA1 and βCA5 (Figure 2B). The βCA1 and βCA5 protein bands were detected at 25.7 and 26.8 kDa, respectively. Figure 2B shows that the βCA1 and βCA5 proteins were missing in their respective mutant lines.
Figure 2.

Arabidopsis lines missing either βCA1, βCA5, or both CAs were constructed. A, Locations of the T-DNA insertions within the βCA1 and βCA5 genes. The βCA1 T-DNA insertion (SALK_106570) is in the ninth exon of the βCA1 gene. The βCA5 T-DNA insertion (SALK_121932) is in the eighth exon of the βCA5 gene. Triangles represent T-DNA insertions and black arrows represent locations of gene specific (F and R) primers and insert (I) primers. Blue boxes and gray lines represent exons and introns, respectively. Red boxes and red arrows represent the 5′ and 3′ UTRs, respectively. cTP, chloroplast transit peptide. B, Western blots were performed using antibodies against βCA1 and βCA5. These two proteins are missing in their respective mutant lines. An SDS-Page gel loaded with the same protein samples and stained with Coomassie blue is shown to the right of each blot.
Growth of the βca5 and βca1βca5 lines is severely reduced at ambient CO2, but not high CO2
Plants missing βCA1 (βca1), βCA5 (βca5), or both CAs (βca1βca5) were compared with the wild-type (Columbia [COL]) when grown at ambient and elevated levels of CO2. The βca5 and βca1βca5 plants grown for 6 weeks at 400 μL L−1 CO2 and an 8-h day length were smaller than both wild-type and βca1 plants (Figure 3A). However, the growth of βca5 and βca1βca5 plants were similar to wild-type and βca1 plants when grown at 30,000 μL L−1 CO2 (Figure 3A). The weekly average above ground fresh weights of the wild-type and βca1 were comparable under all growth conditions, indicating that loss of βCA1 by itself did not affect plant growth (Figure 3C). In contrast, the growth of βca5 and βca1βca5 plants was considerably reduced when grown at 400 μL L−1 CO2 (Figure 3). The poor growth exhibited by the βca5 KO plants was unexpected, as βCA1 is far more abundant in leaf tissue than βCA5. The apparent normal growth of the βca1 KO plants was also notable since βCA1 is so abundant in leaves.
Figure 3.

Plants disrupted in βCA5 showed severely reduced growth at ambient CO2. A, Wild-type (COL), βca1, βca5, and βca1βca5 plants grown under ambient CO2 (400 μL L−1) or high CO2 (30,000 μL L−1) on an 8-h light/16-h dark photoperiod. B, Average plant rosette area at different weeks postgermination when grown in ambient or high CO2 and on an 8-h light/16-h dark photoperiod. C, Average plant fresh weight at different weeks postgermination when grown in ambient or high CO2 and on an 8-h light/16-h dark photoperiod. Error bars represent plus and minus one standard deviation for the means of four plants. There were no substantial differences among the plants grown at high CO2, but the growth of βca5 and βca1βca5 plants was considerably reduced compared with wild-type (COL) and βca1 plants when grown on ambient CO2.
Tissue expression patterns of βCA1 and βCA5
RNA-seq data indicate βCA1 is expressed in shoot tissue while βCA5 is expressed throughout the plant (Figure 4A). RNA-seq studies from a number of research groups show the expression of βCA1 is undetectable in root tissue (Figure 4A; Zhang et al., 2020). βCA1 shows leaf-specific expression similar to the expression pattern of photosystem II manganese stabilizing polypeptide (PsbO). In contrast, βCA5 is expressed in all tissues examined, similar to γCA1 expression (Figure 4A). The expression pattern observed in RNA-seq data was confirmed using GUS expression driven by the βCA1 and βCA5 promoters (Figure 4, B and C). In these assays, GUS expression was very high in leaf tissue when driven by the βCA1 promoter (Figure 4B). However, GUS expression was undetectable in root tissue when driven by the βCA1 promoter (Figure 4C). In contrast, GUS expression was seen in both the roots and shoots when the βCA5 promoter was used (Figure 4, B and C). This expression pattern was further confirmed using antibodies raised against either βCA1 or βCA5 (Supplemental Figure S3, A and B). In these studies, no βCA1 protein was detected in root tissue, but βCA5 was clearly detected in both roots and shoots (Supplemental Figure S3, A and B).
Figure 4.

βCA1 and βCA5 expression patterns. A, RNA-seq reads in roots and leaves for five selected genes. βCA1 is undetectable in root tissue. βCA1 (At3g01500) shows leaf-specific expression like PsbO (At3g50820). In contrast, βCA5 (At4g33580) is expressed in all tissues examined, similar to γCA1 (At1g19580) expression. PHT1 (At5g43350) serves as an example of root-specific expression. Bars represent means of six RNA-seq libraries from http://ipf.sustech.edu.cn/pub/athrna/ (Zhang et al., 2020). FPKM, fragments per kilobase of transcript per million fragments mapped. B, Vegetative tissues of 3-week-old Arabidopsis plants stably transformed with either pβCA1::GUS or pβCA5::GUS. C, Root tissues of 3-week-old Arabidopsis plants stably transformed with either pβCA1::GUS or pβCA5::GUS. The pβCA1::GUS plants show GUS expression only in the rosette leaves, whereas pβCA5::GUS plants show GUS expression in root and shoot meristematic regions and younger leaves.
βCA1 or βCA5 can complement the βca5 plants
The hypothesis that the poor growth exhibited by the βca5 KO plants was due to the loss of CA activity was validated in two ways. First, near-normal growth was restored when the βca5 plants were grown on elevated CO2 (Figure 3A). However, the amount of CO2 required to restore near-normal growth was quite high (30,000 μL L−1). A second confirmation that the reduced growth phenotype of the βca5 mutant was due to the lack of the plastid CAs arises from the observation that normal growth was recovered once a plastid CA was reintroduced into the βca5 plants. Constructs containing the endogenous βCA5 promoter or ubiquitin promoter driving expression of either the βCA1 or βCA5 coding sequence were assembled and transformed into the βca5 line. The genotyping of the complemented plant lines is shown in Supplemental Figure S4, A–C. When βCA5 driven by either a constitutive ubiquitin promoter or the endogenous βCA5 promoter was reintroduced into βca5 plants, normal growth on ambient CO2 was restored (Figure 5). Normal growth was also restored when the βCA1 gene driven by either the constitutive ubiquitin promoter or the endogenous βCA5 promoter was inserted into the βca5 plants (Figure 5). These results indicate that either plastid CA can complement the loss of βCA5, considering that both βCA1 and βCA5 worked when using either the UBI1 or βCA5 promoters.
Figure 5.

Expressing the βCA1 and βCA5 coding regions in βca5 plants restored wild-type growth in ambient CO2. All plants were grown on an 8-h light/16-h dark photoperiod with a light intensity of 120 μmol photons m−2 s−1. The plants labeled “ubi::βCA1” and “ubi::βCA5” are βca5 KO plants transformed with the indicated genes.
Plastid CA activity is needed for fatty acid biosynthesis
Growth and expression studies indicated that a loss of plastid CA activity in root tissue might be the primary reason for the poor growth of the βca5 plants at ambient CO2. This observation is similar to published data with S. cerevisiae, where knocking out CA activity resulted in a mutant line unable to grown in ambient CO2 (Götz et al., 1999). In S. cerevisiae, Aguilera et al. (2005) identified four carboxylation reactions that required high concentrations of . One pathway that requires a carboxylation step is fatty acid biosynthesis, specifically ACCase which has a high Km() of 1–2 mM. ACCase catalyzes the reaction shown in Equation (1) and is known to be located in plastids (Sasaki and Nagano, 2004).
| (1) |
In plastids, the first step of fatty acid synthesis requires ACCase to add to acetyl-CoA to form malonyl-CoA. We hypothesized that lack of CA activity in root plastids limits the carbon availability for ACCase, thus limiting fatty acid synthesis and reducing growth in the βca5 plants. We, therefore, attempted to restore normal growth to βca5 plants by bypassing the ACCase reaction by adding malonate to seedlings growing on agar plates. As can be seen in Figure 6A, malonate considerably stimulated root growth in the βca5 plants. No substantial change in root growth was seen in wild-type plants (Figure 6B).
Figure 6.

Malonate stimulates growth in βca5 plants. A, Growth of βca5 plants was observed on MS media and MS + Tween 80/60 + 2 mM malonate. βca5 plants showed growth improvements on MS + Tween 80/60 + 2 mM malonate in comparison to the MS media. B, Wild-type (COL) plants exhibited normal growth on MS media. No substantial change in root growth was seen in wild-type plants grown on MS + Tween 60/80 + 2mM Malonate. The width and height of each grid square is 1 cm. All plants were grown in ambient CO2 for 10 days.
βCA5 is required for male fertility in Arabidopsis
We observed that male βca5 plants are sterile when grown in ambient CO2. Like roots, βCA1 is not expressed in pollen; however, βCA5 is expressed in pollen (Figure 7). No pollen germination was observed in βca5 mutants when incubated overnight under ambient CO2 (Figure 8A). However, when pollen from βca5 mutants was incubated overnight in high CO2, an average of 60% of pollen grains germinated (observed over three image frames) with an average germ tube length around 50 μm (Figure 8A). For the wild-type, an average of 40% of pollen grains germinated (observed over three image frames) under ambient conditions, with germ tube length around 20 μm (Figure 8B). In high CO2, wild-type pollen germination had increased to 80% with an average germ tube length around 80 μm (Figure 8B). The βca5 pollen’s failure to germinate in ambient air supports the hypothesis that a lack of plastid CA is the cause of the male sterility phenotype.
Figure 7.
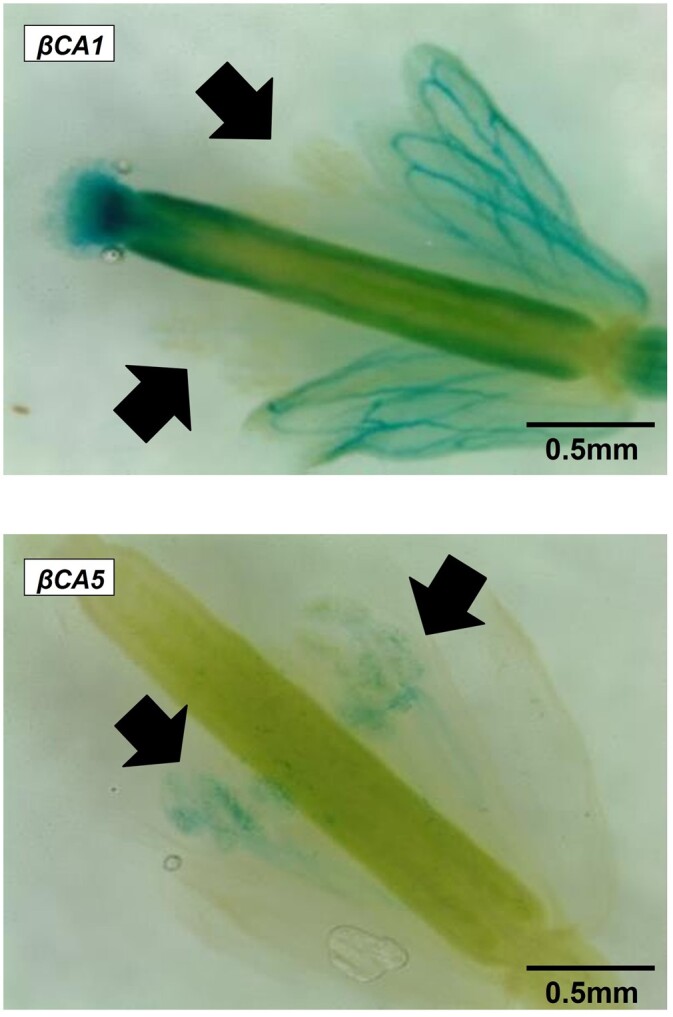
Expression of βCA1 and βCA5 in flowers. βCA1 is not expressed in pollen but βCA5 is expressed in pollen. Arrows point to pollen grains. The plants shown are expressing GUS driven by either the βCA1 or βCA5 promoter as described in the legend of Figure 2.
Figure 8.

Pollen tube germination in βca5 plants increased under high CO2. A, Pollen germination of βca5 mutants was observed in ambient and high CO2 overnight incubations. In ambient air, βca5 mutants showed no pollen germination. However, in high CO2, germination occurred with substantial germination percentage and germ tube lengthening. B, Ambient CO2 germination of the wild-type plant was substantially lower than the high CO2 germination percentages; the same trend is seen in germ tube length. Bars shown for germ tube length represent averages of 30 germination tube lengths; 150 pollen grains were used for the germination tests. Error bars denote standard deviation.
Discussion
In this article, we present evidence that the Arabidopsis βCA1 and βCA5 proteins are predominantly located in plastids. Also, by demonstrating their different expression patterns, we show that these plastid CAs have different physiological functions in the plant. Our data, as well as data from several RNA-seq studies, show the expression of βCA1 to be undetectable in root tissue, while βCA5 is expressed in all tissues (Figure 4). GUS expression driven by the βCA1 and βCA5 promoters was examined to confirm the expression pattern found in RNA-seq data (Figure 4, B and C). When driven by the βCA1 promoter, GUS expression was very high in leaf tissue but undetectable in root tissue. In contrast, GUS expression was seen in both the root and shoot when driven by the βCA5 promoter. This expression pattern was further confirmed using antibodies against βCA1 or βCA5 (Supplemental Figure S3). No βCA1 protein was detected in the root tissue during these studies, but βCA5 was clearly detected in both roots and shoots (Supplemental Figure S3).
The most striking result of this article was the poor growth of the βca5 KO plants when grown at ambient CO2 (Figure 3). We hypothesized that the poor growth exhibited by the βca5 KO plants was due to the loss of CA activity, which was supported by two findings. First, near-normal growth was restored when the βca5 plants were grown in elevated CO2 (Figure 3A). However, a very high level of CO2 (30,000 μL L−1) was required to restore growth. Second, normal growth was recovered once a plastid CA was reintroduced into the βca5 plants. When βCA5 was put back into βca5 plants driven by a constitutive ubiquitin promoter or the βCA5 promoter, normal growth was restored on ambient CO2 (Figure 5). Normal growth was also restored when βCA1 was put back into the plant driven by a constitutive promoter (Figure 5). From these results, it can be inferred that any plastid CA can complement the loss of βCA5 because there was no observational difference in growth phenotype between plants complemented with βCA5 versus βCA1. Either gene worked as long as a constitutive promoter was utilized (UB1 or βCA5). This complementation approach is summarized in Figure 9.
Figure 9.

βca5 complementation model. Inside the root plastids of a wild-type Arabidopsis plant, βCA5 catalyzes the conversion of CO2 to , which is used in lipid biosynthesis. When βCA5 is knocked out, the plant’s growth is stunted on ambient CO2 since βCA5 is not present in the root plastids to catalyze the conversion of CO2 to . If βCA5 or βCA1 (driven by a constitutive promoter) are put back into the βca5 plant, normal growth is restored. βCA5 or βCA1 is present in the root plastids to catalyze the conversion of CO2 to , which restores the plant’s lipid biosynthesis capabilities.
A second surprising result was that the βca1 mutant plants grew like wild-type plants in ambient air. This is notable because βCA1 comprises nearly 1% of all soluble protein in the leaf (Tobin, 1970). Also, βCA1 is expressed at much higher rates than βCA5 in leaves (Figure 4A; Ferreira et al., 2008). Despite such high levels of βCA1 in the leaf, it was the βca5 mutant that showed a drastic growth reduction in ambient air. We hypothesize that it is the differences in tissue expression of βCA1 and βCA5 that explain these results. The lack of expression of βCA1 in roots suggests that root plastids have no CA activity when we eliminate βCA5 expression using gene disruption (Figure 4). This would then cause defects in important anaplerotic pathways requiring a carboxylase step that take place within plastids, like fatty acid biosynthesis. The lack of a plastid CA in the roots, therefore, leads to the very poor growth phenotype of βca5 plants on ambient CO2.
The βca5 growth defect is reminiscent of the poor growth seen in E. coli and S. cerevisiae CA KO lines when grown on air. E. coli and S. cerevisiae cells lacking CA activity also cannot grow on ambient levels of CO2. Only very high levels of CO2 (>20,000 μL L−1) can restore normal growth in these mutants. Aguilera et al. (2005) hypothesized that several biotin-dependent carboxylases involved in both nucleic acid and fatty acid biosynthesis became starved for when CA was deleted in S. cerevisiae. All of these carboxylases have a Km() in the range of 1–2 mM, well above the 200 μM concentration in an aqueous solution in equilibrium with air at pH 7.0. They argued that the CA in the cell replenished the pools and the absence of CA would drive the down even further than the baseline 200 μM concentration. In support of this idea, Aguilera et al. (2005) were able to restore normal growth of the CA-deficient S. cerevisiae cells on air by adding nucleic acids and fatty acids to the growth medium. This experiment strongly supports the idea that the S. cerevisiae CA KO lines were starved for in the absence of CA and were unable to make fatty acids.
In plants, two major metabolic pathways take place in plastids: fatty acid and lipid biosynthesis (Ohlrogge and Browse, 1995). The plant carboxylases required for these pathways also have high Km() (DiMario et al., 2017). ACCase is the enzyme that catalyzes the first committed step of fatty acid biosynthesis, the addition of to acetyl-CoA to make malonyl-CoA. In plants, the Km() of ACCase is near 1.4 mM (Herbert et al., 1996). With the assumptions that the leaf chloroplast stroma CO2 concentration is 12 μM, the pH is 8.2, and equilibrium conditions are met, the stromal concentration would be near 750 μM. This concentration of is well below the Km() of ACCase. Therefore, the presence of a CA near ACCase may assist with ACCase activity by maintaining the plastid concentration. The disparity between plastid concentration and the ACCase Km() is likely to be even greater in the roots. Since roots are not exposed to light, the plastids in root cells do not perform photosynthesis and the pH of the plastid stroma is expected to be closer to neutral. Assuming the root plastid stroma is at equilibrium, the concentration will be much lower than it is in leaf chloroplasts and the lack of a CA interacting with ACCase will be even more problematic. Indeed, the root systems of βca5 plants are much smaller than the root systems of wild-type plants (Figure 6), which is consistent with this proposed role for βCA5.
Hoang and Chapman (2002) provided evidence that CA is needed for lipid biosynthesis in both cotton embryos and tobacco (Nicotiana tabacum) cell suspension. In their work, they inhibited CA using a variety of sulfonamides, with ethoxyzolamide being the most effective. They also identified cDNAs encoding plastid-targeting CAs from the nonphotosynthetic cotyledon library. They found that lipid biosynthesis was severely inhibited in cotton embryos and tobacco cell suspensions treated with the membrane-permeant sulfonamide ethoxyzolamide. Thus, lipid biosynthesis is associated with availability in bacteria, fungi, animals (Lynch et al., 1995), and plants.
Growing βca5 plants with supplemented malonate, which bypasses the ACCase step of lipid synthesis, improved root growth of these mutant lines (Figure 6). It is speculated that malonate can be converted to malonyl-CoA by a homolog of malonyl-CoA synthetase found in Arabidopsis (Baud et al., 2004). This possible bypass of the ACCase step was demonstrated by Baud et al. (2004) where they found that malonate added exogenously can partially compensate for the loss of cytosolic ACCase in Arabidopsis. We too were able to partially compensate for the loss of plastid CA by adding malonate to germinating mutant plants.
While doing crosses, we noticed that male βca5 plants were sterile, which agrees with the findings in Medina-Puche et al. (2017). When pollen germination was examined, we found that βca5 mutants were unable to put up pollen tubes under ambient CO2, but demonstrated enhanced pollen germination and tube growth on elevated CO2. In fact, the plants could be selfed if kept on very high CO2 (30,000 μL L−1 in air) for their entire life cycle. Thus, our work suggests the functional importance of plastid CAs βCA1 and βCA5, especially in fatty acid biosynthesis and pollen fertility.
The growth patterns of the Arabidopsis CA KO lines reported here differ from the observations reported by Hines et al. (2021) using tobacco. In their work, plants missing only βCA1 or only βCA5 grew normally. However, if both CA genes were disrupted, the Nicotiana benthamiana plants grew very poorly, similar to our observations with Arabidopsis. Hines et al. (2021) hypothesized that lipid production was disrupted in the double mutant after finding differences in lipid patterns. The differences between their results and our data are likely due to differences between N. benthamiana and Arabidopsis in the tissue expression patterns of the two CAs. While Hines et al. (2021) did not report on the expression patterns of βCA1 or βCA5, it is reasonable to assume that both βCA1 and βCA5 are made in most or all tissues in N. benthamiana since either single mutant still grew normally. The fact that N. benthamiana is tetraploid makes it even more likely that both of the CAs are expressed in all tissues and that the activities of βCA1 and βCA5 are redundant in N. benthamiana. In Arabidopsis, the poor growth on ambient CO2 is observed in the βca5 plants because βCA1 is not made in all tissues. Our results are also consistent with earlier RNA antisense studies where researchers lowered the expression of the chloroplastic βCA1 (Majeau et al., 1994; Price et al., 2004; Ferreira et al., 2008). These earlier studies reported normal growth and carbon assimilation rates in plants with reduced βCA1. If these earlier studies had targeted βCA5 as well as βCA1, they likely would have found that the double knock-down plants had poor growth on ambient CO2. These earlier studies are consistent with the hypothesis that βCA5 can compensate for the loss of βCA1 and that only a relatively low amount of CA activity is required to support plant development.
A major takeaway from our results is that βCA1 and βCA5 proteins have markedly different functions within the plant. This idea is supported by the different tissue expression patterns of βCA1 and βCA5, as seen with both RNA-seq data and the GUS experiment (Figure 4). The developmental defects that occur when βCA5 is knocked out suggest that this enzyme is linked to anaplerotic pathways, supporting the Hoang and Chapman (2002) hypothesis that CA is needed for lipid biosynthesis. If lipid synthesis is reduced, cell division would be considerably impaired since there may not be sufficient lipids for the plasma membranes of dividing cells. This could limit the development of some plant tissues, such as roots and pollen tubes.
Materials and methods
Plant lines and growth conditions
All Arabidopsis (A. thaliana) wild-type and T-DNA plants used in this work are of the COL ecotype. These plants were grown under ambient (400 μL L−1 CO2) and 3% (30,000 μL L−1) CO2 in 24-h light at an intensity of 100 μmol photons m−2 s−1. All plants used in growth studies were watered every other day, alternating between distilled H2O (dH2O) and a 1:3 dilution of Hoagland’s nutrient solution in distilled H2O (Epstein and Bloom, 2005). Plants were grown in 9 cm × 7.5 cm pots. Sun grow professional growing mixture (METRO MIX 830) was used as the potting media. For growth studies, plants were grown on either ambient or 30,000 μL L−1 CO2 with 100 μmol photons m−2 s−1 light intensity under short days (8-h light).
GUS, eGFP vector construction
Amplicons for pENTR Gateway construction were generated using Phusion polymerase (New England Biolabs, Ipswich, Massachusetts, USA). Primers for amplifying the coding regions and promoter regions from βCA1 (At3g01500) and βCA5 (At4g33580) were designed using Integrated DNA Technologies primer design tools and were generated by Integrated DNA Technologies (Supplemental Table S1). PCR fragments were gel purified using the Qiaquick Gel Extraction kit (Qiagen, Hilden, Germany). About 1–2 μL of purified PCR product was added to a pENTR master mix (1 μL of a 1.2 M NaCl and 0.06 M MgCl2 mix [Invitrogen, Waltham, Massachusetts, USA], 1 μL pENTR/dTOPO vector mix [Invitrogen], and dH2O [Invitrogen] to final volume of 6 μL) for pENTR vector construction. Vectors were transformed into E. coli TOP10 chemically competent cells (Thermo Fisher Scientific, Plaquemine, LA) and plated onto YEP plates (for 1 L:10 g peptone, 5 g NaCl, 10 g yeast extract, 15 g agar) supplemented with 50 μg mL−1 kanamycin. pENTR vectors were subjected to restriction digestion and sequencing to confirm the correct orientation and sequence of the construct. eGFP amplicons were recombined into the pDEST vector pB7FWG2 (Karimi et al., 2002) and GUS amplicons were recombined into the pDEST vector pKGWFS7 (Karimi et al., 2002). The correct orientation of the pDEST vector was confirmed via restriction digestion.
Constructs used for the complementation studies were assembled using the Golden Gate modular cloning system (Weber et al., 2011; Patron et al., 2015). Linear Level 0 gene fragments (promoters, coding regions, and terminators) were synthesized by Twist Biosciences (San Francisco, California, USA) with defined Golden Gate compatible overhangs and cloned via traditional digestion and ligation into Golden Gate compatible acceptor plasmids. Next, Level 1 constructs were generated to express the βCA1 or βCA5 genes under the control of the desired promoters. Finally, Level 1 constructs were assembled into Level 2 constructs to include a constitutively expressed BASTA resistance cassette. Correct assembly of Level 2 backbones was confirmed via restriction digestion.
Agrobacterium tumefaciens transfection and screening of transformants
Stable eGFP, GUS, and complementation lines were created following a modified procedure (Weigel and Glazebrook, 2002). A total of 200 μL of transformed A. tumefaciens was used to inoculate 200 mL of LB medium supplemented with antibiotics (30 μg mL−1 gentamycin and 10 μg mL−1 rifampicin for A. tumefaciens helper plasmids and either 100 μg mL−1 spectinomycin for the eGFP and GUS vectors or 50 μg mL−1 kanamycin for the complementation vector). The cultures were grown overnight at 28°C with vigorous shaking, and cells were pelleted in the morning by centrifugation at 7,250 rcf for 10 min at 20°C using a Beckman J2-HS centrifuge and JA-10 rotor. Pelleted cells were resuspended in 400 mL of A. tumefaciens infiltration medium (one-half-strength Murashige and Skoog [MS] medium with Gamborg’s vitamins from Caisson Laboratories, 5% [w/v] Suc, 0.044 μM benzylaminopurine suspended in dimethyl sulfoxide, and 50 μL L−1 Silwet L-77 from Lehle Seeds). Stalks with flowers of Arabidopsis plants were dipped in the A. tumefaciens infiltration medium for ∼40 s and then laid sideways in a flat with a covered dome to recover overnight, incubating in constant light at 21°C (Weigel and Glazebrook, 2002). Positive transformants were selected on soil by spraying seedlings with a 1:1,000 dilution of BASTA (AgrEvo).
RNA-seq analysis
RNA-seq reads in roots and leaves were analyzed for five selected genes. The genes included βCA1 (At3g01500) and βCA5 (At4g33580). For comparison of expression patterns, PsbO (At3g50820) was chosen as a leaf-specific gene, gamma CA1 (γCA1) (At1g19580) for its constitutive expression, and phosphate transporter 1 (PHT1) (At5g43350) served as an example of root-specific expression. In all cases, the same six libraries were used, each one a COL wild-type control study. Bars represent means of six RNA-seq libraries from http://ipf.sustech.edu.cn/pub/athrna/ (Zhang et al., 2020).
Histochemical GUS staining
GUS staining was visualized following a modified protocol of Jefferson et al. (1987). Plants and inflorescences were submerged in a GUS staining solution (0.1 M NaPO4 pH 7, 10 mM EDTA, 0.1% [v/v] Triton X-100, 1 mM K3Fe(CN)6, 2 mM 5-bromo, 4-chloro, 3-indolβ-d-glucuronic acid [X-Gluc, from GoldBio] suspended in N,N-dimethylformamide) and were placed in a 37°C incubator in the dark overnight. The following morning, plants were taken out of the incubator and the GUS staining solution was aspirated. Plant tissues were incubated in 100% (v/v) methanol at 60°C for 15 min repeatedly until all chlorophyll was removed.
Protoplast preparation and eGFP visualization
Following the protocol of Wu et al. (2009), 2 g of leaf tissue was incubated in 10 mL of enzyme solution (1% [w/v] cellulase from Trichodermaviride [Sigma, St. Louis, Missouri, USA], 0.25% [w/v] pectinase from Rhizopus spp. [Sigma], 0.4 M mannitol, 10 mM CaCl2, 20 mM KCl, 0.1% [w/v] bovine serum albumin, and 20 mM MES at pH 5.7) for 1 h in light after placing Time Tape on the upper epidermis of the leaves and removing the lower epidermis of the leaves via Magic Tape. Protoplasts were then pelleted by centrifugation at 73 rcf for 3 min at 4°C using a Beckman J2-HS centrifuge and JS-13.1 rotor. Protoplasts were resuspended in a solution containing 0.4 M mannitol, 15 mM MgCl2, and 4 mM MES at pH 5.7. eGFP fluorescence was visualized using protoplasts and leaves from stable eGFP plants with a Leica SP2 confocal microscope. The white light laser was used with 5% laser power and smart gain was adjusted to 100%. A 40× oil-emersion lens was used to visualize protoplasts and a 20× objective lens was used to visualize intact cells from leaf samples. eGFP and chlorophyll were excited using a krypton/argon laser tuned to 488 nm, and eGFP and chlorophyll fluorescence were observed between the wavelengths of 500–520 nm and 660–700 nm, respectively.
Genotyping T-DNA lines using genomic PCR and RT-PCR
DNA for genomic PCR was isolated from Arabidopsis leaves ground with a mortar and pestle and incubated in Edward’s extraction buffer (200 mM Tris–Cl, pH 7.5, 250 mM NaCl, 25 mM EDTA, and 0.5% [w/v] SDS). DNA was precipitated using 100% (v/v) isopropanol followed by 70% (v/v) ethanol washes. Primers used can be found in Supplemental Table S1. RNA for reverse transcription was isolated from 80 mg of leaf tissue from 6-week-old Arabidopsis plants grown in low CO2 and short days using the Qiagen RNeasy Plant minikit. Three micrograms of RNA were used for the reverse transcription reaction, and cDNA was generated using the SuperScript First-Strand RT-PCR kit and protocol (Invitrogen). cDNA at 0.5 μL was used for a 25-μL PCR using the standard protocol for One Taq (New England Biolabs). Primers used can be found in Supplemental Table S1.
Rosette area and fresh weight measurements
Images of plant lines were taken weekly, and rosette areas were measured by tracing the outlines of the plants and obtaining the projected rosette area within each outline in ImageJ (National Institutes of Health). Rosette areas were measured on three plants per line. Fresh weights of above-ground plant mass were measured every week for each plant line for 5 weeks. Three plants per line were used for fresh weight analysis.
Immunoblots
About 50 mg of leaf tissue was placed in a sterile 1.5 mL microcentrifuge tube and ground using a sterile plastic pestle. About 132 μL of protein extraction buffer (1× TE, 1.2% [w/v] SDS, 2.7% [w/v] sucrose, and 7.5 μg mL−1 bromophenol blue) was added to the ground leaf tissue. Samples were vortexed and incubated on ice for 15 min before being centrifuged at 14,269 rcf for 5 min at 25°C using a benchtop centrifuge. The supernatant was collected and placed in a new sterile 0.5 mL microcentrifuge tube whereas the pellet was discarded. Protein concentrations were quantified using the Bradford protein assay kit (Pierce). 2-Mercaptoethanol was added to a final concentration of 350 mM and then samples were incubated at 100°C for 3 min. About 20 μg of total protein was added to a 12% polyacrylamide gel and proteins were electrophoresed (Bio-Rad, Hercules, California, USA) before being transferred to a PVDF membrane (Bio-Rad) using the Semi-Dry system. The membrane was blocked in TBSB (TBS containing 0.1% [v/v] Tween [TTBS] and 1% [w/v] bovine serum albumin) for 1 h at 4°C and treated with primary antibody directed against Arabidopsis βCA1 (Proteintech Group) at a final dilution of 1:20,000 and βCA5 antibody (Agrisera, Vännäs, Sweden) at a final dilution of 1:10,000. These membranes were allowed to incubate overnight at 4°C. The following morning, the membrane was washed five times with TTBS before being placed in a TBSB solution containing a Bio-Rad goat anti-rabbit secondary antibody at a final dilution of 1:20,000. The membrane was allowed to incubate at room temperature for 1 h and was then washed five times with TTBS. A BioRad chemiluminescence instrument was used to observe the protein bands.
Seeds growing on malonate
To test the effect of malonate on Arabidopsis plant growth, sterilized wild-type and βca5 seeds were placed on MS agar plates, MS + sodium malonate (2 mM) + Tween-60, and Tween-80 (final concentration of 300 μM). Tween-60 and Tween-80 were used in this experiment as a detergent that increases the malonate uptake. Growth of these seedlings was examined after 14 days of germination.
Pollen tube germination
Three inflorescences from each plant type (wild-type and βca5) were cut and left to air dry for 10 min. In a sterile hood, two square plates were prepared with a Kimwipe and 700 μL of sterilized water to emulate a humid environment suitable for pollen germination. MS media was prepared with 10 g/100 mL sucrose, 0.01 g/100 mL boric acid, 0.011 g/100 mL calcium nitrate, 0.43 g/100 mL MS salts + nutrients, and 1 g/100 mL agarose and adjusted to a pH of 6.0. Each plate contained a three-well plate in which 600 uL of MS media was added. The first well was used as the negative control, the second well contained pollen grains extracted from wild-type plants, and the final well contained pollen grains extracted from βca5 plants. Pollen grains were extracted by dipping the inflorescences of the plant into the media of the well. Plates were incubated under ambient (400 μL L−1 CO2) and 3% (30,000 μL L−1) CO2.
Accession numbers
βCA1 and βCA5 can be found in GenBank under the accession numbers AT3G01500 and AT4G33580.
Supplemental data
The following materials are available in the online version of this article.
Supplemental Figure S1. Additional images of βCA1 and βCA5 localization in protoplasts.
Supplemental Figure S2. Arabidopsis lines missing βCA1, lines missing βCA5, and lines missing both βCA1 and βCA5.
Supplemental Figure S3. Immunoblots showing βCA1 and βCA5 expression in roots and shoots.
Supplemental Figure S4. βCA5 is missing in βca5 plants, while βCA1 and βCA5 are present in their respective complemented lines.
Supplemental Table S1. List of primers used in this study.
Supplementary Material
Acknowledgments
We thank David Burk from the Shared Instrumentation Facility at LSU for help with the confocal microscopy.
Funding
This work was supported by the Realizing Improved Photosynthetic Efficiency (RIPE) initiative awarded to J.V.M. by the University of Illinois, USA. RIPE is made possible through support from the Bill & Melinda Gates Foundation, FFAR, and FCDO, grant OPP1172157.
Conflict of interest statement. None declared.
Contributor Information
Hiruni N Weerasooriya, Department of Biological Sciences, Louisiana State University, Baton Rouge, Louisiana 70803, USA.
Robert J DiMario, School of Biological Sciences, Washington State University, Pullman, Washington 99164, USA.
Viviana C Rosati, Department of Biology, Centre for Novel Agricultural Products (CNAP), University of York, York YO10 5DD, UK.
Ashwani K Rai, Department of Biological Sciences, Louisiana State University, Baton Rouge, Louisiana 70803, USA.
Lillian M LaPlace, Department of Biological Sciences, Louisiana State University, Baton Rouge, Louisiana 70803, USA.
Victoria D Filloon, Department of Biological Sciences, Louisiana State University, Baton Rouge, Louisiana 70803, USA.
David J Longstreth, Department of Biological Sciences, Louisiana State University, Baton Rouge, Louisiana 70803, USA.
James V Moroney, Department of Biological Sciences, Louisiana State University, Baton Rouge, Louisiana 70803, USA.
H.N.W., R.J.D., V.C.R., D.J.L., and J.V.M. designed the research. H.N.W., R.J.D., V.C.R., A.K.R., L.M.L., and V.D.F. performed the research. H.N.W., D.J.L., and J.V.M. analyzed the data. H.N.W. and J.V.M. wrote the manuscript. All authors contributed to the approval of the final manuscript.
The author responsible for distribution of materials integral to the findings presented in this article in accordance with the policy described in the Instructions for Authors (https://academic.oup.com/plphys/pages/general-instructions) is: James Moroney (btmoro@lsu.edu).
References
- Aguilera J, Van Dijken JP, De Winde JH, Pronk JT (2005) Carbonic anhydrase (Nce103p): an essential biosynthetic enzyme for growth of Saccharomyces cerevisiae at atmospheric carbon dioxide pressure. Biochem J 391: 311–316 [DOI] [PMC free article] [PubMed] [Google Scholar]
- Baud S, Bellec Y, Miquel M, Bellini C, Caboche M, Lepiniec L, Faure JD, Rochat C (2004) Gurke and pasticcino3 mutants affected in embryo development are impaired in acetyl-CoA carboxylase. EMBO Rep 5: 515–520 [DOI] [PMC free article] [PubMed] [Google Scholar]
- DiMario RJ, Quebedeaux JC, Longstreth DJ, Dassanayake M, Hartman MM, Moroney JV (2016) The cytoplasmic carbonic anhydrases βca2 and βca4 are required for optimal plant growth at low CO2. Plant Physiol 171: 280–293 [DOI] [PMC free article] [PubMed] [Google Scholar]
- DiMario RJ, Clayton H, Mukherjee A, Ludwig M, Moroney JV (2017) Plant carbonic anhydrases: structures, locations, evolution, and physiological roles. Mol Plant 10: 30–46 [DOI] [PMC free article] [PubMed] [Google Scholar]
- Epstein E, Bloom AJ (2005) Mineral Nutrition of Plants: Principles and Perspectives, Ed 2. Sinauer Associates, Sunderland. p 31 [Google Scholar]
- Fabre N, Reiter IM, Becuwe-Linka N, Genty B, Rumeau D (2007) Characterization and expression analysis of genes encoding alpha and beta carbonic anhydrases in Arabidopsis. Plant Cell Environ 30: 617–629 [DOI] [PubMed] [Google Scholar]
- Ferreira FJ, Guo C, Coleman JR (2008) Reduction of plastid-localized carbonic anhydrase activity results in reduced Arabidopsis seedling survivorship. Plant Physiol 147: 585–594 [DOI] [PMC free article] [PubMed] [Google Scholar]
- Götz R, Gnann A, Zimmermann FK (1999) Deletion of the carbonic anhydrase-like gene NCE103 of the yeast Saccharomyces cerevisiae causes an oxygen-sensitive growth defect. Yeast 15: 855–864 [DOI] [PubMed] [Google Scholar]
- Herbert D, Price LJ, Alban C, Dehaye L, Job D, Cole DJ, Pallett KE, Harwood JL (1996) Kinetic studies on two isoforms of acetyl-CoA carboxylase from maize leaves. Biochem J 318: 997–1006 [DOI] [PMC free article] [PubMed] [Google Scholar]
- Hewett-Emmett D, Tashian RE (1996) Functional diversity, conservation, and convergence in the evolution of the alpha-, beta-, and gamma-carbonic anhydrase gene families. Mol Phylogenet Evol 5: 50–77 [DOI] [PubMed] [Google Scholar]
- Hines KM, Chaudhari V, Edgeworth KN, Owens TG, Hanson MR (2021) Absence of carbonic anhydrase in chloroplasts affects C(3) plant development but not photosynthesis. Proc Natl Acad Sci USA 118: e2107425118. [DOI] [PMC free article] [PubMed] [Google Scholar]
- Hoang CV, Chapman KD (2002) Regulation of carbonic anhydrase gene expression in cotyledons of cotton (Gossypium hirsutum L.) seedlings during post-germinative growth. Plant Mol Biol 49: 449–458 [DOI] [PubMed] [Google Scholar]
- Hu H, Boisson-Dernier A, Israelsson-Nordström M, Böhmer M, Xue S, Ries A, Godoski J, Kuhn JM, Schroeder JI (2010) Carbonic anhydrases are upstream regulators of CO2-controlled stomatal movements in guard cells. Nat Cell Biol 12: 87–93 [DOI] [PMC free article] [PubMed] [Google Scholar]
- Iverson TM, Alber BE, Kisker C, Ferry JG, Rees DC (2000) A closer look at the active site of gamma-class carbonic anhydrases: high-resolution crystallographic studies of the carbonic anhydrase from Methanosarcina thermophila. Biochemistry 39: 9222–9231 [DOI] [PubMed] [Google Scholar]
- Jefferson RA, Kavanagh TA, Bevan MW (1987) GUS fusions: beta-glucuronidase as a sensitive and versatile gene fusion marker in higher plants. EMBO J 6: 3901–3907 [DOI] [PMC free article] [PubMed] [Google Scholar]
- Jensen EL, Maberly SC, Gonterro B (2020) Insights on the functions and ecophysiological relevance of the diverse carbonic anhydrases in microalgae. Int J Mol Sci 21: 2922. [DOI] [PMC free article] [PubMed] [Google Scholar]
- Karimi M, Inzé D, Depicker A (2002) GATEWAY™ vectors for Agrobacterium-mediated plant transformation. Trends Plant Sci 7: 193–195 [DOI] [PubMed] [Google Scholar]
- Kimber MS, Pai EF (2000) The active site architecture of Pisum sativum beta-carbonic anhydrase is a mirror image of that of alpha-carbonic anhydrases. EMBO J 19: 1407–1418 [DOI] [PMC free article] [PubMed] [Google Scholar]
- Kisker C, Schindelin H, Alber BE, Ferry JG, Rees DC (1996) A left-hand beta-helix revealed by the crystal structure of a carbonic anhydrase from the archaeon Methanosarcina thermophila. EMBO J 15: 2323–2330 [PMC free article] [PubMed] [Google Scholar]
- Liljas A, Kannan KK, Bergstén PC, Waara I, Fridborg K, Strandberg B, Carlbom U, Järup L, Lövgren S, Petef M (1972) Crystal structure of human carbonic anhydrase C. Nat New Biol 235: 131–137 [DOI] [PubMed] [Google Scholar]
- Lynch CJ, Fox H, Hazen SA, Stanley BA, Dodgson S, Lanoue KF (1995) Role of hepatic carbonic anhydrase in de novo lipogenesis. Biochem J 310: 197–202 [DOI] [PMC free article] [PubMed] [Google Scholar]
- Majeau N, Arnoldo MA, Coleman JR (1994) Modification of carbonic anhydrase activity by antisense and over-expression constructs in transgenic tobacco. Plant Mol Biol 25: 377–385 [DOI] [PubMed] [Google Scholar]
- Medina-Puche L, Castelló MJ, Canet JV, Lamilla J, Colombo ML, Tornero P (2017) β-carbonic anhydrases play a role in salicylic acid perception in Arabidopsis. PLoS ONE 12: e0181820. [DOI] [PMC free article] [PubMed] [Google Scholar]
- Ohlrogge J, Browse J (1995) Lipid biosynthesis. Plant Cell 7: 957–970 [DOI] [PMC free article] [PubMed] [Google Scholar]
- Patron NJ, Orzaez D, Marillonnet S, Warzecha H, Matthewman C, Youles M, Raitskin O, Leveau A, Farré G, Rogers C, et al. 2015. Standards for plant synthetic biology: a common syntax for exchange of DNA parts. New Phytol 208: 13–19 [DOI] [PubMed] [Google Scholar]
- Price GD, Caemmerer SV, Evans JR, Yu JW, Lloyd JM, Oja V, Kell P, Harrison K, Gallagher A, Badger MR (2004) Specific reduction of chloroplast carbonic anhydrase activity by antisense RNA in transgenic tobacco plants has a minor effect on photosynthetic CO2 assimilation. Planta 193: 331–340 [Google Scholar]
- Sasaki Y, Nagano Y (2004) Plant acetyl-CoA carboxylase: structure, biosynthesis, regulation, and gene manipulation for plant breeding. Biosci Biotechnol Biochem 68: 1175–1184 [DOI] [PubMed] [Google Scholar]
- Sun Q, Zybailov B, Majeran W, Friso G, Olinares PDB, van Wijk KJ (2009) PPDB, the plant proteomics database at Cornell. Nucl Acids Res 37: D969–D974. [DOI] [PMC free article] [PubMed] [Google Scholar]
- Tobin AJ (1970) Carbonic anhydrase from parsley leaves. J Biol Chem 245: 2656–2666 [PubMed] [Google Scholar]
- Weber E, Engler C, Gruetzner R, Werner S, Marillonnet S (2011) A modular cloning system for standardized assembly of multigene constructs. PLoS ONE 6: e16765. [DOI] [PMC free article] [PubMed] [Google Scholar]
- Weigel D, Glazebrook J (2002) How to transform Arabidopsis. In D Brown, S Schaefer, eds, Arabidopsis A Laboratory Manual. Cold Spring Harbor Laboratory Press, Cold Spring Harbor, NY, pp 119–141 [Google Scholar]
- Wu Y, Suhasini AN, Brosh RM Jr (2009) Welcome the family of FANCJ-like helicases to the block of genome stability maintenance proteins. Cell Mol Life Sci 66: 1209–1222 [DOI] [PMC free article] [PubMed] [Google Scholar]
- Zhang H, Zhang F, Yu Y, Feng L, Jia J, Liu B, Li B, Guo H, Zhai J (2020) A comprehensive online database for exploring ∼20,000 public Arabidopsis RNA-seq libraries. Mol Plant 13: 1231–1233 [DOI] [PubMed] [Google Scholar]
Associated Data
This section collects any data citations, data availability statements, or supplementary materials included in this article.