

Abstract
We describe a framework for calculating the frequency shift and uncertainty of trapped-ion optical atomic clocks caused by background-gas collisions, and apply this framework to an 27Al+ clock to enable a total fractional systematic uncertainty below 10−18. For this clock, with 38(19) nPa of room-temperature H2 background gas, we find that collisional heating generates a non-thermal distribution of motional states with a mean time-dilation shift of order 10−16 at the end of a 150 ms probe, which is not detected by sideband thermometry energy measurements. However, the contribution of collisional heating to the spectroscopy signal is highly suppressed and we calculate the BGC shift to be −0.6(2.4) × 10−19, where the shift is due to collisional heating time dilation and the uncertainty is dominated by the worst case ±π/2 bound used for collisional phase shift of the 27Al+ superposition state. We experimentally validate the framework and determine the background-gas pressure in situ using measurements of the rate of collisions that cause reordering of mixed-species ion pairs.
I. INTRODUCTION
Background-gas collisions (BGCs) are a leading source of systematic frequency shifts and uncertainty in many of the most accurate microwave fountain [1–3], optical lattice [4–6], and trapped-ion [7–10] atomic clocks. Both lattice and trapped-ion optical clocks, in particular, report fractional uncertainties at the low 10−18 level with BGCs contributing at the mid 10−19 level. Further improvements to the systematic uncertainties of optical clocks will require either reduced background-gas (BG) pressures or more accurate evaluations of the BGC shift.
The frequency of atomic clocks is affected by BGCs in two distinct ways: they change the motional state distribution, which modifies the time dilation (i.e., second-order Doppler) shift; and they change the phase of the atomic superposition state due to interactions during the collision. Previous evaluations of the systematic uncertainty due to BGCs in trapped-ion optical clocks have focused on the collisional phase shift [7–14] and implicitly assumed that the time-dilation shift due to collisional heating is captured by measurements of secular motion heating using sideband thermometry [15]. This treatment might be adequate when there is continuous sympathetic cooling of the clock ions during the spectroscopy pulses [10], but here we show that collisions with BG molecules in the absence of cooling generate a nonthermal distribution of motional Fock states with a mean energy that can be significantly larger than the Doppler limit. Sideband thermometry is known to underestimate the mean energy of motional state distributions with superthermal tails [16]. Thus, time dilation due to collisional heating may not have been fully included in previous clock evaluations.
At large separations R, the interaction potential between a polarizable neutral molecule and an ion is given by V (R) = −αQ2/(8πϵ0R4), independent of the internal state of the ion. Here α is the static polarizability of the molecule [17], Q is the charge of the ion, and ϵ0 is the vacuum permittivity [18]. For small impact parameters, in the classical picture this potential leads to Langevin collision trajectories in which the molecule spirals in towards the ion. At small separations R, the interaction potential is different for the ground and excited states of the clock transition, leading to a phase shift for Langevin collision events. For large impact parameter events, the centrifugal barrier exceeds the kinetic energy and the short-range potential is not sampled, so the phase shift is negligible. However, for both Langevin and glancing collisions the BG molecule trajectory is deflected leading to heating of the ion.
In this paper, we present a theoretical calculation of the motional-state distribution of trapped ions that experience BGCs in an ultra-high-vacuum (UHV) environment, with focus placed on 27Al+ quantum-logic clocks. Next, we experimentally validate this calculation by measuring the reorder rate of a mixed species 40Ca+−27Al+ ion pair as a function of the potential barrier between the two orders. Our collision kinematics model agrees with the measurements over the range of experimentally accessible reorder energy barriers. Finally, we evaluate the BGC shift for the 25Mg+−27Al+ clock described by Brewer et al. [19] using a Monte Carlo simulation of the clock interrogation including motional heating and phase shifts of the 27Al+ ion due to BGCs.
II. COLLISION KINEMATICS MODEL
In the following, we consider collisions of H2, the dominant gas in room-temperature UHV systems, with 25Mg+−27Al+ or 40Ca+−27Al+ ion pairs confined in linear Paul traps. We are interested in the non-equilibrium distribution of ion motional states that occur when the motion is initially prepared near the three-dimensional motional ground state [16] and evolves due to BGCs without sympathetic cooling during the clock interrogation time, which is short compared to the mean time between collisions with H2. Because the collision dynamics occur on a timescale (~10−12 s) short compared to the fastest timescale for ion motion (~10−8 s), it is sufficient to treat the collisions as leading to instantaneous changes to the velocity of one of the ions. Furthermore, we assume that in each collision event the BG molecule interacts with only one of the two ions.
Here we summarize our calculation of the differential BGC rate for collisions that impart Eion kinetic energy onto the ion in the laboratory frame. For details, see Appendix A. To include motional heating due to glancing collision events, we calculate the differential cross section semiclassically following the approach of Zipkes et al. [20]. Integrating the laboratory-frame differential cross section with a three-dimensional Maxwell-Boltzmann distribution of BG molecules with temperature T and number density n, we write the total scattering rate as
| (1) |
where ϑ and v are the laboratory-frame scattering angle and initial BG velocity. Finally, we substitute ϑ(Eion, v) based on elastic collision kinematics into Eq. (1) and numerically compute via finite differences.
The collision-rate distribution predicted by our model for 27Al+ in 51.9 nPa of room temperature H2 is shown in Fig. 1(a). The total collision rate of 0.16 s−1 can be contrasted with a 0.020 s−1 total collision rate predicted by the Langevin cross section [18]. The effect of BGCs on the clock ion’s kinetic energy after 150 ms of collisional heating is shown in Fig. 1(b), indicating a highly nonthermal distribution for Eion with ≈1% of the population distributed between 10−2 and 102 K (energies throughout are are given in temperature units). We calculate the collisional heating rate to be of order 1 K/s, which is significantly higher than the total heating rate inferred by sideband thermometry measurements for the ion traps considered here [16]. This discrepancy arises since typical sideband thermometry assumes a thermal distribution and is more sensitive to population near the motional ground state [21]. We have calculated the heating rate inferred by sideband thermometry for collisional heating to be of order 100 μK/s, or 0.1 quanta/s for each motional mode, for typical experimental parameters.
FIG. 1.
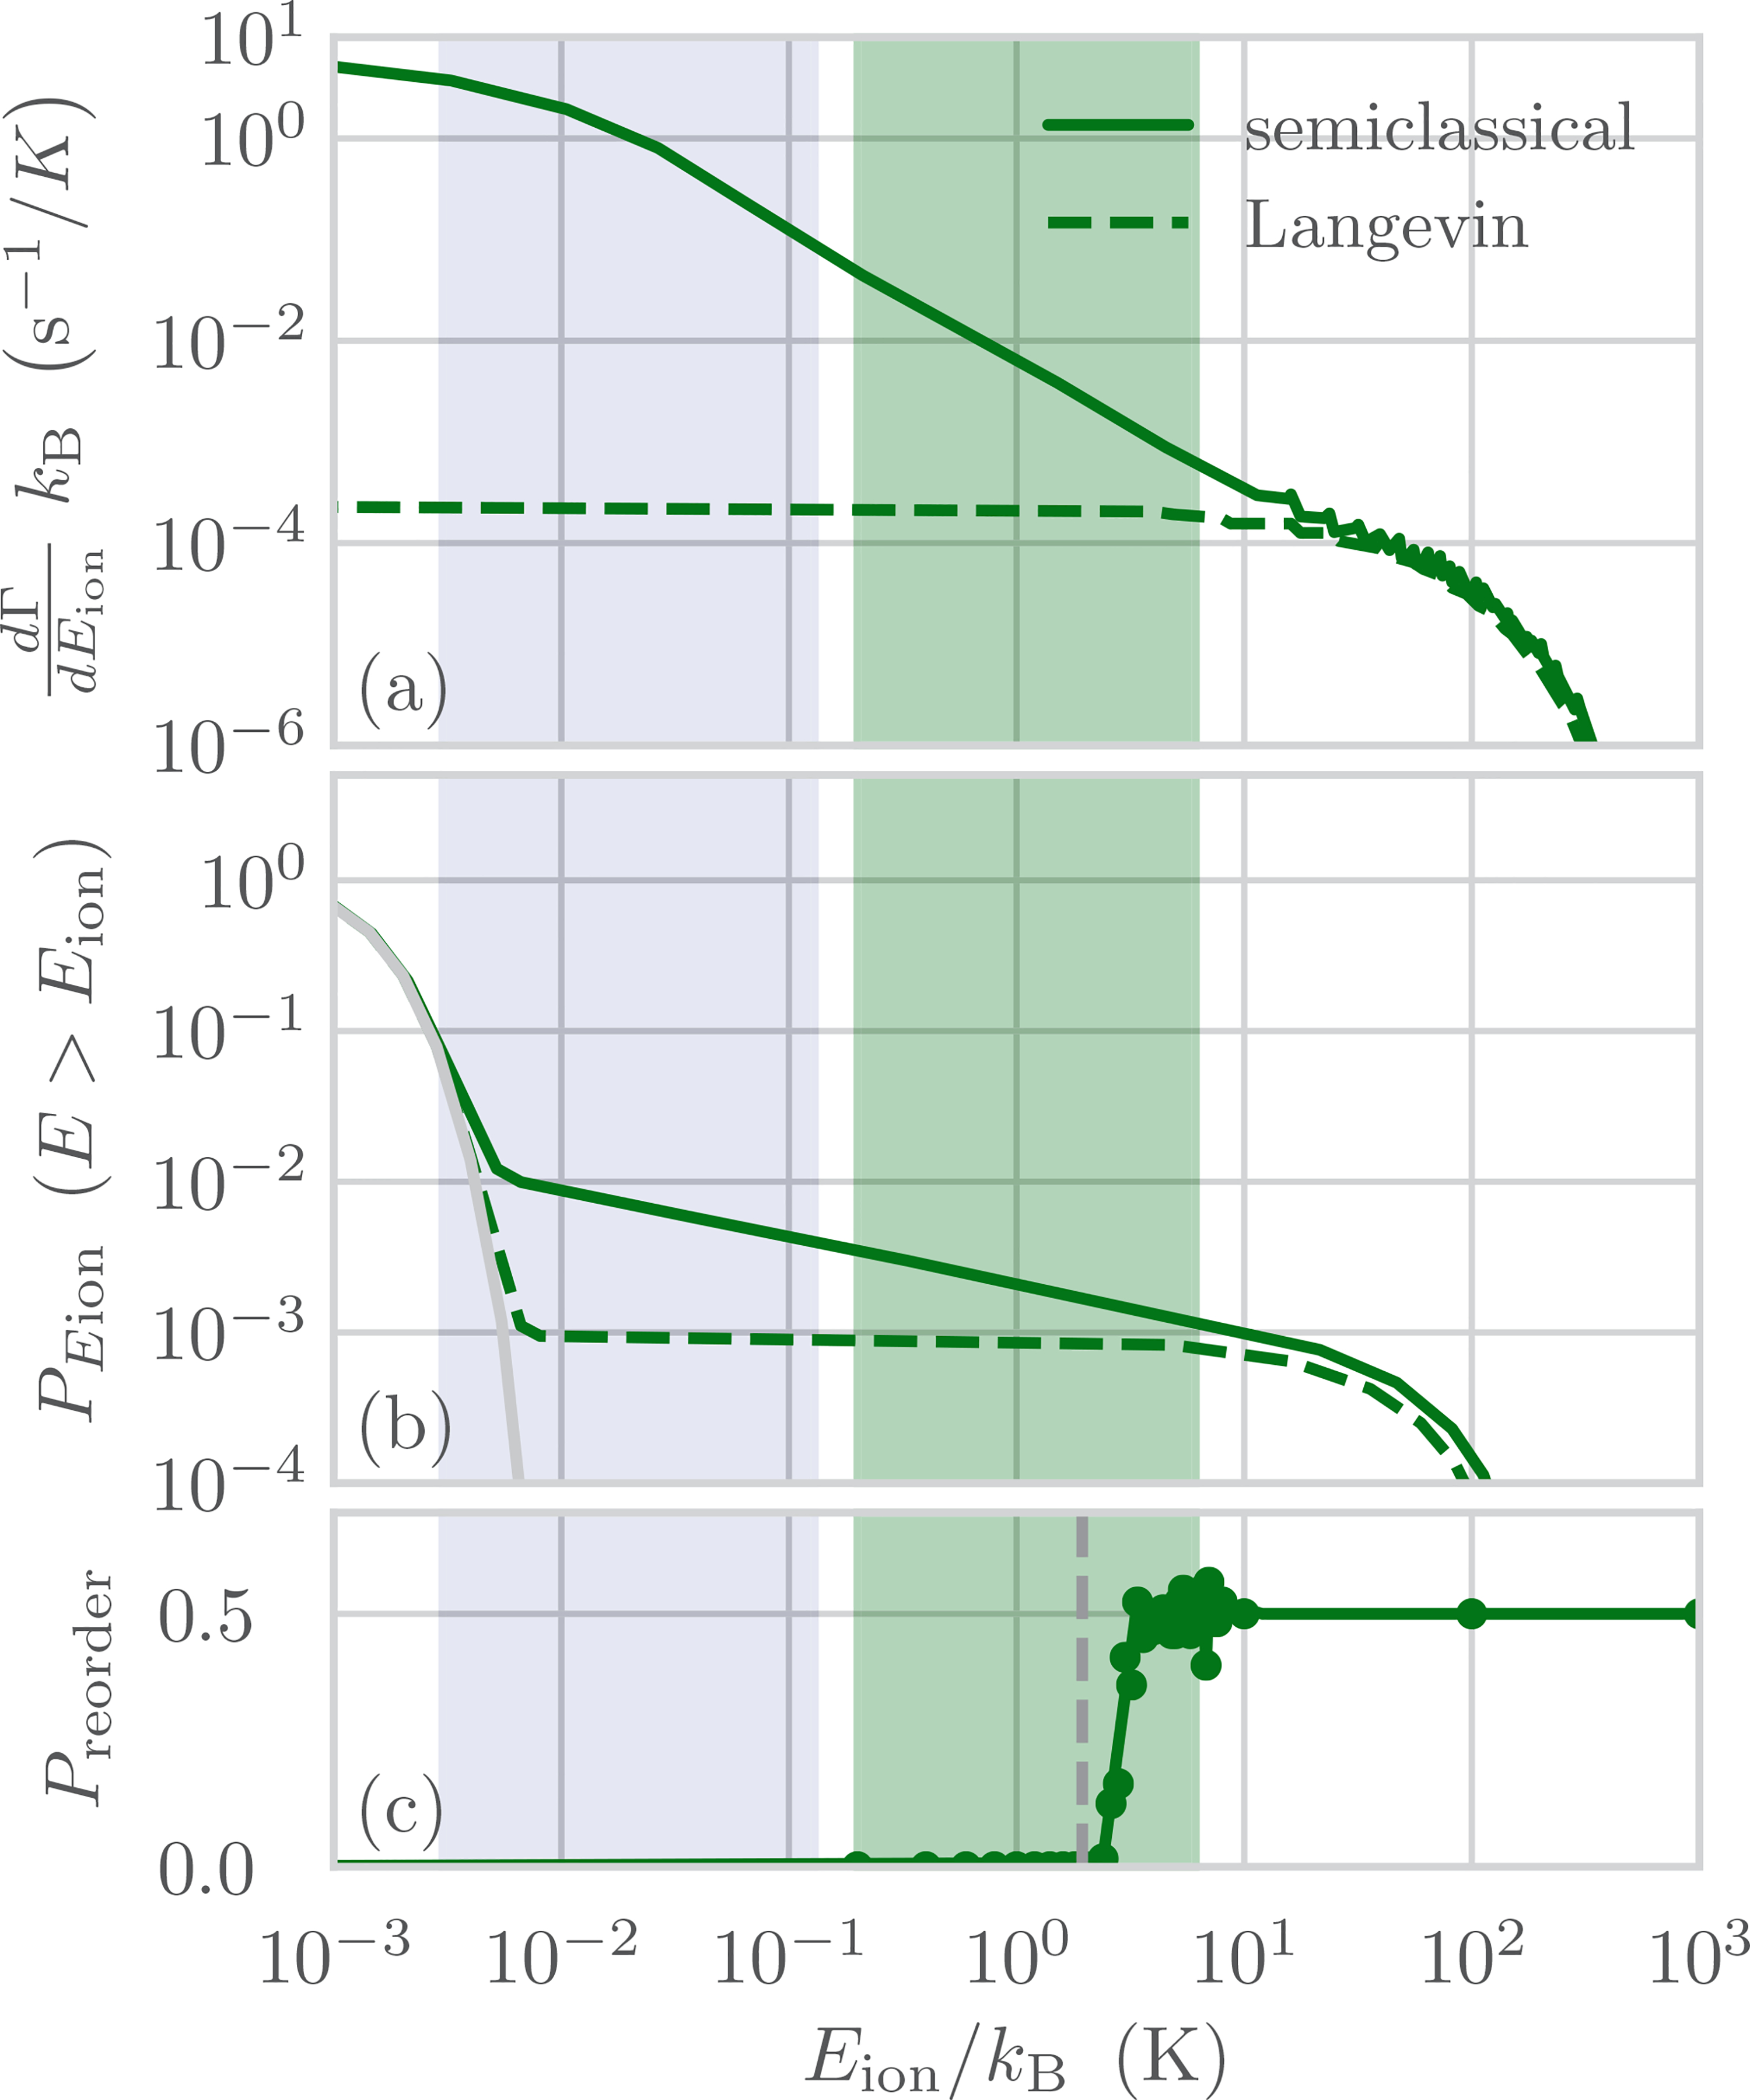
(a) Differential rate of collisions between 27Al+ at rest and 51.9 nPa of H2 BG at 295 K resulting in final ion kinetic energy Eion. The cross section for Langevin spiraling collisions underestimates the collision rate for low energies when compared with the semiclassical calculation, which includes both glancing and spiraling collisions. (b) Cumulative energy distribution (PEion) for all E > Eion. We compare the Maxwell-Boltzmann distribution for a three-dimensional harmonic oscillator at a typical Doppler cooling limit of 0.5 mK (light gray) with the distribution after 150 ms of collisions. (c) Example of a Monte Carlo calculation of the Ca+-Al+ reorder probability (Preorder) after 27Al+ receives Eion energy due to a BGC. The potential energy barrier for reordering, Ereorder, is shown as a vertical gray dashed line. The green (dark gray) shaded region marks the experimentally accessible range of Ereorder in this work. The blue (light gray) shaded region indicates the range of 87Rb-172Yb+ collision energies explored by Zipkes et al. [20], mapped onto the resulting ion energy for H2-27Al+ collisions.
For experiments using two-ion mixed-species crystals, it is possible to measure the rate of collisions that cause the order of the crystal to change. This measurement can be used to infer the pressure of the BG at the position of the trapped ions, which can be significantly different from the pressure in other locations of the UHV chamber, such as the position of a pressure gauge or vacuum pump. We calculate the reorder rate Γreorder by integrating the collision rate with the reorder probability and summing over the two ions:
| (2) |
where Pi,reorder(Eion) is the reorder probability and is the differential collision rate for ion i. While an accurate evaluation of Pi,reorder(Eion) requires detailed knowledge of the ion trajectories following a collision, a simpler expression can be obtained with the assumption that Pi,reorder(Eion) = 0.5 for Eion > Ereorder. Here Ereorder is the potential-energy barrier between a ground-state axial configuration and a two-ion radial crystal, which depends on the trapping conditions (Appendix B 1). This reduces Eq. (2) to an integral over all collision energies that are greater than Ereorder similar to the cumulative distribution shown in Fig. 1(b) and approximately given by
| (3) |
for 40Ca+−27Al+ in 295 K H2 background gas and 0.1 K < Ereorder < 10 K, where p is the H2 pressure. The constants given in Eq. (3) are specific to the background-gas temperature as well as the masses of the two ions.
III. ION REORDER RATE MEASUREMENTS
In order to verify the nonthermal energy distribution predicted by our model for , we measure two-ion reorder rates for experimentally accessible values of Ereorder in a 40Ca+−27Al+ clock. The setup is similar to the 25Mg+−27Al+ clock described in Refs. [16,19,22] with the sympathetic cooling and quantum-logic readout ion 25Mg+ replaced by 40Ca+. Two-ion reorder events are detected by monitoring the position of the 40Ca+ ion with respect to the 27Al+ ion. The logic ion is detected and cooled with a 397-nm laser tuned near resonance with the |S1/2⟩ → |P1/2⟩ cycling transition. Using a matched pair of aspherical lenses with a numerical aperture of 0.38, Ca+ fluorescence is collected and relayed onto a knife-edge spatial filter aligned to the center of the image of the two-ion crystal. The spatially filtered image is then relayed onto a photomultiplier tube using a microscope objective, resulting in two discrete fluorescence levels for the two crystal orders (Appendix C). The reorder barrier is adjusted by changing the dc voltage applied to the rf-Paul trap end caps (Appendix B 1).
The measured reorder rates for Ereorder ranging from 0.2 to 6 K are shown in Fig. 2. While Eq. (3) predicts the overall trend, a more accurate estimate of Γreorder can be calculated by considering the operating parameters of the ion trap and the details of the laser cooling after a collision. To include these effects, we have calculated Pi,reorder(Eion) for the experimental values of Ereorder using Monte Carlo simulations of the ion trajectories after a collision in the full time-dependent potential [Fig. 1(c), Appendix B 2]. A single-parameter fit of this model for pressure gives 51.9(8) nPa, where the error bar indicates the 1σ statistical uncertainty, with . In the following, we include a 50% systematic uncertainty in addition to the statistical error in our estimate of the pressure uncertainty, to account for inelastic collision processes and the unknown short-range interaction potential (see Appendix D). The measured ion pump current indicated a pressure of 20(10) nPa when the UHV chamber was first built and 100(20) nPa during the reorder measurements. Fitting Eq. (3) to the data results in a pressure of 38.9(6) nPa with , indicating that ion trajectory calculations are necessary for accurate pressure determination. Both approaches improve upon the model used in past 27Al+ clock uncertainty evaluations that did not consider glancing collisions and assumed all Langevin collisions cause the ions to reorder with 50% probability [12] (Fig. 2, dotted green line). If this model is fit to the reorder data, it demonstrates poor agreement with a of 31.
FIG. 2.

Reorder rate as a function of reorder energy barrier for a 40Ca+−27Al+ two-ion crystal in H2 background gas at 295 K. Blue points: experimental data. Solid blue line: single-parameter fit calculated using Eq. (2) together with trajectory simulations for Pi,reorder(Eion). The estimated background gas pressure is 51.9 nPa, with a 1σ statistical uncertainty of ±0.8 nPa and a of 2.4 (see Appendix D for a discussion of the systematic uncertainty). Dashed green line: predicted upper bound on the reorder rate [Eq. (3)] at a pressure of 51.9 nPa. Dotted green line: reorder rate for the same pressure when assuming 50% of Langevin collisions cause the crystal to reorder, as was used in previous clock evaluations.
Our measurements are in agreement with the collision kinematics model described above over the experimentally accessible energy range 0.2K < Eion < 6K indicated by the green (dark gray) shaded region in Fig. 1, which roughly corresponds to a verification of our semiclassically calculated differential cross section over a range of laboratory-frame scattering angles between 0.09 and 0.5 rad, for collisions between 27Al+ at rest and room-temperature H2 gas. Zipkes et al. [20] have studied the collision kinematics of a single 172Yb+ ion immersed in a cloud of ultracold 87Rb atoms. They find that Langevin collisions alone are insufficient to explain the observed collisional heating and loss of the neutral atoms, and that it is necessary to calculate the differential cross section semiclassically including both Langevin and glancing collisions. By measuring the collisional heating and loss of 87Rb as a function of the initial kinetic energy of 172Yb+, they verify the same collision kinematics model that we use, but over a different energy range indicated by the blue (light gray) shaded region in Fig. 1. Together, these two experiments verify the collision kinematics model over nearly the entire range of resulting ion energies that contribute to the BGC shift of trapped-ion clocks.
IV. BACKGROUND-GAS COLLISION FREQUENCY SHIFT
An upper bound on the time-dilation component of the BGC shift can be obtained based on the collisional heating rate discussed above. For the 27Al+ clocks considered here, operated without sympathetic cooling during a 150 ms probe, the time-averaged fractional time-dilation shift is of order 10−16. It is important to recognize, however, that this is dominated by a very low population tail of the motional state distribution at very high energy. In practice, the contribution of population at very high energy to the spectroscopy signal is suppressed both because the transition is shifted completely off-resonance by the time-dilation effect, and because the Rabi frequency is suppressed by motional Debye-Waller factors [16,18].
To take this suppression into account, we calculate the BGC shift using Monte Carlo simulations of the spectroscopy sequence including the ion motion. We assume that for each probe the two ions begin in the three-dimensional motional ground state, and there is no additional cooling or heating during the spectroscopy pulse [16]. Note that this is not applicable to previous 27Al+ clocks which operated with continuous sympathetic cooling during the spectroscopy pulse [10,12]. Following DeVoe [23], for each of the typically 108 Monte Carlo trials, we analytically propagate the classical motion of the ions between collisions to first order in the Mathieu q parameter. For each ion, we randomly generate collision times from an exponential distribution with a mean given by the reciprocal of the total elastic collision rate Γ. For each collision, we randomly choose Eion from a distribution obtained by normalizing . From the amplitudes and phases of the motional modes before the collision we calculate the instantaneous velocity of the colliding ion, add with a randomly selected direction, and calculate the amplitudes and phases of the motional modes after the collision. Here mion is the mass of the colliding ion. For each time interval between collisions during the probe, the classical oscillation amplitudes are mapped onto a six-dimensional coherent state, and Fock states are randomly selected from the corresponding distributions. Using these time-dependent Fock states for each motional mode, we analytically propagate the internal quantum superposition of the clock ion under a Rabi spectroscopy Hamiltonian for a grid of values of the laser frequency covering the atomic transition, including the second-order time dilation shift of the atomic transition frequency and the Debye-Waller suppression of the Rabi frequency.
For each collision involving the clock ion, we randomly decide if the event is a Langevin spiraling collision based on the ratio of the differential Langevin collision rate (Appendix A 1) to , and for Langevin spiraling collisions that penetrate the angular momentum barrier we add a worst case ±π/2 phase shift to the atomic superposition state [12] with an unknown sign that is fixed for each set of trials. In general, there is also a phase shift for glancing collisions because the ion polarizes the molecule, and the resulting dipole electric field Stark shifts the ion. However, for 27Al+, because of the small differential polarizibility of the clock transition [19,24], the frequency shift caused by glancing collision phase shifts is negligible compared with the frequency shift caused by Langevin collision phase shifts. At the end of the Rabi probe time, we calculate the transition line shape as the population in the excited state for each laser frequency, and we average this line shape over all of the Monte Carlo trials. Finally, we calculate the fractional BGC shift of the clock, νc/ν, by finding the center frequency of the line shape νc defined as the average of the two frequencies where the transition probability is equal to half of the maximum transition probability.
For the 25Mg+−27Al+ quantum-logic clock presented in Ref. [19], with 38(19) nPa of H2 BG (measured in situ as described above for the 40Ca+−27Al+ clock) at 294.15(2.70) K, for a 150 ms probe duration the Monte Carlo simulations constrain the collisional frequency shift to be −0.6(2.4) × 10−19 (Appendix D). Table I shows the time dilation and the collisional phase shift components separately. As noted earlier, without the suppression of the contribution of high energy population to the spectroscopy signal, the collisional heating time-dilation shift is of order 10−16, but this is shown to be suppressed by more than three orders of magnitude by the Monte Carlo simulations. The atomic phase shift associated with the worst case ±π/2 bound is smaller but features less suppression due to forward scattering Langevin collisions, and dominates the final uncertainty. The 2.4 × 10⁻¹⁹ uncertainty of the BGC shift calculation described here is substantially smaller than would be obtained by applying the analysis method previously used by Rosenband et al. [12], which yields an uncertainty of 4 × 10⁻¹⁸ for this clock. Inclusion of calculated potential energy surfaces for an molecule in our model would further reduce the BGC uncertainty without the need for an improvement to the vacuum pressure [7], although the effect of small amounts of BG species other than H2 would have to be considered.
TABLE I.
Frequency shift and uncertainty of the 25Mg+-27Al+ optical atomic clock presented in [19] due to background-gas collisions. In the column labels, “suppression” refers to the combined effect of Debye-Waller reduction of Rabi frequencies and the shift of the transition frequency of high energy population outside of the Fourier-limited line shape. Past 27Al+ optical clock evaluations have only considered the phase shift part of the BGC shift without suppression [12].
| Contribution | Fractional frequency shift [10−19] |
|
|---|---|---|
| Without suppression | With suppression | |
| Time dilation | −2200 ± 1100 | |
| Phase shift | 0 ± 42 | 0 ± 2.3 |
| Total | −2200 ± 1100 | −0.6 ± 2.4 |
The time-dilation component of the BGC shift will grow with the probe duration as is shown in Fig. 3. The time-dilation component scales linearly with the clock interrogation time when this probe time is much less than the collision period, then begins to flatten out as it becomes more likely to have multiple collisions in a single probe. The phase shift component is approximately constant due to a balance of the increasing probability of having a Langevin spiraling collision during each probe and the decreasing spectroscopy line width (and hence maximum frequency shift due to a phase shift) as the probe time increases. For seconds-long probe times, which are attainable using more stable clock lasers [25] or correlation spectroscopy techniques [26,27], the calculated collision shift would dominate the systematic uncertainty of the clock described in Ref. [19] under these conditions.
FIG. 3.

Fractional BGC shift and uncertainty of the 27Al+ clock presented in Ref. [19] as a function of the spectroscopy probe time. (top panel) The red (dark gray) curves show the time-dilation component of the frequency shift and the green (light gray) curves show the uncertainty due to the phase shift component, with (solid lines) and without (dashed lines) including suppression due to the combined effect of Debye-Waller reduction of Rabi frequencies and the time-dilation shift of the transition center frequency outside of the Fourier-limited line shape in the Monte Carlo model. (bottom panels) The red, green, and blue lines and shaded regions show the shift and uncertainty of the time-dilation component, the phase shift component, and the total BGC shift.
V. CONCLUSION
In summary, we have developed a framework for calculating the BGC shift for trapped-ion optical clocks that includes both the time-dilation shift due to the kinetic energy received during a BGC as well as the phase shift of the atomic superposition state. Using the semiclassical differential scattering cross section, we show that the inclusion of glancing collisions is important for accurately describing the frequency of collisions that deposit kinetic energies of <10 K to the ions and therefore necessary for accurately evaluating the clock ion’s kinetic energy. We have verified the predicted collisional energy distribution by measuring the rate of two-ion reorder events in a 40Ca+−27Al+ experiment due to BGCs over the experimentally accessible range of reorder barriers ranging from 0.2 to 6 K. Finally, we performed a Monte Carlo simulation of spectroscopy of the 267 nm 27Al+ 1S0 ↔ 3P0 clock transition for the 25Mg+−27Al+ quantum-logic clock presented in Ref. [19] to calculate the BGC shift, −0.6(2.4) × 10−19, enabling total clock uncertainty below 10−18 despite a BG pressure that is a factor of two to three higher than previous 27Al+ clocks.
The suppression of the BGC shift and uncertainty due to Debye-Waller factors will be smaller for clocks with visible or infrared optical clock transitions because of their smaller Lamb-Dicke parameters, and is negligible in trapped-ion microwave clocks. We have estimated the BGC uncertainty using our framework to be near 10−18 for 40Ca+, 88Sr+, and 171Yb+ clocks with typical experimental parameters (see Table II). We thus expect the BGC uncertainty modeled here to be significant in most room-temperature trapped-ion clocks as their systematic uncertainties reach the 10−18 level or below.
TABLE II.
Operating parameters and calculated collisional frequency shifts for 27Al+, 40Ca+, 88Sr+, and 171Yb+ clocks. For 27Al+, we use the parameters of and calculate the BGC shift and uncertainty specifically for the clock described in Ref. [19]. For the 40Ca+, 88Sr+, and 171Yb+ clocks, we use parameters similar to experimental implementations at WIPM [28,29], NRC [9,30], and PTB [8], but we do not perform a rigorous analysis of the uncertainty of the BGC shift. For all clocks, we simulate Rabi interrogation. Current 171Yb+ clocks based on the 467 nm electric-octupole (E3) transition use hyper-Ramsey [8] or autobalanced Ramsey [31] interrogation, so this calculated collision shift for 171Yb+ should be taken as a rough estimate.
| 27Al+ | 40Ca+ | 88Sr+ | 171Yb+ E3 | |
|---|---|---|---|---|
| Trap drive frequency [MHz] | 40.7 | 24.7 | 14.4 | 15 |
| Secular frequencies [MHz], x direction | 2.85,3.31 | 1.01 | 1.13 | 0.7 |
| y direction | 3.54, 3.95 | 1.07 | 1.15 | 0.7 |
| z direction (axial) | 1.47, 2.55 | 2.31 | 2.25 | 1.4 |
| Interrogation time [ms] | 150 | 80 | 100 | 150 |
| Clock laser direction, | (1/2, 1/2, ) | (1,0, 1)/ | (1, 1,0)/ | (1, 1,0)/ |
| BG temperature [K] | 294.15 ± 2.70 | 300 | 300 | 300 |
| BG pressure [nPa] | 38 ± 19 | 30 | 16 | 6 |
| Fractional frequency shift, Time dilation [10−19] | −0.9 | −0.2 | 0.0 | |
| Phase shift [10−19] | ±2.3 | ±13.3 | ±11.9 | ±2.5 |
| Total [10−19] | −0.6 ± 2.4 | −0.9 ± 13.3 | −0.2 ± 11.9 | 0.0 ± 2.5 |
The BGC heating of trapped ions considered here and the pressure measurement technique we use (similar to that described by Pagano et al. [32]) may be relevant to many precision measurement, quantum information [18,32–34], and ultracold atom-ion mixture [20,35–37] experiments. By incorporating fully quantum scattering calculations, it may be possible to use this pressure measurement technique as the basis of a primary pressure standard. Due to the months long trapping times possible with trapped ions, such a standard may have a significantly lower measurement floor than those based on neutral atoms [38].
Note added. Recently, we became aware of the work by Davis et al. [39] in which the state-dependent potential energy surfaces and partial wave scattering phase shifts for Al+-H2 collisions are calculated.
ACKNOWLEDGMENTS
We thank T. Rosenband (Harvard University) for development of the ion trajectory integrator, A. Vutha (University of Toronto) for useful discussions, and K. Beloy and E. Tiesinga (National Institute of Standards and Technology) for their careful reading of the manuscript. This work was supported by the Defense Advanced Research Projects Agency, the National Institute of Standards and Technology, and the Office of Naval Research. S.M.B. was supported by the U.S. Army Research Office through MURI Grant No. W911NF-11-1-0400. This paper is a contribution of the US Government, not subject to US copyright.
APPENDIX A: BACKGROUND-GAS COLLISIONS
In the following subsections, we calculate the scattering differential cross section using the semiclassical partial-wave expansion [40] and the resulting kinetic-energy distribution of the ion including both glancing and spiraling collisions.
1. Differential cross section
At large separations R, the interaction potential between a neutral BG molecule and an ion is given by
| (A1) |
where C4 = αQ2/(8πϵ0), α is the polarizability of the BG molecule, Q is the charge of the ion, and ϵ0 is the vacuum permittivity [18]. For H2, the orientation-averaged static polarizability α = 0.8 × 10⁻³⁰ m3 [41–43]. At small separations the interaction potential becomes repulsive and state dependent, but the exact form depends on the collision species and is not well known for the species considered here. Impact parameters smaller than the Langevin radius bcrit = (αQ2/π0μv2)1/4 result in Langevin collision trajectories in which the molecule spirals in towards the ion. Here μ = mbgmion/(mbg + mion) is the reduced mass, mbg is the mass of the BG molecule, mion is the mass of the ion, and v is the relative velocity. For H2 at a temperature T = 300 K, the critical impact parameter for the mean speed where kB is the Boltzmann constant is 0.5 nm.
Following Zipkes et al. [20], the differential cross section in the center-of-mass coordinate system is calculated semiclassically as a sum over partial waves,
| (A2) |
where the angular and linear momentum of a partial wave are and , is the collision energy, ηl is the scattering phase, Pl(cosθ) is the lth order Legendre polynomial, and θ is the scattering angle in the center-of-mass inertial frame. Partial waves with have kinetic energy larger than the centrifugal potential barrier and sample the repulsive short-range potential, resulting in rapidly oscillating scattering phases [44]. Without detailed knowledge of the short-range potential for the collision partners considered here, we assume that ηl are uniformly distributed random numbers over the range 0 to 2π for l < lcrit, and we average the resulting differential cross section over many instances of the random scattering phases. For l > lcrit, we use the semiclassical approximation for the phase shift
| (A3) |
where Rcrit = (l + 1/2)/k is the classical turning point. The resulting differential cross section is consistent with the alternative treatment of Dalgarno et al. [43], has been shown to describe the kinematics of 87Rb-172Yb+ collisions [20], and is further supported by the experiments presented in the main text.
We transform from the center-of-mass frame differential cross section to the laboratory frame differential cross section using [45]
| (A4) |
and
| (A5) |
where ρ = mbg/mion. For the experiments considered here, we perform laser cooling on a timescale much faster than the total elastic collision rate, so the ion can be assumed to be at rest in the laboratory frame before the collision. The kinetic energy of the ion in the laboratory frame after the collision is given by
| (A6) |
Figure 4 shows the differential cross section and final ion energy for collisions between 27Al+ at rest and H2 with 300 K of kinetic energy.
For the BGC shift Monte Carlo simulations described in the main text, we also require the differential cross section for Langevin spiraling collisions (i.e., not including glancing collisions). We calculate this semiclassically using the method described above with ηl set to zero for l > lcrit, with the result shown in Fig. 4. For the small scattering angles which have the largest contribution to the BGC shift (Appendix D3), this reproduces the semiclassical differential cross section for a hard sphere with radius bcrit [40]. Figure 4 also shows the classical differential cross section for Langevin spiraling collisions under the assumption that they scatter uniformly into 4π with a total cross section of [46]. For small scattering angles, the classical differential cross section is more than two orders of magnitude smaller than the semiclassical one, indicating that our differential cross section for Langevin spiraling collisions is a more conservative estimation of the resulting phase shift component of the BGC shift.
FIG. 4.

(Top panel) Lab-frame differential cross section for collisions between 27Al+ at rest and H2 with 300 K of kinetic energy as a function of scattering angle. Blue (dark gray): semiclassical differential cross section including both glancing and spiraling collisions. Red (medium gray): semiclassical differential cross section including only spiraling collisions, calculated by setting ηl = 0 for l > lcrit. Green (light gray): classical Langevin differential cross section assuming uniform scattering in the center-of-mass frame and that the total cross section is given by . (Bottom panel) Lab-frame kinetic energy of the 27Al+ ion after the collision as a function of scattering angle.
2. Scattering rate distribution
We calculate the total elastic collision rate by integrating the differential cross section with a Maxwell Boltzmann distribution of BG velocities:
| (A7) |
where n and T are the number density and temperature of the BG. For 27Al+ in 51.9 nPa of room-temperature H2, the total elastic collision rate is 0.16 s−1. This can be contrasted with the classical rate of spiraling Langevin collisions . The differential BGC rate for collisions that impart Eion kinetic energy onto the ion in the laboratory frame is given by
| (A8) |
where and ϑ(Eion, v) are the derivative and the inverse of Eq. (A6) when written as a function of the laboratory frame scattering angle ϑ. In practice, we calculate numerically as the value of Eq. (A7) with the range of the inner integral restricted to [ϑ(Eion − dEion/2, v), ϑ(Eion + dEion/2, v)] divided by dEion.
APPENDIX B: TWO-ION MIXED-SPECIES CRYSTAL COLLISIONAL REORDERING RATE
In the following, we discuss the kinematics of a two-ion crystal undergoing a collision event and describe Monte Carlo trajectory simulations used to calculate the two-ion reorder probability, Preorder(Eion).
1. Two-ion reorder energy barrier
The reorder probability depends on the operating parameters of the ion trap and the details of the laser cooling during the measurement. Following Wübbena et al. [47], we write the total trap electric potential as
| (B1) |
where V0/2 and Ω are the amplitude and angular frequency of the voltage applied to the rf electrodes, U0 is the voltage applied to the endcap electrodes, R and d are characteristic radial and axial dimensions of the trap, and α parameterizes the radial asymmetry of the static field. The secular frequencies of a single ion are
| (B2) |
where m is the mass of the ion and
| (B3) |
We define the potential energy barrier, Ereorder, as the energy difference between the ground-state axial crystal and the minimum energy configuration of two ions confined to the radial plane. Assuming that the coordinate system is defined such that ωx > ωy, the potential energy barrier for changing the order of a two-ion crystal is
| (B4) |
where μ = m2/m1 is the ratio of the two ion masses, ϵ = ωp/ωz, and ωz is the axial secular frequency of a single ion of mass m = m1 in the trap.
In the absence of cooling, and assuming that the six secular frequencies are not rationally related, all collisions that deposit a kinetic energy greater than the reorder energy barrier will eventually cause the order of the two ion crystal to repeatedly change. The order changes will continue until cooling is applied, at which time the order is fixed. Assuming that neither the cooling process nor the trap potential introduces an order bias, the probability that the order after cooling is different from the order before the collision is 50%. Experimentally, however, it is more convenient to measure the reorder rate while applying continuous laser cooling. In this case, collisions that deposit a kinetic energy slightly greater than the reorder energy barrier cause reordering with probability less than 50%, with the exact probability depending on the operating parameters of the ion trap and the details of the laser cooling.
FIG. 5.

(Top panel) Differential collision rate for each ion of a 40Ca+−27Al+ two-ion crystal in 51.9 nPa of H2 BG at 295 K. (Other panels) Reorder probability calculated using the Monte Carlo ion trajectory simulations. Each panel is for different trap parameters. The reorder barrier for each set of trap parameters is specified on the left side of the panel and is shown as a dashed vertical line. The laser cooling parameters used are a saturation parameter of s = 300 and a detuning of 80 MHz.
2. Ion trajectory simulations
We have calculated the reorder probability as a function of the ion energy after the collision for several experimentally accessible reorder energy barriers using Monte Carlo simulations of the ion trajectories. We calculate the ion trajectories in the full time-dependent potential [Eq. (B1)] using a custom sixth-order symplectic integrator [48]. The integrator includes the nonlinear Coulomb interaction between the two ions and a classical, linear drag force to approximate Doppler laser cooling. For each value of the energy transferred to an ion by a collision, and for collisions with each of the two ions, we run the integrator for 256 randomly selected initial velocity directions. We have checked the sensitivity of the results to our treatment of the laser cooling by repeating the calculation for saturation parameters that are a factor of 2 lower and higher than the nominal value, and verified that the calculated BG pressure changes by less than 1%. The calculated reorder probabilities for the nominal saturation parameter are shown in Fig. 5.
FIG. 6.
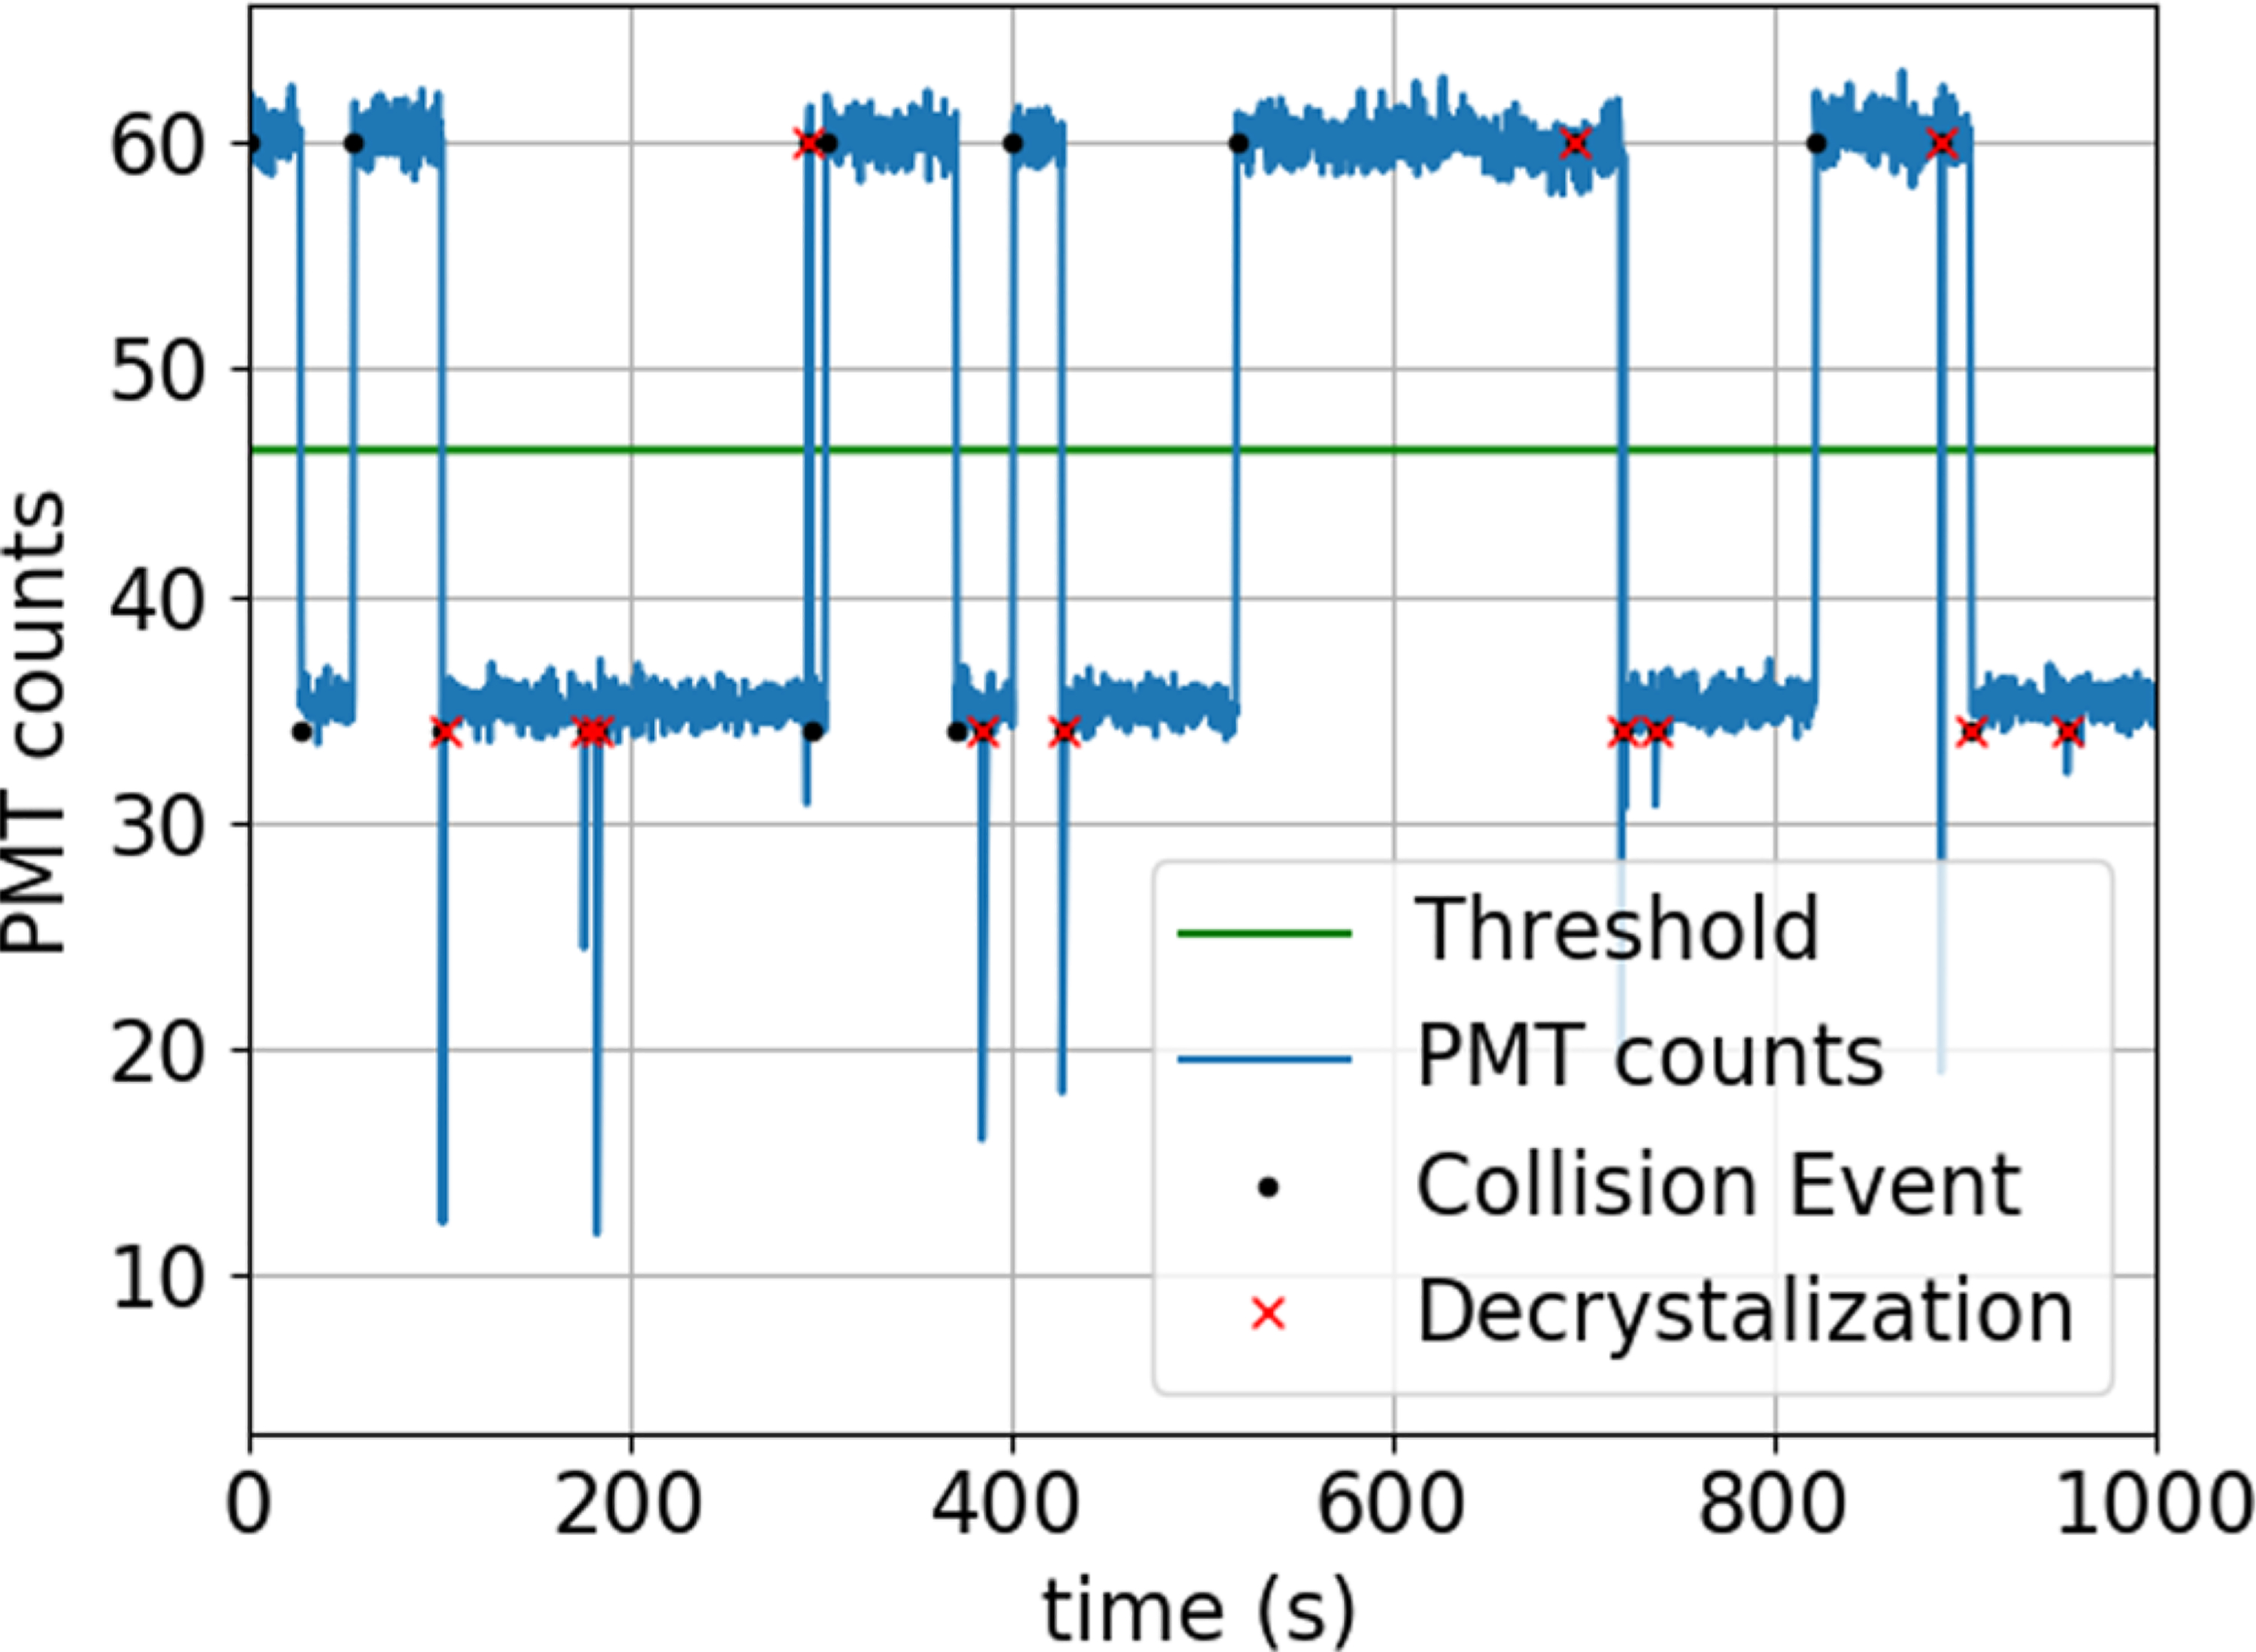
PMT counts observed during a typical reorder-rate measurement. A knife edge placed at the center of an optical image of the two-ion crystal causes a reduction in the measured count rate for the order in which Ca+ is partially blocked. For this example, two-ion crystal order changes (black dots) are observed as sudden changes between 60 and 35 counts measured during a 800 μs measurement window. Fluorescence dropouts below 35 PMT counts arise due to energetic collisions that cause the two-ion crystal to dissolve (red crosses).
APPENDIX C: TWO-ION CRYSTAL ORDER DETECTION
The ion order is detected by spatially resolving the positions in the two-ion crystal. A matched pair of aspheric lenses (NA = 0.38, 50 mm diameter) produce an image of the ions at an intermediate focus outside of the vacuum chamber. A knife edge positioned close to the center of the two ions in this image plane blocks the Ca+ ion fluorescence in one order while transmitting it in the other. The intermediate image is relayed onto a PMT such that there are two well resolved fluorescence levels. As an example, Fig. 6 shows a time series with an average of 60 counts in the bright order and 35 counts in the dark order for an 800 μs measurement window.
A reorder event causes a discrete jump in the observed fluorescence between the dark and bright levels, which we identify using a threshold. Ideally, the number of reorder events, Nreorder, observed during a total observation time, T, gives the reorder rate R = Nreorder/T. However, in the data, we also observe decrystallization events in which the collected fluorescence drops below the dark level and the ions cannot be efficiently laser cooled. These events are detected in real time, triggering the control system to lower the radial confinement, which allows efficient laser cooling and recrystallization of the ions. A bias in the ion order after recrystallization can give a bias in the inferred reorder rate. To account for this, we also record the total number of decrystallization events, Ndecryst. The unbiased reorder rate is then given by
| (C1) |
Here Nreorder includes only reorder events that are not associated with decrystallization. The factor of 1/2 in the second term of Eq. (C1) ensures that any collision event that imparts enough kinetic energy to decrystallize the ions contributes with a probability of 1/2 to reorder them.
FIG. 7.

Rabi spectroscopy line shape of a 25Mg+−27Al+ optical atomic clock operated with a 150 ms probe time. Blue dotted line: spectroscopy line shape for 27Al+ at rest and without any BGCs. Blue dashed line: Monte Carlo spectroscopy line shape including the time-dilation shift and phase shift due to collisions with 1.5 μPa of H2 BG at 294.15 K, but not including the Debye-Waller factors that suppress participation of high energy population. This pressure is much higher than is achieved in experiments to exaggerate the asymmetry of the line shape. Blue solid line: Monte Carlo spectroscopy line shape including BGCs and Debye-Waller factors. Red circles: frequencies that are probed during normal clock operation. Green square: center frequency to which the optical clock output frequency is steered.
In addition to the recrystallization bias, we have observed a non-negligible probability of recording false decrystallization events when the ions are in the dark order. For this reason, we estimate Ndecryst by extrapolating from the number of decrystallization events beginning in the bright order, Ndecryst,B, which has substantially less overlap with the count histogram for the decrystallized state. We use Ndecryst = Ndecryst,B(T/TB), where TB is the total time the ions spent in the bright order. We assume Poisson statistics for Nreorder and Ndecryst,B to propagate the error for the error bars in Fig. 2.
APPENDIX D: OPTICAL ATOMIC CLOCK COLLISIONAL FREQUENCY SHIFT AND UNCERTAINTY
We calculate the background gas collision (BGC) shift for 27Al+, 40Ca+, 88Sr+, and 171Yb+ clocks using the Monte Carlo model described in the main text. The Monte Carlo model input parameters and results for the four clocks are displayed in Table II. To illustrate the asymmetry of the clock transition line shape due to collisions, Fig. 7 shows the line shape calculated by the Monte Carlo model for input parameters selected to exaggerate the asymmetry.
In the following subsections, we present the details of the BGC shift and uncertainty calculation for the optical atomic clock described in Ref. [19]. This clock is based on quantum-logic Rabi spectroscopy of the 1S0 ↔ 3P0 transition in 27Al+ using 25Mg+ as the logic ion. Unlike previous 27Al+ clocks, this clock does not use any sympathetic cooling during the interrogation. Furthermore, our Monte Carlo model does not include sympathetic cooling during the interrogation, so it cannot be used to improve the collision uncertainty bound for the previous 27Al+ clocks. All of the calculations below assume a 150 ms probe time unless otherwise noted.
1. BG temperature
The temperature of the BG is evaluated using seven thermocouple sensors located on the trap wafer, in-vacuum support structure, and surrounding vacuum chamber. We use the lowest and highest measured temperatures minus and plus the sensor uncertainty as the lower and upper bounds of the BG temperature to arrive at 294.15(2.70) K [19].
2. BG pressure
The BG pressure is evaluated to be 38 nPa by measuring the rate of collisions that cause the two ions to swap positions. Note that unlike the 40Ca+−27Al+ experiment, decrystallization is not observed in the 25Mg+−27Al+ experiment, so the analysis of this measurement is more straightforward. There are several sources of uncertainty. The 6% statistical uncertainty is limited by the 12 h duration of the measurement. We estimate the systematic uncertainty by considering the following approximations made in the model:
(1) We calculate the differential cross section semiclassically based on the H2 polarizibility and neglecting inelastic collisions. For laser cooled 27Al+ and 25Mg+, the hyperfine and fine structure is energetically accessible in collisions with room-temperature BG molecules. For H2 with a 1.8 THz rotational constant and 132 THz vibrational constant [49], the hyperfine and rotational structure is accessible but not the vibrational structure. The contribution of resonant processes to momentum transfer from the BG to the ions is expected to be small, since the electric dipole matrix elements for these transitions are small. Furthermore, we assume random scattering phases for l < lcrit as described in Sec. A1. We assign a 50% systematic uncertainty to the BG pressure to account for these approximations, which we believe to be conservative.
(2) We use the (experimentally measured) dc molecular orientation averaged H2 polarizibility α = 0.80 × 10⁻³⁰ m3 [41] to calculate the differential cross section. The timescale for collisions is of order bcrit/v. For the 1.8 km/s mean speed of H2 at room temperature, bcrit = 0.5 nm and the collision timescale is 1/(4 THz). We estimate the systematic uncertainty associated with this approximation to be 10% by calculating the pressure using the minimum and maximum of the parallel and perpendicular polarizibility at DC and 1 PHz (0.68 × 10⁻³⁰ m3 and 1.04 × 10⁻³⁰ m3, calculated by Akindinova et al. [42]).
TABLE III.
Pressure and collision shift of the 27Al+ clock described in Ref. [19] calculated assuming that 100% of the BG is the species listed in the left column.
| Fractional frequency shift [10−19] |
|||||
|---|---|---|---|---|---|
| BG species | Polarizibility [10−30 m3] | Pressure [nPa] | Time dilation | Phase shift | Total |
| H2 | 0.80 [41] | 38 ± 19 | ±2.3 | −0.6 ± 2.4 | |
| He | 0.21 [51] | 88 ± 45 | ±1.1 | −0.4 ± 1.2 | |
| CH4 | 2.43 [52] | 36 ± 18 | ±3.0 | −0.8 ± 3.1 | |
| CO | 1.97 [53] | 45 ± 23 | ±3.0 | −0.8 ± 3.1 | |
| N2 | 1.76 [53] | 48 ± 25 | ±2 8 | −0.8 ± 2.9 | |
| O2 | 1.59 [53] | 52 ± 27 | ±2.8 | −0.8 ± 2.9 | |
| CO2 | 2.63 [53] | 44 ± 23 | ±3.8 | −0.8 ± 3.9 | |
(3) The Monte Carlo trajectory simulations use a linear drag model of laser cooling which overestimates the cooling force for high ion temperatures. We estimate the uncertainty associated with this approximation to be 1.0% by running the trajectory simulations for cooling laser saturation parameters a factor of 2 higher and lower than the experimental value and calculating the pressure. This estimate also captures the convergence uncertainty of the trajectory simulations.
Finally, there is a 2.1% convergence uncertainty associated with the calculation of and a 0.7% uncertainty due to the temperature uncertainty. Adding all of these uncertainties in quadrature, we arrive at a total uncertainty of 51% and a pressure of 38(19) nPa. The uncertainty of this measurement could be significantly reduced by performing more accurate quantum scattering calculations and increasing the measurement time.
3. Background gas collision shift
We calculate the BGC shift using the Monte Carlo model described in the main text with 108 trials. The time dilation component of the shift is −0.60 × 10⁻¹⁹ and the phase shift component is ±2.32 × 10⁻¹⁹. At 108 trials, the Monte Carlo convergence uncertainty is approximately 10−21. The convergence uncertainty associated with the calculation of is also approximately 10−21. As the phase shift component is conservatively bounded by using the worst case ±π/2 values for the collisional phase shift, we do not add any systematic uncertainty to this component. Note that any resonant collisional phase shift processes are covered by this worst case bound, and that calculations of the collisional phase shift for other collision partners suggest that the phase shift component of the collisional frequency shift is likely much smaller [7]. We estimate the systematic uncertainty of the time-dilation component by considering the following approximations:
(1) Approximations 1 and 2 for the BG pressure evaluation described above affect the momentum transfer to the ions, and thus the suppression of the BGC shift due to the low contribution of collision events to the spectroscopy signal. We assume that the uncertainty due to these approximations is captured by propagating the pressure uncertainty through the collision shift model, which yields an uncertainty on the time-dilation component of ±0.32 × 10⁻¹⁹.
(2) While the reduction of the carrier Rabi frequency due to secular motion is calculated to arbitrary order in the Lamb-Dicke parameter following Wineland et al. [18], we do not include any reduction of the carrier Rabi frequency due to micromotion. The reduction in Rabi frequency due to excess micromotion is compensated experimentally by increasing the laser intensity to produce a π pulse. The reduction in Rabi frequency due to intrinsic micromotion is a factor of q/8 smaller than that due to secular motion, where q is the Mathieu parameter. While this approximation results in a small change in the total Rabi frequency reduction, it may cause us to underestimate the large suppression of the time-dilation component due to the Debye-Waller effect. Thus we expand the uncertainty range of the time-dilation shift to include zero, resulting in a bound of
(3) Our calculation of the spectroscopy line shape does not include any decoherence other than that due to collisions. As the experimentally measured spectroscopy line shape has ≳70% contrast and a Fourier-limited width [19], we do not believe this approximation has a significant effect on the calculated BGC shift.
Adding the uncertainty of the time-dilation and phase shift components in quadrature, we arrive at a total BGC shift of for a probe duration of 150 ms. In the main text, we take the maximum of the upper and lower uncertainties to arrive at −0.6(2.4) × 10−19. The uncertainty of this calculation could be reduced by performing more accurate quantum scattering and frequency shift calculations [7,50], although a significant reduction would require accurate knowledge of the partial pressures of each BG species.
4. Other considerations
In all of the above, we have assumed that the background gas is dominantly H2, which is typically the case for room-temperature UHV systems that have undergone a high-temperature bake. The stainless steel vacuum parts used for this clock (excluding the windows and feedthroughs) were prebaked under vacuum at 400 °C for 7 days, and the assembled chamber was baked at 145 °C for 7 days. To gauge whether small amounts of other BG species have a significant impact on the pressure and BGC shift results, we have calculated the pressure and BGC shift for a variety of other background gases common in UHV chambers, with the results shown in Table III. The calculated BGC shifts under the assumption that 100% of the BG is a species other than H2 are not drastically different than that for H2, and the partial pressures of other BG species in our vacuum chamber are expected to be much lower than that of H2, so we do not increase the BGC shift uncertainty to account for small amounts of other BG species which may be present.
We do not include an atomic phase shift due to glancing collisions in our simulations. We have estimated the magnitude of the contribution of glancing collision atomic phase shifts to the BGC shift using the following calculation. For a given BG velocity and impact parameter, the classical trajectory of the BG and the electric field produced at the position of 27Al+ by the polarized H2 molecule is calculated. Using the experimentally measured differential polarizibility of the 27Al+ clock transition [19], the time-dependent Stark shift is integrated to obtain the phase shift of 27Al+ resulting from the collision. This phase shift is averaged over a Boltzmann distribution of BG speeds and impact parameters and divided by the collision rate to obtain a frequency shift of order 10−22, which is negligible.
References
- [1].Li R, Gibble K, and Szymaniec K, Metrologia 48, 283 (2011). [Google Scholar]
- [2].Guena J, Abgrall M, Rovera D, Laurent P, Chupin B, Lours M, Santarelli G, Rosenbusch P, Tobar ME, Li R, Gibble K, Clairon A, and Bize S, IEEE Trans. Ultrasonics Ferroelectrics Freq. Control 59, 391 (2012). [DOI] [PubMed] [Google Scholar]
- [3].Gibble K, Phys. Rev. Lett. 110, 180802 (2013). [DOI] [PubMed] [Google Scholar]
- [4].McGrew WF, Zhang X, Fasano RJ, Schäffer SA, Beloy K, Nicolodi D, Brown RC, Hinkley N, Milani G, Schioppo M, Yoon TH, and Ludlow AD, Nature (London) 564, 87 (2018). [DOI] [PubMed] [Google Scholar]
- [5].Bothwell T, Kedar D, Oelker E, Robinson JM, Bromley SL, Tew WL, Ye J, and Kennedy CJ, arXiv:1906.06004. [Google Scholar]
- [6].Alves BXR, Foucault Y, Vallet G, and Lodewyck J, Proc. 2019 IEEE Int. Freq. Contr. Symp. (unpublished). [Google Scholar]
- [7].Vutha AC, Kirchner T, and Dubé P, Phys. Rev. A 96, 022704 (2017). [Google Scholar]
- [8].Huntemann N, Sanner C, Lipphardt B, Tamm C, and Peik E, Phys. Rev. Lett. 116, 063001 (2016). [DOI] [PubMed] [Google Scholar]
- [9].Dubé P, Madej AA, Zhou Z, and Bernard JE, Phys. Rev. A 87, 023806 (2013). [Google Scholar]
- [10].Chou CW, Hume DB, Koelemeij JCJ, Wineland DJ, and Rosenband T, Phys. Rev. Lett. 104, 070802 (2010). [DOI] [PubMed] [Google Scholar]
- [11].Madej AA, Bernard JE, Dubé P, Marmet L, and Windeler RS, Phys. Rev. A 70, 012507 (2004). [Google Scholar]
- [12].Rosenband T, Hume DB, Schmidt PO, Chou CW, Brusch A, Lorini L, Oskay WH, Drullinger RE, Fortier TM, Stalnaker JE, Diddams SA, Swann WC, Newbury NR, Itano WM, Wineland DJ, and Bergquist JC, Science 319, 1808 (2008). [DOI] [PubMed] [Google Scholar]
- [13].Nisbet-Jones PBR, King SA, Jones JM, Godun RM, Baynham CFA, Bongs K, Doležal M, Balling P, and Gill P, Appl. Phys. B 122, 57 (2016). [Google Scholar]
- [14].Cao J, Zhang P, Shang J, Cui K, Yuan J, Chao S, Wang S, Shu H, and Huang X, Appl. Phys. B 123, 112 (2017). [Google Scholar]
- [15].Leibfried D, Blatt R, Monroe C, and Wineland D, Rev. Mod. Phys. 75, 281 (2003). [Google Scholar]
- [16].Chen J-S, Brewer SM, Chou CW, Wineland DJ, Leibrandt DR, and Hume DB, Phys. Rev. Lett. 118, 053002 (2017). [DOI] [PubMed] [Google Scholar]
- [17].For H2, the orientation averaged dc polarizability α = 0.8 × 10⁻³⁰ m3 [41,42].
- [18].Wineland DJ, Monroe C, Itano WM, Leibfried D, King BE, and Meekhof DM, J. Res. Natl. Inst. Stand. Technol. 103, 259 (1998). [DOI] [PMC free article] [PubMed] [Google Scholar]
- [19].Brewer SM, Chen J-S, Hankin AM, Clements ER, Chou CW, Wineland DJ, Hume DB, and Leibrandt DR, Phys. Rev. Lett. 123, 033201 (2019). [DOI] [PubMed] [Google Scholar]
- [20].Zipkes C, Ratschbacher L, Sias C, and Köhl M, New J. Phys. 13, 053020 (2011). [Google Scholar]
- [21].Monroe C, Meekhof DM, King BE, Jefferts SR, Itano WM, Wineland DJ, and Gould P, Phys. Rev. Lett. 75, 4011 (1995). [DOI] [PubMed] [Google Scholar]
- [22].Chen J-S, Ph.D. thesis, University of Colorado, Boulder, 2017. [Google Scholar]
- [23].DeVoe RG, Phys. Rev. Lett. 102, 063001 (2009). [DOI] [PubMed] [Google Scholar]
- [24].Safronova MS, Kozlov MG, and Clark CW, Phys. Rev. Lett. 107, 143006 (2011). [DOI] [PubMed] [Google Scholar]
- [25].Matei DG, Legero T, Häfner S, Grebing C, Weyrich R, Zhang W, Sonderhouse L, Robinson JM, Ye J, Riehle F, and Sterr U, Phys. Rev. Lett. 118, 263202 (2017). [DOI] [PubMed] [Google Scholar]
- [26].Chou CW, Hume DB, Thorpe MJ, Wineland DJ, and Rosenband T, Phys. Rev. Lett. 106, 160801 (2011). [DOI] [PubMed] [Google Scholar]
- [27].Hume DB and Leibrandt DR, Phys. Rev. A 93, 032138 (2016). [Google Scholar]
- [28].Huang Y, Guan H, Liu P, Bian W, Ma L, Liang K, Li T, and Gao K, Phys. Rev. Lett. 116, 013001 (2016). [DOI] [PubMed] [Google Scholar]
- [29].Huang Y, Guan H, Bian W, Ma L, Liang K, Li T, and Gao K, Appl. Phys. B 123, 166 (2017). [Google Scholar]
- [30].Dubé P, Madej AA, and Jian B, J. Phys.: Conf. Ser. 723, 012018 (2016). [Google Scholar]
- [31].Sanner C, Huntemann N, Lange R, Tamm C, and Peik E, Phys. Rev. Lett. 120, 053602 (2018). [DOI] [PubMed] [Google Scholar]
- [32].Pagano G, Hess PW, Kaplan HB, Tan WL, Richerme P, Becker P, Kyprianidis A, Zhang J, Birckelbaw E, Hernandez MR, Wu Y, and Monroe C, Quantum Sci. Technol. 4, 014004 (2019). [Google Scholar]
- [33].Chiaverini J and Sage JM, Phys. Rev. A 89, 012318 (2014). [Google Scholar]
- [34].Jurcevic P, Shen H, Hauke P, Maier C, Brydges T, Hempel C, Lanyon BP, Heyl M, Blatt R, and Roos CF, Phys. Rev. Lett. 119, 080501 (2017). [DOI] [PubMed] [Google Scholar]
- [35].Ratschbacher L, Sias C, Carcagni L, Silver JM, Zipkes C, and Köhl M, Phys. Rev. Lett. 110, 160402 (2013). [DOI] [PubMed] [Google Scholar]
- [36].Meir Z, Sikorsky T, Ben-shlomi R, Akerman N, Dallal Y, and Ozeri R, Phys. Rev. Lett. 117, 243401 (2016). [DOI] [PubMed] [Google Scholar]
- [37].Schowalter SJ, Dunning AJ, Chen K, Puri P, Schneider C, and Hudson ER, Nat. Commun. 7, 12448 (2016). [DOI] [PMC free article] [PubMed] [Google Scholar]
- [38].Scherschligt J, Fedchak JA, Barker DS, Eckel S, Klimov N, Makrides C, and Tiesinga E, Metrologia 54, S125 (2017). [DOI] [PMC free article] [PubMed] [Google Scholar]
- [39].Davis J, Dubé P, and Vutha AC, arXiv:1901.06443. [Google Scholar]
- [40].Sakurai JJ, Modern Quantum Mechanics (Addison-Wesley, New York, 1994). [Google Scholar]
- [41].Stuart H, Elektrische und optische polarisierbarkeit von molekeln, in Landolt-Börnstein Zahlenwerte und Funktionen, edited by Eucken Arnold and Hellwege KH (Springer-Verlag, Berlin, 1951), Vol. 1, Pt. 3, p. 510. [Google Scholar]
- [42].Akindinova EV, Chernov VE, Kretinin IY, and Zon BA, Phys. Rev. A 79, 032506 (2009). [Google Scholar]
- [43].Dalgarno A, McDowell MC, and Williams A, Phil. Trans. R. Soc. Lond. A 250, 411 (1958). [Google Scholar]
- [44].Côté R and Dalgarno A, Phys. Rev. A 62, 012709 (2000). [Google Scholar]
- [45].Goldstein H, Poole C, and Safko J, Classical Mechanics, 3rd ed. (Addison Wesley, New York, 2002). [Google Scholar]
- [46].Chen K, Sullivan ST, and Hudson ER, Phys. Rev. Lett. 112, 143009 (2014). [DOI] [PubMed] [Google Scholar]
- [47].Wübbena JB, Amairi S, Mandel O, and Schmidt PO, Phys. Rev. A 85, 043412 (2012). [Google Scholar]
- [48].Yoshida H, Phys. Lett. A 150, 262 (1990). [Google Scholar]
- [49].Huber KP and Herzberg G, Constants of diatomic molecules (data prepared by J. W. Gallagher and R. D. Johnson III) in NIST Chemistry WebBook, NIST Standard Reference Database Number 69, edited by Linstrom PJ and Mallard WG, National Institute of Standards and Technology, 10.18434/T4D303. [DOI] [Google Scholar]
- [50].Vutha AC, Kirchner T, and Dubé P, arXiv:1812.00973v1. [Google Scholar]
- [51].Łach G, Jeziorski B, and Szalewicz K, Phys. Rev. Lett. 92, 233001 (2004). [DOI] [PubMed] [Google Scholar]
- [52].Maroulis G, Chem. Phys. Lett. 226, 420 (1994). [Google Scholar]
- [53].Bridge NJ and Buckingham AD, Proc. Royal Soc. A 295, 334 (1966). [Google Scholar]