

Abstract
Encapsulation of cells inside microfluidic droplets is central to several applications involving cellular analysis. Although, theoretically the encapsulation statistics are expected to follow a Poisson distribution, experimentally this may not be achieved due to lack of full control of the experimental variables and conditions. Therefore, there is a need to automatically detect droplets and enumerate cell counts within droplets so that this can be used as process control feedback to adjust experimental conditions. In this study, we use a deep learning object detector called You Only Look Once (YOLO), an influential class of object detectors with several benefits over traditional methods. This paper investigates the application of both YOLOv3 and YOLOv5 object detectors in the development of an automated droplet and cell detector. Experimental data was obtained from a microfluidic flow focusing device with a dispersed phase of cancer cells. The microfluidic device contained an expansion chamber downstream of the droplet generator, allowing for visualization and recording of cell-encapsulated droplet images. In the procedure, a droplet bounding box is predicted, then cropped from the original image for the individual cells to be detected through a separate model for further examination. The system includes a production set for additional performance analysis with Poisson statistics while providing an experimental workflow with both droplet and cell models. The training set is collected and preprocessed before labeling and applying image augmentations, allowing for a generalizable object detector. Precision and recall were utilized as a validation and test set metric, resulting in a high mean average precision (mAP) metric for an accurate droplet detector. To examine model limitations, the predictions were compared to ground truth labels, illustrating that the YOLO predictions closely matched with the droplet and cell labels. Furthermore, it is demonstrated that droplet enumeration from the YOLOv5 model is consistent with hand counted ratios and the Poisson distribution, confirming that the platform can be used in real-time experiments for cell encapsulation optimization.
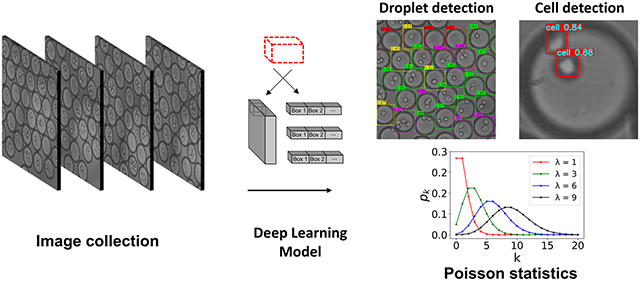
Graphical Abstract
A dual model object detection system for high precision monitoring of cell encapsulation statistics in microfluidic droplets with comparisons from YOLOv3 and YOLOv5 performance.
1. Introduction
Droplet microfluidics often involve encapsulation of cells and beads in individual drops of volumes ranging from nanoliters to picoliters [1, 2]. This approach is unique as thousands to millions of droplets can be generated with encapsulated objects using microfluidic flow-focusing devices [3, 4]. Such an approach has opened a wide array of applications ranging from cell culture models [5] to emulsion PCR [6] to single-cell studies [7]. One influential technology that utilizes this is Drop-seq, capable of analyzing mRNA transcripts from thousands of individual cells (e.g., mouse retinal cells) by encapsulating individual barcoding beads inside the droplets [8]. Other critical applications using customized generators to analyze specific components of biological cells include genomic, epigenomic, transcriptomic, and proteomic studies [9-13]. The success of these applications relies on robust and reproducible encapsulation of a defined number of cells or beads, indicating the need for techniques to detect, monitor, and control encapsulation, preferably in real-time.
Studies show that encapsulation statistics of objects in microfluidic droplets follow a Poisson distribution, i.e., to minimize the number droplets containing two or more objects a maximum of 10% would contain only one object [1, 14]. Clearly, such a theoretical single-object encapsulation rate, with a lambda value of 0.1, is inefficient leaving 90% of droplets containing no objects. In result, strategies to sort droplets have been implemented to address this limitation [15]. The encapsulation efficiency can further suffer from additional experimental issues such as cell sedimentation, aggregation, or clogging during the experiment necessitating significant operator supervision to ensure high efficiency encapsulation. One approach to ensure Poisson statistics and address these experimental issues associated with a long operation time is using a magnetic stirrer to mix the cells while the dispersed phase is running. However, this could be damaging to the cells and require a complex and challenging setup with homemade syringes and expensive equipment [16, 17]. If no automatic stirring device is present, droplet generation can be a time-consuming process of adjusting experimental variables such as cell concentrations, droplet diameters, and flow rates of the dispersed and continuous phase [18-20].
Machine learning (ML) approaches offer promise to reduce the burden on operator supervision of cell encapsulation by auto-detecting both droplets and encapsulated objects from acquired images. Indeed, recently, several studies have successfully implemented ML approaches in droplet microfluidic studies, see Table 1. Most modern object detectors use Convolutional Neural Networks (CNNs) to learn high level features from the training set to predict multiple bounding box coordinates in an output tensor [21-23]. You Only Look Once (YOLO), an influential object detector [24], is based on having the whole detection pipeline as a single network, i.e., going straight from image pixels to bounding box coordinates and class probabilities. This approach makes YOLO detectors faster and more lightweight than most other object detectors [25, 26]. In recent years, there have been several updates to increase performance from the original publication in 2016 including: (1) YOLOv3 in 2018, (2) YOLOv4 in April 2020, and (3) YOLOv5 in June 2020 [26-28]. The most recent update, YOLOv5, was released shortly after the YOLOv4 model and, although maintained on GitHub with the PyTorch library, is not well supported yet by a published paper [28-30]. Therefore, we pursue both YOLOv3 and YOLOv5 models and compare the results from the two object detectors.
Table 1.
ML approaches in droplet microfluidic studies summarizing application, the model architecture used, the detection output and detection capability.
| Droplet Application |
ML Model | Detection Output | Detection Capability |
Reference | |
|---|---|---|---|---|---|
| Droplet | Cells | ||||
| Coalescence | YOLOv3, SSD | Multiple Droplets | No | ≈ 117 drop/sec | Arjun et al., 2020 [31] |
| Regimes of droplet generation | Handcrafted CNN classifier | Breakup Behavior | No | ≈ 100 drop/sec | Chu et al., 2019 [32] |
| Droplet Optimization | Watershed Segmentation, Bayesian Optimization | Multiple Droplets | No | ≈ 135 drop/sec | Siemenn et al., 2022 [33] |
| Cell Sorting | Handcrafted CNN classifier | Single Droplet | No | ≈ 200 drop/sec | Anagnostidis et al., 2020 [34] |
| Cell Sorting | YOLOv4-tiny | Single Droplet | Yes | ≈ 60 drop/sec | Howell et al., 2021 [35] |
| Cell Sorting | Image thresholding and SVM | Single Droplet | Yes | ≈ 50 drop/sec | Sesen et al., 2020 [36] |
| Cell encapsulation | YOLOv3, YOLOv5 | Multiple Droplets | Yes | ≈ 1080 drop/sec | This work |
Studies that have reported the application of machine learning in droplet-based microfluidics can be broadly classified into two groups (see Table 1). In the first group, studies have implemented ML approaches to physical mechanisms such as coalescence and droplet breakup that are relevant to droplet-microfluidic applications. For example, Arjun et al. deployed both Singleshot Multibox Detector (SSD) and YOLOv3 object detectors to classify merged droplets into three categories of low mixing, intermediate mixing, and high mixing from binary coalescence [31]. Likewise, Siemenn et al. developed a method employing Bayesian optimization and watershed segmentation with targets of circularity and droplet yield to converge to optimum flow rates [33]. In the second group, studies have focused on cell sorting where the objective is to encapsulate cells and use machine learning approaches to detect individual droplets with cells so that they can be sorted. For example, Howell et al used YOLOv4-tiny to detect cells, beads, and cell doublets in microfluidic droplets and performed ML-assisted sorting [34, 35].
The present work follows closely the studies in the second group that involve cell encapsulation. Rather than training a model on single droplets, here, we increase the throughput of detection by training the model on a collection of droplets present in the expansion chamber of the microfluidic device. Employing our detector in this manner allows for several advantages over previous droplet studies including: (1) simultaneous droplet and cell detection, (2) higher detection capability, (3) superior precision, and (4) real time statistical analysis. Specifically, our automated detector not only labels droplets containing cells, but also detects the individual cells inside the droplets, providing information on cellular aggregates.
To build the detector we employed the new YOLOv5 model and well-known YOLOv3 PyTorch implementation while comparing their performances [28, 29, 37]. With our lightweight object detection method, it is feasible to process over 1080 droplet per second, whereas other studies found in Table 1 detect less than 200 droplets per second. After the boundary of the droplet is realized from one model (droplet model) the individual cells are predicted for each droplet with another pass through the YOLO layers (cell model). We received high mAP and precision when training the models in this manner resulting in less false positive cell predictions. Lastly, with our high detection capability, we evaluated droplet ratios from numerous YOLO predictions for Poisson distribution comparison to provide real-time statistical analysis for future experiments. This detector can be leveraged for cell encapsulation experiments to assemble a process control inspection, where the droplet fractions containing cells are compared to the Poisson distribution in real time, allowing for cell visualization and their aggregation events for future analysis. Furthermore, the droplet flow rate parameters could be controlled to obtain the correct encapsulation ratios through a Bayesian optimization technique. For example, instead of using a circularity and yield target as in Siemenn et al., a monodispersity and cell encapsulation ratio target could be used to predict the correct flow rates to use in the experiment [33]. Single cell encapsulation experiments are already limited from the Poisson distribution, where only 10% of droplets contain cells. In result, this optimized process where a software predicts the correct control parameters for complete automation is essential to obtain the correct droplet ratios[2, 38]. Finally, the process control inspection can allow for a feedback loop so that experimental variables may be regulated to keep the maximum Poisson ratio [39].
This paper is structured as follows: Sec. II gives a brief overview of microfluidic device fabrication and cell culture, in addition to the process used for data collection and annotations. Sec. III presents the results of model training, testing, and predictions of both droplet and cell bounding boxes. In addition to test set metrics, the droplet ratios from the trained model are compared to hand counted images as well as the Poisson distribution. Lastly, Sec. IV gives the final remarks and future strategies to improve the detector for production employment.
2. Results and Discussion
A. Data Collection and Preparation for ML Models
Image data sets were collected by conducting microfluidic experiments along with video acquisition. As shown in Fig. 1a, b, the flow-focusing device was used to produce droplets that encapsulated PC3 cancer cells. These generated droplets flow into the downstream collection chamber where their velocity was reduced to form an ensemble of droplets. Images for ML model generation were collected from only the collection chamber at 100 frames per second (Fig. 1c). These images were used for two different types of ML models: (1) an object detection model to detects individual droplets in the ensemble referred to as the droplet model, and (2) an object detection model to detect the cells inside the droplets referred to as the cell model.
Fig. 1.

(a) The physical microfluidic device used for droplet generation. The continuous phase inlets (1,2) and discrete phase inlet (3) are marked on the left with the outlet of the device on the right (4). The orifice and expansion chamber are labeled with black arrows. (b) A zoomed in view of the droplet generation process. The white circles in the discrete phase are PC3 cancer cells in aqueous suspension. Images are spaced at 10 ms so that the shearing at the orifice and droplet generation is visualized. Individual droplets take only 30 ms to pass allowing for high throughput droplet generation. Scale bar: 150 μm. (c) The expansion chamber of the droplet generator device with droplets tightly packed together. The red box indicates the microscope visualization box displayed on the computer. Scale bar: 400 μm.
For the droplet model, preprocessing consisted of cropping a square section in the collection-chamber image that was filled with droplets and skipping images to make sure the same droplet did not appear in the training set twice. For most of the experiments, this square section was in the middle of the collection-chamber. Around every 50th frame in the video was pre-processed and uploaded to Roboflow Annotate (Roboflow, Des Moines, Iowa) to begin annotations [40]. During the annotation process, the images containing a majority of droplets with one or zero cells were discarded to maintain an even class balance ratio.
The cell model was to detect the cells inside each of the droplets that were predicted from the droplet model. For the cell model, preprocessing consisted of taking every 5th image in the droplet dataset (training, validation, and test set) and cropping the annotated droplets with one or more cells. The droplets without cells were not used since this would result in no annotations for model training. The ground truth bounding boxes from the droplet model were exported from Roboflow in YOLO label format and converted to corner coordinate format so that the individual droplet images could be cropped from the larger image containing multiple droplets. After the width and height were averaged the cropped images were uploaded to Roboflow Annotate to draw bounding boxes on cells [40].
A typical representation of an annotated training example for the droplet model can be seen in Fig. 2(a). The four different classes in the dataset include: (1) drop_0cell (red box), are droplets with no cells encapsulated (2) drop_1cell (yellow box), are droplets with one cell encapsulated as, (3) drop_2cell (green box), are droplets with two cells encapsulated and (4) drop_3cell are (pink box) droplets with more than two cells encapsulated. In all training and testing examples, there are some droplets that are cutoff and not fully contained in the cropped image. To minimize the effect of wrongly classifying droplets, the bounding boxes were only drawn around the droplets that were approximately more than 85 % in the image. This was done to train the object detection model to not inaccurately classify droplets that have a cell not contained within the boundaries of the image.
Fig. 2.

Ground truth annotation summary for the droplet (a) and cell (b) models used as training examples. The droplet model images include four different annotated classes of drop_0cell representing a droplet with 0 cells (red boxes), drop_1cell representing a droplet with one cell (yellow boxes), drop_2cell representing a droplet with two cells (green boxes), and drop_3cell representing a droplet with three or more cells (pink boxes). The cell model training examples include one annotated class representing the individual cells in each droplet (green boxes).
Typical annotated training examples for the cell model are illustrated in Fig. 2(b) with bounding boxes drawn for all distinguishable cells. We note that the droplet model discussed above is sufficient for calculating the Poisson statistics, however, labeling the bounding boxes for each cell in the droplet allows for phenotypic analysis of individual cells encapsulated in the droplets. The phenotypic analysis of individual cells could be useful in the future to relate application outcomes to variations in individual cellular features.
For both ML models, the cropped images were resized to a resolution of 544 x 544 pixels and split between three separate datasets. We chose to use 20% of the data for testing, leaving 80% for training and validation sets. After taking another 20% for the validation set the resulting 64-16-20 split allowed for no bias or misrepresentation in test set performance. After a dataset was split, augmentations were applied to training sets, while validation and test sets were used as is to achieve testing on realistic examples. Specifically, there were three outputs per training example consisting of random combinations of vertical flip, hue change between −15° and +15°, and brightness change between −10% and +10%. Since data was collected over multiple experiments the image quality and brightness may fluctuate between examples. The brightness augmentations alleviated this variance and allowed for more generalizable data to be used for testing and inference [41]. The droplet model had only vertical flipping while the cell model had horizontal and vertical flipping since the cells can be in any orientation within the droplet. These image augmentations allowed the model to be more robust to data that it had not seen before by increasing the diversity of input examples.
A total summary of the dataset before augmentation is described in Table 2 where the total number of labels and images are provided for both models. The total count for the number of images and labels in the droplet model is 643 and 14,916 respectively while the total count for the images and labels for the cell model is 2,063 and 4,207 respectively.
Table 2.
Model Annotation Summary Before Augmentation. Drop_0cell refers to a droplet with zero cells, Drop_1cell a droplet with one cell, Drop_2cell a droplet with two cells, and Drop_3cell a droplet with three or more cells.
| Label/Set | Total Count | Training | Validation | Test |
|---|---|---|---|---|
| Droplet Model | ||||
| Drop_0cell | 3519 | 2451 | 483 | 585 |
| Drop_1cell | 4308 | 3067 | 572 | 669 |
| Drop_2cell | 3585 | 2487 | 539 | 559 |
| Drop_3cell | 3504 | 2447 | 535 | 522 |
| Combined | 14916 | 10452 | 2129 | 2335 |
| Images | 643 | 412 | 103 | 128 |
| Cell Model | ||||
| Cells | 4207 | 2695 | 666 | 846 |
| Images | 2063 | 1321 | 330 | 412 |
B. ML Models and Performance Metrics
Typical applications of microfluidic droplet generation operate at speeds of a few to tens of kHz [1]. This results in thousands of droplets produced in one second, requiring a fast object detector to process as many droplets as possible. Since the YOLO object detector goes straight from image pixels to bounding box coordinates it is faster and more lightweight than other object detectors. With high computational power and state of the art GPU’s the more recent versions of YOLO can reach up to 100 FPS depending on the accuracy and dataset used [25, 26]. In the droplet model, we use the recently developed YOLOv5 model and the established YOLOv3 PyTorch implementation from Ultralytics Inc., to compare their performances. In the cell model, we employ the more established YOLOv3 PyTorch implementation and leave the newer YOLOv5 model for further production applications. The full model architectures for YOLOv3 and YOLOv5 can be seen in Figures S3 and S4.
The workflow for the droplet and cell ML models are shown in Fig. 3. Images were preprocessed and the annotations were performed in Roboflow. The labeled data set is stored with an 80, 10, 10 split between training, validation, and test sets. The dataset is transferred to Google Colaboratory and passed through the YOLO object detector containing a feature extractor and output tensor. Feature extraction is the process by which an initial set of data is reduced by identifying key features, giving a higher-level view of objects in the data set examples. The output tensor for the YOLO model is divided into multiple grid cells each containing numerous bounding boxes. For each proposed bounding box there exists nine parameters containing four spatial coordinates (tx, ty representing the box center and tw, th representing the box width and height), four class probabilities (p1, p2, p3, p4), and one confidence value as the likelihood of the proposed box being a droplet (C). After thresholding the proposed box confidence values there may still be multiple bounding boxes for one droplet. Non-maximum-suppression (NMS) technique was employed to obtain the proposed bounding box with the highest confidence value. Finally, the resulting bounding box coordinates were stored, and the final YOLO class predictions were compared against ground truth labels with python plotting libraries. A second model was trained to detect each cell in an individual predicted droplet after cropping and resizing. The bounding box annotations in the droplet model were used to crop individual droplets that subsequently pass through a separate YOLO model with the same architecture as the droplet model for detecting cells within droplets. Lastly, the enumerated droplet class predictions for a separate production set were subsequently used to investigate the Poisson statistics.
Fig. 3.

Machine learning workflow for detecting cell-laden droplets and encapsulated cells. The left displays the steps taken to train and test the droplet model including the bounding box annotations, YOLO architecture, and droplet counting. The right displays the cell model after the droplet predictions are cropped and resized. Predictions are illustrated for both droplet and cell models for an example image in the production set. The numbers displayed on the colored boxes indicate the confidence values of the predictions.
In object detection models, to compare performance, the research community has converged to a single important metric capturing precision, intersection over union (IOU), and confidence threshold, called mean average precision (mAP) [42, 43]. Precision can be defined as the proportion of correct positive identifications and can be calculated by taking the ratio of true positives over the total number of predictions:
| (1) |
where TP and FP are the number of true positive and false positive predictions, respectively. On the other hand, recall is the proportion of actual predictions identified correctly:
| (2) |
where FN is the number of false negative predictions. The total mAP is an advanced calculation that uses the precision recall curves at different IOU thresholds to determine the mAP for each class, then averages each of the classes together:
| (3) |
This formula is a representation of the mAP for the COCO challenge [28, 43]. Microsoft released the MS COCO dataset in 2015 [44]. It has become a common benchmark dataset for object detection models since then. Here, j is a sum over the ten IOU thresholds in the COCO challenge (0.5 to 0.95 at intervals of 0.05), k is a sum over the 101 interpolated confidence threshold points on the precision-recall curve, and i is a sum of the number of classes, C, used in the dataset. Thus, the metric incorporates how well a model performs when it is guessed correctly (precision), if the model guessed every time that it should have guessed (recall), and at different threshold levels. For this reason, we used the mAP calculation in our studies to determine model performance.
C. Model Performance
Both YOLOv3 and YOLOv5 models were trained and tested on an NVIDIA Tesla P100-PCIE-16GB GPU offered by Google Colaboratory Pro platform with a patience level of 100 epochs for early stopping. For the droplet model, YOLOv3 training took approximately 11 hours to complete 468 epochs with no improvements after epoch 367 while YOLOv5 training took approximately 4 hours to complete 475 epochs with no improvements after epoch 374. Thus, the best weights were taken at epoch 367 and 374 for YOLOv3 and YOLOv5, respectively. For the cell model, YOLOv3 training took approximately 25 hours to complete 351 epochs with no improvements after epoch 250 while YOLOv5 training took approximately 4 hours to complete 139 epochs with no improvements after epoch 38. Thus, the best weights were taken at epoch 250 and 38 for YOLOv3 and YOLOv5, respectively. It is clear that YOLOv5 took a shorter amount of time for droplet and cell model training, most likely due to the optimized complete IOU loss implemented in the YOLOv5 objectness loss function [45].
During the droplet model training, precision and recall were calculated at each epoch for the validation set, as well as the mAP at 0.5 IOU and 0.5-0.95 IOU shown in Fig. 4 (a) and (b). The curves are quite similar for both YOLOv3 and YOLOv5 architectures, however, for the YOLOv5 model the mAP value seems to converge and stabilize quicker. Additionally, both models take around the same number of epochs to hit a patience level of 100 for early stopping. After training was completed, the model was evaluated with the test set to see the performance on data that it had not seen before. The performance of an object detector can be thoroughly described by the precision recall curve illustrated in Fig. 4 (c) and (d) for YOLOv3 and YOLOv5 models respectively. This curve (used for the mAP calculation) incorporates both precision and recall values as the confidence level of the predictions decrease [42]. The confidence threshold will not allow any of the proposed boxes with confidence value C lower than the threshold to be used as a prediction. For all four classes of the droplet model, the precision declines and recall increases as the confidence threshold decreases, symbolizing that the model is making healthy predictions in the test set.
Fig. 4.

Droplet model validation (a, b) and test (c, d) set metrics for both YOLOv3 and YOLOv5 networks. The validation metrics show the mAP at 0.5 IOU threshold and 0.5-0.95 IOU threshold for all epochs trained with both models. Since we used early stopping with a patience of 100 for both models, the best weights for YOLOv3 was taken at 367 epochs while the YOLOv5 weights were saved at 364 epochs. The test set metrics display the precision recall curve at 0.5 IOU threshold for each class in both models. This curve illustrates that as the bounding box confidence decreases the recall will increase and the precision will decrease.
An additional tool to evaluate model performance on the test set is a multiclass confusion matrix. In a confusion matrix the model predictions are compared to the ground truth labels. For a prediction to match with a ground truth box the IOU has to be greater than a certain threshold. If the classes match between the prediction and label, then the prediction is defined as a true positive. The confusion matrix in Fig. 5 represents how well the model does at predicting the right class for the bounding boxes. It is shown that only a small number of predicted labels are predicted as the wrong class (see Sec. 2D for model failures). Furthermore, most of the predictions are correctly predicted with the appropriate class.
Fig. 5.

YOLOv3 and YOLOv5 confusion matrix for the droplet model test set. The vertical axis represents the predicted droplets while the horizontal axis represents the ground truth droplets. The color bar on the right shows the colormap from 0 to the maximum predictions where darkest blue color represents the maximum predictions. The confusion matrices were evaluated at a confidence and IOU threshold of 0.25 and 0.45 respectively.
To give a more in-depth comparison of the YOLOv3 and YOLOv5 models evaluated on the droplet model we compared test set metrics from the best weights after training. The mAP and FPS for both networks in Table 3 reveal that the mAP is nearly the same while the FPS in the YOLOv5 model is much faster. In addition to the average mAP comparisons, we provide a more comprehensive analysis for all classes of the droplet model in Table S1.
Table 3.
Droplet model test set comparisons between YOLOv3 and YOLOv5 networks. (@ 0.5 IOU) represents the mAP at 0.5 IOU threshold while (@ IOU 0.5:0.95) represents the mAP averaged between 0.5 to 0.95 IOU threshold with intervals of 0.05. The FPS is defined as inverse of the average inference time.
| Network/Metric | mAP (@ 0.5 IOU) |
mAP (@ 0.5:0.95 IOU) |
FPS (1/Inference) |
|---|---|---|---|
| YOLOv3 | 0.97 | 0.91 | 47 |
| YOLOv5 | 0.97 | 0.91 | 68 |
Furthermore, the inference time of the cell model would also have to be fast since multiple droplets require cell detection in each frame (around 20 droplets per image). Each of the droplet images, after detection and cropping from the droplet model, are resized and ran through another YOLO pass for inference. Thus, it is critical that a fast object detector is utilized for the cell model so that the cells may be detected in real time for each predicted droplet. Table 4 demonstrates that both YOLO models allow for fast inference time with the newer YOLOv5 at 63 FPS reaching 16 FPS more than the original YOLOv3. Additionally, both networks reach a high mAP metric at IOU threshold of 0.5. However, as with all object detection models when the precision is averaged over all IOU thresholds from 0.5 to 0.95 the mAP decreases. This decrease to 0.72 is most likely due to the predicted box not exactly matching with the ground truth box, leading to incorrect predictions at IOU threshold of 0.9. Furthermore, with fast inference time and high mAP at 0.5 IOU, the predictions allow for the encapsulated cells to be visualized with high throughput during generation experiments.
Table 4.
Cell model test set comparisons between YOLOv3 and YOLOv5 networks. (@ 0.5 IOU) represents the mAP at 0.5 IOU threshold while (@ IOU 0.5:0.95) represents the mAP averaged between 0.5 to 0.95 IOU threshold with intervals of 0.05. The FPS is defined as inverse of the average inference time.
| Network/Metric | mAP (@ 0.5 IOU) |
mAP (@ 0.5:0.95 IOU) |
FPS (1/Inference) |
|---|---|---|---|
| YOLOv3 | 0.99 | 0.72 | 47 |
| YOLOv5 | 0.99 | 0.71 | 63 |
A more detailed analysis of cell model performance is described in Fig. S5 and Table S2. A high precision was reached for all classes in both droplet and cell models. Specifically, a precision of 98% was realized from the cell model for both YOLOv3 and YOLOv5, 6% higher than previously reported single cell detection and 17% higher than cell aggregates in Howell et al. [35]. Our method can detect every cell in the droplet, allowing for cell aggregation events to be realized with distance analysis. Thus, both models together can not only detect the droplet itself containing different number of cells but a single cell or cell aggregates with high precision.
With YOLOv5 built as a lightweight model for fast inference, it was shown for both droplet and cell datasets to be greater than 15 FPS faster than YOLOv3 while sacrificing little performance in mAP. In production applications, droplets are produced at high frequencies, thus fast inference time in both models are critical. In result of both YOLO networks having similar test set metrics and YOLOv5 almost 50% faster than YOLOv3 we used YOLOv5 for further analysis and testing. Specifically, we used the YOLOv5 model to examine model predictions and study Poisson statistics, however the results were similar with the YOLOv3 network.
D. Predictions and Cell Visualization
Only examining ordinary test set metrics without visualizing incorrect box predictions from YOLO results give a narrow view of model inference and performance [41]. For this reason, we compared predictions with ground truth labels for both droplet and cell models to examine model failures. An example prediction from the droplet model test set in Fig. 6 show that the predictions match with the ground truth labels. Here, Fig. 6(a) represents the ground truth labels, while Fig. 6(b) illustrates the YOLOv5 predictions with examples of negatives and positives. At a closer look, nearly all predictions are correct including the droplets that have less than 85% of the volume contained in the image. However, there is one false positive towards the bottom of the image signifying a droplet that most likely does not contain any cells. By only providing annotations for the droplets that contained more than 85% of the volume in the image the model was able to suppress nearly all the other droplets on the boundary of the image. This advantage from the YOLO model allows the ratio of droplets to be preserved with only one false positive on the boundary predicted as a droplet with zero cells. Furthermore, with around 80% volume in the image has a high probability that the droplet does not contain a cell on the right side. A larger set of random testing examples with predictions are provided in Fig. S6.
Fig. 6.

Ground truth (a) and predicted (b) boxes for one test set image in the droplet model containing four classes. The predictions were ran using the YOLOv5 model weights while the NMS was conducted with an IOU threshold of 0.45. The confidence threshold for plotting bounding boxes was set to 0.6. Examples of a true negative, true positive, and false positive are provided on the bottom of the predictions.
An object detector for the entire droplet boundary only gives the ratios of the different cell encapsulation events. To obtain more information about the encapsulated cells, such as size, shape, or distance, another object detector is trained to detect bounding boxes around the individual cells inside the droplets. Several examples of ground truth labels (green) and predictions (red) in Fig. 7 (a-d) demonstrate that the predictions have a high IOU with the ground truth annotations. The top labels on the predicted boxes give the confidence value of that prediction in cyan. For the YOLOv5 predictions, the NMS was conducted with an IOU threshold of 0.6, while the confidence threshold for plotting the detections was fixed to 0.25. Since there were no false negatives or false positive predictions only true positive examples are shown. A larger set of random testing examples with predictions is provided in Fig. S7. This cell model could be used, for example, to display the individual droplets on a second screen during a droplet experiment, thus displaying exactly where the cells are inside the droplets. If many of the cells show a certain characteristic (perhaps a specific shape, size, or fluorescence) the system will alert the user of that specific property.
Fig. 7.

Ground truth and predicted boxes for four test set images in the cell model (a-d). The green boxes show the ground truth annotations, while the red boxes show the theYOLOv5 prediction with the objectness (confidence value) of each prediction in cyan.
E. Comparison with Poisson Statistics
For an ML model to be ready for production implementation, the predictions must be compared at a higher level than ordinary mAP, precision, and recall. This is accomplished by hand counting droplet percentages and comparing directly to YOLOv5 predictions. Droplet totals from a collection of 1,000 images in the production set were manually counted and stored so that proportions can be measured against the number of droplets predicted from YOLOv5. Subsequently, the YOLO output tensor is computed for the same set of images in the production set, droplets are totaled from the prediction results, and the two sets of proportions are analyzed in Fig. 8 (a, b). In this comparison the x axis represents droplets with zero, one, two, or greater than two cells encapsulated while the y axis represents the total percentages of those droplets. In both batches of 500 images the ratios determined from YOLOv5 predictions and hand counting are in good agreement. The representation of the number of droplets in this manner confirm that for a larger set of images (500 in this case) the YOLO model will detect nearly the same droplet proportions as counting them by hand. To verify the statistics match with a reduced number of images, a random sequential batch of 50 images (equivalent to 0.5 seconds) from the two separate trials of 500 hand counted images is used. The random batch is chosen by defining a random seed in python (pseudo-random pool of numbers) and returning an integer between zero and nine. Furthermore, the manually counted droplet proportions for the smaller set of 100 images are compared to droplet totals computed from YOLOv5 model in Fig. S8. This comparison also shows good agreement indicating the YOLO model provides accurate droplet proportions for both small and large number of images.
Fig. 8.

The fraction of droplets containing zero, one, two, or greater than two cells. Droplets are counted from YOLOv5 predictions (red) and by hand (green) for a total of 1,000 images over two trials. The images were preprocessed from the original video (taken at 100 FPS) resulting in a five second time frame for each trial. The NMS for the YOLOv5 model was completed with an IOU threshold of 0.45 while the confidence threshold was set to 0.6.
Encapsulating cells delivered to the droplet-generation nozzle at random is a process which yields a resulting population of droplets with Poisson distributed cell occupancy [1, 7]. Cell encapsulation, and more importantly single-cell encapsulation experiments rely on this randomness to obtain statistical significance for rare cell enumeration. The probabilistic nature essentially represents a theoretical maximum for obtaining single cell encapsulation without contamination from multiple cell droplets [1]. The Poisson distribution can be described by the probability mass function:
| (4) |
where X is a discrete random variable, k is the number of cells in each droplet (k = 0, 1, 2 …), and λ is the expected value of X. Since the number of cells in each droplet can only be a whole number, the expected value, λ, can be calculated by multiplying the bulk concentration (in cell/mL) and droplet volume (in mL). It is imperative that during a cell encapsulation experiment the ratios generally follow this distribution to achieve statistical significance with the correct proportion of cells in droplets [10].
The Poisson distribution was determined with the expected value as the average number of cells in each droplet λ = c0 × v0) and the probability mass function in Eqn. 3 to calculate the theoretical droplets with zero, one, two, or more than two cells. A high cell concentration was used in our experiments to keep the class balance for the droplet model roughly even for healthy training. We utilized ImageJ over a period of multiple trials to determine the droplet diameter for the volume calculation (v0 = 212 pL), while the initial cell concentration was counted from the hemacytometer before droplet generation (c0 = 7 × 10⁶ cell/mL. This resulted in a lambda value of 0.15, typical of microfluidic droplet experiments. Production set images and YOLOv5 weights were used for droplet enumeration where the y axis defines the probability mass function (percentage of droplets) and x axis representing the number of cells in each droplet (k). Illustrated in Fig. 9, images were collected from two separate trials with the same microfluidic flow rate and cell concentration for each. The videos were recorded at similar time points between the two trials so that they could be sufficiently compared. A trial consisted of first recording a video at the start of the experiment to know the drop numbers with a fresh syringe of cells. Then to investigate the droplet proportions after long operation time another video was recorded after the cell suspension ran for an extended period of time (after 60 minutes). For the second trial, the syringe from the first run was replaced with cells from a new flask to simulate an alert system for cell replacement. The first trial in Fig. 9 (a) was executed with a total of 12,800 images: 6,400 from the beginning of the trial and 6,400 at the end.
Fig. 9.

The fraction of droplets containing zero, one, two, or greater than two cells in the first (a) and second (b) trials. For each trial a total of 12,800 images are used in combination with YOLOv5 model weights split between the beginning (red) and long operation time (maroon). The droplet proportions are compared with the theoretical Poisson distribution for each value of k (blue). The images were preprocessed from the original video (taken at 100 FPS) resulting in two 64 second time frames for each trial. The NMS for the YOLOv5 model was ran with an IOU threshold of 0.45 while the confidence threshold was set to 0.6.
The error bars were calculated by dividing the total amount of images in a trial by three and computing the standard deviation of the droplet proportions. This comparison reveals that in the beginning of the trial the proportion of droplets agree with the theoretical Poisson distribution. However, after a longer operation time the ratio diverges from Poisson statistics as the number of encapsulated cells decrease. This demonstrates that as the experiment runs the encapsulation events depreciate over time, thus using droplet detection to predict this divergence is beneficial. The second trial in Fig. 9 (b) reveals a similar trend with a favorable Poisson agreement in the beginning of the experiment. Therefore, having an automated alert system to detect this divergence, allowing for adjustments of the cell container with a feedback loop, would be advantageous for droplet generation experiments.
3. Conclusions
In this study we used both YOLOv3 and YOLOv5 CNN architectures to assemble an automated detector of whole droplets and the individual cells inside these droplets. A high precision was obtained for both droplet and cell models, indicating the number of false positives measured in the test set were low. The precision on the cell class itself was found to be approximately 11% higher as compared to previously reported studies on cell detection. We established that, for this dataset, the test set metrics were nearly the same while the YOLOv5 architecture outperformed YOLOv3 in inference time and training stability. As FPS is an important requirement for production applications, this finding shows that both algorithms, built as lightweight models to perform fast calculations, can detect microfluidic droplets with fast inference and high accuracy. More importantly, the YOLOv5 architecture has shown to be robust in microfluidic applications as well as slightly outperforming the YOLOv3 model in speed, therefore, alleviating some of the controversy associated with the PyTorch model.
After providing the relevant test set metrics for both models we manually counted droplet ratios for two sets of 50 sequential images and plotted them against the ratios determined from the YOLOv3 model. At small and large number of images our object detection droplet proportions were nearly identical to manually counting the droplets by hand, confirming operation close to human level performance. To illustrate that the trained model can be used for process control inspection we used the YOLOv3 model to compare with the theoretical Poisson distribution. We employed a total of 25,600 images from the production set and found that the ratio of droplets agree with Poisson statistics at first, but after running the suspension for long operation time the ratio of encapsulated cells dramatically decreases. This decay in cell encapsulation can be caused by several different factors, e.g., cell sedimentation or aggregation in the syringe, and illustrates the requirement for an automated detector with a real time comparison to the Poisson distribution. In the future we intend to optimize our droplet detector, explore more applications with droplet generation, and look for ways it can be seamlessly implemented in a production platform.
4. Experimental
A. Materials
Polydimethylsiloxane (PDMS) (Sylgard 184) for device fabrication was purchased from Dow Corning Corporation. Silicon wafers were purchased from University Wafers while the SU-8 50 negative photoresist and SU-8 developer were purchased from Kayaku. The alginic acid used for the discrete phase solution was purchased from Sigma-Aldrich. For the continuous phase the 008-FlouroSurfactant was purchased from RAN Biotechnologies, Inc, and the HFE 7500 fluorinated oil from 3M Novec.
B. Cell Culture
Human prostate cancer cell line PC-3 (ATCC CRL-1435™ VA) was cultured at 37 °C in F-12K growth medium containing 10% FBS and 1% penicillin/streptomycin with media changes every two days (Thermo Fisher). After cells reached around 80% confluency, they were released from culture flasks by a 0.05% trypsin–ethylenediaminetetraacetic acid (EDTA) (Invitrogen, CA) solution at 37 °C. Since the Poisson distribution requires an accurate analysis of the cell suspension concentration, the cells were carefully counted by a hemacytometer. A large cell concentration of approximately 7 × 10⁶ cells/mL was used to increase the number of droplets with 3 or more cells, thus decreasing the class imbalance for training. After uncovering the concentration from the cell counting plate, cells were centrifuged and suspended in 1 wt.% alginate solution before adding to pump syringe.
C. Microfluidic Device Fabrication
The flow-focusing microfluidic device was fabricated by standard soft lithography method [46]. Specifically, the desired features were drawn by AutoCAD and printed on a transparent film as a mask for UV light. Then, SU-8-2050 was spin-coated on a silicon wafer. After soft-baking, exposure to light, and post-baking, the unexposed photoresist was dissolved by SU-8 developer to obtain the final master [47, 48]. The height of the master is approximately 90 microns. To fabricate the PDMS replica, PDMS with 10:1 ratio of monomer to curing agent was thoroughly mixed and de-gassed for 30 minutes. After pouring on the SU-8 master and heating at 65 °C for two hours, the PDMS layer was detached from the SU-8 master. The droplet generator was formed by plasma treating the PDMS replica and flat PDMS slab, then bonding the two pieces together. The device surface was allowed to recover to a hydrophobic state after 3 days in an oven at 70 °C.
D. Experimental Setup
To gather images for model training and production testing, a proper experimental setup was necessary to collect sufficient data. Specifically, two microfluidic pumps (PHD 2000, Harvard Apparatus, Massachusetts, USA), a microscope stage system (Nikon eclipse TiU), a high-powered camera (Phantom v710 12-bit, Vision Research) and a desktop computer were used to capture high quality images from the experiment (Fig. S1). There are two syringe pumps for both the dispersed and continuous phase with cell suspension and fluorinated oil, respectively. The microscope stage holds the droplet generator while the digital camera is connected to the computer and microscope optical lens. This setup allows for the generated droplets in the expansion chamber to be effortlessly visualized for subsequent analysis and evaluation.
Supplementary Material
Acknowledgements
WL acknowledges support from National Science Foundation (CBET, Grant No. 1935792) and National Institute of Health (IMAT, Grant No. 1R21CA240185-01).
Footnotes
Conflicts of Interest
There are no conflicts to declare.
Data Availability
We believe that open-source code allows for greater innovation and cutting-edge research due to the ability of others incorporating additional features and testing. Scientific knowledge should not be contained, rather accessible for others to use freely in their own experiments. Furthermore, we would like to be transparent with this analysis and assist other researchers with more AI inspired microfluidic projects. For this reason, our adoption of YOLOv3 and YOLOv5 models along with the production set images can be found at https://github.com/karl-gardner/droplet_detection. Here, you can access the data associated with training, testing, and comparisons, for both droplet and cell models in a Google Colaboratory notebook and a shared Google Drive folder. We encourage others to contribute or use our trained model for testing or production purposes.
References
- 1.Matuła K, Rivello F, and Huck WTS, Single-Cell Analysis Using Droplet Microfluidics. Advanced Biosystems, 2020. 4(1): p. 1900188. [DOI] [PubMed] [Google Scholar]
- 2.Joensson HN and Andersson Svahn H, Droplet Microfluidics—A Tool for Single-Cell Analysis. Angewandte Chemie International Edition, 2012. 51(49): p. 12176–12192. [DOI] [PubMed] [Google Scholar]
- 3.Lagus TP and Edd JF, A review of the theory, methods and recent applications of high-throughput single-cell droplet microfluidics. Journal of Physics D: Applied Physics, 2013. 46(11): p. 114005. [Google Scholar]
- 4.Zhu P and Wang L, Passive and active droplet generation with microfluidics: a review. Lab on a Chip, 2017. 17(1): p. 34–75. [DOI] [PubMed] [Google Scholar]
- 5.Jang M, Yang S, and Kim P, Microdroplet-based cell culture models and their application. BioChip Journal, 2016. 10(4): p. 310–317. [Google Scholar]
- 6.Williams R, et al. , Amplification of complex gene libraries by emulsion PCR. Nature Methods, 2006. 3(7): p. 545–550. [DOI] [PubMed] [Google Scholar]
- 7.Collins DJ, et al. , The Poisson distribution and beyond: methods for microfluidic droplet production and single cell encapsulation. Lab on a Chip, 2015. 15(17): p. 3439–3459. [DOI] [PubMed] [Google Scholar]
- 8.Macosko Evan Z., et al. , Highly Parallel Genome-wide Expression Profiling of Individual Cells Using Nanoliter Droplets. Cell, 2015. 161(5): p. 1202–1214. [DOI] [PMC free article] [PubMed] [Google Scholar]
- 9.Zhu Z, et al. , Highly sensitive and quantitative detection of rare pathogens through agarose droplet microfluidic emulsion PCR at the single-cell level. Lab on a Chip, 2012. 12(20): p. 3907–3913. [DOI] [PubMed] [Google Scholar]
- 10.Rotem A, et al. , Single-cell ChIP-seq reveals cell subpopulations defined by chromatin state. Nature Biotechnology, 2015. 33(11): p. 1165–1172. [DOI] [PMC free article] [PubMed] [Google Scholar]
- 11.Klein Allon M., et al. , Droplet Barcoding for Single-Cell Transcriptomics Applied to Embryonic Stem Cells. Cell, 2015. 161(5): p. 1187–1201. [DOI] [PMC free article] [PubMed] [Google Scholar]
- 12.Stoeckius M, et al. , Simultaneous epitope and transcriptome measurement in single cells. Nature Methods, 2017. 14(9): p. 865–868. [DOI] [PMC free article] [PubMed] [Google Scholar]
- 13.Li W, et al. , Multiple modular microfluidic (M3) reactors for the synthesis of polymer particles. Lab on a Chip, 2009. 9(18): p. 2715–2721. [DOI] [PubMed] [Google Scholar]
- 14.Liu H, et al. , Improving Single-Cell Encapsulation Efficiency and Reliability through Neutral Buoyancy of Suspension. Micromachines, 2020. 11(1): p. 94. [DOI] [PMC free article] [PubMed] [Google Scholar]
- 15.Xi H-D, et al. , Active droplet sorting in microfluidics: a review. Lab on a Chip, 2017. 17(5): p. 751–771. [DOI] [PubMed] [Google Scholar]
- 16.Burgoyne F, A remote syringe for cells, beads and particle injection in microfluidic channels, Bowley L, Editor. 2009, Royal Society of Chemistry: Chips and Tips. [Google Scholar]
- 17.Brouzes E, et al. , Droplet microfluidic technology for single-cell high-throughput screening. Proceedings of the National Academy of Sciences, 2009. 106(34): p. 14195–14200. [DOI] [PMC free article] [PubMed] [Google Scholar]
- 18.Biočanin M, et al. , Simplified Drop-seq workflow with minimized bead loss using a bead capture and processing microfluidic chip. Lab on a Chip, 2019. 19(9): p. 1610–1620. [DOI] [PubMed] [Google Scholar]
- 19.Horstkotte B, et al. , In-syringe-stirring: A novel approach for magnetic stirring-assisted dispersive liquid–liquid microextraction. Analytica Chimica Acta, 2013. 788: p. 52–60. [DOI] [PubMed] [Google Scholar]
- 20.Payne EM, et al. , High-throughput screening by droplet microfluidics: perspective into key challenges and future prospects. Lab on a Chip, 2020. 20(13): p. 2247–2262. [DOI] [PMC free article] [PubMed] [Google Scholar]
- 21.Zhao Z-Q, et al. , Object Detection With Deep Learning: A Review. IEEE Trans. Neural Networks Learn. Syst, 2019. 30(11): p. 3212–3232. [DOI] [PubMed] [Google Scholar]
- 22.Redmon J and Farhadi A, YOLO9000: Better, Faster, Stronger. 2017. p. 6517–6525. [Google Scholar]
- 23.Tan M, Pang R, and Le QV, EfficientDet: Scalable and Efficient Object Detection. CoRR, 2019. abs/1911.09070. [Google Scholar]
- 24.Redmon J, et al. , You Only Look Once: Unified, Real-Time Object Detection. 2016. p. 779–788. [Google Scholar]
- 25.Huang X, et al. , PP-YOLOv2: A Practical Object Detector. CoRR, 2021. abs/2104.10419. [Google Scholar]
- 26.Bochkovskiy A, Wang C-Y, and Liao H-YM, YOLOv4: Optimal Speed and Accuracy of Object Detection. CoRR, 2020. abs/2004.10934. [Google Scholar]
- 27.Redmon J and Farhadi A, YOLOv3: An Incremental Improvement. CoRR, 2018. abs/1804.02767. [Google Scholar]
- 28.Jocher G, et al. , ultralytics/yolov5: v6.0 YOLOv5n 'Nano' models, Roboflow integration, TensorFlow export, OpenCV DNN support. 2021, Zenodo: https://github.com/ultralytics/yolov5. [Google Scholar]
- 29.Jocher G, et al. , ultralytics/yolov3: v9.6.0 - YOLOv5 v6.0 release compatibility update for YOLOv3. 2021, Zenodo: https://github.com/ultralytics/yolov3. [Google Scholar]
- 30.Nelson J and Solawetz J, Responding to the Controversy about YOLOv5. 2020, roboflow: roboflow news. [Google Scholar]
- 31.Arjun A, Ajith RR, and Ranjith SK, Mixing characterization of binary-coalesced droplets in microchannels using deep neural network. Biomicrofluidics, 2020. 14(3): p. 034111. [DOI] [PMC free article] [PubMed] [Google Scholar]
- 32.Chu A, et al. , Automated detection and sorting of microencapsulation via machine learning. Lab on a Chip, 2019. 19(10): p. 1808–1817. [DOI] [PubMed] [Google Scholar]
- 33.Siemenn AE, et al. , A Machine Learning and Computer Vision Approach to Rapidly Optimize Multiscale Droplet Generation. ACS Applied Materials & Interfaces, 2022. 14(3): p. 4668–4679. [DOI] [PubMed] [Google Scholar]
- 34.Anagnostidis V, et al. , Deep learning guided image-based droplet sorting for on-demand selection and analysis of single cells and 3D cell cultures. Lab on a Chip, 2020. 20(5): p. 889–900. [DOI] [PubMed] [Google Scholar]
- 35.Howell L, Anagnostidis V, and Gielen F, Multi-Object Detector YOLOv4-Tiny Enables High-Throughput Combinatorial and Spatially-Resolved Sorting of Cells in Microdroplets. Advanced Materials Technologies. n/a(n/a): p. 2101053. [Google Scholar]
- 36.Sesen M and Whyte G, Image-Based Single Cell Sorting Automation in Droplet Microfluidics. Scientific Reports, 2020. 10(1): p. 8736. [DOI] [PMC free article] [PubMed] [Google Scholar]
- 37.Paszke A, et al. , PyTorch: An Imperative Style, High-Performance Deep Learning Library. 2019. p. 8024–8035. [Google Scholar]
- 38.Lashkaripour A, et al. , Machine learning enables design automation of microfluidic flow-focusing droplet generation. Nature Communications, 2021. 12(1): p. 25. [DOI] [PMC free article] [PubMed] [Google Scholar]
- 39.Soenksen LR, et al. , Closed-loop feedback control for microfluidic systems through automated capacitive fluid height sensing. Lab on a Chip, 2018. 18(6): p. 902–914. [DOI] [PMC free article] [PubMed] [Google Scholar]
- 40.Dwyer B and Nelson J, Roboflow. 2021. [Google Scholar]
- 41.Ng A DeepLearning.AI. 2022. [cited 2022; Education Technology Company; ]. Available from: https://www.deeplearning.ai/. [Google Scholar]
- 42.Tan RJ Breaking Down Mean Average Precision (mAP). 2019. [cited 2022; Available from: https://towardsdatascience.com/breaking-down-mean-average-precision-map-ae462f623a52. [Google Scholar]
- 43.Padilla R, et al. , A Comparative Analysis of Object Detection Metrics with a Companion Open-Source Toolkit. Electronics, 2021. 10(3): p. 279. [Google Scholar]
- 44.Lin T-Y, et al. , Microsoft COCO: Common Objects in Context. CoRR, 2014. abs/1405.0312. [Google Scholar]
- 45.Zheng Z, et al. , Distance-IoU Loss: Faster and Better Learning for Bounding Box Regression. CoRR, 2019. abs/1911.08287. [Google Scholar]
- 46.Xia Y and Whitesides GM, Soft Lithography. Angewandte Chemie International Edition, 1998. 37(5): p. 550–575. [DOI] [PubMed] [Google Scholar]
- 47.Duffy DC, et al. , Rapid Prototyping of Microfluidic Systems in Poly(dimethylsiloxane). Analytical Chemistry, 1998. 70(23): p. 4974–4984. [DOI] [PubMed] [Google Scholar]
- 48.Campo A.d. and Greiner C, SU-8: a photoresist for high-aspect-ratio and 3D submicron lithography. Journal of Micromechanics and Microengineering, 2007. 17(6): p. R81–R95. [Google Scholar]
Associated Data
This section collects any data citations, data availability statements, or supplementary materials included in this article.
Supplementary Materials
Data Availability Statement
We believe that open-source code allows for greater innovation and cutting-edge research due to the ability of others incorporating additional features and testing. Scientific knowledge should not be contained, rather accessible for others to use freely in their own experiments. Furthermore, we would like to be transparent with this analysis and assist other researchers with more AI inspired microfluidic projects. For this reason, our adoption of YOLOv3 and YOLOv5 models along with the production set images can be found at https://github.com/karl-gardner/droplet_detection. Here, you can access the data associated with training, testing, and comparisons, for both droplet and cell models in a Google Colaboratory notebook and a shared Google Drive folder. We encourage others to contribute or use our trained model for testing or production purposes.