Abstract
The superantigen staphylococcal enterotoxin B (SEB) simultaneously binds both the major histocompatibility complex (MHC) class II receptor on monocytes and the T-cell receptor (TCR) on T lymphocytes, resulting in a range of cell responses including induction of tumor necrosis factor alpha (TNF-α). In this study, we have used mixed cultures of human peripheral blood monocytes and lymphocytes to investigate biochemical events controlling SEB induction of TNF-α. TNF-α production induced by SEB in mixed cultures is more closely associated with T cells than with monocytes: (i) a TCR-binding-site mutant of SEB (N23F) is less active in TNF-α induction than an MHC class II receptor-binding-site mutant (F44R), and (ii) flow cytometric analysis indicated that SEB induced TNF-α production in T cells but not in monocytes. Pretreatment of cells with inhibitors of signal transduction pathways was employed to further define events in SEB-induced TNF-α production. Neither protein kinase A inhibitors nor two protein tyrosine kinase inhibitors altered SEB-induced TNF-α production. In contrast, SEB induced protein kinase C (PKC) translocation, and pretreatment of cultures with inhibitors of PKC blocked TNF-α induction. Alteration of levels of diacylglycerol (DAG), an activator of PKC, by treatment with inhibitors of phospholipase C or DAG kinase also altered SEB-induced TNF-α production. These data suggest that PKC activation plays a critical role in SEB-induced TNF-α production in human T cells.
Originally characterized for their ability to induce the emesis and diarrhea associated with food poisoning (5), staphylococcal enterotoxins (SEs) also exhibit biological activities that can lead to lethal shock (29, 39). SEs constitute a group of nine serologically distinct (types A to E and G to J) proteins that have sequence and structural homologies and are members of the functionally related family of pyrogenic exotoxins (8) that includes streptococcal pyrogenic exotoxin and toxic shock syndrome toxin 1 (TSST-1).
These toxins function as superantigens (29), exhibiting the ability to activate large numbers of T cells. This property is a result of the toxin's bifunctional interaction with both the major histocompatibility complex (MHC) class II receptors on antigen-presenting cells such as monocytes and the T-cell receptor of T lymphocytes expressing specific Vβ chains to which an individual toxin binds (22). For several of the toxins, including staphylococcal enterotoxin B (SEB), the structural domains and amino acid residues participating in these receptor interactions have been identified and three-dimensional structural analyses of the binding of toxin to the MHC class II receptor and T-cell receptor have been described elsewhere (19, 23, 25).
Binding of cell surface receptors leads to activation of gene expression through enlistment of signal transduction pathways. These pathways consist of a cascade of biochemical events that can include activation of a variety of kinases including protein tyrosine kinases (PTKs), protein kinase C (PKC), or protein kinase A (PKA). These kinases in turn modify other factors that control individual gene expression. One or more of these kinases may participate in controlling a gene's expression. Ligand engagement of MHC class II receptors and T-cell receptors activates such signal transduction events (9, 18).
The superantigen activity of SEs results in induction of T-cell proliferation and in synthesis of a variety of cytokines including interleukin-1 (IL-1), IL-2, IL-6, gamma interferon, and tumor necrosis factor alpha (TNF-α) (24). It is the massive release of such cytokines that is thought to contribute to the immune dysfunction characteristic of superantigen toxicity including lethal shock (29). TNF-α is an important cofactor in endotoxic shock (13). It mediates SEB-induced lethality in mouse models that involve both MHC class II and T-cell interactions (28, 33, 46).
TNF-α induced by superantigen can be produced by both monocytes and T cells (1, 15, 30). Previous studies have examined the induction of TNF-α by SEA, SEB, or TSST-1 (15, 30, 38, 42, 43). In this study, we wished to characterize the induction of TNF-α by SEB in mixed cultures of human monocytes in the presence of lymphocytes. We wanted to determine which cell types produce TNF-α under these culture conditions and which signal transduction pathways are involved. In order to examine the induction of TNF-α by SEB, we have employed receptor-binding mutants of SEB, immunodetection and FACScan analysis of TNF-α-producing cells, and inhibitors of signal transduction pathways.
MATERIALS AND METHODS
Reagents.
SEB, lot 14-30, was obtained from the U.S. Army Research Institute of Infectious Diseases, Frederick, Md. SEB mutants F44R and N23F were constructed by site-directed mutagenesis and purified as described previously (35). The inhibitors genistein, H7, sphingosine, chelerythrine chloride, HA1004, H89, U73122, R59949, and tyrophostin 23 were purchased from Biomol (Plymouth Meeting, Pa.). Phorbol 12-myristate 13-acetate (PMA) and the inhibitor tyrophostin AG1288 were obtained from Calbiochem (La Jolla, Calif.). Fluorescein isothiocyanate (FITC)-mouse immunoglobulin G1, CD3(Leu-4)-phycoerythrin (PE), and CD14(Leu-M3)-PE were from Becton Dickinson (Mansfield, Mass.). FITC–anti-human TNF-α monoclonal antibody (MAb) and monensin were from PharMingen (San Diego, Calif.).
Preparation of human monocytes and lymphocytes.
Peripheral blood mononuclear cells were prepared from leukopacks from normal donors by centrifugation over lymphocyte separation medium as described previously (21). Monocytes and lymphocytes were then further purified from these preparations by counterflow centrifugation-elutriation with pyrogen-free Ca2+- and Mg2+-free phosphate-buffered saline as the eluant. This method resulted in cell preparations containing 95 to 99% of the indicated cell type with viability greater than 95%. Unless indicated otherwise, monocytes and lymphocytes were mixed in a 1:4 ratio prior to use. That ratio had been found in earlier studies (21) to provide near-maximal proliferative response. For all experiments, cells were cultured in a humidified atmosphere (5% CO2) in RPMI 1640 medium containing glutamine and supplemented with 10% human AB serum.
Proliferation in cultures of human lymphocytes and monocytes in response to SEB.
The experiments were carried out as described previously (21). Briefly, monocytes (0.5 × 10⁵ cells per well) and lymphocytes (2.0 × 10⁵ cells per well) were mixed in medium and plated in 96-well plates. Native SEB or SEB mutant proteins were added to appropriate wells (total volume, 200 μl), and the cultures were incubated for 72 h. One microcurie of [3H-methyl]thymidine per well was incubated with the cells for the final 18 h. The cells were collected on filter plates by using a multiwell harvesting device. Microscint-O liquid scintillation cocktail (Packard Instruments, Meriden, Conn.) was added to dried filter plates, and radioactivity was determined with the Top Count scintillation counter (Packard Instruments). Six replicates of each sample were tested in each experiment, and each experiment was repeated at least three times. Examination of proliferation in the presence of various inhibitors of proliferation was carried out by adding the inhibitors to the appropriate wells 30 min before addition of SEB at a final concentration of 50 ng/ml. The remainder of the assay was carried out as described above.
TNF-α production in response to SEB or PMA.
Monocytes and lymphocytes were mixed in the ratio 1:4, unless indicated otherwise. The cell mixture was plated at a density of 106 cells/well in four replicates in 24-well plates. Inhibitors were preincubated with the cells for 60 min, after which time SEB, PMA, or medium was added to individual wells to bring the total volume to 1 ml. Cells were cultured for 20 h. Culture medium was obtained from four replicates, and each was centrifuged to remove any precipitates. Supernatant solutions were used for TNF-α analysis. The amount of TNF-α released in culture medium was determined by using a commercial human TNF-α enzyme-linked immunosorbent assay (ELISA) kit (R&D Systems, Rochester, Minn.) according to the manufacturer's instructions.
Protein assay.
Protein concentrations of samples were determined by the Bio-Rad protein assay (Hercules, Calif.) according to the manufacturer's instructions.
PKC assay.
Monocytes and lymphocytes were mixed in a ratio of 1:4 in medium. A total of 2 × 10⁷ mixed cells were incubated in microcentrifuge tubes in the presence of 100 ng of SEB per ml. At the times indicated, cells were collected by centrifugation, washed once with ice-cold phosphate-buffered saline, and then resuspended in 0.5 ml of ice-cold lysing buffer (20 mM Tris-HCl [pH 7.5], 5 mM EDTA, 10 mM EGTA, 0.3% [wt/vol] 2-mercaptoethanol, 10 mM benzamidine, and 1 mM phenylmethylsulfonyl fluoride). The cells were lysed by sonication on ice for 30 s. Cell lysates were centrifuged at 100,000 × g for 60 min at 4°C, and supernatant solutions were collected as cytosolic fractions. The pellets were resonicated for 20 s in 0.5 ml of lysing buffer containing 1% Triton X-100 and then rocked gently for 60 min in an ice bath. After centrifugation at 50,000 × g, supernatant solutions were collected as solubilized membrane fractions. PKC activity was measured in duplicate with a nonradioactive protein kinase assay kit (Calbiochem). A dilution series of PKC preparations from rat brain (Calbiochem) was used in each assay to produce a standard curve for use in determining relative PKC activity in the test samples. PKC activity was expressed as units per microgram of protein in each fraction.
PTK assay.
A total of 107 premixed cells (1:4) were incubated with 100 ng of SEB per ml for the time indicated. After being washed once with phosphate-buffered saline containing 1 mM sodium vanadate, cells were lysed on ice for 5 min in 0.5 ml of RIPA buffer (50 mM Tris-HCl [pH 8.0], 150 mM NaCl, 1 mM dithiothreitol, 0.5 mM EDTA, 1.0% Nonidet P-40, 0.5% sodium deoxycholate, 0.15% sodium dodecyl sulfate, 100 μg of phenylmethylsulfonyl fluoride per ml, 1 μg of aprotinin per ml, 2 μg of leupeptin per ml, and 100 μM sodium vanadate), followed by homogenization with 10 10-s bursts on a microsonicator. The homogenates were centrifuged at 10,000 × g for 10 min at 4°C, and supernatant solutions were collected as total protein extracts. PTK activity was determined with a nonradioactive tyrosine kinase assay kit (Boehringer Mannheim, Indianapolis, Ind.), with two different biotin-labeled peptides as PTK substrates. Each peptide is specific for different classes of PTK. Total PTK activity was measured by using a mixture of equal amounts of both peptides as substrates in the PTK assay. A series of diluted prephosphorylated peptides (provided with the kit) were used as standards to calculate the amount of phosphopeptide in PTK reactions. PTK activity was expressed as picomoles of phosphopeptide per minute per microgram of protein.
FACScan analysis of TNF-α expression.
FACScan flow cytometry in combination with an intracellular cytokine staining method (14) was employed to analyze TNF-α gene expression in situ. Cell permeabilization was achieved by using the cell fixation-permeabilization kit obtained from PharMingen. Purified monocytes and lymphocytes were mixed in a ratio of 1:1. A total of 106 mixed cells in medium were added to 15-ml tubes and incubated with or without 100 ng of SEB per ml for 6 h at 37°C in the presence of 2 μM protein transport inhibitor monensin. Cells were harvested by centrifugation at 500 × g for 7 min, resuspended in 1 ml of staining buffer containing 0.25% inactivated mouse serum, and then incubated at 4°C for 15 min to block Fc receptors. Samples were divided into two test tubes, and fluorescently tagged reagents were added to identify cell type by using either 20 μl of the anti-T-lymphocyte antibody CD3(Leu-4)-PE or the antimonocyte antibody CD14(Leu-M3)-PE to stain the cells for 30 min at 4°C in the dark. After being washed twice with 1 ml of staining buffer, cells were resuspended in 250 μl of Cytofix/Cytoperm solution followed by incubation in the dark at 4°C for 20 min. The fixed and permeabilized cells were washed twice with 1 ml of Perm/Wash solution and thoroughly resuspended in 50 μl of Perm/Wash solution containing 0.5 μg of FITC–anti-TNF-α MAb, followed by incubation for 30 min at 4°C in the dark. To establish the degree of nonspecific binding, control and SEB-stimulated cells were stained with 0.5 μg of FITC-mouse immunoglobulin G1. Stained cells were washed twice with 1 ml of Perm/Wash solution and resuspended in 1 ml of staining buffer. Samples were analyzed on a FACScan flow cytometer (Becton Dickinson). The typical forward and side scatter gates for lymphocytes and monocytes (with cells stained with CD3, CD14, or the nonspecific stain) were set respectively to exclude any dead cells. Within this gate, 10,000 events were acquired per sample. Two-parameter dot plots demonstrating cytokine and cell marker staining were generated by using the LYSIS II software (Becton Dickinson), and quadrant statistics were set on the basis of staining controls.
RESULTS
Induction of TNF-α by SEB.
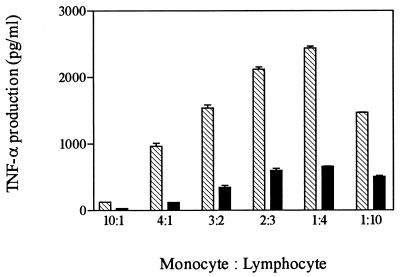
In order to study events involved in the production of TNF-α by SEB, we first examined parameters controlling induction in mixed cultures of human lymphocytes and monocytes. Initial time course experiments indicated that increased TNF-α levels in culture fluids began 4 h after addition of SEB, reached maximal levels by 17 h, and remained constant through 24 h. For subsequent experiments, levels of production of TNF-α were measured at 20 h following addition of toxin, except where indicated. In previous studies, a ratio of monocytes to lymphocytes of 1:4 in mixed culture was optimal for SEB induction of proliferation of lymphocytes (21). Similarly, we found that levels of TNF-α induced by SEB varied with different combinations of monocytes and lymphocytes (Fig. 1). The maximal level for SEB induction of TNF-α occurred at a 1:4 ratio of monocytes to lymphocytes. This cell ratio was employed in all subsequent experiments, except where indicated.
FIG. 1.
Effect of cell ratio on induction of TNF-α by SEB. Purified monocytes and lymphocytes were mixed in different cell ratios and plated in 24-well plates in four replicates at a density of 106 cells/well. Cells were cultured for 20 h in the presence of 10 (filled bars) and 100 (striped bars) ng of SEB per ml. Culture media were collected and assayed in duplicate for TNF-α production.
Dependence on mixed culture for SEB induction of TNF-α.
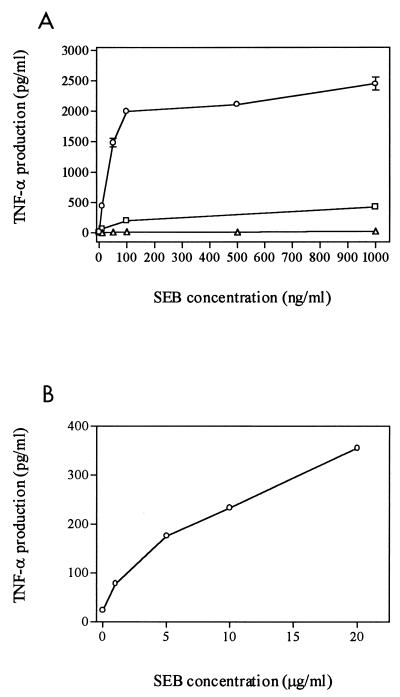
We wished to determine whether TNF-α induction by SEB requires mixed cultures of lymphocytes and monocytes or can occur with either cell type alone. For this purpose, lymphocytes, monocytes, or mixed cells were incubated with increasing doses of SEB (Fig. 2A). In mixed culture, a dose of SEB as low as 10 ng/ml was sufficient to induce 50-fold-greater amounts of TNF-α (500 pg/ml) compared to the untreated negative control (∼10 pg/ml). TNF-α production reached a plateau at 100 ng of SEB per ml. This concentration was used as our standard in subsequent experiments. In the absence of monocytes, SEB-treated lymphocytes responded with increased levels of TNF-α. However, the response was significantly less than that exhibited by mixed culture even at a high dose of toxin (17% of response of mixed cells at 1,000 ng of SEB per ml).
FIG. 2.
Dependence on concentration of SEB for TNF-α induction. Cells were plated in four replicates at a density of 106/well and then cultured for 20 h in the presence of different concentrations of SEB. Culture media were collected and assayed in duplicate for TNF-α production. (A) Monocytes (▵), lymphocytes (□), and mixed cells (○). (B) Monocytes alone in the presence of high concentrations of SEB.
In contrast, monocytes alone did not secrete significant amounts above control of TNF-α at concentrations of SEB ranging from 10 to 1,000 ng/ml (Fig. 2A). Previous studies had reported that SEB activated TNF-α gene expression in human monocytes (30, 38) and in the human monocytic cell line THP-1 in the absence of T lymphocytes (43). However, the concentrations of toxin used in those studies (1 to 10 μg/ml) were greater than our standard dose of 100 ng/ml. Therefore, we examined the response of monocytes exposed to higher concentrations of SEB (1 to 20 μg/ml). Although high doses of SEB did stimulate TNF-α production in monocytes alone (Fig. 2B), the levels of TNF-α induced by the highest dose of SEB tested (20 μg/ml) were only 18% of those seen in mixed culture exposed to 100 ng of SEB per ml.
TNF-α induction by SEB mutants.
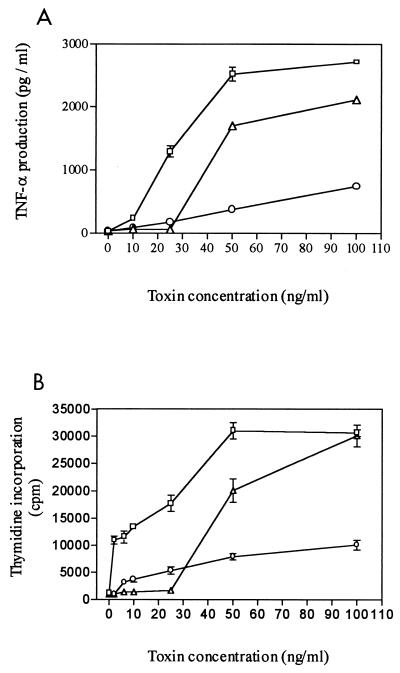
Mutation analysis of SEB had revealed that residue phenylalanine-44 (F44) is important to the binding of SEB to the MHC class II receptor on monocytes and that residue asparagine-23 (N23) is critical for interaction with the T-cell receptor (23). To examine the role which binding of SEB to MHC class II receptor or T-cell receptor plays in TNF-α induction, we compared levels of TNF-α induction by native SEB and by two amino acid substitution mutants that we constructed. Mutant F44R contains an arginine substitution for F44 and mutant N23F contains a phenylalanine substitution for N23. At SEB concentrations of 25 ng/ml or less, neither mutant induced a significant TNF-α response (Fig. 3A). However, at a higher dose (100 ng/ml) F44R activity approached 77% of that of the native toxin response, whereas N23F exhibited only 28% of native SEB activity. Similar behavior was exhibited by these mutant toxins when examined in a proliferation assay. As in the TNF-α response, both mutant toxins had greatly reduced activity at 25 ng/ml or less (Fig. 3B). At 50 ng/ml, F44R had 62% of the proliferation activity of SEB while N23F was only 26% as active. At 100 ng/ml, however, N23F had 33% of the native toxin activity whereas the response of F44R (98%) was comparable to that of SEB. These results suggested that activation of lymphocytes is critical for SEB induction of TNF-α.
FIG. 3.
Comparison of SEB and SEB mutant proteins F44R and N23F for stimulation of TNF-α production (A) and proliferation (B). Symbols: □, SEB; ▵ and ○, SEB mutants F44R and N23F, respectively. (A) Monocytes and lymphocytes (1:4 ratio) were plated in four replicates and cultured for 20 h in the presence of varying concentrations of toxin. Culture media were collected, and TNF-α production was analyzed in duplicate. Statistical analysis (t test) of significant differences compared to native SEB showed P < 0.001 at the concentrations 25 to 100 μg/ml for mutant protein N23F and at 25 and 50 μg/ml for mutant protein F44R. (B) Incorporation of [3H-methyl]thymidine in mixed culture was determined after exposure to toxin for 72 h. The data are averages of three experiments done in replicates of six. Statistical analysis (t test) of significant differences compared to native SEB showed P < 0.001 at the concentrations 6 to 100 ng/ml for mutant protein N23F and at 6 to 50 ng/ml for mutant protein F44R.
FACScan analysis of TNF-α production.
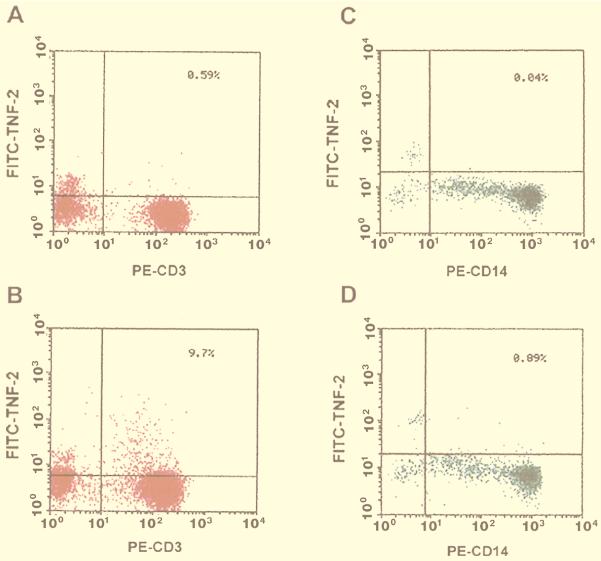
As another approach to identifying the cell type most responsible for TNF-α production in response to SEB, we used FACScan analysis for measurement of TNF-α synthesis in situ in specific cell types. Monocytes and lymphocytes, mixed in a ratio of 1:1, were incubated for 6 h with or without SEB (100 ng/ml) in the presence of the protein transport inhibitor monensin so that TNF-α molecules would accumulate in the Golgi complex. After cell fixation and permeabilization, FITC–TNF-α MAb was used for the intracellular staining of TNF-α. As shown in two-parameter dot plots (Fig. 4A and B), SEB stimulation resulted in a significantly large proportion (9.7%) of T lymphocytes (CD3 positive, x axis) producing TNF-α (y axis) compared to that of nonstimulated cells (0.58%). SEB treatment (Fig. 4C and D) also increased the numbers (0.89%) of monocytes (CD14 positive, x axis) producing TNF-α compared to the nonstimulated control (0.04%). However, the overall numbers of TNF-α-positive monocytes were more than 10-fold lower than the numbers of TNF-α-positive lymphocytes (0.89 versus 9.7%) induced by SEB. This result indicates that lymphocytes and not monocytes are the predominant producers of TNF-α in response to SEB in a mixed culture of human cells.
FIG. 4.
FACScan analysis of TNF-α expression in monocytes and lymphocytes. Monocytes and lymphocytes (5 × 10⁵ each) were mixed and incubated for 6 h with 100 ng of SEB per ml in the presence of 2 μM monensin. Samples were fixed and then permeabilized and stained with cell-type-specific antibody and analyzed on a FACScan flow cytometer. Negative controls (A and C) were without SEB. Samples were stained with anti-CD3 or anti-CD14 antisera to identify the following: lymphocytes (A), lymphocytes plus SEB (B), monocytes (C), and monocytes plus SEB (D).
Inhibition of SEB-induced TNF-α production by PKC inhibitors.
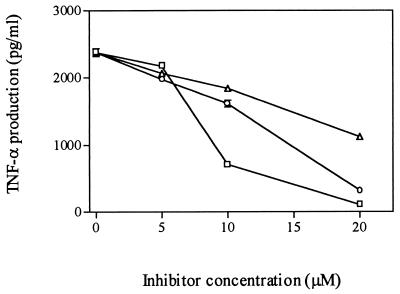
We wished to identify the signal transduction pathways that may be involved in converting the cell surface receptor binding of SEB into the induction of TNF-α. For this purpose, we employed inhibitors of different kinases involved in signal transduction to determine which, if any, blocked SEB-induced TNF-α production. We first examined the role of PKC in the response by treating mixed cultures of monocytes and lymphocytes for 60 min before SEB stimulation with increasing doses of three specific PKC inhibitors, H7 (20), sphingosine (17), and chelerythrine (11). As shown in Fig. 5, treatment of cells with PKC inhibitors resulted in a substantial reduction in TNF-α secretion, and the inhibitory effect occurred in a dose-dependent manner. Trypan blue exclusion studies indicated no loss of cell viability in response to these inhibitors at tested concentrations, indicating that the cells were not obviously damaged by use of the inhibitors. These inhibitors also blocked SEB-induced cell proliferation (data not shown).
FIG. 5.
Effect of PKC inhibitors on induction of TNF-α by SEB. Monocytes and lymphocytes were plated in four replicates; incubated with either sphingosine (▵), chelerythrine (○), or H7 (□) for 60 min followed by stimulation with 100 ng of SEB per ml for 20 h; and then analyzed for TNF-α. Statistical analysis (t test) of significant differences compared to SEB alone showed P < 0.05 at the concentrations 10 and 20 μM for H7 and at 20 μM only for the other two inhibitors.
PKC translocation induced by SEB.
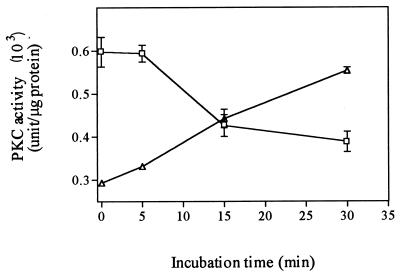
We next examined the ability of SEB to activate PKC by inducing its translocation from cytosolic to membrane fractions in mixed cultures of monocytes and lymphocytes. Incubation of cells with 100 ng of SEB per ml resulted in a significant increase in membrane-associated PKC activity and a concomitant decrease in cytosol-associated PKC activity (Fig. 6). This translocation of PKC was observed as early as 15 min after SEB exposure.
FIG. 6.
Induction of translocation of PKC by SEB. A total of 2 × 10⁷ monocytes plus lymphocytes (1:4 ratio) were stimulated with 100 ng of SEB per ml for the time indicated. Cytosolic (□) and membrane (▵) fractions were prepared as described in the text. The activity is expressed as units per microgram of protein.
Inhibition of induction of TNF-α by PLC inhibitor.
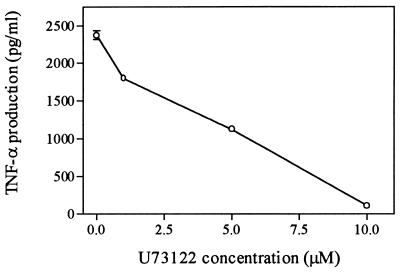
Phospholipase C (PLC) plays a central role in the activation of PKC through its production of diacylglycerol (DAG), an activator of PKC (36). Inhibition of PLC may indirectly inhibit PKC and thus effect TNF-α induction. To investigate the involvement of PLC in TNF-α induction, we examined the effect of U73122, a PLC inhibitor (7), on TNF-α production induced by SEB. Cells were incubated with different doses of the inhibitor for 60 min to block the effect of PLC and then stimulated with 100 ng of SEB per ml. Results shown in Fig. 7 indicate that pretreatment of cells with the PLC inhibitor U73122 caused a significant reduction of TNF-α production, and this inhibitory effect appears to be dose dependent.
FIG. 7.
Inhibition of SEB-induced TNF-α production by PLC inhibitor U73122. Monocytes and lymphocytes (1:4 ratio) were plated in four replicates and incubated with different doses of the PLC inhibitor U73122 for 60 min followed by stimulation with 100 ng of SEB per ml. Media were collected and analyzed in duplicate for TNF-α production. Statistical analysis (t test) of significant differences compared to native SEB showed P < 0.05 for all concentrations of inhibitor used.
Stimulation of SEB-induced TNF-α production by a DAG kinase inhibitor.
To explore the possibility that DAG plays a role in TNF-α induction by SEB through its activation of PKC, we studied the effect of the DAG kinase inhibitor, R59949, on SEB-induced TNF-α production. R59949 elevates intracellular DAG levels by blocking one of DAG's degradation pathways (12). If DAG plays a role in SEB-induced TNF-α production, it is expected that preincubation of cells with R59949, inhibiting DAG degradation, should result in an increase of TNF-α synthesis. SEB was used at 10 ng/ml in order to be in a low-linear range of TNF-α production by SEB, so that increases in its production could be observed. As shown in Table 1, pretreatment of cells with R59949 did increase SEB-induced TNF-α production (30%).
TABLE 1.
Enhancement of TNF-α production by DAG kinase inhibitora
Mixed cells were plated in four replicates and incubated with 1 μM R59949 for 60 min followed by stimulation with 10 ng of SEB per ml for 20 h. Media were collected and analyzed in duplicate for TNF-α.
Statistical analysis (t test) of significant differences compared to SEB alone showed P < 0.001.
The effect of PKA and PTK inhibitors on SEB-induced TNF-α production and proliferation.
We used other specific inhibitors to determine if other kinase activities regulated SEB-stimulated TNF-α production or proliferation of lymphocytes. To determine whether PKA was involved in SEB-induced TNF-α production, cells were incubated with two PKA-specific inhibitors, HA1004 (45) and H89 (2), for 60 min, followed by SEB stimulation. As shown in Table 2, treatment of cells with PKA inhibitors did not cause significant decreases either in TNF-α production or in proliferation.
TABLE 2.
Effects of PKA and PTK inhibitors on TNF-α induction and proliferation
| Inhibitor | Enzyme target | TNF-α production (pg/ml)a | Proliferationb (%) |
|---|---|---|---|
| None (SEB alone) | 2,377.6 ± 59.4 | 100 | |
| H1004 | PKA | 2,345.7 ± 18.0 | Not determined |
| H89 | PKA | 2,379.0 ± 95.6 | 98.3 ± 4.1 |
| Tyrophostin 23 | PTK | 2,479.0 ± 47.8 | 97.4 ± 3.3 |
| AG1288 | PTK | 2,474.7 ± 69.6 | 101.7 ± 6.8 |
| Genistein | PTK-PKC | 1,357.6 ± 1.5c | 53.4 ± 2.9d |
For TNF-α determinations, cells were plated in four replicates and incubated with inhibitors H89 (100 nM), HA1004 (20 μM), genistein (20 μM), tyrophostin 23 (20 μM), and AG1288 (20 μM) for 60 min followed by stimulation with 100 ng of SEB per ml for 20 h. Media were collected and analyzed in duplicate for TNF-α by using ELISA kits.
For proliferation, mixed cultures of monocytes and lymphocytes (1:4 ratio) were plated in replicates of six and incubated with the inhibitors as indicated above for 30 min prior to addition of SEB at 50 ng/ml (see Fig. 3B). Thymidine incorporation was determined as described in Materials and Methods. Lower concentrations of genistein did not show inhibition.
Statistical analysis (t test) of significant differences compared to SEB alone showed P < 0.05.
Comparisons were made for each inhibitor with SEB alone, and significant differences were determined by analysis with Student's t test. Indicated values showed P < 0.0005.
In order to assess the role of PTK, cells were treated with three PTK inhibitors for 60 min prior to SEB stimulation. It was observed that both tyrophostin 23 and AG1288 were unable to block either TNF-α production or proliferation (Table 2). However, a less-specific PTK inhibitor, genistein, suppressed both TNF-α production and proliferation by approximately 50% (Table 2). Genistein has been shown elsewhere to inhibit PKC activity (16, 27). Since the data presented here suggest that PKC is involved in TNF-α gene expression, inhibition of SEB-induced TNF-α could result from the nonspecific effects of this inhibitor. To address this possibility, we studied the effect of genistein on TNF-α induction by PMA, a well-known PKC activator (3). As shown in Table 3, like PKC inhibitors H7 and sphingosine, genistein was able to block PMA-induced TNF-α secretion, suggesting that its inhibitory effect on SEB-induced TNF-α production is through its effect on PKC and not PTK.
TABLE 3.
Inhibition of PMA-induced TNF-α by various inhibitorsa
| Inhibitor | TNF-α (pg/ml) |
|---|---|
| None | 843.8 ± 35.5 |
| Genistein | 410.5 ± 3.5b |
| Sphingosine | 320.9 ± 19.0b |
| H7 | 147.0 ± 39.0b |
Lymphocytes were plated in 24-well plates at a density of 106/well in four replicates and incubated with the inhibitor H7 (20 μM), sphingosine (20 μM), or genistein (20 μM) for 60 min. Cells were cultured for 20 h in the presence of 50 ng of PMA per ml. Culture media were collected and analyzed in duplicate for TNF-α production by using ELISA kits.
Statistical analysis (t test) of significant differences compared to SEB alone showed P < 0.05.
The effects of SEB on total PTK activity.
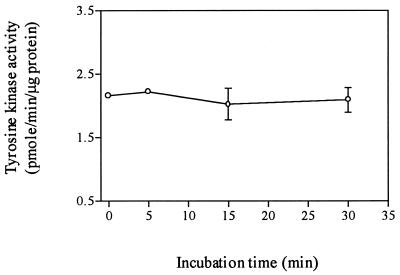
We measured the effects of SEB on total PTK activity, in a further attempt to resolve the contradictory data obtained from our PTK inhibitor studies examining the role of PTK in TNF-α production induced by SEB. Mixed monocyte and lymphocyte cultures were stimulated with 100 ng of SEB per ml for the time indicated, and total PTK activity in cell lysates was determined (Fig. 8). Total PTK activity did not significantly increase after SEB stimulation.
FIG. 8.
Total PTK in lysates in SEB-treated monocyte-plus-lymphocyte cultures. A total of 107 monocytes plus lymphocytes (1:4 ratio) were stimulated with 100 ng of SEB per ml for the time indicated. Total PTK activity in whole-cell lysates is expressed as picomoles of phosphopeptide per minute per microgram of protein. These data do not represent significant differences from controls.
DISCUSSION
We have attempted to determine the cells primarily involved in SEB-induced TNF-α production in mixtures of human monocytes and lymphocytes and to identify signal transduction pathways mediating this event. Our results indicate that, at low concentrations of SEB (100 ng/ml), efficient production of TNF-α requires the presence of both lymphocytes and monocytes and that, in such mixed cultures, lymphocytes are the predominant producer of TNF-α. Our results also suggest that PKC plays an important role in SEB-induced TNF-α production.
In a mixed culture of monocytes and lymphocytes, SEB induced significant amounts of TNF-α (Fig. 2A). At concentrations as low as 10 ng/ml, SEB induced levels of TNF-α 50-fold greater than those in untreated cells. In contrast, lymphocytes alone had a much lower response, producing at most only 17% of the amount found in mixed culture at 1,000 ng/ml. This limited response may be attributable to the presence of low levels of antigen-presenting cells in our lymphocyte preparations. Unlike lymphocytes alone, monocytes alone did not secrete significant amounts of TNF-α at SEB concentrations of 10 to 1,000 ng/ml (Fig. 2A). Thus, both cell types are required for an efficient response. A similar requirement for the presence of both monocytes and lymphocytes together has been reported elsewhere for induction of TNF-α by SEA (15) and TSST-1 (42). Moreover, incubation of monocytic cell line THP-1 with SEB did not activate TNF-α gene expression (31). Our results (Fig. 2B) and those of others (43) indicate that, at high concentrations of SEB (1 to 10 μg/ml), monocytes do express increased levels of TNF-α but at amounts that are much lower than those found in mixed culture.
SEB-induced TNF-α production is mediated by both MHC class II receptors on monocytes and T-cell receptors on lymphocytes (4, 33). Mutant SEB proteins with an amino acid substitution in either the toxin's MHC class II receptor binding site (F44R) or the T-cell-receptor binding site (N23F) exhibited substantial reductions in the ability to induce TNF-α (Fig. 3A) as well as proliferation (Fig. 3B) at low concentrations of mutant toxin. At higher concentrations, both mutants exhibited activity. However, the T-cell-receptor-binding mutant was still significantly less active than either native toxin or the MHC class II-receptor-binding mutant, for induction either of TNF-α or of proliferation. This result suggests a more important role for T cells in SEB-induced TNF-α production.
Although it is well defined that SE toxin-reactive T cells are responsible for the production of cytokines such as IL-2 and gamma interferon, the cell type which secretes TNF-α after SEB stimulation is less certain (32), especially when mixed populations consisting of monocytes and lymphocytes are used. FACScan analysis (Fig. 4) of SEB-treated mixed culture (1:1 ratio) clearly indicates that by far the greater number of TNF-α-producing cells are T cells (9.7% of lymphocytes) rather than monocytes (0.89% of monocytes). That only 9.7% of T cells are TNF-α positive, when treated with a concentration (100 ng/ml) of SEB that induces maximal levels of TNF-α, may reflect the fact that SEB interacts only with certain subsets of T lymphocytes bearing specific Vβ regions (22). Therefore, not all T lymphocytes would be expected to be induced by SEB. Fischer et al. (15) found equal numbers of monocytes and lymphocytes producing TNF-α when treated with nanogram-per-milliliter amounts of SEA. This ratio is much higher than that seen in this study with SEB and may reflect the specific ability of SEA to activate monocytes in the absence of lymphocytes (31). In any case, our in vitro results are consistent with in vivo observations, which indicated that T cells are the predominant TNF-α-positive cells in tissues from SEB-challenged mice (6, 26).
By using various inhibitors, we have attempted to identify signal transduction pathways that are involved in mediating SEB-induced TNF-α production in mixed cultures of human monocytes and lymphocytes. We examined the effect of inhibitors for the PKA, PTK, and PKC pathways on SEB-induced TNF-α production and on proliferation (Table 2 and Fig. 5). The PKA inhibitors HA1004 and H89 failed to block SEB-induced TNF-α production (Table 2), indicating that the PKA pathway is not involved. A similar lack of involvment of PKA in toxin induction of TNF-α was reported for a TSST-1-treated mixed culture of human monocytes and lymphocytes (41).
Inhibitor studies indicated that PKC was involved in TSST-1 induction of TNF-α in cultures of human monocytes and lymphocytes (41) and in SEB-induced IL-1β production in human monocytes (30, 38). We addressed the possible role of PKC in SEB induction of TNF-α by using inhibitors that suppress PKC activity or indirectly activate this enzyme. Three inhibitors of PKC activity, H7, chelerythrine, and sphingosine, each suppressed SEB-induced TNF-α production in a mixed culture of monocytes and lymphocytes (Fig. 5). PKC is activated by DAG, and we reasoned that if we decreased DAG levels by inhibiting PLC activity or increased DAG by inhibiting its degradation by DAG kinase we could alter SEB-induced TNF-α production. Indeed, the PLC inhibitor U73211 inhibited SEB-induced TNF-α (Fig. 7), whereas the DAG kinase inhibitor R59949 increased SEB-induced TNF-α (Table 1). In addition, we found that SEB induced translocation (i.e., activation) of PKC in mixed culture (Fig. 6) and that PMA, a DAG-like activator of PKC, also induces TNF-α (Table 3). Activation of PKC also occurred following TSST-1 or SEB treatment of purified human monocytes (38, 44) and TSST-1 treatment of human peripheral blood mononuclear cells (10). PMA induced IL-1β and TNF-α in purified human monocytes (30). These results strongly support a role for PKC in mediating SEB induction of TNF-α.
Several studies suggested that PTK also might be involved in TNF-α induction by SE. Binding of SEs to the MHC class II receptors of purified monocytes was reported to lead to activation of src-related PTK (34). Inhibitors of PTK blocked induction of IL-1β in TSST-1-treated THP-1 cells (40) and in SEB-treated purified human monocytes (30). In these studies, microgram-per-milliliter levels of toxin were used. Moreover, PTK inhibitors blocked lipopolysaccharide-induced TNF-α production (37). However, we found no effect on SEB-induced TNF-α production by two PTK inhibitors, tyrophostin 23 and AG1288 (Table 2). We also saw no effect of treatment of a mixed culture with SEB on total PTK activity. A third PKA inhibitor that we tested, genistein, did block both SEB-induced TNF-α production and proliferation by about 50% (Table 2). However, at the concentration used in this study (20 μM), genistein has been reported to inhibit PKC as well (16). We found that genistein inhibited induction of TNF-α by the PKC activator PMA (Table 3), suggesting that its effect on TNF-α induction by SEB is through its inhibition of PKC. These results suggest that PTKs that are sensitive to the tyrophostin inhibitors used in this study do not mediate SEB-induced TNF-α production in mixed cultures of monocytes and lymphocytes in which lymphocytes are the primary producers of TNF-α. Further examination of individual enzymes involved in signal pathways may provide information clarifying the possible involvement of PTK activity.
ACKNOWLEDGMENTS
We thank David Hoover for his expert comments on the manuscript; Xiaoyan Zhang, Thomas Boyle, and Peifan Sun for their help with FACScan analysis; and Christopher Welch for his expert technical assistance in performing proliferation assays.
REFERENCES
- 1.Akatsuka H, Imanishi K, Inada K, Yamashita H, Yoshida M, Uchiyama T. Production of tumour necrosis factors by human T cells stimulated by a superantigen, toxic shock syndrome toxin-1. Clin Exp Immunol. 1994;96:422–426. doi: 10.1111/j.1365-2249.1994.tb06045.x. [DOI] [PMC free article] [PubMed] [Google Scholar]
- 2.Albrecht D E, Tidball J G. Platelet-derived growth factor-stimulated secretion of basement membrane proteins by skeletal muscle occurs by tyrosine kinase-dependent and independent pathways. J Biol Chem. 1997;272:2236–2244. doi: 10.1074/jbc.272.4.2236. [DOI] [PubMed] [Google Scholar]
- 3.Asaoka Y, Oka M, Yoshida K, Nishizuka Y. Metabolic rate of membrane diacylglycerol and its relation to human resting T-lymphocyte activation. Proc Natl Acad Sci USA. 1991;88:8681–8685. doi: 10.1073/pnas.88.19.8681. [DOI] [PMC free article] [PubMed] [Google Scholar]
- 4.Avery A C, Markowitz J S, Grusby M J, Glimcher L H, Cantor H. Activation of T cells by superantigen in class II-negative mice. J Immunol. 1994;153:4853–4861. [PubMed] [Google Scholar]
- 5.Bergdoll M S. Enterotoxins. In: Ajl S J, Montie T C, Kadis S, editors. Microbial toxins. New York, N.Y: Academic Press, Inc.; 1970. pp. 265–326. [Google Scholar]
- 6.Bette J, Schafer M, H. K, Rooijen N, Weihe E, Fleischer B. Distribution and kinetics of superantigen-induced cytokine gene expression in mouse spleen. J Exp Med. 1993;178:1531–1540. doi: 10.1084/jem.178.5.1531. [DOI] [PMC free article] [PubMed] [Google Scholar]
- 7.Bleasdale J E, Thakur N R, Gremban R S, Bundy G L, Fitzpatrick F A, Smith R J, Bunting S. Selective inhibition of receptor-coupled phospholipase C-dependent processes in human platelets and polymorphonuclear neutrophils. J Pharmacol Exp Ther. 1990;255:756–768. [PubMed] [Google Scholar]
- 8.Bohach G A, Stauffacher C V, Ohlendorf D H, Chi Y-I, Vath G M, Schlievert P M. The staphylococcal and streptococcal pyrogenic toxin family. In: Singh B R, Tu A T, editors. Natural toxins II. New York, N.Y: Plenum Publishing Corporation; 1996. pp. 131–154. [DOI] [PubMed] [Google Scholar]
- 9.Chatila T, Geha R S. Signal transduction by microbial superantigens via MHC class II molecules. Immunol Rev. 1993;131:43–59. doi: 10.1111/j.1600-065x.1993.tb01529.x. [DOI] [PubMed] [Google Scholar]
- 10.Chatila T, Wood N, Parsonnet J, Geha R S. Toxic shock syndrome toxin-1 induces inositol phospholipid turnover, protein kinase C translocation, and calcium mobilization in human T cells. J Immunol. 1988;140:1250–1255. [PubMed] [Google Scholar]
- 11.Chmura S J, Mauceri H J, Advani S, Heimann R, Beckett M A, Nodzenski E, Quintans J, Kufe D W, Weischselbaum R R. Decreasing the apoptotic threshold of tumor cells through protein kinase C inhibition and sphingomyelinase activation increases tumor killing by ionizing radiation. Cancer Res. 1997;57:4340–4347. [PubMed] [Google Scholar]
- 12.de Chaffoy de Chourcelles D, Roevens P, Van Belle H. The role of endogenously formed diacylglycerol in the propagation and termination of platelet activation. J Biol Chem. 1989;262:3274–3285. [PubMed] [Google Scholar]
- 13.Dinarello C A. Cytokines as mediators in the pathogenesis of septic shock. In: Rietschel E T, Wagner H, editors. Pathology of septic shock. Vol. 216. Berlin, Germany: Springer-Verlag; 1996. pp. 133–165. [DOI] [PubMed] [Google Scholar]
- 14.Elson L H, Nutman T B, Metcalfe D D, Prussin C. Flow cytometric analysis for cytokine production identifies T helper 1, T helper 2, and T helper 0 cells within the human CD4+CD27 lymphocyte subpopulation. J Immunol. 1995;154:4294–4301. [PubMed] [Google Scholar]
- 15.Fischer H, Dohlsten M, Andersson U, Hedlund G, Ericsson P, Hansson J, Sjogren H O. Production of TNF-alpha and TNF-beta by staphylococcal enterotoxin A activated human T cells. J Immunol. 1990;144:4663–4669. [PubMed] [Google Scholar]
- 16.Geissler J F, Traxler P, Regenass U, Murray B J, Roesel J L, Meyer T, McGlynn E, Storni A, Lydon N B. Thiazolidine-diones. Biochemical and biological activity of a novel class of tyrosine protein kinase inhibitors. J Biol Chem. 1990;265:22255–22261. [PubMed] [Google Scholar]
- 17.Hannun Y A, Bell R M. Lysosphingolipids inhibit protein kinase C: implication for the sphingolipidoses. Science. 1987;235:670–674. doi: 10.1126/science.3101176. [DOI] [PubMed] [Google Scholar]
- 18.Hardy K, Chaudhri G. Activation and signal transduction via mitogen-activated protein (MAP) kinases in T lymphocytes. Immunol Cell Biol. 1997;75:528–545. doi: 10.1038/icb.1997.84. [DOI] [PubMed] [Google Scholar]
- 19.Jardetzky T S, Brown J H, Gorga J C, Stern L J, Urban R G, Chi Y I, Stauffacher C, Strominger J L, Wiley D C. Three-dimensional structure of a human class II histocompatibility molecule complexed with superantigen. Nature. 1994;368:711–718. doi: 10.1038/368711a0. [DOI] [PubMed] [Google Scholar]
- 20.Javis W D, Turner A J, Povirk L F, Taylor R S, Grant S. Induction of apoptotic DNA fragmentation and cell death in HL-60 human promyelocytic leukemia cells by pharmacological inhibitors of protein kinase C. Cancer Res. 1994;54:1707–1714. [PubMed] [Google Scholar]
- 21.Jett M, Neill R, Welch C, Boyle T, Bernton E, Hoover D, Lowell G, Hunt R E, Chatterjee S, Gemski P. Identification of staphylococcal enterotoxin B sequences important for induction of lymphocyte proliferation by using synthetic peptide fragments of the toxin. Infect Immun. 1994;62:3408–3415. doi: 10.1128/iai.62.8.3408-3415.1994. [DOI] [PMC free article] [PubMed] [Google Scholar]
- 22.Kappler J, Kotzin B, Herron L, Gelfand E W, Bigler R D, Boylston A, Carrel S, Posnett D N, Choi Y, Marrack P. V beta-specific stimulation of human T cells by staphylococcal toxins. Science. 1989;244:811–813. doi: 10.1126/science.2524876. [DOI] [PubMed] [Google Scholar]
- 23.Kappler J W, Herman A, Clements J, Marrack P. Mutations defining functional regions of the superantigen staphylococcal enterotoxin B. J Exp Med. 1992;175:387–396. doi: 10.1084/jem.175.2.387. [DOI] [PMC free article] [PubMed] [Google Scholar]
- 24.Kotb M. Bacterial pyrogenic exotoxins as superantigens. Clin Microbiol Rev. 1995;8:411–426. doi: 10.1128/cmr.8.3.411. [DOI] [PMC free article] [PubMed] [Google Scholar]
- 25.Li H, Llera A, Tsuchiya D, Leder L, Ysern X, Schlievert P M, Karjalainen K, Mariuzza R A. Three-dimensional structure of the complex between a T cell receptor beta chain and the superantigen staphylococcal enterotoxin B. Immunity. 1998;9:807–816. doi: 10.1016/s1074-7613(00)80646-9. [DOI] [PubMed] [Google Scholar]
- 26.Litton M J, Sander B, Murphy E, O'Garra A, Abrams J S. Early expression of cytokines in lymph nodes after treatment in vivo with Staphylococcus enterotoxin B. J Immunol Methods. 1994;175:47–58. doi: 10.1016/0022-1759(94)90330-1. [DOI] [PubMed] [Google Scholar]
- 27.Markovits J, Linassier C, Fosse P, Couprie J, Pierre J, Jacquemin-Sablon A, Saucier J, Le Pecq J, Larse A K. Inhibitory effects of the tyrosine kinase inhibitor genistein on mammalian DNA topoisomerase II. Cancer Res. 1989;49:5111–5117. [PubMed] [Google Scholar]
- 28.Marrack P, Blackman M, Kushnir E, Kappler J. The toxicity of staphylococcal enterotoxin B in mice is mediated by T cells. J Exp Med. 1990;171:455–464. doi: 10.1084/jem.171.2.455. [DOI] [PMC free article] [PubMed] [Google Scholar]
- 29.Marrack P, Kappler J. The staphylococcal enterotoxins and their relatives. Science. 1990;248:705–711. doi: 10.1126/science.2185544. [DOI] [PubMed] [Google Scholar]
- 30.Matsuyama S, Koide Y, Yoshida T O. HLA class II molecule-mediated signal transduction mechanism responsible for the expression of interleukin-1 beta and tumor necrosis factor-alpha genes induced by a staphylococcal superantigen. Eur J Immunol. 1993;23:3194–3202. doi: 10.1002/eji.1830231223. [DOI] [PubMed] [Google Scholar]
- 31.Mehindate K, al-Daccak R, Damdoumi F, Mourad W. Synergistic effect between CD40 and class II signals overcomes the requirement for class II dimerization in superantigen-induced cytokine gene expression. Eur J Immunol. 1996;26:2075–2080. doi: 10.1002/eji.1830260917. [DOI] [PubMed] [Google Scholar]
- 32.Miethke T, Wahl C, Heeg K, Echtenacher B, Krammer P H, Wagner H. Superantigen mediated shock: a cytokine release syndrome. Immunobiology. 1993;189:270–284. doi: 10.1016/S0171-2985(11)80362-1. [DOI] [PubMed] [Google Scholar]
- 33.Miethke T, Wahl C, Heeg K, Echtenacher B, Krammer P H, Wagner H. T cell-mediated lethal shock triggered in mice by the superantigen staphylococcal enterotoxin B: critical role of tumor necrosis factor. J Exp Med. 1992;175:91–98. doi: 10.1084/jem.175.1.91. [DOI] [PMC free article] [PubMed] [Google Scholar]
- 34.Morio T, Geha R S, Chatila T A. Engagement of MHC class II molecules by staphylococcal superantigens activates src-type protein tyrosine kinases. Eur J Immunol. 1994;24:651–658. doi: 10.1002/eji.1830240325. [DOI] [PubMed] [Google Scholar]
- 35.Neill R J, Jett M, Crane R, Wootres J, Welch C, Hoover D, Gemski P. Mitogenic activities of amino acid substitution mutants of staphylococcal enterotoxin B in human and mouse lymphocyte cultures. Infect Immun. 1996;64:3007–3015. doi: 10.1128/iai.64.8.3007-3015.1996. [DOI] [PMC free article] [PubMed] [Google Scholar]
- 36.Nishizuka Y. Intracellular signaling by hydrolysis of phospholipids and activation of protein kinase C. Science. 1992;258:607–614. doi: 10.1126/science.1411571. [DOI] [PubMed] [Google Scholar]
- 37.Novogrodsky A, Vanichkin A, Patya M, Gazit A, Osherov N, Levitzki A. Prevention of lipopolysaccharide-induced lethal toxicity by tyrosine kinase inhibitors. Science. 1994;264:1319–1322. doi: 10.1126/science.8191285. [DOI] [PubMed] [Google Scholar]
- 38.Palkama T, Hurme M. Signal transduction mechanisms of HLA-DR-mediated interleukin-1 beta production in human monocytes. Role of protein kinase C and tyrosine kinase activation. Hum Immunol. 1993;36:259–267. doi: 10.1016/0198-8859(93)90133-l. [DOI] [PubMed] [Google Scholar]
- 39.Schlievert P M. Role of superantigens in human disease. J Infect Dis. 1993;167:997–1002. doi: 10.1093/infdis/167.5.997. [DOI] [PubMed] [Google Scholar]
- 40.Scholl P R, Trede N, Chatila T A, Geha R S. Role of protein tyrosine phosphorylation in monokine induction by the staphylococcal superantigen toxic shock syndrome toxin-1. J Immunol. 1992;148:2237–2241. [PubMed] [Google Scholar]
- 41.See R H, Chow A W. Staphylococcal toxic shock syndrome toxin 1-induced tumor necrosis factor alpha and interleukin-1β secretion by human peripheral blood monocytes and T lymphocytes is differentially suppressed by protein kinase inhibitors. Infect Immun. 1992;60:3456–3459. doi: 10.1128/iai.60.8.3456-3459.1992. [DOI] [PMC free article] [PubMed] [Google Scholar]
- 42.See R H, Kum W W, Chang A H, Goh S H, Chow A W. Induction of tumor necrosis factor and interleukin-1 by purified staphylococcal toxic shock syndrome toxin 1 requires the presence of both monocytes and T lymphocytes. Infect Immun. 1992;60:2612–2618. doi: 10.1128/iai.60.7.2612-2618.1992. [DOI] [PMC free article] [PubMed] [Google Scholar]
- 43.Trede N S, Geha R S, Chatila T. Transcriptional activation of IL-1 beta and tumor necrosis factor-alpha genes by MHC class II ligands. J Immunol. 1991;146:2310–2315. [PubMed] [Google Scholar]
- 44.Trede N S, Morio T, Scholl P R, Geha R S, Chatila T. Early activation events induced by the staphylococcal superantigen toxic shock syndrome toxin-1 in human peripheral blood monocytes. Clin Immunol Immunopathol. 1994;70:137–144. doi: 10.1006/clin.1994.1021. [DOI] [PubMed] [Google Scholar]
- 45.Xiao G, Falkner K C, Xie Y, Lindahl R G, Prough R A. cAMP-dependent negative regulation of rat aldehyde dehydrogenase class 3 gene expression. J Biol Chem. 1997;272:3238–3245. doi: 10.1074/jbc.272.6.3238. [DOI] [PubMed] [Google Scholar]
- 46.Yeung R S, Penninger J M, Kundig T, Khoo W, Ohashi P S, Kroemer G, Mak T W. Human CD4 and human major histocompatibility complex class II (DQ6) transgenic mice: supersensitivity to superantigen-induced septic shock. Eur J Immunol. 1996;26:1074–1082. doi: 10.1002/eji.1830260518. [DOI] [PubMed] [Google Scholar]


