

Abstract

Boron-containing compounds are commonly used in synthetic chemistry and are known to play important roles in biology. Despite the widespread relevance of boronated compounds, there have been limited methods to discover, characterize, and study them. Here, we describe the use of 11B NMR, including 1H–11B HMBC, for the isolation and characterization of the boron-containing natural product diadenosine borate. Utilizing synthetic standards, we optimized coupling parameters for 1H–11B HMBC experiments to allow for the analysis of small quantities (∼1 mg) of boron-containing compounds. This work can facilitate the broader application of 11B NMR to the study of boron in a range of applications, from synthetic chemistry to the role of boron in naturally occurring systems.
Boron is a highly abundant element that is essential for the health and survival of plants, animals, and humans.1 There are a growing number of examples that show the incorporation of boron into small molecules results in important biological and biomedical signatures.1 In plants, there is the formation of a boron ester with rhamnogalacturonan II (RGII), which is essential for cell wall structure.2 Bacteria have yielded the boron-containing natural products aplasmomycin (1), which displays antibiotic activity,3,4 and boromycin (2), which displays activity against HIV,5 both of which are representative of a growing class of boron-containing polyketides.1 One of the most abundantly characterized boron-containing molecules is autoinducer-2 (AI-2) (3), which plays an important role in bacterial quorum sensing (Figure 1).6,7 The importance of boron extends beyond biological systems. Boron-containing compounds are also important in synthetic chemistry; the use of them as reagents in organic synthesis earned the Nobel prize in chemistry in 1979.8
Figure 1.
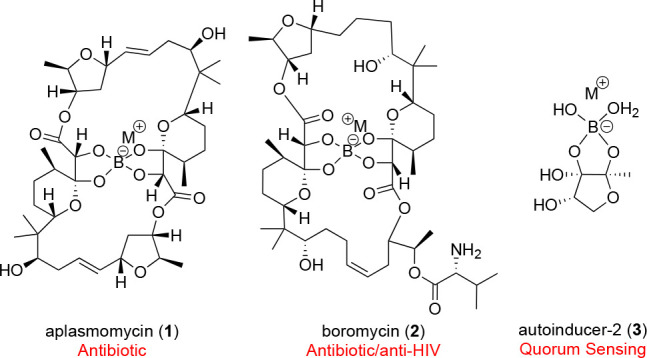
Boron-containing natural products.
While these metabolites have been discovered through bioactivity-driven isolation, a concerted effort to understand the diversity of structure and the role of boron-containing compounds has been lacking. This has been limited by the tools available to observe boron-containing molecules, which are difficult to identify by mass spectrometry due to their poor ionization and lack of an easy to identify isotope pattern in targeted metabolomics. In addition, boron-containing molecules have no unique identifiers in 1H NMR or other spectroscopic signatures.
11B NMR is a straightforward method to screen boron-containing compounds, but it has been insufficient for screening crude material due to poor sensitivity and signal resolution because of extraneous noise caused by surrounding probe pieces that contain boron. Recently, our lab applied a composite pulse sequence that successfully suppressed extraneous noise and increased signal detection in crude material, allowing us to search for boron-containing compounds among a survey of extracts.9
While 11B NMR can be used to determine whether boron is present in a sample and provide insight into the type of boron species, it provides limited information regarding boron connectivity. 1H–11B HMBC NMR is a valuable supplement to 11B NMR in advancing the detection and characterization of boron-containing metabolites. 1H–11B correlations can not only inform about the presence of boron but inform about the broader chemical context of the boron species throughout the process of isolation and aid in prioritization of extracts. This NMR method will also aid in structure elucidation of both isolated and synthetically produced boron-containing compounds. Together, 11B and 1H–11B HMBC NMR experiments are powerful tools for studying boron-containing compounds and advancing the understanding of the role of boron in biology.
Herein, we report the successful use of 11B NMR to identify a boron-containing adenosine product (4) and the development and use of 1H–11B HMBC to determine boron connectivity.
Following an initial screen of our microbial-derived fraction library,9 an extract from Streptomyces radiopugnans strain SNE-036 was identified among those with a clear 11B signal at δ 7.0 ppm, a chemical shift suggestive of a borate species (Figure 2). Subsequently, we used 11B NMR to guide the isolation of the pure molecule. SNE-036 was purified by HPLC, and each fraction was dissolved in D2O, transferred to quartz NMR tubes, and screened with 256 scans (∼10 min). Three different boron signals were observed at δ 7.0, 11.8, and 19.5 ppm during purification. Fractions displaying δ 7.0 and 11.8 ppm signals were prioritized for further purification because they were likely quaternary borate species, while the δ 19.5 ppm species likely corresponded with boric acid (Figure S38).10,11
Figure 2.

11B NMR of semicrude SNE-036 extract (200 mg, 256 scans, top) and pure compound 4 (1 mg, 512 scans, bottom) in D2O with potential boron species.10,11
Fractionation of SNE-036 by HPLC with a gradient of H2O/ACN and LH-20 in MeOH caused the loss of boron signals at δ 7.0 and 11.8 ppm, and only those at δ 19.5 ppm remained, suggesting the borate groups were being hydrolyzed to boric acid. The sensitivities of the δ 7.0 and 11.8 ppm species were surveyed by incubating a fraction enriched in δ 7.0 and 11.8 ppm species to 12 solvent and buffer conditions (using deuterated solvents) for 12 h and subsequently measuring 11B NMR spectra. We determined that strong nucleophiles and mildly acidic conditions caused borate hydrolysis, while H2O and ACN did not (Table S2). While the borate group was not hydrolyzed by prolonged exposure to H2O and ACN, it was hydrolyzed in the HPLC on three different columns (C18, C5, and phenyl hexyl) with this solvent system (Figure S1).
Due to the inherent negative charge of the quaternary borate species, we predicted that a basic buffer would help to stabilize the borate group and prevent hydrolysis during purification. A borate-containing fraction was tested with a 10–100% gradient of ACN and 20 mM NH4HCO3 in H2O (pH ≈ 9) on a C18 column. The δ 11.8 ppm borate species was hydrolyzed to form boric acid (δ 19.5 ppm), but all of the δ 7.0 ppm species remained. This was a significant improvement on the total hydrolysis of all borate species observed under previously tested HPLC conditions, suggesting an increased stability of borates in mildly basic HPLC conditions. The 20 mM NH4HCO3 solution was used for further purification. After HPLC purification, we obtained ∼1 mg of 4 as a white powder and characterized it using NMR and mass spectrometry (Figure 3). The 1H and 11B NMR data suggested our isolate contained a mixture of the boronated and nonboronated species (Figure 3).
Figure 3.

(a) Structure of compound 4. (b) 1H NMR of 1 mg of synthetic (top) and isolated (bottom) 4 in D2O.
The isolated compound was identified as a diadenosine borate (4) through analysis of the 1H NMR spectrum (Figure 3). Peaks in the δ 3.0–5.0 ppm range were consistent with those of a furanose, and the two signals at δ 8.37 (2H, s) and 8.44 ppm (2H, s) reflected those in the purine moiety.12 To confirm the structure prediction, synthetic 4 was prepared by mixing a 1:1 mol ratio of adenosine and boric acid in a 20 mM NH4HCO3 solution. 1H–11B HMBC, 1H, and 11B NMR were performed on synthetic 4, and the signals were consistent with those of the isolated material (Figure 3, Table S2).
To further verify the structure of the isolated and synthetic 4, 0.5 mM solutions of both synthetic and isolated 4 were prepared in H2O and mass spectra were acquired on an Orbitrap Velos Pro using direct infusion. In both the synthetic standard and the isolate, m/z 541.1697 [M]− was observed with an isotope ratio of 1:4 M-1:M, which is consistent with the presence of a single boron atom in the molecule.12
To our knowledge, this is the first isolation of a nucleoside borate from a microbial or plant extract. Nucleoside borates have been produced and characterized synthetically for different applications. Some examples include a borono-linked dinucleotide (5) used to display the utility of boronate–sugar complexes for oligonucleotide receptors,13 borate–NAD+ complex (6), which was formed to gain insight into the physiological effects of borate,14 and guanosine–borate ester 7, which is implicated in prebiotic evolution (Figure 4).15
Figure 4.

Previously reported synthetic boron-containing nucleoside analogs.13−15
While 1D 11B NMR suggested the sample contained borate and 1H NMR suggested the sample contained adenosine, further data was needed to support that the isolate was a diadenosine borate. Since we were not able to fully purify 4, we turned to correlative 1H–11B NMR to accomplish two items: (1) ensure that boron was attached to the molecule and not a boric acid salt and (2) provide evidence of where the boron was connected.
There is limited literature on correlative 1H–11B experiments, including 1D or 2D HMBC experiments. We set out to optimize an experiment for use with natural products and synthetic materials and characterize the sensitivity of the experiment. For simplicity, we began by modifying a standard Bruker 2D 1H–13C HMBC experiment (HMBCGP). We changed the second nucleus to 11B, and the transmitter frequency offset (O1P) was set to zero over a spectral width from −100 to 100 ppm to include any possible boron species. As little is known about the magnitude of 2,3,4,5JH–B coupling, we used tributylborate (8, Table S3) and 2-methylphenyl boronic acid (2-MPBA, 9) as standards to optimize the experiment and carry out sensitivity studies.
A series of 2 h 1D 1H–11B HMBC experiments was performed with 2-MPBA as a standard to determine the limit of detection. One-dimensional 1H–11B HMBC is often a favorable experiment because there is only one boron present in most boronated species, so the added dimension is not needed to distinguish between different boron atoms within a molecule. One-dimensional HMBC can provide sufficient information regarding correlation between protons and boron in less time than 2D HMBC. A series dilution was performed to prepare 100, 50, 10, 5, and 2.5 mM solutions of 2-MPBA in CD3OD. Each sample was transferred to a quartz NMR tube, and a 2 h 1D HMBC experiment was performed (Figure 5). In the 100 and 50 mM samples of 2-MPBA, correlations were observed between boron and H-6 as well as H-7 methyl protons. In the 5 mM sample, a correlation was only seen between H-6 and boron; this is likely due to the distance between atoms as H-6 is only 3 bonds away from boron and the H-7 methyl protons are 4 bonds away, leading to decreased signal intensity. No signal was observable at concentrations below 10 mM in this experiment (Figure 5).
Figure 5.

(a) Concentration vs absolute integration of 2 h 1D 1H–11B HMBC for 2-methylphenyl boronic acid (2-MPBA) in CD3OD. (b) One-dimensional 1H–11B HMBC plots for different concentrations of 2-MPBA.
On the basis of the results from the limit of detection screen, the 10 mM solution of 2-MPBA was selected as a test solution to compare the sensitivity of 1D vs 2D 1H–11B HMBC. One-dimensional experiments (1TD = 1) were performed using 750, 1500, 3000, 6000, and 12 000 scans equaling 0.25, 0.5, 1, 2, and 4 h, and 2D experiments (1TD = 48) were performed using 60, 120, 180, and 240 scans equaling 1, 2, 3, and 4 h, respectively (Figure 6). A 0.5 h experiment was required to detect signal with 1D HMBC, while 3 h was required to detect signals for 2D HMBC. These results suggest the utility of 1D 1H–11B HMBC as a more efficient screening method for small amounts of boron-containing compounds.
Figure 6.

(a) Experiment time (h) vs absolute integration of 1D 1H–11B HMBC and 2D 1H–11B HMBC for 2-MPBA in CD3OD. (b) Four hour 1D 1H–11B HMBC of 10 mM 2-MPBA. (c) Four hour 2D 1H–11B HMBC of 10 mM 2-MPBA.
While 1D HMBC is a more efficient method, 2D HMBC allows for clearer visualization of 1H–11B correlations. Since our sample exhibited more than one boron signal, we ran a 2D HMBC experiment to distinguish between the boron species. To validate the presence of boron in the structure of the isolate, a 12 h 2D 1H–11B HMBC experiment was performed. The HMBC experiment yielded a correlation between the δ 7.0 ppm boron species and a proton signal at δ 4.7 ppm (Figure 7). The 1H δ 4.7 ppm signal for H-2′ is underneath the solvent signal, and attempts to use VT NMR to resolve the spectrum from the solvent peak were not successful. In addition, 4 has limited solubility and stability, so attempts to run NMR in other solvents including CDCl3 and CD3CN were unsuccessful. Synthetic 4 was composed of both the diadensoine borate species and the monoadenosine borate species, but similar to the isolated material, each species in the synthetic material showed only a single HMBC correlation (Figure S14). As there is little known about the magnitudes of 1H–11B J coupling, attempts at optimizing for smaller and larger values did not provide stronger signals. The observed signal corresponds to a proton attached to C2′, suggesting boron is bound to the cis-vicinal diol in the furanose (Figure 7). This correlation is consistent with previously reported synthetic nucleoside borates which all contain a borate group coordinated to the cis-vicinal diol in the furanose (Figure 4).13−151H–11B HMBC, 1H, and 11B NMR as well as mass spectrometry data support our characterization of 4 as a diadenosine borate.
Figure 7.

Two-dimensional 1H–11B HMBC of 4 (1 mg, 720 scans) in D2O.
For the first time, we successfully performed a targeted isolation of an unknown boron-containing compound from a biological source using 11B NMR. We optimized and utilized 1H–11B HMBC to identify and elucidate the structure of a natural product. Our work highlights the broad applications of 11B NMR and 1H–11B HMBC that span from identification of biologically relevant molecules to structural confirmation of synthetic borates.
Experimental Section
General Experimental Procedures
The 1H (499 MHz) and 11B (160 MHz) NMR spectra were recorded on a Bruker 11.7 T Avance III HD spectrometer equipped with a BBFO SmartProbe. The 1H (800 MHz) and 13C (201 MHz) NMR characterization spectra were recorded on a Bruker 18.8 T Advance III HD spectrometer equipped with a 5 mm HCN TCl cryoprobe. Chemical shifts were referenced to TMS (1H: δ 0.0 ppm) and BF3OEt2 (11B: δ 0.0 ppm) with downfield positive shifts. NMR samples were prepared in 5 mm Wilmad Quartz NMR tubes, 535-PP-7QTZ, and lock was achieved with deuterated solvents. Data was collected at ambient temperature. HRMS measurements were performed via direct injection on a LTQ-Orbitrap Velos Pro MS. HPLC purifications were carried out on an Agilent 1200 HPLC consisting of a UV–vis detector (G1315D), dual pumps (G1312A), and a dynamic mixer (G1312A).
Collection and Phylogenetic Analysis of Strain SNE-036
The marine-derived bacterium, strain SNE-036, was isolated from a sediment sample collected from off the coast Kiawah Island, Charleston, SC (N 32° 35′10″, W 80° 07′31″ W). Bacterial spores were collected via stepwise centrifugation as follows: 2 g of sediment was dried over 24 h in an incubator at 35 °C, and the resulting sediment was added to 10 mL of sH2O containing 0.05% Tween 20. After a vigorous vortex for 10 min, the sediment was centrifuged at 2500 rpm for 5 min (4 °C). The supernatant was removed and transferred into a new tube and centrifuged at 18 000 rpm for 25 min (4 °C), and the resulting spore pellet was collected. The resuspended spore pellet (4 mL of sH2O) was plated on a humic acid media, giving rise to individual colonies of SNE-036 after 2 weeks. Analysis of the 16S rRNA sequence (1254 bp) of SNE-036 revealed 99% identity to Streptomyces radiopugnans.
Cultivation and Extraction
Bacterium SNE-036 was cultured in 5 × 2.8 L Fernbach flasks each containing 1 L of a seawater-based medium (10 g of starch, 4 g of yeast extract, 2 g of peptone, 1 g of CaCO3, 40 mg of Fe2(SO4)3·4H2O, 100 mg of KBr) and shaken at 200 rpm at 27 °C. After 7 days of cultivation, sterilized XAD-7-HP resin (20 g/L) was added to adsorb the organic products, and the culture and resin were shaken at 200 rpm for 2 h. The resin was filtered through cheesecloth, washed with deionized water, and eluted with acetone. The acetone-soluble fraction was dried in vacuo to yield 3.5 g of extract.
Isolation
The extract (3.5 g) was fractionated by flash column chromatography on C18 (40 μm, 100 g), eluting with a gradient of H2O and MeOH (90:10–0:100), and 30 fractions (Fr.1–Fr.30) were collected. Fraction 10 (37 mg) was purified by reversed-phase HPLC (Phenomenex Luna, C18, 250 × 10.0 mm, 1.2 mL/min, 5 μm, UV = 330 and 254 nm) using an isocratic solvent system with 90:10 20 mM NH4HCO3/ACN over 25 min to afford adenosine borate (4, 1.0 mg, tR = 19.5 min).
Adenosine Borate
Adenosine borate is a white solid (4, 1.0 mg). For 1H NMR (800 MHz, D2O), 11B NMR (160 MHz, D2O), and 13C NMR (201 MHz, D2O) results, see Table S2. HRMS m/z 541.1697 [M]− (C20H22BN10O8–, calcd 541.1721).
Preparation of Synthetic 4
A 18.41 mg amount of adenosine (0.0689 mmol) was mixed with 4.26 mg of boric acid (0.0689 mmol) in a 20 mM solution of NH4HCO3 in H2O (2 mL) overnight. The sample was dried under N2 and resuspended in D2O for NMR characterization.
Acknowledgments
We would like to thank Isobel Blue for assistance in bacterial fermentation.
Supporting Information Available
Experimental procedures and NMR spectroscopic data (PDF). The Supporting Information is available free of charge at https://pubs.acs.org/doi/10.1021/acs.jnatprod.2c00745.
Author Contributions
The manuscript was written through contributions of all authors. All authors have given approval to the final version of the manuscript.
This work was supported by the National Science Foundation GRFP (DEG 1842400, to J.M.M.) and NIH R01CA225960.
The authors declare no competing financial interest.
Supplementary Material
References
- Dembitsky V. M.; Gloriozova T. A. J. Nat. Prod. Resour. 2017, 3, 147–154. [Google Scholar]
- Brdar-Jokanovic M. Int. J. Mol. Sci. 2020, 21, 1424. 10.3390/ijms21041424. [DOI] [PMC free article] [PubMed] [Google Scholar]
- Nakamura H.; Iitaka Y.; Kitahara T.; Okazaki T.; Okami Y. J. Antibiot. 1977, 30, 714–719. 10.7164/antibiotics.30.714. [DOI] [PubMed] [Google Scholar]
- Sato K.; Okazaki T.; Maeda K.; Okami Y. J. Antibiot. 1978, 31, 632–635. 10.7164/antibiotics.31.632. [DOI] [PubMed] [Google Scholar]
- Dunitz J. D.; Hawley D. M.; Mikloš D.; White D. N. J.; Berlin Y.; Marušić R.; Prelog V. Helv. Chim. Acta 1971, 54, 1709–1713. 10.1002/hlca.19710540624. [DOI] [PubMed] [Google Scholar]
- Chen X.; Schauder S.; Potier N.; Van Dorsselaer A.; Pelczer I.; Bassler B. L.; Hughson F. M. Nature 2002, 415, 545–549. 10.1038/415545a. [DOI] [PubMed] [Google Scholar]
- Dembitsky V. M.; Al Quntar A. A. A.; Srebnik M. Chem. Rev. 2011, 111, 209–237. 10.1021/cr100093b. [DOI] [PubMed] [Google Scholar]
- The Nobel Prize in Chemistry 1979; https://www.nobelprize.org/prizes/chemistry/1979/summary/ (accessed Oct 14, 2022).
- Macho J. M.; Blue R. M.; Lee H.; MacMillan J. B. Org. Lett. 2022, 24, 3161–3166. 10.1021/acs.orglett.2c00885. [DOI] [PMC free article] [PubMed] [Google Scholar]
- Kim D. H.; Marbois B. N.; Faull K. F.; Eckhert C. D. J. Mass Spectrom. 2003, 38, 632–640. 10.1002/jms.476. [DOI] [PubMed] [Google Scholar]
- 11B NMR Chemical Shifts. SDSU Chemistry & Biochemistry Facilities; https://www.chemistry.sdsu.edu/research/BNMR/#summary (accessed Oct 14, 2022).
- Badertscher M.; Buhlmann P.; Pretsch E.. Structure Determination of Organic Compounds: Tables of Spectral Data; Springer: Berlin, Heidelberg, 2009. [Google Scholar]
- Luvino D.; Baraguey C.; Smietana M.; Vasseur J. Chem. Commun. 2008, 2352–2354. 10.1039/b802098a. [DOI] [PubMed] [Google Scholar]
- Kim D. H.; Faull K. F.; Norris A. J.; Eckhert C. D. J. Mass Spectrom. 2004, 39, 743–751. 10.1002/jms.645. [DOI] [PubMed] [Google Scholar]
- Franco A.; da Silva J. A. L. Angew. Chem., Int. Ed. 2021, 60, 10458–10468. 10.1002/anie.202010616. [DOI] [PubMed] [Google Scholar]
Associated Data
This section collects any data citations, data availability statements, or supplementary materials included in this article.