

Abstract
Background
Few data exist on long‐term steps and their relation to changes in cardiovascular disease risk factors. We aimed to examine the associations using long‐term smartphone‐recorded steps.
Methods and Results
The present analysis made use of data from 2 national databases and a commercial app database. We evaluated the associations between smartphone‐recorded daily steps over 2 years and 2‐year changes in the cardiovascular disease risk factors. A total of 15 708 participants with mean (SD) age of 44.1 (9.5) and 23.5% women were included. After adjustment for potential confounders, differences in weight were almost linearly associated with 2‐year steps in men (estimate [SE] per 1000 steps/d: −0.33 [0.029] kg), and inversely related only above 5000 steps/d in women (−0.18 [0.054] kg). An inverse linear association with systolic blood pressure was observed in men (−0.34 [0.097] mm Hg) but not in women. Greater steps were associated with change in high‐density lipoprotein cholesterol and triglycerides (0.61 [0.068] and −3.4 [0.61] mg/dL in men; 0.64 [0.17] and −2.3 [0.67] mg/dL in women), while changes in low‐density lipoprotein cholesterol were evident in men only (−0.59 [0.17] mg/dL). A significant negative association with hemoglobin A1c was observed only in women (−0.012 [0.0043] %).
Conclusions
In a large cohort of Japanese adults, smartphone‐recorded steps over years were associated with beneficial changes in cardiovascular disease risk factors, with some differences between men and women in the associational patterns. The findings support the benefit of long‐term physical activity for cardiovascular disease health and suggest a useful role of smartphone‐recorded steps for monitoring cardiovascular disease risk over the long term.
Keywords: cardiovascular disease, glucose metabolism, mobile health, physical activity, smartphone, step counts, weight loss
Subject Categories: Cardiovascular Disease, Epidemiology, Exercise, Primary Prevention, Risk Factors
Nonstandard Abbreviations and Acronyms
- dBP
diastolic blood pressure
- sBP
systolic blood pressure
- FPG
fasting plasma glucose
Clinical Perspective.
What Is New?
Smartphone‐recorded steps over 2 years were associated with beneficial changes in cardiovascular disease risk factors, and particularly robustly with weight, waist, high‐density lipoprotein cholesterol, and triglyceride in both sexes. The inverse associations in general showed linear dose–response.
What Are the Clinical Implications?
The findings support the benefit of long‐term physical activity for cardiovascular disease health and suggest a useful role of smartphone‐recorded steps for monitoring cardiovascular disease risk over the long term.
Accumulated evidence has shown many health benefits of physical activity. Ambulation, including intentional walking (eg, for exercise or transportation), can be measured with step counters; thus, daily step counts can be a surrogate marker for total volume of physical activity. 1 , 2 , 3 , 4 A goal of daily steps, commonly set at 10 000, has been investigated in recent studies, 4 , 5 and a recent systematic review demonstrated that each additional 1000 steps/d taken, even <10 000 steps, is associated with decreased risk of mortality, cardiovascular disease mortality, and morbidity. 4 However, most of the studies assessed daily steps only over a short period (eg, 7 days), which may not represent participants' true steps over the long term. 6 Furthermore, evaluation of changes in average daily steps can help lend support for a causal relation of step counts with health outcomes in observational studies, which has not been well investigated, except for a recent study on cardiorespiratory fitness. 7
Smartphones currently are able to capture step counts continuously and thus can collect data on long‐term daily steps. 8 Indeed, a recent expert panel highlighted evidence regarding steps and health outcomes as a major evidence gap requiring more investigation. 9 To fill these knowledge gaps, in this study, we pragmatically used smartphone‐recorded consecutive daily steps over a period of years to examine their association with change in CVD‐related biomarkers in a large cohort of working‐age adults. We hypothesized that the associations are nonlinear and may differ for different risk factors.
Methods
Data described in this article will not be publicly available because of the confidentiality agreement related to the data. Analytic code will be made available upon request pending application and approval. The requirement for obtaining written informed consent from the participants was waived. The study protocol was approved by the Institutional Review Board of the Harvard T.H. Chan School of Public Health (Boston, Massachusetts). Further information is available in Data S1.
Study Population
The present analysis made use of data from the Japanese national health check‐up database, the Japanese government health insurance claims database, and a commercial app database (kencom, developed by DeSC Healthcare Inc.). Business companies in Japan are responsible for the health of employees and their families, offering free annual health check‐ups that are taken by almost all of those qualified. The annual health check‐up results, including biomarkers of CVD risk, are stored in the health check‐up database. Information from the health insurance claims database was leveraged to ascertain the use of medications for hypertension, hypercholesterolemia, and diabetes. “kencom” is a free app on both iOS and Android platforms that can be used by the workers and their families who belong to the society‐managed, employment‐based health insurance association (public sector) affiliated with DeSC Healthcare Inc. The app was designed to promote the users' physical activity through various means including friendly competition. 10 The kencom database records daily step information of the app users. More detailed information on the present database is available in Data S1.
The present analysis targeted working‐age adults living in Japan. To be included in the present study, participants had to undergo an annual health check‐up between April 2015 and November 2020 (“baseline health check‐up”) and a second health check‐up 24 to 35 months after the baseline health check‐up (“follow‐up health check‐up”), hereafter referred to as “2‐year” data. The participants had to download and register on kencom between April 2015 and November 2020, and have step data available in the kencom database from 1 year before the registration date (the app can pull in step data before the registration date) and all the way through to the follow‐up health check‐up. Step data were defined as being available if information was present on at least 20 days each month, for 12 consecutive months before, and through all months until the follow‐up health check‐ups. We excluded those for whom step data might be inaccurate, which we defined as having high variance in baseline steps as well as steps during the period between the baseline and follow‐up health check‐ups (top 5 percentile variance of monthly averaged steps for each). From N=17 222 participants with baseline information, N=15 662 participants were included in the main analysis. In secondary analyses, we assessed steps over 1 year (instead of 2 years) as the exposure and 1‐year changes in CVD biomarkers as the outcome.
Assessment of Steps
The primary exposure of interest was the smartphone‐recorded average daily step count between the 2 annual health check‐up assessments (as noted above, 24 to 35 months apart and referred to as “2‐year steps”). We averaged step counts over the consecutive 24 to 35 months between the baseline and follow‐up health check‐ups. Additionally, to control for the starting level of activity, we also defined “baseline steps” as mean daily steps over 12 consecutive months before the baseline health check‐up, which was used as a covariate in analyses. This study design is summarized in Figure 1.
Figure 1.
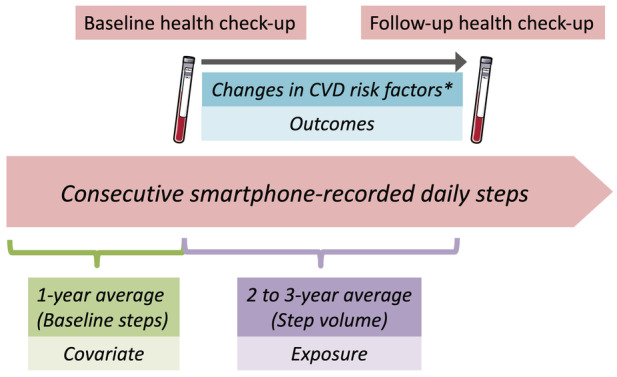
Study design.
The exposure consecutively measured averaged step counts over 2 years, and the outcomes were 2‐year changes in CVD risk factors including weight, body mass index, waist, systolic and diastolic blood pressure, high‐density lipoprotein cholesterol, low‐density lipoprotein cholesterol, triglyceride, fasting plasma glucose, and HbA1c. Laboratory data were ascertained in the baseline and follow‐up (24–35 months after baseline) health check‐ups. Models were adjusted for baseline demographics and laboratory data as well as baseline steps measured over 1 year before the participant's baseline health check‐up. CVD indicates cardiovascular disease; and HbA1c, hemoglobin A1c.
CVD Risk Assessment
The primary outcomes were 2‐year changes (ie, baseline to follow‐up health check‐ups, in the following CVD‐related biomarkers: weight (kg), BMI (kg/m2), waist (cm), systolic BP (sBP; mm Hg), diastolic BP (dBP; mm Hg), HDL cholesterol (HDL‐c; mg/dL), LDL cholesterol (LDL‐c; mg/dL), triglyceride (mg/dL), fasting plasma glucose (FPG; mg/dL), and hemoglobin A1c (HbA1c) (%). sBP and dBP were averaged over 2 measurements taken at each health examination. Data on these biomarkers were obtained from the national health check‐up database.
Covariate Assessment
Age, sex, smoking status, and alcohol consumption were assessed during the annual health check‐ups, which were ascertained from the health check‐up database. The use of lipid‐lowering drugs, glucose‐lowering drugs, and antihypertensive drugs was defined as use within 3 months before the baseline health check‐ups, and the information was ascertained from the health insurance claims database.
Statistical Analysis
Continuous data were expressed as mean±SD or median (interquartile range). Missing values were generally few as summarized in Table S1 and complete cases were used for every analysis.
We a priori determined to conduct sex‐stratified analyses using separate models because of potentially huge differences in phone wear between sexes. 8 We estimated the associations between the 2‐year steps and changes in CVD risk factors using multivariate generalized additive models with use of cubic spline function of steps. The models were adjusted for age (continuous), BMI (continuous), current smoking (yes/no), current alcohol drinking (yes/no), use of lipid‐lowering drugs (yes/no), glucose‐lowering drugs (yes/no), and antihypertensive drugs (yes/no) at baseline health check‐up, baseline steps (continuous), and the months between baseline and follow‐up health check‐ups (continuous). We also adjusted the models for the related baseline CVD risk with respect to each outcome; that is, baseline waist (cm) for waist difference, baseline sBP (mm Hg) for sBP difference, and baseline dBP (mm Hg) for dBP difference, baseline HDL‐c (mg/dL) for HDL‐c difference, baseline LDL‐c (mg/dL) for LDL‐c difference, baseline triglyceride (mg/dL) for triglyceride difference, baseline FPG (mg/dL) for FPG difference, and baseline HbA1c (%) for HbA1c difference outcomes. We visualized the nonlinear associations using the R package “ggeffects” by setting the covariates reference values. 11 We also used linear regressions to estimate the slopes of change in risk factors in relation to average daily steps. We further analyzed the associations between steps and changes in CVD risks stratified by high/low baseline steps, defined as above/below the median value separately for each sex.
In the post hoc analyses, we evaluated the effect measure modifications by sex, testing the interactions between steps and sex in the generalized additive models based on the models using whole population for each outcome.
As secondary analyses, we assessed the associations between 1‐year steps and 1‐year changes in the CVD risks. The definitions of the exposure and outcomes were parallel to main analyses with step counts averaged over the consecutive 12 to 23 months (hereafter referred to as “1‐year steps”) between baseline and 1‐year follow‐up health check‐ups (also separated by 12 to 23 months), and changes in CVD‐related biomarkers from baseline to 1‐year follow‐up health check‐ups.
We used false discovery rate (FDR) for the statistical inferences given 10 outcomes of interest in each sex (20 comparisons). Multiple testing for the interactions was also adjusted by FDR (10 outcomes). All analyses were performed using R 3.6.1 (The R Foundation).
Results
Table 1 summarizes the characteristics of the study participants. A total N=11 986 men and N=3722 women were included in the main analysis. The mean (SD) age was 44.1 (9.5) years, and median (interquartile range) BMI was 22.8 (20.8, 24.9) kg/m2. Men were more likely to drink alcohol, be a current smoker, and have worse CVD risk profiles compared with women, although the median values of every CVD‐related biomarker were within normal range in either sex. Characteristics of the population included versus excluded in the main analysis are summarized in Table S2.
Table 1.
Baseline Characteristics
| Men | Women | |
|---|---|---|
| N=11 986 | N=3722 | |
| At baseline health check‐up | ||
| Age, y | 44.4 (9.7) | 43.1 (9.0) |
| Alcohol drinking | 7991 (78.4) | 1701 (54.6) |
| Current smoking | 2590 (21.6) | 195 (5.2) |
| BMI, % | 23 [21, 25] | 21 [19, 23] |
| Waist, cm | 83 [78, 88] | 75 [70, 82] |
| Systolic BP, mm Hg | 120 [111, 129] | 110 [101, 120] |
| Diastolic BP, mm Hg | 75 [68, 83] | 68 [61, 76] |
| HDL cholesterol, mg/dL | 57 [49, 67] | 70 [61, 81] |
| LDL cholesterol, mg/dL | 122 [103, 142] | 112 [94, 133] |
| Triglyceride, mg/dL | 94 [67, 139] | 64 [48, 88] |
| Fasting plasma glucose, mg/dL | 93 [87, 100] | 88 [83, 94] |
| HbA1c, % | 5.4 [5.2, 5.6] | 5.4 [5.2, 5.6] |
| Use of antihypertensive drug | 1185 (9.9) | 169 (4.5) |
| Use of glucose‐lowering drugs | 302 (2.5) | 31 (0.8) |
| Use of lipid‐lowering drugs | 965 (8.1) | 161 (4.3) |
| At follow‐up health check‐up | ||
| BMI, % | 23.4 [21.6, 25.5] | 21.1 [19.5, 23.6] |
| Waist, cm | 83 [78, 89] | 76 [71, 83] |
| Systolic BP, mm Hg | 121 [112, 130] | 111 [102, 122] |
| Diastolic BP, mm Hg | 77 [69, 84] | 69 [62, 77] |
| HDL cholesterol, mg/dL | 57 [49, 67] | 71 [61, 82] |
| LDL cholesterol, mg/dL | 124 [105, 144] | 117 [98, 139] |
| Triglyceride, mg/dL | 95 [67, 141] | 67 [49, 92] |
| Fasting plasma glucose, mg/dL | 94 [88, 101] | 89 [84, 95] |
| HbA1c, % | 5.4 [5.2, 5.6] | 5.4 [5.2, 5.6] |
| Steps | ||
| Interval of health check‐ups, mo | 30 [26, 36] | 30 [26, 36] |
| Baseline steps, steps/d | 6656 [5161, 8218] | 5003 [3498, 6503] |
| 2‐year steps, steps/d | 6674 [5202, 8147] | 5027 [3650, 6491] |
Values are n (%) for categorical variables and mean (SD) or median (IQR) for continuous variables.
BMI indicates body mass index; BP, blood pressure; HbA1c, hemoglobin A1c; HDL, high‐density lipoprotein; IQR, interquartile range; and LDL, low‐density lipoprotein.
Figure S1 depicts the histograms of smartphone‐recorded 2‐year steps of the main populations stratified by sex. Smartphone‐recorded steps were higher in men than in women: the median (interquartile range) 2‐year steps were 6674 (5202, 8147) steps/d in men and 5027 (3650, 6491) steps/d in women. Baseline steps and 2‐year steps were strongly correlated with Spearman correlation coefficient of 0.88.
Figures 2, 3, 4, 5 illustrate the associations of 2‐year steps and changes in CVD risks in covariate‐adjusted generalized additive models stratified by sex. The statistics are summarized in Table 2. In general, higher steps were associated with favorable changes in CVD risk; however, there were some differences in the associational patterns according to sex for several CVD risk factors. Null associations were observed for selected biomarkers. Stratified analysis by the baseline steps are illustrated in Figure S2.
Figure 2.

Associations of 2‐year step volume and changes in weight and waist.
Figures show sex‐specific, nonlinear associations of 2‐year steps as steps/d (x‐axis) and 2‐year changes of weight (kg), BMI (kg/m2), and waist (cm) (each: y‐axis). These associations were assessed by generalized additive models with cubic spline functions of 2‐year steps, adjusted for age, BMI, current smoking, alcohol drinking, use of lipid‐lowering drugs, glucose‐lowering drugs, and antihypertensive drugs at baseline health check‐up, baseline steps, and months between baseline and follow‐up health check‐ups; and additionally for baseline waist in the model of waist changes. Gray shadows show the 95% CIs. BMI indicates body mass index.
Figure 3.

Associations of 2‐year step volume and changes in blood pressure.
Figures show sex‐specific, nonlinear associations of 2‐year steps as steps/d (x‐axis) and 2‐year changes of sBP and dBP (mm Hg) (each: y‐axis). These associations were assessed by generalized additive models with cubic spline functions of 2‐year steps, adjusted for age, BMI, current smoking, alcohol drinking, use of lipid‐lowering drugs, glucose‐lowering drugs, and antihypertensive drugs at baseline health check‐up, baseline steps, and months between baseline and follow‐up health check‐ups; and additionally for systolic or diastolic BP in the model for systolic and diastolic BP changes, respectively. Gray shadows show the 95% CIs. BMI indicates body mass index; dBP, diastolic blood pressure; and sBP, systolic blood pressure.
Figure 4.

Associations of 2‐year step volume and changes in lipid‐related biomarkers.
Figures show sex‐specific, nonlinear associations of 2‐year steps as steps/d (x‐axis) and 2‐year changes of HDL‐c (mg/dL), LDL‐c (mg/dL), and triglyceride (mg/dL) (each: y‐axis). These associations were assessed by generalized additive models with cubic spline functions of 2‐year steps, adjusted for age, BMI, current smoking, alcohol drinking, use of lipid‐lowering drugs, glucose‐lowering drugs and antihypertensives at baseline health check‐up, baseline steps, and months between baseline and follow‐up health check‐ups; and additionally for the related lipid biomarker with respect to each outcome. Gray shadows show the 95% CIs. BMI indicates body mass index; HDL‐c, HDL‐cholesterol; LDL‐c, LDL‐cholesterol; and TG, triglyceride.
Figure 5.

Associations of 2‐year step volume and changes in glucose‐related biomarkers.
Figures show sex‐specific, nonlinear associations of 2‐year steps as steps/d (x‐axis) and 2‐year changes of fasting glucose (FPG, mg/dL) and HbA1c (%) (each: y‐axis). These associations were assessed by generalized additive models with cubic spline functions of 2‐year steps, adjusted for age, BMI, current smoking, alcohol drinking, use of lipid‐lowering drugs, glucose‐lowering drugs, and antihypertensives at baseline health check‐up, baseline steps, and months between baseline and follow‐up health check‐ups; and additionally for the related baseline glucose biomarker with respect to each outcome. Gray shadows show the 95% CIs. BMI indicates body mass index; FPG, fasting plasma glucose; and HbA1c, hemoglobin A1c.
Table 2.
Association of 2‐Year Steps and Changes in CVD Risks
| GAM | Linear regression | FDR‐interaction | ||||||
|---|---|---|---|---|---|---|---|---|
| EDF | FDR | β | SE | FDR | ||||
| Weight, kg | Men | N=10 175 | 1.89 | <0.001 | −0.32 | 0.029 | <0.001 | <0.001 |
| Women | N=3105 | 3.38 | 0.003 | −0.17 | 0.052 | 0.003 | ||
| BMI, kg/m2 | Men | N=10 173 | 1.77 | <0.001 | −0.11 | 0.010 | <0.001 | 0.003 |
| Women | N=3105 | 3.26 | 0.003 | −0.070 | 0.021 | 0.003 | ||
| Waist, cm | Men | N=9859 | 7.02 | <0.001 | −0.37 | 0.032 | <0.001 | <0.001 |
| Women | N=2961 | 3.23 | 0.004 | −0.25 | 0.075 | 0.004 | ||
| Systolic BP, mm Hg | Men | N=10 173 | 1.41 | 0.004 | −0.33 | 0.096 | 0.004 | 0.026 |
| Women | N=3106 | 1.00 | 0.98 | −0.004 | 0.20 | 0.98 | ||
| Diastolic BP, mm Hg | Men | N=10 172 | 1.00 | 0.001 | −0.27 | 0.070 | <0.001 | 0.021 |
| Women | N=3106 | 1.00 | 0.28 | −0.17 | 0.14 | 0.28 | ||
| HDL‐c, mg/dL | Men | N=10 070 | 3.92 | <0.001 | 0.60 | 0.068 | <0.001 | <0.001 |
| Women | N=3083 | 1.00 | <0.001 | 0.69 | 0.16 | <0.001 | ||
| LDL‐c, mg/dL | Men | N=10 067 | 1.00 | 0.004 | −0.54 | 0.18 | 0.004 | 0.009 |
| Women | N=3083 | 1.00 | 0.31 | 0.39 | 0.37 | 0.31 | ||
| Triglyceride, mg/dL | Men | N=10 070 | 1.00 | <0.001 | −3.3 | 0.60 | <0.001 | 0.007 |
| Women | N=3083 | 1.00 | 0.002 | −2.2 | 0.66 | 0.002 | ||
| FPG, mg/dL | Men | N=8609 | 1.00 | 0.023 | −0.22 | 0.093 | 0.023 | 0.077 |
| Women | N=2684 | 1.00 | 0.025 | −0.33 | 0.14 | 0.025 | ||
| HbA1c, % | Men | N=9887 | 1.00 | 0.31 | −0.0028 | 0.0027 | 0.31 | 0.52 |
| Women | N=3008 | 1.00 | 0.004 | −0.013 | 0.0043 | 0.004 | ||
Models were fitted separately for each sex. These were adjusted for age (continuous), BMI (continuous), current smoking (yes/no), alcohol drinking (yes/no), use of lipid‐lowering drugs (yes/no), glucose‐lowering drugs (yes/no), and antihypertensive drugs (yes/no) at baseline health check‐up, baseline steps (continuous), months between the baseline and follow‐up health check‐ups, and related baseline CVD risk with respect to each outcome (eg, baseline waist [continuous] for waist difference).
In GAMs, cubic spline function was applied to steps.
Interactions between steps and sex were tested in the GAMs based on the whole population.
Multiple testing was accounted with use of FDR for 20 comparisons in the sex‐stratified analyses and 10 comparisons for interaction tests.
BMI indicates body mass index; BP, blood pressure; CVD, cardiovascular disease; EDF, effective degrees of freedom; FDR, false discovery rate; FPG, fasting plasma glucose; GAM, generalized additive model; HbA1c, hemoglobin A1c; HDL‐c, high‐density lipoprotein cholesterol; low‐density lipoprotein cholesterol; and LDL, low‐density lipoprotein cholesterol.
Weight and Waist
Two‐year steps were almost linearly and inversely associated with the changes in weight or BMI in men over the observed range of steps (Figure 2). In women, an inverse relation was clear only above 5000 steps/d. The associations for changes in waist were similar. Assuming linear relationships, each additional 1000 steps/d was associated with −0.32 (SE: 0.029) kg in weight, −0.11 (0.010) kg/m2 in BMI, and −0.37 (0.032) cm in waist in men, and −0.17 (0.052) kg in weight, −0.070 (0.021) kg/m2 in BMI, and −0.25 (0.075) cm in waist in women (all: FDR <0.005). There were robust statistical interactions between sexes (FDR‐interactions <0.001 for weight and waist). Reduction in weight or waist over 2 years, corresponding to the x‐intercepts, was observed in participants with ≥7500 steps/d on average.
When stratified by baseline steps, in men, the magnitude of the inverse slopes for weight and waist were similar in participants with low and high baseline steps, although the x‐intercepts were higher in the high baseline step groups: ≈6000 and 9500 steps in low and high baseline step groups, respectively (Figure S2A). In women, however, the patterns were different; in those with low baseline steps, decreases in weight and waist were observed only above 5000 steps/d; while in those with high baseline steps, there were inverse linear associations similar to those in men, with x‐intercepts of 9000 to 10 000 steps (Figure S2B).
Blood Pressure
Two‐year steps was inversely associated with changes in sBP and dBP in men, while no statistically significant association was observed in women (FDR=0.004 and 0.001 in men and FDR=0.98 and 0.28 in women, respectively, for sBP and dBP; Figure 3). The inverse associations in men were almost linear in sBP and linear in dBP. Each additional 1000 steps/d over 2 years was associated with −0.33 (0.096) mm Hg and −0.27 (0.070) mm Hg changes in sBP and dBP, respectively. FDRs for the interaction between steps and sexes were 0.026 for sBP and 0.021 for dBP. Reduction in blood pressure over 2 years was observed in those with >10 000 to 15 000 steps/d in each sex.
In men with lower baseline steps, the reductions in sBP and dBP with higher steps were not statistically significant, while there were significant inverse linear relationships in men with higher baseline steps (Figure S2C). The associations in women were not significant in either stratum of baseline steps (Figure S2D).
Lipids
There were robust positive relationships between steps and HDL‐c in either sex (FDR <0.001; Figure 4). HDL‐c was higher by 0.60 (0.068) and 0.69 (0.16) mg/dL for each additional 1000 steps/d, averaged over 2 years, in men and women, respectively. LDL‐c was linearly and inversely associated in men (−0.54 [0.18] mg/dL per 1000 steps/d, FDR=0.004), while there was no statistically significant association in women (FDR=0.31). The associations for triglyceride were linearly inverse in both sexes, with −3.3 (0.60) and −2.2 (0.66) mg/dL changes per 1000 steps/d in men and women, respectively. The associational patterns were statistically different according to sexes (FDR‐interactions <0.001 for HDL‐c, =0.009 for LDL‐c, and =0.007 for triglyceride). The favorable changes in HDL‐c or triglyceride were observed above 5000 to 7500 step/d, while not clearly detected in LDL‐c in the observed range of steps.
In men, the associations for the slopes were similar in magnitude between low and high baseline step groups in HDL‐c and triglyceride; however, in contrast to the low baseline step groups, no significant associations were observed in LDL‐c in men with high baseline steps (Figure S2E). Overall, relationships in women were similar in stratified and nonstratified analyses except for the association with triglyceride in those with high baseline steps, which were not linear (Figure S2F).
Glucose Metabolism
Two‐year steps was significantly, inversely associated with changes in FPG in either sex (FDR=0.023 in men and 0.025 in women) and changes in HbA1c only in women (−0.013 [0.0043] % changes per 1000 step/d, FDR=0.004; Figure 5). However, there was no significant interaction between HbA1c and sex (FDR‐interaction=0.52). The favorable changes were observed above ≈7500 steps/d in both sexes.
In the stratified analysis, no significant associations were observed in men (Figure S2G). In women, the inverse relationships with either FPG or HbA1c were stronger in those with high baseline steps compared with those with low baseline steps (Figure S2H).
Secondary Analysis Using Steps Over 1 Year
N=26 884 participants were included in the secondary analyses of the associations between 1‐year steps and 1‐year (ie, 12 to 23 months) changes in CVD‐related biomarkers. There were no major differences in characteristics of participants included in the 2‐ and 1‐year step analysis (Table S3).
The results of these secondary analyses are summarized in Figure S3 and Table 3. In general, the associations with changes in CVD risks were weaker and less robust using 1‐year instead of 2‐year steps.
Table 3.
Association of 1‐Year Steps and Changes in CVD Risks
| GAM | Linear regression | ||||||
|---|---|---|---|---|---|---|---|
| EDF | FDR | β | SE | FDR | |||
| Weight, kg | Men | N=17 139 | 3.92 | <0.001 | −0.24 | 0.019 | <0.001 |
| Women | N=5396 | 2.16 | 0.44 | −0.007 | 0.035 | 0.83 | |
| BMI, kg/m2 | Men | N=17 136 | 3.13 | <0.001 | −0.082 | 0.006 | <0.001 |
| Women | N=5395 | 2.07 | 0.44 | −0.006 | 0.014 | 0.68 | |
| Waist, cm | Men | N=16 544 | 4.69 | <0.001 | −0.27 | 0.022 | <0.001 |
| Women | N=5154 | 1.00 | 0.37 | −0.060 | 0.053 | 0.37 | |
| Systolic BP, mm Hg | Men | N=17 137 | 1.97 | 0.003 | −0.26 | 0.071 | <0.001 |
| Women | N=5399 | 3.09 | 0.37 | −0.11 | 0.15 | 0.64 | |
| Diastolic BP, mm Hg | Men | N=17 135 | 1.00 | <0.001 | −0.21 | 0.052 | <0.001 |
| Women | N=5399 | 1.00 | 0.63 | −0.006 | 0.11 | 0.67 | |
| HDL‐c, mg/dL | Men | N=16 981 | 4.10 | <0.001 | 0.60 | 0.049 | <0.001 |
| Women | N=5356 | 1.61 | <0.001 | 0.74 | 0.12 | <0.001 | |
| LDL‐c, mg/dL | Men | N=16 979 | 4.61 | 0.12 | −0.31 | 0.13 | 0.038 |
| Women | N=5355 | 1.11 | 0.68 | 0.14 | 0.27 | 0.67 | |
| Triglyceride, mg/dL | Men | N=16 980 | 4.67 | <0.001 | −2.5 | 0.46 | <0.001 |
| Women | N=5356 | 1.00 | 0.28 | −0.70 | 0.53 | 0.28 | |
| FPG, mg/dL | Men | N=14 748 | 5.03 | 0.28 | −0.098 | 0.070 | 0.27 |
| Women | N=4707 | 1.96 | 0.44 | −0.065 | 0.12 | 0.67 | |
| HbA1c, % | Men | N=16 614 | 1.00 | 0.12 | −0.0036 | 0.0019 | 0.12 |
| Women | N=5232 | 1.00 | 0.014 | −0.0087 | 0.0032 | 0.014 | |
Models were fitted separately for each sex. These were adjusted for age (continuous), BMI (continuous), current smoking (yes/no), alcohol drinking (yes/no), use of lipid‐lowering drugs (yes/no), glucose‐lowering drugs (yes/no), and antihypertensive drugs (yes/no) at baseline health check‐up, baseline steps (continuous), months between the baseline and follow‐up health check‐ups, and related baseline CVD risk with respect to each outcome (eg, baseline waist (continuous) for waist difference).
In GAMs, cubic spline function was applied to steps.
Multiple testing was accounted with use of FDR for 20 comparisons in the sex‐stratified analyses.
BMI indicates body mass index; BP, blood pressure; CVD, cardiovascular disease; EDF, effective degrees of freedom; FDR, false discovery rate; FPG, fasting plasma glucose; GAM, generalized additive model; HbA1c, hemoglobin A1c; HDL‐c, high‐density lipoprotein cholesterol; and LDL‐c, low‐density lipoprotein cholesterol.
One‐year steps were inversely associated with change in weight only in men (FDR<0.0001 in men and FDR=0.44 in women), and the slope in men was less steep compared with 2‐year steps (−0.24 [0.019] kg per 1000 steps/d; Figure S3A). One‐year steps were also significantly associated with waist changes only in men (−0.27 [0.022] cm per 1000 steps/d; FDR<0.001), not in women (FDR=0.37).
The associations of 1‐year steps with BP were significant only in men, and the associations were weaker than for 2‐year steps (−0.26 [0.071] mm Hg and −0.21 [0.052] mm Hg per 1000 steps/d for sBP and dBP, respectively; Figure S3B).
In contrast to 2‐year steps, 1‐year steps were not significantly associated with changes in LDL‐c in both sexes or with triglyceride in women (Figure S3C). The associations for HDL‐c were similar with 1‐year steps (0.60 [0.049] mg/dL and 0.74 [0.12] mg/dL per 1000 steps/d in men and women, respectively).
Finally, 1‐year steps were not associated with changes in FPG in both sexes, and were associated with changes in HbA1c only in women (Figure S3D).
Discussion
In a large cohort of working‐age adults living in Japan, smartphone‐recorded step counts over 24 to 35 months were associated with favorable changes or slowed worsening in various CVD risk factors, after accounting for baseline steps and other covariates. The associational patterns differed according to the specific risk factors and sex. Differences in weight or waist were almost linearly associated in inverse fashion with steps among men, but only >5000 steps/d in women. The inverse associations with blood pressure were observed in men but not women. Inverse changes in HDL‐c and triglyceride with higher steps were noted in both sexes, whereas the association with LDL‐c was observed only in men. For glucose biomarkers, only HbA1c was inversely related to steps among women, while the interaction was not significant. The results for 1‐year steps were generally weaker compared with those from 2‐year steps. Together with data from other studies, 4 the present results suggest that using smartphone‐recorded daily steps might be one clinically useful tool for assessing CVD health.
The present study not only helps address a gap in knowledge 9 by using mass step data measured with wearables, but also provides an important contribution in the association of daily steps with CVD risk factors by investigating change in the risk factors. 4 Previous large‐scale cohort studies examining step counts generally averaged over a week have also shown inverse associations with incident CVD. 5 , 12 , 13 The present study suggests that these associations were likely mediated in part by beneficial changes in weight, waist, BMI, HDL‐c, and triglyceride. A recent systematic review reported mixed findings on the association of step counts with dysglycemia, 4 although large cohort studies have consistently shown beneficial associations of higher steps with glucose metabolism. 3 , 14 We observed significant inverse associations of 2‐year steps with change in HbA1c in women, which may indicate the need for longer‐term activity.
Data on the contribution of physical activity on CVD risks have been inconclusive or less evident in randomized controlled trials and mendelian randomization studies. 15 , 16 , 17 Importantly, the Generation 100 randomized trial showed little effects of 5‐year prescribed exercise training on CVD risks in older adults in Norway. However, the implication from the trial was limited because of the very active population at baseline (ie, even the control group was very active) and low compliance to intervention arms over the 5 years. 18 Mendelian randomization studies demonstrate inconclusive effects of physical activity on CVD, 15 , 16 , 17 and these results may reflect genetic variants being weak instruments for physical activity, potentially leading to null associations. While our present results are in line with many cohort studies suggestive of physical activity being associated with a better CVD risk profile, additional rigorous studies are needed to infer causality.
One strength of the present study based on smartphone‐recorded steps is that it is highly pragmatic and translatable for public health recommendations. Overall, within the observed range of steps, most CVD risks showed favorable associations (or less worsening) with higher step counts. In particular, 2‐year steps of ≈7500 steps/d, congruent with previous studies noting a plateauing of mortality risk reduction at this level, 4 , 5 corresponded to the level for favorable/unfavorable changes (ie, x‐intercepts) in weight and waist in both sexes. Favorable changes were observed around this cutoff for HLD‐c, triglyceride, and glucose metabolism, whereas greater step counts would be needed for blood pressure or LDL‐c. One limitation of note is that smartphone‐recorded steps may underestimate true step counts since the phone is not always carried. A previous study of iPhone‐recorded steps observed an undercount of steps measured by an accelerometer worn all the time, by 12%. 8 Differences were larger among those who noted they did not always carry their phone, and also among women (who may be less likely to always carry their phone). 8 It is possible that the present nonsignificant associations among women with lower baseline steps may be partly because of less accurate measurement of steps because of noncarrying of phones, since some significant associations were observed in women with higher baseline steps.
Another limitation was that many qualified participants did not undergo the follow‐up health check‐ups because of unspecified reasons, including job change into nonaffiliated companies, switching national insurance type, opting not to undergo the check‐up, and death or serious comorbidities at the period of follow‐up health check‐up. Such selection might induce bias; however, the associational patterns in 1‐year and 2‐year steps were similar, and the latter associations were more pronounced, consistent with the dose–response where higher cumulative steps should have greater health impact, suggestive of capturing overall less biased signals. Analyses adjusting for medications prescribed during the follow‐up period provided findings similar to the main analyses, supporting the reliability. While it is possible that the development of incident serious diseases could have caused a person to miss the follow‐up health examination, this is less likely because the pool of participants was in general healthy adults who were working for companies or their families. Additionally, individuals with major comorbidities or previous serious diseases are likely covered by other national health insurance in Japan and were not included in this study. Reverse causation is also possible; worsening health and CVD biomarkers led to a decrease in steps, rather than that more steps led to better CVD biomarkers. Different study designs are needed to address the limitation. Although physical activity and CVD risk factors are in part genetically influenced, we did not have any genetic information on participants. 19 Finally, the study population was drawn from healthy individuals living in Japan who had registered on the kencom app and there may be limited generalizability in the findings.
Conclusions
In a large cohort of working‐age adults living in Japan, smartphone‐recorded steps over 24 to 35 months were associated with beneficial changes in various CVD risk factors after accounting for potential confounders. In particular, robust linear associations were found for changes in weight, waist, BMI, HDL‐c, and triglyceride in both sexes. Distinct patterns of association were observed in selected factors between sexes. As such, smartphone‐recorded daily steps may be one clinically useful tool to help gauge CVD health.
Sources of Funding
This study was funded by DeSC Healthcare, Inc.
Disclosures
R.H. received consultancy fees from DeSC Healthcare, Inc. M.M. is an employee of DeSC Healthcare Inc. K.M. is a representative director (medical doctor) of DeSC Healthcare Inc. I.L. has no disclosures to report.
Supporting information
Data S1. Data structure.
Tables S1‐S3.
Figures S1‐S3.
Acknowledgments
We thank Akiko Tanaka, MSc for assisting with the handling and interpretation of the health insurance claims data.
Supplemental Material is available at https://www.ahajournals.org/doi/suppl/10.1161/JAHA.121.025689
For Sources of Funding and Disclosures, see page 11.
References
- 1. Saint‐Maurice PF, Troiano RP, Bassett DR, Graubard BI, Carlson SA, Shiroma EJ, Fulton JE, Matthews CE. Association of daily step count and step intensity with mortality among US adults. JAMA. 2020;323:1151. doi: 10.1001/jama.2020.1382 [DOI] [PMC free article] [PubMed] [Google Scholar]
- 2. Lin H, Sardana M, Zhang Y, Liu C, Trinquart L, Benjamin EJ, Manders ES, Fusco K, Kornej J, Hammond MM, et al. Association of habitual physical activity with cardiovascular disease risk. Circ Res. 2020;127:1253–1260. doi: 10.1161/CIRCRESAHA.120.317578 [DOI] [PMC free article] [PubMed] [Google Scholar]
- 3. Dwyer T, Ponsonby A‐L, Ukoumunne OC, Pezic A, Venn A, Dunstan D, Barr E, Blair S, Cochrane J, Zimmet P, et al. Association of change in daily step count over five years with insulin sensitivity and adiposity: population based cohort study. BMJ. 2011;342:c7249. doi: 10.1136/bmj.c7249 [DOI] [PubMed] [Google Scholar]
- 4. Hall KS, Hyde ET, Bassett DR, Carlson SA, Carnethon MR, Ekelund U, Evenson KR, Galuska DA, Kraus WE, Lee I‐M, et al. Systematic review of the prospective association of daily step counts with risk of mortality, cardiovascular disease, and dysglycemia. Int J Behav Nutr Phys Act. 2020;17:78. [DOI] [PMC free article] [PubMed] [Google Scholar]
- 5. Lee I‐M, Shiroma EJ, Kamada M, Bassett DR, Matthews CE, Buring JE. Association of step volume and intensity with all‐cause mortality in older women. JAMA Intern Med. 2019;179:1105. doi: 10.1001/jamainternmed.2019.0899 [DOI] [PMC free article] [PubMed] [Google Scholar]
- 6. Matthews CE, Freedson PS, Hebert JR, Stanek EJ III, Merriam PA, Rosal MC, Ebbeling CB, Ockene IS. Seasonal variation in household, occupational, and leisure time physical activity: Longitudinal analyses from the seasonal variation of blood cholesterol study. Am J Epidemiol. 2001;153:172–183. doi: 10.1093/aje/153.2.172 [DOI] [PubMed] [Google Scholar]
- 7. Nayor M, Chernofsky A, Spartano NL, Tanguay M, Blodgett JB, Murthy VL, Malhotra R, Houstis NE, Velagaleti RS, Murabito JM, et al. Physical activity and fitness in the community: the Framingham heart study. Eur Heart J. 2021;42:4565–4575. doi: 10.1093/eurheartj/ehab580 [DOI] [PMC free article] [PubMed] [Google Scholar]
- 8. Amagasa S, Kamada M, Sasai H, Fukushima N, Kikuchi H, Lee I‐M, Inoue S. How well iPhones measure steps in free‐living conditions: Cross‐sectional validation study. JMIR MHealth UHealth. 2019;7:e10418. doi: 10.2196/10418 [DOI] [PMC free article] [PubMed] [Google Scholar]
- 9.: 2018. Physical Activity Guidelines Advisory Committee . 2018 Physical Activity Guidelines Advisory Committee Scientific Report. 779.
- 10. Hamaya R, Fukuda H, Takebayashi M, Mori M, Matsushima R, Nakano K, Miyake K, Tani Y, Yokokawa H. Effects of an mHealth app (Kencom) with integrated functions for healthy lifestyles on physical activity levels and cardiovascular risk biomarkers: Observational study of 12,602 users. J Med Internet Res. 2021;23:e21622. doi: 10.2196/21622 [DOI] [PMC free article] [PubMed] [Google Scholar]
- 11. Fox J, Weisberg S. Visualizing fit and lack of fit in complex regression models with predictor effect plots and partial residuals. J Stat Softw. 2018;87:1–27. doi: 10.18637/jss.v087.i09 [DOI] [Google Scholar]
- 12. Yates T, Haffner SM, Schulte PJ, Thomas L, Huffman KM, Bales CW, Califf RM, Holman RR, McMurray JJV, Bethel MA, et al. Association between change in daily ambulatory activity and cardiovascular events in people with impaired glucose tolerance (NAVIGATOR trial): A cohort analysis. Lancet. 2014;383:1059–1066. doi: 10.1016/S0140-6736(13)62061-9 [DOI] [PubMed] [Google Scholar]
- 13. Jefferis BJ, Parsons TJ, Sartini C, Ash S, Lennon LT, Papacosta O, Morris RW, Wannamethee SG, Lee I‐M, Whincup PH. Does total volume of physical activity matter more than pattern for onset of CVD? A prospective cohort study of older British men. Int J Cardiol. 2019;278:267–272. doi: 10.1016/j.ijcard.2018.12.024 [DOI] [PMC free article] [PubMed] [Google Scholar]
- 14. Ponsonby A‐L, Sun C, Ukoumunne OC, Pezic A, Venn A, Shaw JE, Dunstan DW, Barr ELM, Blair SN, Cochrane J, et al. Objectively measured physical activity and the subsequent risk of incident dysglycemia: The Australian diabetes, obesity and lifestyle study (AusDiab). Diabetes Care. 2011;34:1497–1502. doi: 10.2337/dc10-2386 [DOI] [PMC free article] [PubMed] [Google Scholar]
- 15. Bahls M, Leitzmann MF, Karch A, Teumer A, Dörr M, Felix SB, Meisinger C, Baumeister SE, Baurecht H. Physical activity, sedentary behavior and risk of coronary artery disease, myocardial infarction and ischemic stroke: A two‐sample Mendelian randomization study. Clin Res Cardiol Off J Ger Card Soc. 2021;110:1564–1573. doi: 10.2337/dc10-2386 [DOI] [PMC free article] [PubMed] [Google Scholar]
- 16. Zhuang Z, Gao M, Yang R, Li N, Liu Z, Cao W, Huang T. Association of physical activity, sedentary behaviours and sleep duration with cardiovascular diseases and lipid profiles: A Mendelian randomization analysis. Lipids Health Dis. 2020;19:86. doi: 10.1186/s12944-020-01257-z [DOI] [PMC free article] [PubMed] [Google Scholar]
- 17. van de Vegte YJ, Said MA, Rienstra M, van der Harst P, Verweij N. Genome‐wide association studies and Mendelian randomization analyses for leisure sedentary behaviours. Nat Commun. 2020;11:1770. doi: 10.1038/s41467-020-15553-w [DOI] [PMC free article] [PubMed] [Google Scholar]
- 18. Letnes JM, Berglund I, Johnson KE, Dalen H, Nes BM, Lydersen S, Viken H, Hassel E, Steinshamn S, Vesterbekkmo EK, Støylen A, Reitlo LS, Zisko N, Bækkerud FH, Tari AR, Ingebrigtsen JE, Sandbakk SB, Carlsen T, Anderssen SA, Singh MAF, Coombes JS, Helbostad JL, Rognmo Ø, Wisløff U, Stensvold D Effect of 5 years of exercise training on the cardiovascular risk profile of older adults: the generation 100 randomized trial. Eur Heart J 2021:ehab721, 43, 2065, 2075. DOI: 10.1093/eurheartj/ehab721 [DOI] [PMC free article] [PubMed] [Google Scholar]
- 19. Lightfoot JT, De Geus EJC, Booth FW, Bray MS, Den Hoed M, Kaprio J, Kelly SA, Pomp D, Saul MC, Thomis MA, et al. Biological/genetic regulation of physical activity level: Consensus from GenBioPAC. Med Sci Sports Exerc. 2018;50:863–873. doi: 10.1249/MSS.0000000000001499 [DOI] [PMC free article] [PubMed] [Google Scholar]
Associated Data
This section collects any data citations, data availability statements, or supplementary materials included in this article.
Supplementary Materials
Data S1. Data structure.
Tables S1‐S3.
Figures S1‐S3.