Abstract
Aims
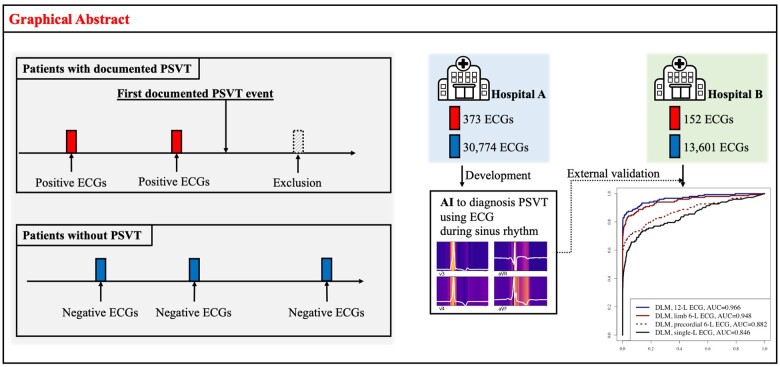
Paroxysmal supraventricular tachycardia (PSVT) is not detected owing to its paroxysmal nature, but it is associated with the risk of cardiovascular disease and worsens the patient quality of life. A deep learning model (DLM) was developed and validated to identify patients with PSVT during normal sinus rhythm in this multicentre retrospective study.
Methods and results
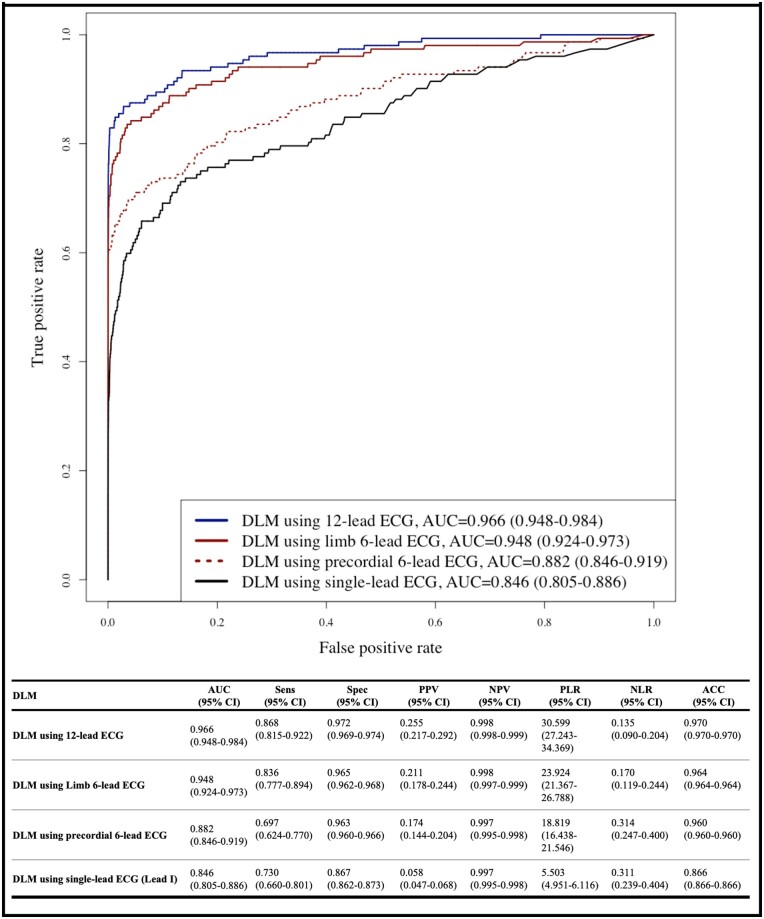
This study included 12 955 patients with normal sinus rhythm, confirmed by a cardiologist. A DLM was developed using 31 147 electrocardiograms (ECGs) of 9069 patients from one hospital. We conducted an accuracy test with 13 753 ECGs of 3886 patients from another hospital. The DLM was developed based on residual neural network. Digitally stored ECG were used as predictor variables and the outcome of the study was ability of the DLM to identify patients with PSVT using an ECG during sinus rhythm. We employed a sensitivity map method to identify an ECG region that had a significant effect on developing PSVT. During accuracy test, the area under the receiver operating characteristic curve of a DLM using a 12-lead ECG for identifying PSVT patients during sinus rhythm was 0.966 (0.948–0.984). The accuracy, sensitivity, specificity, positive predictive value, and negative predictive value of DLM were 0.970, 0.868, 0.972, 0.255, and 0.998, respectively. The DLM showed delta wave and QT interval were important to identify the PSVT.
Conclusion
The proposed DLM demonstrated a high performance in identifying PSVT during normal sinus rhythm. Thus, it can be used as a rapid, inexpensive, point-of-care means of identifying PSVT in patients.
Keywords: Tachycardia, Supraventricular, Deep learning, Electrocardiography, Artificial intelligence
Graphical Abstract
Introduction
Paroxysmal supraventricular tachycardia (PSVT) has an adverse effect on patient quality of life and worsens healthcare burden worldwide.1 Approximately 89 000 cases of PSVT are detected annually in the USA, and approximately 25% of all emergency department visits for PSVT result in hospitalization.2,3 As PSVT is a sporadic, sudden, and recurring event, it may restrict the activities of patients and disrupt their quality of life. Although PSVT is not a fatal arrhythmia, it increases the risk of cardiovascular diseases, such as ischaemic stroke, tachycardia-induced cardiomyopathy, and heart failure.4–6
Although PSVT can be resolved by ablation intervention, it is difficult to diagnose because of its paroxysmal nature. The PSVT is often delayed in diagnosis, and could be misdiagnosed as psychiatric disorders, such as panic attacks.7 As PSVT can only be detected during an on-going episode, existing screening methods using ambulatory electrocardiography (ECG) devices have limitations, such as high cost and low detection rate.8 If the PSVT can be screened during normal sinus rhythm, it will be very useful for PSVT diagnosis. However, it is impossible with current knowledge of ECG.
A low-cost, widely available, and non-invasive test for identifying patients likely to have PSVT can be very useful as diagnostic and therapeutic implications in real-world practice. Recently, deep learning has demonstrated high accuracy and applicability in computer vision, speech recognition, and signal processing tasks. Particularly, in the medical domain, deep learning has been applied to the diagnosis of heart failure, myocardial infarction, arrhythmia, valvular heart disease, coronary artery calcium score, and anaemia using ECG.9–15 Attia et al.16 showed that an artificial intelligence-enabled ECG acquired during normal sinus rhythm allows detection at the point-of-care of individuals with atrial fibrillation. Previous studies have shown that the structural and electrophysiological features of PSVT could be reflected by autonomic conditions effecting ECG.17 Thus, we hypothesized that we could develop artificial intelligence based on deep learning model (DLM), to identify patients with PSVT during normal sinus rhythm using these features. In this study, we developed and validated the DLM using a multicentre cohort of patients.
Methods
Study design and population
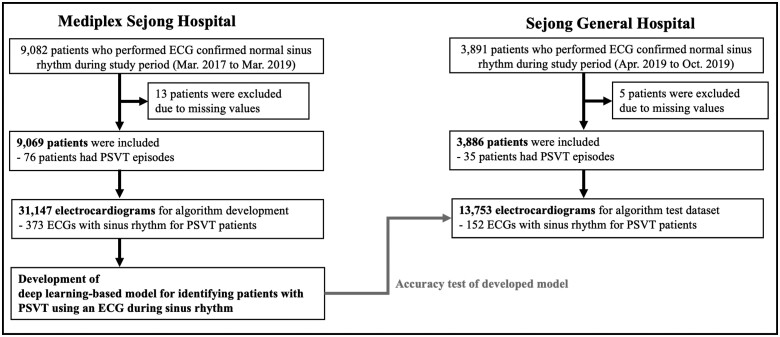
We conducted a multicentre retrospective diagnostic study in which a DLM was developed using ECGs and then externally validated. Data from the Mediplex Sejong Hospital (MSH) were used for the development. In MSH, we identified patients who underwent at least one standard digital, 10 s, 12-lead ECGs examination administered by cardiologists that confirmed normal sinus rhythm during the study period (1 March 2017 to 31 March 2019). The individuals who visited the general health checkup, outpatient, and emergency departments of MSH were included as study population for the development datasets. In the development process, we split the MSH data into training data (90%) and validation data (10%). The training data were used in the regression of each coefficient of DLM, and the validation data were used to confirm the loss in each epoch. Data from the Sejong General Hospital (SGH) were used for the external validation. We identified patients who were admitted to SGH during the study period (1 April 2019 to 31 October 2019) and who underwent at least one ECG examination administered by cardiologists that confirmed normal sinus rhythm during admission period (Figure 1). We excluded individuals with missing clinical data including ECG information.
Figure 1.
Study flowchart. ECG, electrocardiography; PSVT, paroxysmal supraventricular tachycardia.
This study was approved by the institutional review boards of MSH (2019-083) and SGH (2019-0411). Clinical data, including digitally stored ECGs, admission note, progression note, and epidemiology data, were obtained from both the hospitals. Both institutional review boards waived the need for informed consent because of the retrospective nature of the study, which used fully anonymized ECG and health data and caused minimal harm.
In this study, we defined PSVT as atrioventricular nodal re-entrant tachycardia (AVNRT) and atrioventricular re-entrant tachycardia (AVRT). As pathophysiology and clinical management are different, we did not define atrial fibrillation, atrial flutter, and multifocal atrial tachycardia as PSVT in this study. Three cardiologists confirmed the label blindly. As the cardiologist used ECGs and all medical records, including electrophysiology tests and medical records before and after medication, there were only six disagreement cases in this study population. Three cardiologists with six disagreement cases decided the final label by a majority vote. We classified the patients into two groups: patients with PSVT, who had at least one ECG showing PSVT documented at MSH or SGH, and patients without PSVT, who had no ECGs showing PSVT and additionally had no evidence to PSVT in their medical records, such as progression notes. In the patients with PSVT, we defined the time of the first recording of the ECG showing PSVT as event time and labelled the ECG with sinus rhythm recorded before the event time as ‘positive ECG’. In other words, we did not use ECGs following an event time ECG showing PSVT in this study. We defined the ECG from patients without PSVT as ‘negative ECG’. We only used ECG confirming normal sinus rhythm by cardiologists to develop and validate the DLM.
Procedures
ECG data were used as predictor variables. A digitally stored 12-lead Sejong ECG dataset, consisting of 5000 numbers for each lead, was recorded over 10 s (500 Hz). We removed segments of length 1 s at the beginning and end of each ECG signal because these regions had more artefacts than the others. We also used partial datasets from 12-lead ECG data, such as limb 6-, precordial 6-, and single-lead (I) ECG data. We selected these sets of leads because they could easily be recorded by wearable and life-style devices in contact with hands and legs. Consequently, datasets of two-dimensional data consisting of 12 × 4000, 6 × 4000, 6 × 4000, and 1 × 4000 values, respectively, were used for developing and validating the DLM using 12-, limb 6-, precordial 6-, and single-lead ECGs.
This study aimed to identify patients with PSVT by using the proposed DLM on ECGs with normal sinus rhythm. In other words, the outcome of this study is the ability to classify positive and negative ECGs.
Figure 2 shows the process of developing a DLM using residual networks. The DLM was developed using 8 residual blocks of a neural network.18 In a residual block, convolution layers and batch normalization layers were repeated. The last layer of the 8th residual block was connected to a flattened layer, which was fully connected to a one-dimensional (1D) layer composed of neural nodes. The second fully connected 1D layer was connected to the output node, which was composed of two sub-nodes. The value of the output nodes of the DLM represented the probability of obtaining positive ECG. The output node of the DLM used a softmax function as an activation function because the output of the softmax function ranges from 0 and 1.
Figure 2.
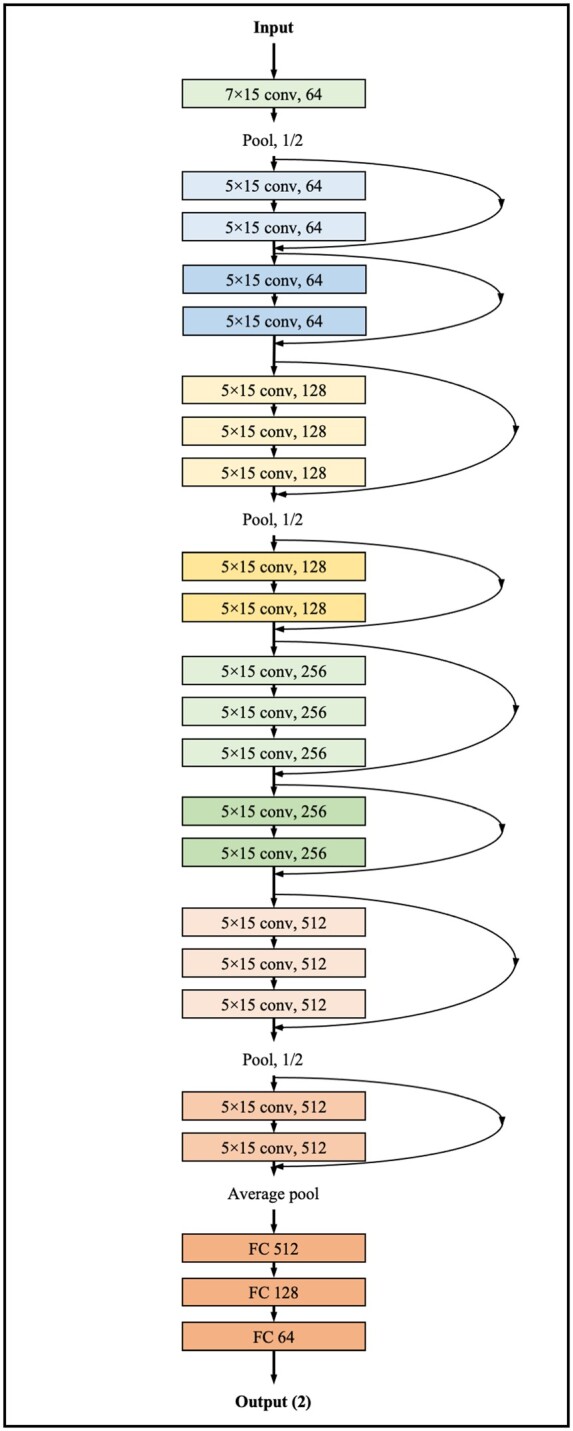
Architecture of DLM to diagnose PSVT using sinus rhythm ECG. Conv, convolutional neural network layer; DLM, deep learning-based model; ECG, electrocardiography; FC, fully connected layer; PSVT, paroxysmal supraventricular tachycardia.
Statistical analysis
Continuous variables were expressed as mean values (standard deviation) and compared using the unpaired Student’s t-test or Mann–Whitney U-test. Categorical variables were expressed as frequencies and percentages and compared using the χ2 test.
At each input (ECG) of test data, the DLM calculated the probability of a positive ECG in the range from 0 (non-PSVT) to 1 (PSVT). To confirm the DLM performance, we compared the probability calculated by the DLM with the ground truth for positive and negative ECGs in the test datasets. For this purpose, we used the area under the receiver operating characteristic curve (AUC). We applied the cut-off point to the test dataset to calculate sensitivity, specificity, positive predictive value (PPV), negative predictive value (NPV), positive likelihood ratio (PLR), negative likelihood ratio (NLR), and accuracy. The sensitivity, specificity, PPV, NPV, PLR, NLR, and accuracy were confirmed at the operating point from Youden’s J statistic in the development dataset.19
We hypothesized that the ECGs with high probability of DLM develop PSVT early. We carried out Kaplan–Meier method to analyse the PSVT development over 2 years by risk group. The ECGs of test dataset were categorized into high-, moderate-, and low-risk group based on the probability of DLM using cut-off values, which were determined using cut-off of top 1% and 3% prediction score from development dataset. As the purpose of DLM was screening, we selected a cut-off of moderated risk (3%) at the point of 90% sensitivity in the development dataset. We defined the high-risk group as those with more than half the risk among PSVT patients, and the cut-off corresponding to 50% of all PSVT patients in the development dataset correlated with 1% of the total population in the development dataset.
The confidence intervals for the AUC were determined based on the Sun and Su optimization of the DeLong method using the pROC package in R (The R Foundation for Statistical Computing, Vienna, Austria). A significant difference in patient characteristics was defined as a two-sided P-value of <0.001. Statistical analyses were performed using pROC package of R software, version 3.4.2. In addition, we used PyTorch’s and Scikit-learn’s open-source software libraries at the backend and Python (version 3.6.11) for the analyses.
Visualizing the developed DLM for interpretation
It is necessary to identify an ECG region having a significant effect on the decision of the developed DLM and compare with existing medical knowledge of PSVT. We employed a sensitivity map based on a saliency method.20,21 The map was computed using the first-order gradients of the classifier probabilities with respect to the input signals; if the probability of a classifier is sensitive to a specific region of the signal, the region would be considered significant in the model. We used a gradient class activation map (Grad-CAM) as a sensitivity map with the gradient backpropagation method.20,21 Using this method, we could identify the ECG region used for predicting the development of PSVT and could draw a comparison with the medical knowledge in previous studies of PSVT. We verified the variable importance values of ECG and epidemiology features in deep learning, random forest, and logistic regression using the relative importance based on Garson’s algorithm, mean decreased Gini, and deviance difference, respectively.22
Results
The eligible population included 9082 and 3891 patients at MSH and SGH, respectively. We excluded 13 and 5 patients (from MSH and SGH, respectively) because of missing clinical data including ECG data (Figure 1). The study included 12 955 patients, of whom 111 experienced a PSVT event. The number of AVNRT and AVRT was 58 and 53, respectively. The DLM was developed using a development dataset of 31 147 12-lead ECGs for 9069 patients from MSH. Then, the performance of the algorithm was confirmed using 13 753 ECGs for 3886 patients in the test dataset from SGH. The characteristics of the patients and ECGs were also different between patients with and without PSVT, as shown in Table 1. In patients who had PSVT episodes, the ECGs during normal sinus rhythm had tachycardia (Table 1). As shown in Table 1, the rate of delta waves and QTc was 7.2% and 447.61ms in PSVT patients, which was significantly higher than that in non-PSVT patients.
Table 1.
Baseline characteristics
| Characteristics | Patients without PSVT (n = 12 844) | Patients with PSVT (n = 111) | P-value |
|---|---|---|---|
| Age (years), mean (SD) | 57.90 (17.11) | 55.23 (18.77) | 0.103 |
| Male, n (%) | 6551 (51.0) | 53 (47.7) | 0.556 |
| Heart rate (b.p.m.), mean (SD) | 71.24 (18.32) | 82.91 (21.50) | <0.001 |
| PR interval (ms), mean (SD) | 170.34 (34.15) | 168.18 (41.12) | 0.510 |
| QRS duration (ms), mean (SD) | 101.67 (19.88) | 98.31 (18.87) | 0.076 |
| QT interval (ms), mean (SD) | 409.15 (47.39) | 388.16 (44.95) | <0.001 |
| QTc (ms), mean (SD) | 437.53 (38.49) | 447.61 (40.47) | 0.006 |
| P-wave axis (°), mean (SD) | 43.10 (32.70) | 46.09 (35.78) | 0.337 |
| R-wave axis (°), mean (SD) | 37.36 (42.75) | 38.33 (48.60) | 0.812 |
| T-wave axis (°), mean (SD) | 45.84 (45.11) | 38.72 (37.65) | 0.099 |
| Left bundle branch block, n (%) | 181 (1.4%) | 1 (0.9%) | 0.962 |
| Right bundle branch block, n (%) | 557 (4.3%) | 9 (8.1%) | 0.089 |
| Delta wave, n (%) | 13 (0.1%) | 8 (7.2%) | <0.001 |
| QT prolongation, n (%) | 1889 (14.7) | 18 (16.2) | 0.755 |
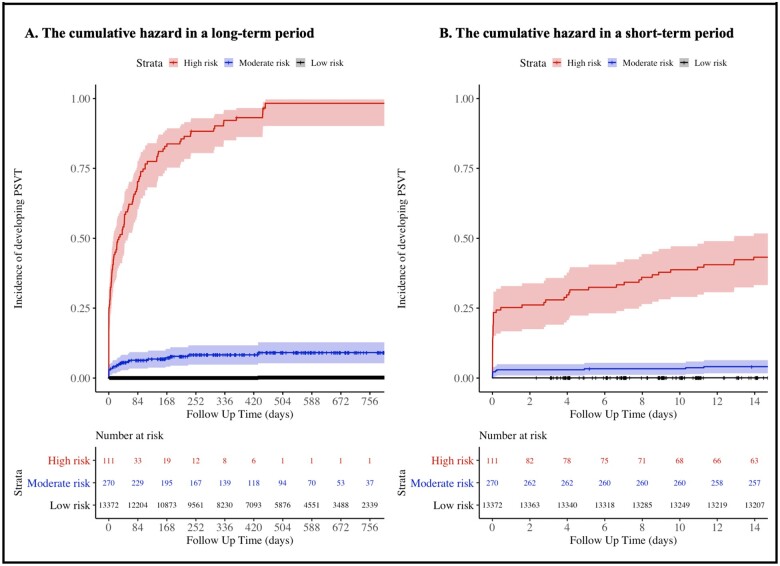
During the accuracy test, the AUCs of the DLM using 12-, limb 6-, precordial 6-, and single-lead ECGs for identifying positive ECG were 0.966 (0.948–0.984) 0.948 (0.924–0.973), 0.882 (0.846–0.919), and 0.846 (0.805–0.886), respectively (Figure 3). As shown in Figure 4, high prediction score of DLM for predicting PSVT was correlated with early development of PSVT. High risk group of DLM exhibited a significantly higher hazard development rate of PSVT than those of the moderate and low-risk group. For 14 days, development rate of PSVT in high, moderate, and low-risk group was 43.2%, 4.1%, and 0.1% respectively.
Figure 3.
Performance of DLM to diagnose PSVT using sinus rhythm ECG. ACC, accuracy; AUC, area under the receiver operating characteristic curve; CI, confidence interval; DLM, deep learning-based model; ECG, electrocardiography; NLR, negative likelihood ratio; NPV, negative predictive value; PLR, positive likelihood ratio; PPV, positive predictive value; PSVT, paroxysmal supraventricular tachycardia; Sens, sensitivity; Spec, specificity.
Figure 4.
Cumulative hazard of developing PSVT by risk group of DLM. (A) This figure shows the cumulative hazard of developing PSVT by risk group of DLM in a long-term period of over 2 years. (B) This figure shows the cumulative hazard of developing PSVT by risk group of DLM in a short-term period of 2 weeks. DLM, deep learning-based model; PSVT, paroxysmal supraventricular tachycardia.
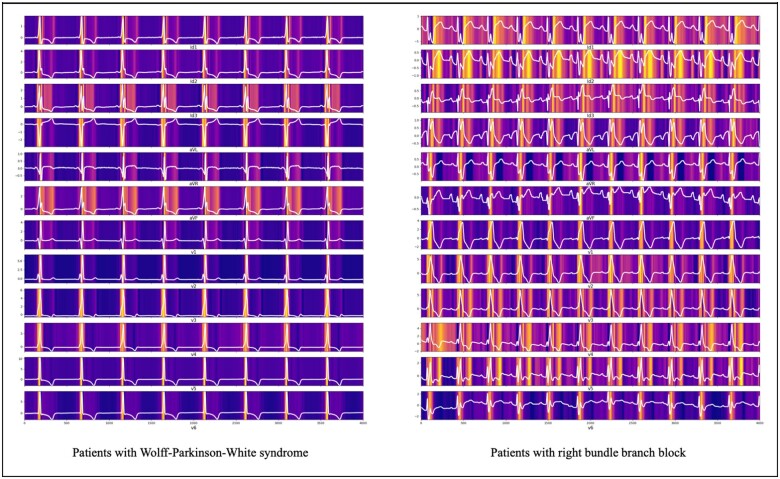
The DLM indicated the ECG region important to predict the development of PSVT. In ECG of a patient with Wolff–Parkinson–White (WPW) syndrome, the DLM focused on the delta wave for predicting PSVT, as shown in Figure 5. In another patient, the DLM focused on the QT interval for predicting PSVT, as shown in Figure 5. As shown in Table 2, the variable importance differed for each prediction model. The logistic regression used heart rate and right bundle branch block, while the DLM used the QT interval as an importance predictive variable.
Figure 5.
Sensitivity map of DLM for identifying PSVT using sinus rhythm ECG. DLM, deep learning based model; ECG, electrocardiography; PSVT, paroxysmal supraventricular tachycardia.
Table 2.
Variable importance for identifying PSVT using sinus rhythm ECG
| Rank | Logistic regression (defiance difference) | Random forest (mean decrease Gini) | Deep learning (relative importance) |
|---|---|---|---|
| 1 | Heart rate (−8.51) | R-wave axis (29.09) | QT interval (0.272) |
| 2 | RBBB (−6.35) | PR interval (28.12) | PR interval (0.139) |
| 3 | QRS duration (−4.89) | P-wave axis (27.24) | QRS duration (0.099) |
| 4 | PR interval (−2.01) | T-wave axis (26.97) | Heart rate (0.093) |
| 5 | T-wave axis (−0.92) | QT interval (26.24) | P-wave axis (0.072) |
| 6 | Sex (−0.44) | Age (25.74) | T-wave axis (0.071) |
| 7 | QT interval (−0.33) | QRS duration (24.11) | R-wave axis (0.059) |
| 8 | LBBB (−0.29) | Heart rate (23.47) | LBBB (0.057) |
| 9 | P-wave axis (−0.22) | Sex (5.24) | Age (0.055) |
| 10 | R-wave axis (−0.19) | RBBB (1.36) | RBBB (0.043) |
| 11 | Age (−0.10) | LBBB (0.23) | Sex (0.041) |
Discussion
In this study, we developed and validated a DLM for identifying patients with PSVT using 12-, limb 6-, precordial 6-, and single-lead ECGs, which showed a reasonable performance. In addition, we showed the ECG region that had a significant effect on the development of PSVT using the DLM. To the best of our knowledge, this study is the first to develop an artificial intelligence algorithm for identifying patients with PSVT during normal sinus rhythm and to show the interpretable patterns of decision-making using sensitivity map in the biosignal domain.
The cornerstone of management of PSVT is diagnosis. Although PSVT has several treatment options based on its severity, patients are frequently not treated because they are not diagnosed. The most important obstacle in the diagnosis of PSVT is its paroxysmal nature.23 When patients with episodic symptoms arrived at the emergency department, the symptoms had disappeared, and the ECG was normal in several cases. In patients with PSVT, the ECG during sinus rhythm has little diagnostic value. In cases of AVRT, which is characterized by an extranodal accessory pathway connecting the atrium and ventricle, we often find delta waves during sinus rhythm if there is antegrade conduction via the accessory pathway and it could be a clue to diagnose PSVT. However, other types of PSVT, such as AVNRT, have no abnormal finding during normal sinus rhythm. Although an ambulatory ECG test has a chance to diagnose PSVT, PSVT cannot be detected if it does not occur during the test. In current clinical process, the physicians administered the ambulatory ECG test only to the patients whose symptoms were correlated with PSVT. However, the patients’ symptoms are subjective, and the ability of physicians to detect the possibility of PSVT from patient history varies by their experience. Hence, the current strategy of suspecting PSVT and administering tests for PSVT based on only history taking has limitations. Consequently, several PSVT patients are underdiagnosed or misdiagnosed with psychiatric disorders, such as panic attacks.
The purpose of this model is not a confirmative test of PSVT, but rather a screening of high-risk patients. With robust sensitivity and NPV, DLM could be used to screen patients who need repeated Holter tests or 30-day event monitoring owing to their high probability of PSVT. DLM could support clinicians in selecting high-risk patients by the risk score from DLM. As the Holter tests and 30-day event monitoring are expensive to repeat, this risk stratification of DLM associated with a high risk for PSVT and selection of patients who require repeated tests can help to increase the diagnostic rate of PSVT. The DLM could not only identify patients with the risk of developing PSVT but also predict the time of PSVT onset based on the prediction score. Using this methodology, a doctor can administer an ambulatory ECG test at the optimal time. Patients can assess their risk of developing PSVT by themselves and can modify the risk factor based on the prediction score, such as by avoiding caffeine and exercise.
In this study, we defined the ECG region during normal sinus rhythm that correlated with PSVT. As shown in Figure 5, the delta wave of the WPW syndrome was highly correlated with PSVT, which is consistent with existing medical knowledge. The sensitivity map showed that QT interval was highly correlated with the development of PSVT and the value of QT interval were more important than other variables in DLM. Nigro et al.17 described that AVNRT episodes are preceded by increase in adrenergic drive. Magnano et al.24 demonstrated that autonomic conditions directly affect the ventricular myocardium of healthy subjects, causing differences in QT that are independent of heart rate. Although no study has investigated the direct correlation between QT interval and PSVT, the conduction system in patients with PSVT could be delayed or altered due to changes of autonomic condition. Further investigation is required to confirm this finding. An important aspect of deep learning is experimentation, not from medical knowledge, but from data themselves. In most medical studies, the starting point of research is the researcher’s hypothesis. Consequently, the research subjects are limited by human ideas and prejudice. However, a deep learning methodology only uses data and is a better method for extracting findings from data, compared with human thinking. This methodology could be helpful for researchers to find their research subjects and gain intuition.
In recent studies, DLM could diagnose heart failure, valvular heart disease, electrolyte imbalance, anaemia, myocardial infarction, arrhythmia, left ventricular hypertrophy, and pulmonary hypertension and could even determine age and sex using ECG.9,10,12,13,25–29 Conventional statistical methods cannot be used with diverse types of data, such as images and waveforms, and cannot extract features from non-linear correlation. The most important aspect of deep learning is its ability to extract features with non-linear correlation and use various types of data. Owing to the increasing availability of the computing power required to build and use DLMs in hospitals and daily life, DLMs can be used in daily life in the near future.
This study has several limitations. First, we validated the proposed DLM using retrospective data; therefore, we need to validate it with prospective studies and daily data. Studies related to the clinical significance of the new technology are required to be applied in clinical practice. In our next study, we will verify the performance and significance of the proposed model through a prospective study in daily clinical practice. Second, this study was conducted only in two hospitals in Korea, and it is necessary to validate the proposed model on patients in other countries. Lastly, normal control group are those who did not develop PSVT during the study period, but this cannot completely rule out PSVT. This study showed the correlation between the prediction score and the time until PSVT onset. However, this analysis assumes that no episodes of supraventricular tachycardia occurred other than the event time ECG. Therefore, further studies are required to confirm this finding using continuous long-term ECG monitoring.
Acknowledgements
This research was results of a study on the ‘AI voucher’ Project, supported by the ‘Ministry of Science and ICT and National IT Industry Promotion Agency of South Korea.
Funding
This work was supported by the National Research Foundation of Korea (NRF) grant funded by the Korea government (MSIT) (2020R1F1A1073791).
Conflict of interest: J.-M.K. and J.P. are co-founder and Y.-Y.J., Y.-H.C., J.-H.S., Y.-J.L., and M.-S.J. are researchers of Medical AI Co., a medical artificial intelligence company. J.-M.K. and J.-H.B. are researchers of Body friend Co. There are no products in development or marketed products to declare. This does not alter our adherence to this journal. All other authors have declared no conflict of interest.
Data availability
The data underlying this article will be shared on reasonable request to the corresponding author.
References
- 1. Khurshid S, Choi SH, Weng L-C, Wang EY, Trinquart L, Benjamin EJ, Ellinor PT, Lubitz SA.. Frequency of cardiac rhythm abnormalities in a half million adults. Circ Arrhythmia Electrophysiol 2018;11:e006273. [DOI] [PMC free article] [PubMed] [Google Scholar]
- 2. Orejarena LA, Vidaillet H, DeStefano F, Nordstrom DL, Vierkant RA, Smith PN, Hayes JJ.. Paroxysmal supraventricular tachycardia in the general population. J Am Coll Cardiol 1998;31:150–157. [DOI] [PubMed] [Google Scholar]
- 3. Murman DH, McDonald AJ, Pelletier AJ, Camargo CA.. U.S. emergency department visits for supraventricular tachycardia, 1993-2003. Acad Emerg Med 2007;14:578–581. [DOI] [PubMed] [Google Scholar]
- 4. Kamel H, Elkind MSV, Bhave PD, Navi BB, Okin PM, Iadecola C, Devereux RB, Fink ME.. Paroxysmal supraventricular tachycardia and the risk of ischemic stroke. Stroke 2013;44:1550–1554. [DOI] [PMC free article] [PubMed] [Google Scholar]
- 5. Houmsse M, Tyler J, Kalbfleisch S.. Supraventricular tachycardia causing heart failure. Curr Opin Cardiol 2011;26:261–269. [DOI] [PubMed] [Google Scholar]
- 6. Matsuo S, Yamane T, Hioki M, Narui R, Ito K, Tokuda M, Yamashita S, Yoshida H, Date T, Sugimoto K, Yoshimura M.. Acute progression of congestive heart failure during paroxysmal supraventricular tachycardia in a patient without structural heart disease. J Cardiol Cases 2010;1:e133–e136. [DOI] [PMC free article] [PubMed] [Google Scholar]
- 7. Lessmeier TJ. Unrecognized paroxysmal supraventricular tachycardia. Arch Intern Med 1997;157:537. [PubMed] [Google Scholar]
- 8. Barrett PM, Komatireddy R, Haaser S, Topol S, Sheard J, Encinas J, Fought AJ, Topol EJ.. Comparison of 24-hour holter monitoring with 14-day novel adhesive patch electrocardiographic monitoring. Am J Med 2014;127:95.e11–95.e17. [DOI] [PMC free article] [PubMed] [Google Scholar]
- 9. Attia ZI, Kapa S, Lopez-Jimenez F, McKie PM, Ladewig DJ, Satam G, Pellikka PA, Enriquez-Sarano M, Noseworthy PA, Munger TM, Asirvatham SJ, Scott CG, Carter RE, Friedman PA.. Screening for cardiac contractile dysfunction using an artificial intelligence-enabled electrocardiogram. Nat Med 2019;25:70–74. [DOI] [PubMed] [Google Scholar]
- 10. Cho Y, Kwon J-M, Kim K-H, Medina-Inojosa JR, Jeon K-H, Cho S, Lee SY, Park J, Oh B-H.. Artificial intelligence algorithm for detecting myocardial infarction using six-lead electrocardiography. Sci Rep 2020;10:20495. [DOI] [PMC free article] [PubMed] [Google Scholar]
- 11. Hannun AY, Rajpurkar P, Haghpanahi M, Tison GH, Bourn C, Turakhia MP, Ng AY.. Cardiologist-level arrhythmia detection and classification in ambulatory electrocardiograms using a deep neural network. Nat Med 2019;25:65–69. [DOI] [PMC free article] [PubMed] [Google Scholar]
- 12. Kwon J-M, Kim KH, Medina-Inojosa J, Jeon KH, Park J, Oh BH.. Artificial intelligence for early prediction of pulmonary hypertension using electrocardiography. J Heart Lung Transplant 2020;39:805–814. [DOI] [PubMed] [Google Scholar]
- 13. Kwon JM, Cho Y, Jeon KH, Cho S, Kim KH, Baek SD, Jeung S, Park J, Oh BH.. A deep learning algorithm to detect anaemia with ECGs: a retrospective, multicentre study. Lancet Digit Health 2020;2:e358–e367. [DOI] [PubMed] [Google Scholar]
- 14. Farjo PD, Yanamala N, Kagiyama N, Patel HB, Casaclang-Verzosa G, Nezarat N, Budoff MJ, Sengupta PP.. Prediction of coronary artery calcium scoring from surface electrocardiogram in atherosclerotic cardiovascular disease: a pilot study. Eur Heart J Digit Health 2020;1:51–61. [DOI] [PMC free article] [PubMed] [Google Scholar]
- 15. Kwon J, Kim K-H, Eisen HJ, Cho Y, Jeon K-H, Lee SY, Park J, Oh B-H.. Artificial intelligence assessment for early detection of heart failure with preserved ejection fraction based on electrocardiographic features. Eur Heart J Digit Health 2021;1:106–116. [DOI] [PMC free article] [PubMed] [Google Scholar]
- 16. Attia ZI, Noseworthy PA, Lopez-Jimenez F, Asirvatham SJ, Deshmukh AJ, Gersh BJ, Carter RE, Yao X, Rabinstein AA, Erickson BJ, Kapa S, Friedman PA.. An artificial intelligence-enabled ECG algorithm for the identification of patients with atrial fibrillation during sinus rhythm: a retrospective analysis of outcome prediction. Lancet 2019;394:861–867. [DOI] [PubMed] [Google Scholar]
- 17. Nigro G, Russo V, de Chiara A, Rago A, Cioppa N Della, Chianese R, Manfredi D, Calabrò R.. Autonomic nervous system modulation before the onset of sustained atrioventricular nodal reentry tachycardia. Ann Noninvasive Electrocardiol 2010;15:49–55. [DOI] [PMC free article] [PubMed] [Google Scholar]
- 18. LeCun Y, Bengio Y, Hinton G.. Deep learning. Nature 2015;521:436–444. [DOI] [PubMed] [Google Scholar]
- 19. Schisterman EF, Perkins NJ, Liu A, Bondell H.. Optimal cut-point and its corresponding Youden index to discriminate individuals using pooled blood samples. Epidemiology 2005;16:73–81. [DOI] [PubMed] [Google Scholar]
- 20. Selvaraju RR, Cogswell M, Das A, Vedantam R, Parikh D, Batra D. Grad-CAM: visual explanations from deep networks via gradient-based localization. In: Proceedings of the IEEE International Conference on Computer Vision2017. IEEE, pp. 618–626.
- 21. Selvaraju RR, Cogswell M, Das A, Vedantam R, Parikh D, Batra D.. Grad-CAM: visual explanations from deep networks via gradient-based localization. Int J Comput Vis 2020;128:336–359. [Google Scholar]
- 22. Zhang Z, Beck MW, Winkler DA, Huang B, Sibanda W, Goyal H.. Opening the black box of neural networks: methods for interpreting neural network models in clinical applications. Ann Transl Med 2018;6:216–216. [DOI] [PMC free article] [PubMed] [Google Scholar]
- 23. Go AS,, Hlatky MA, Liu TI, Fan D, Garcia EA,, Sung SH, Solomon MD.. Contemporary burden and correlates of symptomatic paroxysmal supraventricular tachycardia. J Am Heart Assoc 2018;7:e008759. [DOI] [PMC free article] [PubMed] [Google Scholar]
- 24. Magnano AR, Holleran S, Ramakrishnan R, Reiffel JA, Bloomfield DM.. Autonomic nervous system influences on QT interval in normal subjects. J Am Coll Cardiol 2002;39:1820–1826. [DOI] [PubMed] [Google Scholar]
- 25. Kwon J, Lee SY, Jeon K, Lee Y, Kim K, Park J, Oh B, Lee M.. Deep learning-based algorithm for detecting aortic stenosis using electrocardiography. J Am Heart Assoc 2020;9:e014717. [DOI] [PMC free article] [PubMed] [Google Scholar]
- 26. Kwon J, Kim K-H, Akkus Z, Jeon K-H, Park J, Oh B-H.. Artificial intelligence for detecting mitral regurgitation using electrocardiography. J Electrocardiol 2020;59:151–157. [DOI] [PubMed] [Google Scholar]
- 27. Galloway CD, Valys A V., Shreibati JB, Treiman DL, Petterson FL, Gundotra VP, Albert DE, Attia ZI, Carter RE, Asirvatham SJ, Ackerman MJ, Noseworthy PA, Dillon JJ, Friedman PA.. Development and validation of a deep-learning model to screen for hyperkalemia from the electrocardiogram. JAMA Cardiol 2019;4:428. [DOI] [PMC free article] [PubMed] [Google Scholar]
- 28. Jo Y-Y, Cho Y, Lee SY, Kwon J, Kim K-H, Jeon K-H, Cho S, Park J, Oh B-H.. Explainable artificial intelligence to detect atrial fibrillation using electrocardiogram. Int J Cardiol 2021;328:104–110. [DOI] [PubMed] [Google Scholar]
- 29. Attia ZI, Friedman PA, Noseworthy PA, Lopez-Jimenez F, Ladewig DJ, Satam G, Pellikka PA, Munger TM, Asirvatham SJ, Scott CG, Carter RE, Kapa S.. Age and sex estimation using artificial intelligence from standard 12-lead ECGs. Circ Arrhythmia Electrophysiol 2019;12:e007284. [DOI] [PMC free article] [PubMed] [Google Scholar]
Associated Data
This section collects any data citations, data availability statements, or supplementary materials included in this article.
Data Availability Statement
The data underlying this article will be shared on reasonable request to the corresponding author.


