Abstract
Candida albicans WO-1 switches reversibly and at high frequency between a white and an opaque colony-forming phenotype that includes dramatic changes in cell morphology and physiology. A misexpression strategy has been used to investigate the role of the opaque-phase-specific gene PEP1 (SAP1), which encodes a secreted aspartyl proteinase, in the expression of the unique opaque-phase phenotype and phase-specific virulence in two animal models. The PEP1 (SAP1) open reading frame was inserted downstream of the promoter of the white-phase-specific gene WH11 in the transforming vector pCPW7, and the resulting transformants were demonstrated to misexpress PEP1 (SAP1) in the white phase. Misexpression did not confer any of the unique morphological characteristics of the opaque phase to cells in the white phase and had no effect on the switching process. However, misexpression conferred upon white-phase cells the increased capacity of opaque-phase cells to grow in medium in which protein was the sole nitrogen source. Misexpression of PEP1 (SAP1) had no effect on the virulence of white-phase cells in a systemic mouse model, in which white-phase cells were already more virulent than opaque-phase cells. Misexpression did, however, confer upon white-phase cells the dramatic increase in colonization of skin in a cutaneous mouse model that was exhibited by opaque-phase cells. Misexpression of PEP1 (SAP1) conferred upon white-phase cells two dissociable opaque-phase characteristics: increased adhesion and the capacity to cavitate skin. The addition of pepstatin A to the cutaneous model inhibited the latter, but not the former, suggesting that the latter is effected by released enzyme, while the former is effected by cell-associated enzyme.
Most strains of the infectious yeast Candida albicans are capable of switching at extremely high frequencies between two or more general phenotypes that are distinguishable by different colony morphologies (30). The switching process regulates the expression of a number of phase-specific genes, including PEP1 (SAP1) (8, 17, 18, 42), SAP3 (9, 42), OP4 (18, 19), CDR3 (4), CDR4 (25), NIK1 (38), WH11 (33), and EFG1 (7a, 33a). High-frequency phenotypic switching has also been demonstrated to regulate a number of phenotypic characteristics that have been implicated in pathogenesis, including antigenicity (2, 3), sensitivity to neutrophils and oxidants (12), adhesion and cohesion (11, 40), susceptibility to common antifungal agents (40a), and constraints on the bud-hypha transition (1). For these reasons, it has been suggested that phenotypic switching represents a pathogenic strategy for the combinatorial expression of batteries of genes leading to a variety of pathogenic states (19, 20, 30–32).
The white-opaque transition in C. albicans WO-1 (28) has served as an experimental model for investigating the role of switching in pathogenesis. Although this switching system occurs in a minority of C. albicans strains, it exhibits all of the characteristics of the more predominant switching repertoires of this species (30), including regulation of the same phase-specific genes (19). Cells of strain WO-1 switch at frequencies of approximately 10−3 between a white and opaque colony phenotype that involves a radical change in just about every aspect of cellular morphology (2, 3, 23, 28, 29). The white-opaque transition involves the activation of white-phase-specific genes in the white phase (33) and opaque-phase-specific genes in the opaque phase (17, 18). Gene activation in both cases is effected through cis-acting activation sequences that have been functionally identified in the promoters of the white-phase-specific gene WH11 (34, 37) and the opaque-phase-specific gene OP4 (15).
In order to assess the role of a phase-specific gene in the genesis of the respective phase-specific phenotype and in pathogenesis, we have adopted the strategy of misexpressing phase-specific genes in the alternate phase (13). This strategy tests whether a single gene expressed in one phase can confer one or more phenotypic characteristics to cells in an alternate phase. The white-opaque transition is especially effective in pursuing this strategy for two reasons. First, the morphological, ultrastructural, and physiological differences between white-phase and opaque-phase cells are so numerous and dramatic (3, 28–30) that the impact of misexpression is easily assessable at the cellular level. Second, and, perhaps, most important, white- and opaque-phase cells exhibit reversed orders of virulence in two animal models. In a mouse tail-injection model for systemic infections, white-phase cells have been demonstrated to be far more virulent than opaque-phase cells (13), while in a baby mouse cutaneous model, opaque-phase cells have been demonstrated to be far more virulent than white-phase cells (see reference 39 and data presented here). In a recent application of the misexpression strategy, it was demonstrated that misexpression of WH11 in the opaque phase led to a 330-fold increase in the frequency of switching in the opaque-to-white direction (13). Misexpression of WH11 also conferred upon opaque-phase cells the increased level of virulence exhibited by white-phase cells in the systemic mouse model (13).
In this study, we have taken advantage of the dramatic differences in cellular phenotype and virulence in the two animal models to test the effects of misexpression of the opaque-phase-specific gene PEP1 (SAP1) in the white phase. We demonstrate that although misexpression of PEP1 (SAP1) does not confer upon white-phase cells any of the unique morphological features of opaque-phase cells, it does confer upon them the capacity to utilize proteins as a nitrogen source. In addition, misexpression of PEP1 (SAP1) confers upon white-phase cells the opaque-phase characteristic of increased skin colonization in a cutaneous mouse model. Using pepstatin A to inhibit extracellular proteinase activity, we further demonstrate that PEP1 (SAP1) plays two roles in skin colonization: a cellular one that leads to increased adhesion and an extracellular one that leads to tissue penetration.
MATERIALS AND METHODS
Strain maintenance and culture conditions.
All strains were maintained in glycerol and stored at −70°C. To initiate growth, cells from a glycerol stock culture were streaked on agar slants or plates containing Lee's medium (14) supplemented with zinc and arginine (5). In the case of the ade2 derivative of strain WO-1, 0.6 μM adenine sulfate was also included. For the analysis of growth and/or proteinase secretion, cells were grown in liquid cultures containing supplemented Lee's medium, YPD medium (1% yeast extract, 2% Bacto Peptone, 2% dextrose) or YCB/BSA medium (1.17% yeast carbon base [YCB], 1.2% bovine serum albumin [BSA] [pH 5.1]). In all cases, growth was performed at 25°C, and the proportions of white- and opaque-phase cells were assessed microscopically at the beginning and end of growth. Yeast extract, Bacto Peptone, and YCB were purchased from Difco Laboratories, Detroit, Mich. BSA was purchased from Sigma Chemical, St. Louis, Mo.
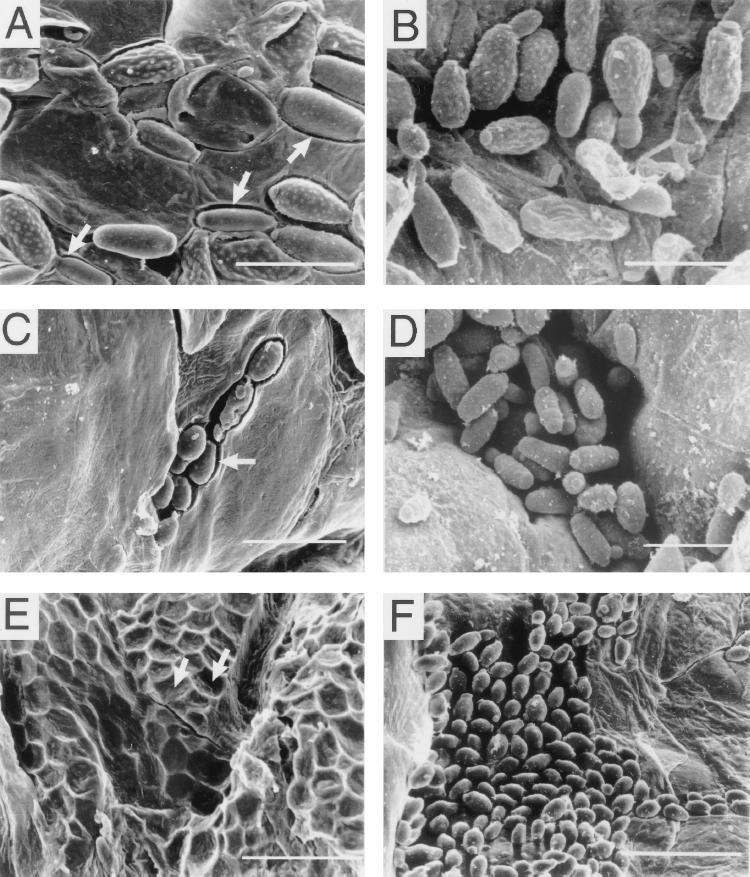
Construction of the misexpression plasmid and transformation.
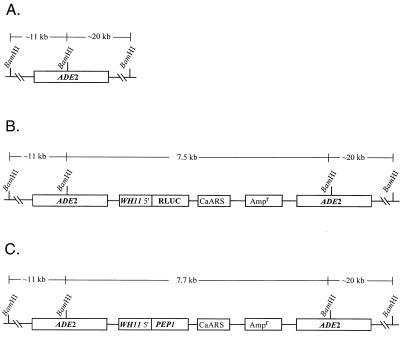
The primers PEP (5′-AACTGCAGATGTTTTTAAAGAATATTTTC-3′) and PEX (5′-TTCTCGAGCTAGTAAGAGCAGCA-3′) with engineered PstI and XhoI sites, respectively, were used to amplify the PEP1 (SAP1) open reading frame (ORF) (17) from a WO-1 genomic DNA template. The PCR product was digested with PstI and XhoI, phenol-chloroform extracted, and precipitated. The vector DNA pCRW5 (Fig. 1B) was digested with PstI and XhoI to release the RLUC ORF, and the resulting digested plasmid was ligated with the purified PEP1 (SAP1) ORF to generate pCPW7 (Fig. 1C). Both the orientation and fusion junctions were verified by sequencing the recombinant clone in both directions (6). Strain Red 3/6 was transformed with 20 μg of BamHI-linearized pCPW7 by using the lithium acetate protocol (27) to obtain CPW 5/3 and CPW 7/178. BamHI linearizes the plasmid at the ADE2 sequence, thus targeting integration at the ade2 locus of Red 3/6 (35).
FIG. 1.
Genesis of the transforming plasmid pCPW7, in which the PEP1 (SAP1) ORF is under the regulation of the WH11 promoter. (A) The endogenous ADE2 gene with relevant restriction sites. (B) Plasmid pCRW5, which was used to construct pCPW7. (C) The final transforming plasmid pCPW7. ADE2, the adenine 2 gene of C. albicans WO-1; RLUC, the R. reniformis luciferase ORF; WH11 5′, the WH11 promoter sequence; Ampr, ampicillin resistance gene; PEP1, the PEP1 (SAP1) ORF.
Since the parent strain, Red 3/6, of the misexpression mutants is auxotrophic for adenine, it could not be used to assess growth in the medium YCB/BSA, which contained BSA as the sole nitrogen source, and it could not be used as a control in the systemic mouse model. Therefore, Red 3/6 was transformed with the ADE2-containing vector lacking the expression cassette (33, 34) to generate control strain EPB 3/15, which was, therefore, isogenic to CPW 5/3 and CPW 7/178.
Southern and Northern blot hybridization.
To verify that transformants contained the expression cassette at the target locus, genomic DNA was extracted (17, 36) from cells grown in supplemented Lee's medium at 25°C. Three micrograms of DNA was digested with BamHI, and the resulting fragments were separated on a 0.8% (wt/vol) agarose gel. DNA was transferred to Hybond-N nylon membrane (Amersham Int., Buckinghamshire, England) and probed with the C. albicans ADE2 gene. The ADE2 gene was labeled by the random priming method with [α-32P]dCTP (NEN, Boston, Mass.). To assess the number of integrated plasmid copies in a transformant, the intensity of the plasmid-derived ADE2 band was quantified with the PhosphorImager and ImageQuant software (ImageQuant version 4.1; Molecular Dynamics, Sunnyvale, Calif.). For Northern analysis, total RNA was extracted from cells in the exponential phase of growth in liquid-supplemented Lee's medium, by using the RNeasy kit (Qiagen, Inc., Valencia, Calif.). Cells were homogenized with acid-washed glass beads in a bead beater (Bio-spec Products, Bartlesville, Okla.) prior to extraction. RNA was separated on a 1.2% agarose–formaldehyde gel. RNA was transferred to Hybond-N nylon membrane and probed with the PEP1 (SAP1) ORF (17) and the C. albicans actin gene ORF (16). The prehybridization and hybridization conditions were those described by Church and Gilbert (6).
Growth analyses and proteinase assays.
Growth and proteinase analyses were performed with the same culture for each strain. Cells from agar cultures were diluted into 50 ml of liquid growth medium in a 125-ml Erlenmeyer flask at a final density of 5 × 10⁵ cells per ml and rotated in a gyratory water bath (model G76; New Brunswick Scientific; Edison, N.J.) at 25°C. Five hundred-microliter aliquots were removed at time intervals for measuring cell density and proteinase activity. Cell growth was monitored by measuring the optical density of the cell suspension at a wavelength of 550 nm (OD550). To measure proteinase activity (24), the culture sample was pelleted at 5,000 × g for 5 min, and the supernatant was transferred to a sterile tube and stored at −20°C. Two hundred microliters of supernatant was subsequently added to 1 μl of 0.5% azocasein in citrate phosphate buffer (24 mM citric acid, 50 mM Na2HPO4 [pH 5.0]) and incubated at 37°C for 1 h. Undigested substrate was precipitated with 2 ml of ice-cold 10% (wt/vol) trichloroacetic acid and pelleted. The supernatant was neutralized with 2 ml of 0.5 M NaOH, and the OD340 was measured.
Switching frequencies.
To compare the frequency of switching, cells were initially plated at low density on agar containing supplemented Lee's medium containing 5 μg of phloxine B per ml, which differentially stains opaque colonies red (3). Cells from two white- and two opaque-phase colonies of each strain were independently inoculated into flasks containing 25 ml of supplemented Lee's medium and grown to late log phase. Cells were then diluted into sterile water, and 0.1-ml aliquots, each containing approximately 40 cells, were spread on an 11-cm-diameter agar plate of supplemented Lee's medium containing phloxine B. After 7 days at 25°C, white (white) and red (opaque) colonies were scored.
Virulence in a systemic mouse model.
Cells were grown to mid-log phase in supplemented Lee's medium, washed twice in sterile phosphate-buffered saline (PBS; 3 mM KCl, 137 mM NaCl, 2 mM KH2PO4, 7 mM NaH2PO4 [pH 7.4]), and resuspended in PBS to a final concentration of 4 × 10⁶ cells per ml. Cell phenotypes were verified microscopically. Ten female ND-4 mice, 7 to 10 weeks old (Sprague-Dawley, Madison, Wis.) and weighing 21 to 26 g, were infected with white-phase cells, and 10 were infected with opaque-phase cells by intravenous injection into the tail vein. Mice were checked every 12 h. When a mouse exhibited the first signs of illness, it was sacrificed by CO2 anesthetization. In a set of control mice injected with white-phase cells and control mice injected with opaque-phase cells, death followed the selected moribund symptoms by 1 day.
Virulence in a cutaneous mouse model.
The experimental protocol was similar to that of Ray and Wuepper (22), with modifications. White Swiss/Webster ND-4 mice that were 14 to 16 days pregnant were obtained from Sprague-Dawley (Madison, Wis.). For experimental purposes, newborn mice 2 to 4 days old with no evidence of hair growth were used. A 4-mm2 porous nonwoven sterile cotton patch (Kendall Co., Mansfield, Mass.) was saturated with a 10-μl aliquot of buffer containing 107 cells. The patch was spread on the skin on the back of a newborn mouse and fixed in place with First Aid waterproof tape (Johnson and Johnson, Racine, Wis.). Animals were maintained in isolation. At the end of the experimental period, each mouse was sacrificed by CO2 anesthetization, the patch was removed, and the patched skin area was excised. For histology, a portion of the skin sample was immediately fixed in PenFix (Richard-Allen, Kalamazoo, Mich.) for 24 h, dehydrated, and embedded in paraffin. Sections 7 μm thick were cut from fixed tissue and stained with periodic acid-Schiff reagent followed by hematoxylin. Sections were examined microscopically and photographed. The number of single yeast cells per histological section was counted. For each C. albicans strain tested, the results from patches of two test animals were pooled. For scanning electron microscopy, a portion of the skin sample was attached to dental wax with insect pins and fixed for 24 h in 2.5% gluteraldehyde (vol/vol) in 0.1 M sodium cacodylate buffer (pH 7.2) at 4°C. Patches were then washed twice in buffer and postfixed in 1% osmium tetroxide in cacodylate buffer for 1 h. After the preparation had been washed twice for 15 min in cacodylate buffer and 1 min in distilled water, samples were dehydrated in graded concentrations of ethanol (50 to 100%). Specimens were placed in perforated Beem capsules and critical point dried in CO2 in an Emscope CPD 3000 (Emscope Laboratories, Ltd., Ashford, England). After drying, samples were mounted on aluminum stubs, sputter coated with gold palladium in an Emscope SC500 (Emscope Laboratories, Ltd.), and viewed with a Hitachi S-4000 scanning electron microscope (Hitachi Corp., San Diego, Calif.). All animal studies were performed as approved by the Animal Care Use and Review Committee at the University of Iowa.
RESULTS
Genesis and verification of transformants.
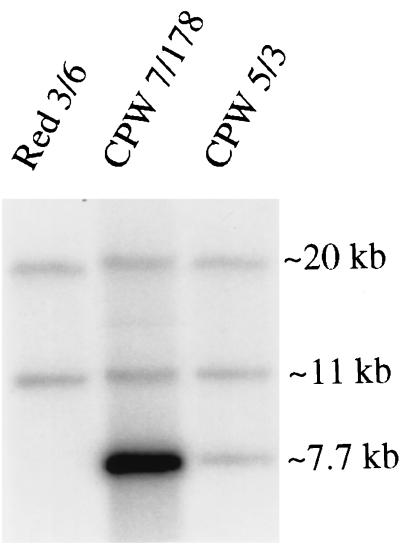
The strategy for generating PEP1 (SAP1) misexpression mutants involved replacing the Renilla reniformis ORF that is positioned immediately downstream of the WH11 promoter in plasmid pCRW5 (Fig. 1B) (36) with the PEP1 (SAP1) ORF (17) to generate the plasmid pCPW7 (Fig. 1C) and linearizing pCPW7 at the ADE2 sequence to target integration to one of the two ade2 loci of strain Red 3/6 (35). Transformants were selected for adenine prototrophy acquired from the ADE2 gene in pCPW7 (Fig. 1C). Southern blot hybridization was used to verify that putative transformants contained pCPW7 at an ade2 locus. A Southern blot of BamHI-digested DNA of the untransformed strain Red 3/6 probed with ADE2 contained two bands at approximately 20 and 11 kb (Fig. 2), the expected molecular sizes for the BamHI fragments of Red 3/6 containing ade2 sequences (Fig. 1A). Southern blot hybridization patterns of the two putative transformants CPW 5/3 and CPW 7/178 each contained 20- and 11-kb bands and an additional 7.7-kb band (Fig. 2), which is the estimated size of the BamHI fragment of the transforming vector that contains ADE2 sequences (Fig. 1C). This result is consistent with the absence of any BamHI sites within the transforming vector (Fig. 1C).
FIG. 2.
Southern blot analysis of transformant DNA digested with BamHI and probed with ADE2. The parent strain Red 3/6 exhibits the two expected bands at 20 and 11 kb for the endogenous ADE2 gene (Fig. 1A). Transformants CPW 7/178 and CPW 5/3 transformed with pCPW7 exhibit the expected bands containing endogenous ade2 gene sequences plus the expected band of 7.7 kb containing the ADE2 gene of the plasmid. The difference in the intensity of the 7.7-kb band for CPW 7/178 and CPW 5/3 reflects a difference in the number of inserts—approximately 10 in the former and 1 in the latter.
The intensity of the additional 7.7-kb band in transformant CPW 5/3 was similar to that of the 20- and 11-kb bands, while the intensity of the additional 7.7-kb band in transformant CPW 7/178 was much higher, suggesting that one transforming vector had inserted into CPW 5/3, while multiple copies had inserted into CPW 7/178. Density measurements of the Southern blot hybridization bands suggested that one copy of the transforming vector inserted into CPW 5/3, and approximately 10 copies inserted into CPW 7/178.
PEP1 (SAP1) is mistranscribed in the white phase of putative misexpression mutants.
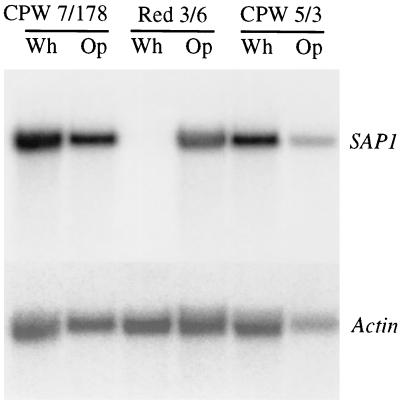
The expression of PEP1 (SAP1) is rigidly regulated by the white-opaque transition, and this is demonstrated in the hybridization patterns of Northern blots probed with PEP1 (SAP1) (Fig. 3). While the pattern of opaque-phase cells of strain Red 3/6 contained a strong hybridization band when probed with PEP1 (SAP1), the patterns of white-phase cells exhibited no measurable signal. The pattern of opaque-phase cells of the two transformant strains CPW 7/178 and CPW 5/3 also exhibited a strong hybridization signal like that of opaque-phase cells of parent strain Red 3/6 (Fig. 3). However, the pattern of white-phase cells of the two transformant strains CPW 5/3 and CPW 7/178 also contained a strong hybridization band, demonstrating that the ectopic copies of PEP1 (SAP1) were transcribed in the white phase.
FIG. 3.
Northern blot analysis of RNA from white (Wh)- and opaque (Op)-phase cell cultures of parent strain Red 3/6, misexpression mutant CPW 7/178, and misexpression mutant CPW 5/3 probed with PEP1 (SAP1) and the actin gene. Parental strain Red 3/6 expressed PEP1 (SAP1) exclusively in the opaque phase, while misexpression mutants CPW 7/178 and CPW 5/3 expressed PEP1 (SAP1) in both the white and opaque phases.
Misexpression of PEP1 (SAP1) does not alter the general morphology of white-phase cells.
The white-opaque transition involves a dramatic change in cell morphology. While white-phase cells are round to slightly ellipsoidal, opaque-phase cells are elongate and asymmetric (28, 30). While the surface of white-phase cells examined under scanning electron microscopy is smooth, that of opaque-phase cells is pimpled (3). White-phase cells of the misexpression mutant CPW 7/178 exhibited a normal round-cell morphology, and, as would be expected, opaque-phase cells of CPW 7/178 exhibited the unique elongate morphology of that cell type (data not shown). In addition, the surface of white-phase cells of the misexpression mutant CPW 7/178 did not exhibit pimples when viewed by scanning electron microscopy (data not shown). Misexpression of PEP1 (SAP1), therefore, did not confer to white-phase cells any of the unique morphological features of opaque-phase cells.
Misexpression of PEP1 (SAP1) does not alter switching frequencies.
Misexpression of the white-phase-specific gene WH11 destabilized the opaque-phase phenotype, causing a dramatic increase in the rate of switching from the opaque phase to the white phase (13). To test whether misexpression of PEP1 (SAP1) affected the switching frequency in the white to opaque direction, white- and opaque-phase cells of control strain EPB 3/15, white-phase cells of the misexpression mutant CPW 5/3, and white- and opaque-phase cells of the misexpression mutant CPW 7/178 were plated at low density, and the frequency of the alternative cell types was measured. The frequencies of opaque-phase cells in white-phase cell populations and white-phase cells in opaque-phase cell populations have been determined in earlier studies to be approximately 10−3 in both cases (3, 13, 28). The frequencies of the opposite phenotype measured in white- or opaque-phase populations in control strain EPB 3/15, in the white-phase population of CPW 5/3, and in the white- and opaque-phase populations of CPW 7/178 were all close to 10−3 (Table 1), demonstrating that misexpression of PEP1 (SAP1) in the white phase did not affect the frequency of switching in either phenotype.
TABLE 1.
Misexpression of PEP1 (SAP1) in the white phase does not affect the apparent frequencies of switching in the white to opaque phase or opaque to white phasea
| Strain | Original population phenotypeb | No. of colonies analyzeda | Proportion of opposite-phase phenotypea |
|---|---|---|---|
| EPB 3/15 | White | 8,333 | 1.1 × 10⁻³ |
| Opaque | 2,552 | 1.5 × 10⁻³ | |
| CPW 5/3 | White | 2,174 | 0.9 × 10⁻³ |
| Opaque | Not tested | ||
| CPW 7/178 | White | 5,130 | 2.7 × 10⁻³ |
| Opaque | 3,957 | 5.0 × 10⁻⁴ |
Switching frequencies are reflected by the proportion of CFU of the opposite phenotype in a clonal colony.
Cells from a colony exhibiting one phenotype (e.g., white) were in turn clonally plated, and the proportion of colonies with the opposite-phase phenotype was measured.
White-phase cells misexpressing PEP1 (SAP1) abnormally secrete high levels of proteinase.
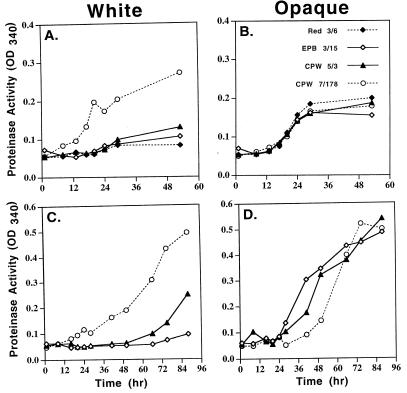
It was previously demonstrated that opaque-phase cells secrete high levels of proteinase activity into the supporting medium, while white-phase cells secrete extremely low levels (17). After a 12-h lag period, opaque-phase cells of control strains Red 3/6 and EPB 3/15 and mutant strains CPW 5/3 and CPW 7/178 released approximately the same high levels of proteinase activity into supplemented Lee's medium, which contains amino acids as the sole nitrogen source (Fig. 4B). In the white phase, the control strains Red 3/6 and EPB 3/15 released reduced levels of proteinase activity into the supporting medium (Fig. 4A). However, in the white phase, cells of strain CPW 5/3, which contained one ectopic copy of PEP1 (SAP1), released slightly higher levels of proteinase activity into the supporting medium than the control strains, and cells of strain CPW 7/178, which contained approximately 10 ectopic copies of PEP1 (SAP1), released elevated levels of proteinase activity (Fig. 4A) that were even higher than the levels released by opaque-phase cells (Fig. 4B). In YCB/BSA medium, which contains BSA as the sole nitrogen source, the results were similar. In the opaque phase, both control and mutant cells produced the same high levels of proteinase activity after a 20-h lag period (Fig. 4D). In the white phase, however, control cells produced almost no proteinase activity, cells of strain CPW 5/3 produced a slightly elevated level of activity, and cells of strain CPW 7/178 produced highly elevated levels after 20 h (Fig. 4C), comparable to the levels released by opaque-phase cells (Fig. 4D). In both growth media, the difference in the levels of proteinase activity released by white-phase cells of strains CPW 5/3 and CPW 7/178 were consistent with the difference in the number of integrated plasmids. These results were obtained in a repeat set of experiments and demonstrate that white-phase cells of the two misexpression mutants abnormally secrete elevated levels of proteinase into the supporting medium.
FIG. 4.
Increased proteinase activity in the supernatant of white-phase cell cultures of misexpression mutants. Cells were grown either in supplemented Lee's medium (A and B), in which the sole nitrogen source is free amino acids, or in YCB/BSA (C and D), in which the sole nitrogen source is BSA. Proteinase activity of culture supernatant was assayed by azocasein digestion (24). Symbols are described in upper-right-hand corner of panel B.
Misexpression of PEP1 (SAP1) in the white phase confers the growth capabilities of opaque-phase cells in BSA-containing medium.
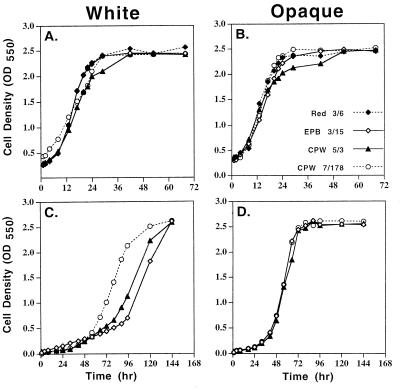
The secretion of Pep1p (Sap1p) in the opaque phase of all strains or in the white phase of the two misexpression mutants provided no advantage for cells growing in supplemented Lee's medium (Fig. 5A and B), since the free amino acids in this medium negated the need for a secreted proteinase (5, 14). This was not the case in the growth medium YCB/BSA, which contains BSA as the sole nitrogen source. In this medium, opaque-phase cells of control strain EPB 3/15 had a distinct growth advantage over white-phase cells. After a lag period of 24 h, opaque-phase cells grew exponentially, reaching a final stationary-phase plateau at 72 h (Fig. 5D). White-phase control cells also began to grow in YCB/BSA medium after a 24-h lag period, but in contrast to opaque-phase cells, at a dramatically reduced rate (Fig. 5C). At approximately 90 h, the rate of growth of white-phase control cells increased, and cells reached the final density achieved by opaque-phase cell cultures, but only after 144 h (Fig. 5C), 72 h later than opaque-phase cultures (Fig. 5D). Misexpression of PEP1 (SAP1) in the white phase in CPW 5/3 hastened the transition to rapid growth by 10 h, and misexpression in CPW 7/178 hastened it by approximately 30 h (Fig. 5C). Similar results were obtained in a repeat experiment. The earlier onset of rapid cell division in CPW 7/178 (Fig. 5C) paralleled the increase in proteinase activity in the supporting growth medium (Fig. 4C). Therefore, misexpression of PEP1 (SAP1) conferred to white-phase cells the growth advantage exhibited by opaque-phase cells in medium in which BSA was present as the sole nitrogen source.
FIG. 5.
Growth kinetics of misexpression mutant in supplemented Lee's medium (A and B) or YCB/BSA medium (C and D). Cell density was measured spectrophotometrically at OD550. Symbols are described in the lower-right-hand corner of panel B.
Misexpression of PEP1 (SAP1) in the white phase does not alter virulence in a systemic mouse model.
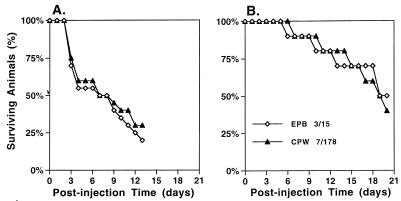
White- and opaque-phase cells of strain WO-1 exhibit distinctly different levels of virulence in a systemic mouse model in which cells are injected into the tail vein of adult mice (13). Animals injected with white-phase cells die much sooner than animals injected with opaque-phase cells. When animals injected with opaque-phase cells died, it was demonstrated by autopsy that the majority of infecting cells had assumed the white-cell phenotype, which explained the observed delay (13). Similar results were obtained with white- and opaque-phase cells of the control strain EPB 3/15. When white-phase cells of strain EPB 3/15 were injected, mice began dying at 3 days, and 50% had died by 6 days (Fig. 6A). In contrast, when opaque-phase cells of strain EPB 3/15 were injected, mice began dying at 6 days, and 50% of test animals had died by 18 days (Fig. 6B). Misexpression of PEP1 (SAP1) had no effect on either white-phase cell or opaque-phase cell virulence in the systemic model. The survival rates of animals injected with white- and opaque-phase cells of strain CPW 7/178 were indistinguishable from those of control strain EPB 3/15 (Fig. 6A and B, respectively). Since white-phase cells are inherently more virulent in this systemic candidiasis model, and due to the lack of any phenotypic difference between the strains in the time of onset of moribund signs in infected mice, we did not quantitate fungal burden in host tissues, as was performed in our earlier study (13).
FIG. 6.
Virulence of the misexpression mutant CPW 7/178 in a systemic mouse model. Mice were injected with either the control strain EPB 3/15 or the mutant strain CPW 7/178. When they exhibited symptoms that were demonstrated to precede death by approximately 1 day, they were sacrificed. Symbols are described in the lower-left-hand corner of panel B.
Misexpression of PEP1 (SAP1) does, however, confer the opaque-phase characteristic of increased colonization in a cutaneous mouse model.
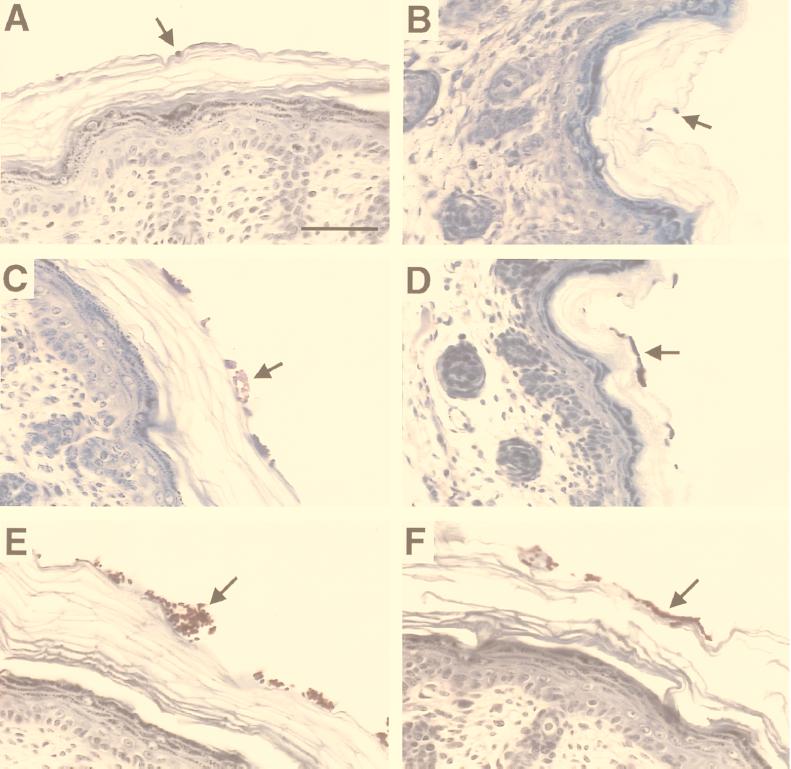
While white-phase cells of strain WO-1 are far more virulent than opaque-phase cells in the systemic mouse model, opaque-phase cells of strain WO-1 are far more virulent than white-phase cells in a cutaneous mouse model (39). In the latter model (22), a nonwoven cotton patch saturated with C. albicans was taped to the skin of a 2- to 3-day-old Swiss-Webster mouse for 24 h, the animal was sacrificed, and colonization of the skin was assessed by histological examination and by scanning electron microscopy. To quantitate colonization, the number of yeast cells adhering to or embedded in the superficial cutaneous layer was counted in histological sections. While histological sections of skin incubated with white-phase cells of strain WO-1 or control strain EPB 3/15 exhibited low colonization (Fig. 7A and B, respectively), sections incubated with opaque-phase cells of either strain exhibited very high levels of colonization (Fig. 7C and D, respectively). Sections of the skin incubated with white-phase cells of the PEP1 (SAP1) misexpression mutant CPW 7/178 exhibited levels of colonization at least as high as those of sections of skin incubated with opaque-phase cells of either control strain WO-1 or control strain EPB 3/15 (Fig. 7E and F). These differences were reflected in measurements of the number of adhering cells in histological sections of skin (Table 2). While 1 and 16% of sections of skin incubated with white-phase cells of strain WO-1 contained over 100 cells or between 25 and 100 cells, respectively, 16 and 56% of sections of skin incubated with opaque-phase cells of strain WO-1 contained over 100 cells or between 25 and 100 cells, respectively (Table 2); and while 3 and 36% of sections of skin incubated with white-phase cells of strain EPB 3/15 contained over 100 cells or between 25 and 100 cells, respectively, 22 and 60% of sections of skin incubated with opaque-phase cells of strain EPB 3/15 contained over 100 cells or between 25 and 100 cells, respectively (Table 2). Colonization by the misexpression mutant was even greater than that by opaque-phase cells of either strain WO-1 or EPB 3/15. Fifty and 27% of sections of skin incubated with CPW 7/178 cells contained over 100 cells or between 25 and 100 cells, respectively (Table 2). In several repeat experiments in which preparations were examined qualitatively, similar results were obtained.
FIG. 7.
Histology of the skin and dermis of newborn baby mice under the patch of the cutaneous mouse model after 24 h. Preparations were stained with periodic acid-Schiff reagent followed by hematoxylin, and 7-μm sections were examined. (A and B) White-phase cells of control strains WO-1 and EPB 3/15, respectively. (C and D) Opaque-phase cells of control strains WO-1 and EPB 3/15, respectively. (E and F) White-phase cells of misexpression mutant CPW 7/178. Arrows point to red-stained C. albicans cells. The quantitative analysis of colonization for these three cell types is presented in Table 2. The scale bar drawn in panel A represents 10 μm.
TABLE 2.
Number of single yeast cells present on the surface of mouse skin per section
| Phenotype and strain | No. (%) of sections
containing given no. of yeast cells
|
||||
|---|---|---|---|---|---|
| Total | >100 | 25–100 | <25 | 0 | |
| WO-1 | |||||
| White | 228 | 3 (1) | 36 (16) | 153 (67) | 36 (16) |
| Opaque | 317 | 52 (16) | 178 (56) | 87 (27) | 0 (0) |
| EPB 3/15 | |||||
| White | 219 | 7 (3) | 78 (36) | 131 (60) | 3 (1) |
| Opaque | 280 | 61 (22) | 168 (60) | 51 (18) | 0 (0) |
| CPW 7/178; white | 283 | 143 (50) | 76 (27) | 66 (23) | 0 (0) |
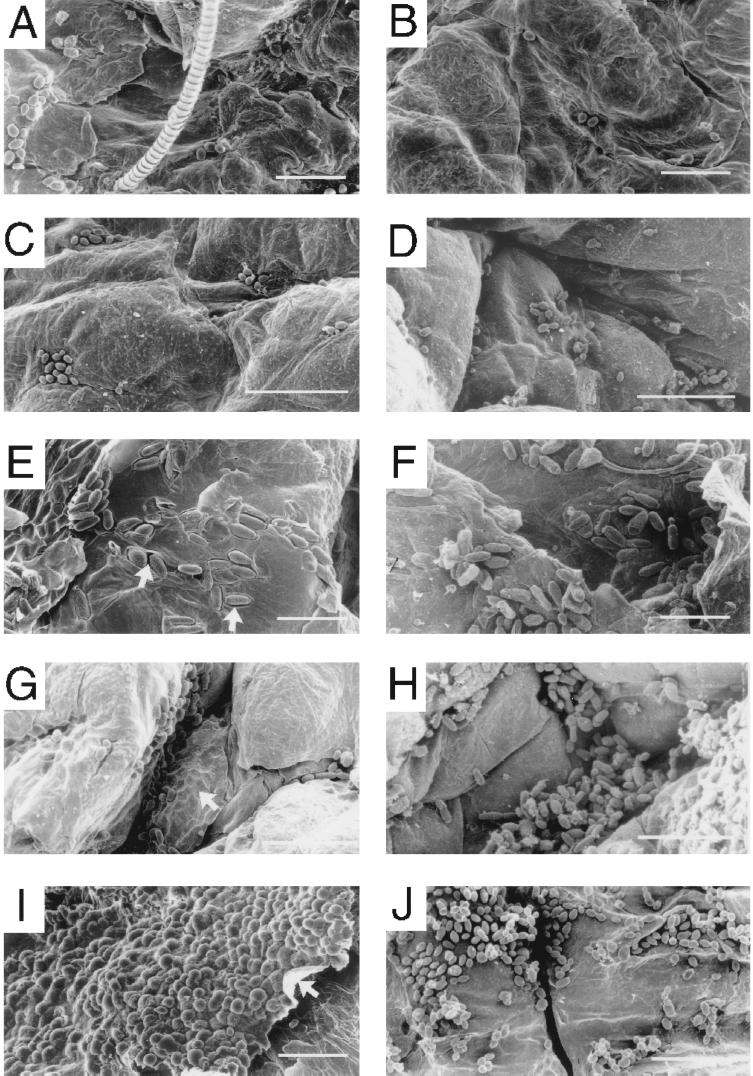
Scanning electron micrographs of the surface of the skin under the patches revealed additional differences in colonization between white-phase cells and opaque-phase cells of strains WO-1 and EPB 3/15. As was observed in histological sections, white-phase cells of strain WO-1 (Fig. 8A) or EPB 3/15 (Fig. 8C) were far less abundant on the skin surface than opaque-phase cells (Fig. 8E and G, respectively). In addition, while white-phase cells of strain WO-1 adhered to the skin surface with little or no penetration, opaque-phase cells sank into the skin surface, forming deep cavities (Fig. 8E and G, respectively). Cavitation caused by opaque-phase cells of strains WO-1 and EPB 3/15 was obvious in higher-magnification scanning electron microscopes (Fig. 9A and C, respectively). As was demonstrated in histological sections (Fig. 7 and Table 2), white-phase cells of the misexpression mutant CPW 7/178 were far more abundant on the skin surface (Fig. 8I) than white-phase cells or opaque-phase cells of control strains (Fig. 8A and C and E and G, respectively). Mutant cells colonized the skin surface so densely in some areas, that the superficial skin layer sometimes curled from lower-level cells, forming scales (Fig. 8I). White-phase cells of the misexpression mutant also sank into the upper layers of skin cells, as did opaque-phase cells of the two control strains. Although this was not obvious in the scanning electron micrograph in Fig. 8I because of the extraordinarily high level of colonization, it was obvious in preparations in which mutant cells were removed from the skin during scanning electron microscopy preparation, revealing cavities in the skin surface (Fig. 9E).
FIG. 8.
Colonization under the patch in a baby mouse model of cutaneous infection. Low-magnification scanning electron micrographs show cells under the patch on the skin of newborn mice after 24 h in the absence (A, C, E, G, and I) and in the presence (B, D, F, H, and J) of pepstatin A. (A and B) White-phase cells of control strain WO-1. (C and D) White-phase cells of control strain EPB 3/15. (E and F) Opaque-phase cells of control strain WO-1. (G and H) Opaque-phase cells of control strain EPB 3/15. (I and J) White-phase cells of the misexpression mutant CPW 7/17. Note hair fiber in panel A. Arrows in panels E and G point to cells that have sunk into the superficial layer of the skin; the arrow in panel I points to the peeling upper skin layer that is heavily colonized. The scale bars in panels A, B, E, F, I, and J are 20 μm, and those in panels C, D, G, and H are 33.3 μm.
FIG. 9.
High-magnification scanning electron micrographs of cells on the surface of skin under the patch of the baby mouse model of cutaneous infection after 24 h. (A) Opaque-phase cells of control strain WO-1 in the absence of pepstatin A. (B) Opaque-phase cells of control strain WO-1 in the presence of pepstatin A. (C) Opaque-phase cells of control strain EPB 3/15 in the absence of pepstatin. (D) Opaque-phase cells of control strain EPB 3/15 in the presence of pepstatin. (E) Surface of skin exhibiting the cavities left by white-phase cells of the misexpression mutant CPW 7/178 in the absence of pepstatin A. Mutant cells in this case were removed during fixation for scanning electron microscopy. (D) White-phase cells of strain CPW 7/178 in the presence of pepstatin A. Arrows in panels A and C point to cavities caused by embedded cells; arrows in panel E point to cavities left by cells removed during fixation. The scale bars for panels A, B, C and D are 10 μm, and those for panels E and F are 15 μm.
To test directly whether the secretion of proteinase activity was the basis of increased colonization shared by opaque-phase cells of the control strains and white-phase cells of the misexpression mutant CPW 7/178, the effect of the potent proteinase inhibitor pepstatin A was tested. In vitro experiments demonstrated that pepstatin A completely inhibited proteinase activity released into the medium by opaque-phase cells of strain WO-1 and white-phase cells of strain CPW 7/178 in both supplemented Lee's medium and in YCB/BSA medium (data not shown). In the presence of pepstatin A, opaque-phase cells of the control strains WO-1 and EPB 3/15 and white-phase cells of the misexpression mutant CPW 7/178 still exhibited increased colonization (Fig. 8F, H, and J, respectively) when compared to the colonization of white-phase cells of control strains WO-1 and EPB 3/15 (Fig. 8B and D, respectively). However, in the presence of pepstatin A, neither opaque-phase cells of the control strains nor white-phase cells of the misexpression mutant CPW 7/178 penetrated the skin surface (Fig. 8F, H, and J, respectively). This result was even clearer in high-magnification images (Fig. 9B, D, and F, respectively).
DISCUSSION
The majority of strains of C. albicans and related species switch spontaneously between a limited number of general phenotypes that in many cases can be identified by variant colony morphology on agar containing low concentrations of zinc (30). Switching has been demonstrated to affect a number of putative virulence traits (30) and to regulate transcription of a number of genes, several of which encode proteins that are considered putative virulence factors (e.g., SAP1 and CDR3) (4, 9, 17, 42). The view which has emerged is that switching in C. albicans represents a mechanism that has evolved to generate variability within an infecting strain in order to escape the immune system, to escape drug therapy, to cross barriers between tissues and body locations, to facilitate residence in diverse body locations, to respond rapidly to changes in host physiology, and to compete with the changing bacterial flora (20, 30–32).
Here, we have examined the role of the opaque-phase-specific gene PEP1 (SAP1) in the switching process, in the genesis of the opaque-phase-specific phenotype and in phase-specific virulence in two animal models. The gene for PEP1 (SAP1) was originally cloned by Hube et al. (8) and subsequently isolated in a screen for opaque-phase-specific genes (17). In the latter study, the gene was first named PEP1. After the discovery that the gene represented one of many secreted aspartyl proteinases (43), the family of genes was named SAP, and PEP1 was renamed SAP1 (9, 42). For that reason, we have referred to the gene as PEP1 (SAP1) in this study. Expression of PEP1 (SAP1) has been associated with virulence in a rat vaginitis model (7). PEP1 (SAP1) has been demonstrated to be one of the first SAPs transcribed by C. albicans upon interaction with reconstituted human epithelium (26). It has also been demonstrated in the saliva of patients with oral colonization (26). Two laboratories in addition to our own demonstrated that transcription of PEP1 (SAP1) was rigidly regulated in vitro by the white-opaque transition in C. albicans WO-1 (9, 17, 18, 42). In addition, PEP1 (SAP1) has been demonstrated to be regulated by the switching system in the common laboratory strain 3153A (19).
We have employed the strategy of misexpressing an opaque-phase-specific gene in the white phase in order to investigate its role in switching and phase-specific virulence. We previously used the same strategy to investigate the role of the white-phase-specific gene WH11 (13). We found that when WH11 was misexpressed in the opaque phase, it had no visible effect on the unique opaque-phase phenotype nor on the rate of switching from white to opaque. However, misexpression destabilized the opaque-phase phenotype, forcing it to switch back to the white phase at a frequency 330 times higher than normal (13). Misexpression of WH11 also dramatically increased the virulence of opaque-phase cells to that of white-phase cells in the systemic mouse model by virtue of rapidly driving opaque-phase cells back to the more virulent white-phase phenotype after tail injection (13).
Since the promoter of the white-phase-specific gene WH11 is weaker than the opaque-phase promoters so far analyzed (15, 15a, 36), we analyzed two misexpression mutants, CPW 5/3, which contained one transforming plasmid, and CPW 7/178, which contained approximately 10 transforming plasmids. White-phase cells of the latter transformant secreted a level of proteinase comparable to that of opaque-phase cells. For that reason, CPW 7/178 was employed for assessing the impact of PEP1 (SAP1) misexpression on the white-phase cell phenotype. The misexpression mutant CPW 7/178 formed white-phase budding cells that were morphologically indistinguishable from white-phase budding cells of control strains. There were no indications of any of the unique morphological features of opaque-phase cells, which included an elongate asymmetric cell shape, cellular mass roughly double that of white-phase cells, and pimples emanating from the cell surface visible in scanning electron micrographs (3, 28). The misexpression mutant also switched at normal frequencies from the white to opaque phase and from the opaque to white phase, demonstrating that in contrast to misexpression of WH11 in the opaque phase (13), misexpressing of PEP1 (SAP1) in the white phase had no measurable effect on switching frequency. Misexpression of PEP1 (SAP1) did, however, confer to white-phase cells the growth capabilities of opaque-phase cells in media in which the sole nitrogen source was protein. This conferred characteristic is most likely due to the direct hydrolysis of protein in the growth medium by secreted misexpressed aspartyl proteinase.
The capacity of mutant white-phase cells to secrete functional Pep1p (Sap1p) suggests that the expression of other opaque-phase-specific genes or cellular characteristics are not essential for Pep1p (Sap1p) modification and/or secretion. In particular, the unique channels and pimples of opaque-phase cells (3) are not necessary for Pep1p (Sap1p) secretion.
Misexpression of PEP1 (SAP1) in the white phase had no positive or negative effect on virulence in the systemic mouse model. This was not surprising, since white-phase cells of strains WO-1 and EPB 3/15, which do not secrete Pep1p (Sap1p) in vitro, are so much more virulent in the systemic mouse model than opaque-phase cells, which do secrete copious amounts of Pep1p (Sap1p) in vitro. Hube et al. (10) have demonstrated that a SAP1 knockout in C. albicans SC5314 was less virulent than the parental strain in a similar systemic mouse model, but a comparison of the survival plots of mice injected with cells of strain SC5314 (10) and mice injected with white-phase cells of strain EPB 3/15. (Fig. 6A) suggests that cells of the latter strain are far more virulent than the former. This raises the possibility that secretion of Pep1p (Sap1p) may provide an advantage in the systemic mouse model only to strains that already exhibit diminished virulence in this model.
Our results do demonstrate that misexpression of PEP1 (SAP1) has a profound effect on the virulence of white-phase cells in a cutaneous mouse model. This model measures the level of yeast colonization on skin after a 24-h incubation period. The assay measures the intensity of colonization of budding cells in the absence of hypha formation, and, as demonstrated, appears to assess two aspects of colonization, adhesion and cavitation. In contrast to the systemic mouse model, opaque-phase cells of control strains WO-1 and EPB 3/15 are far more virulent than white-phase cells in the cutaneous mouse model, as suggested previously (39). After 24 h of incubation, colonization by opaque-phase cells is far greater than that of white-phase cells, and this result was demonstrated both in stained histological sections and in scanning electron microscopic preparations. In addition, opaque-phase cells were observed to sink deep into the surface layer of skin cells, causing cavities. When opaque-phase cells were sometimes removed from the skin during preparation for scanning electron microscopy, the cavities they had formed in the skin remained clearly visible. White-phase cells of control strains did not form comparable cavities. White-phase cells of the misexpression mutant CPW 7/178, however, were demonstrated to colonize the skin at densities even greater than that attained by opaque-phase cells of control strains. They also cavitated the skin. Colonization of white-phase cells of the misexpression mutant was sometimes so intense that it resulted in scaling, or curling, of the most superficial skin layer.
The addition of pepstatin A to cultures of opaque-phase cells of control strains or white-phase cells of the misexpression mutant CPW 7/178 completely inhibited proteinase activity in the supernatant, but had no effect on growth in defined medium. The addition of pepstatin A to pads containing either white-phase cells of control strains, opaque-phase cells of control strains, or white-phase cells of the misexpression mutant CPW 7/178 in the cutaneous mouse model did not affect the differential levels of skin colonization. As in untreated preparations, opaque-phase cells of control strains and white cells of the misexpression mutant CPW 7/178 exhibited dramatically increased colonization compared to that of white-phase cells of strain WO-1. However, in the presence of pepstatin A, neither opaque-phase cells of control strains nor white-phase cells of the misexpression mutant CPW 7/178 formed cavities in the skin, and CPW 7/178 cells did not induce scaling. Ray and Payne (21) previously demonstrated that a clinical strain of C. albicans caused cavitation on the surface of skin and that pepstatin inhibited cavitation, but not adhesion. In addition, Watts et al. (41) demonstrated that pepstatin did not reduce adhesion of C. albicans SC 5314. Together, these results suggest that expression of PEP1 (SAP1) has two roles in the colonization of skin. First, it increases cellular adhesion, and second, it facilitates skin penetration. Suppression of tissue penetration but not adhesion by pepstatin A suggests that the cell-associated Pep1 (Sap1) protein causes an increase in the adhesive properties of white-phase cells, while released Pep1 (Sap1) protein facilitates tissue cavitation. In strain WO-1, these functions are regulated by high-frequency phenotypic switching.
ACKNOWLEDGMENTS
This work was supported by Public Health Service grants AI39735 and DE10658.
REFERENCES
- 1.Anderson J, Cundiff L, Schnars B, Gao M, Mackenzie I, Soll D R. Hypha formation in the white-opaque transition of Candida albicans. Infect Immun. 1989;57:458–467. doi: 10.1128/iai.57.2.458-467.1989. [DOI] [PMC free article] [PubMed] [Google Scholar]
- 2.Anderson J, Milhalik R, Soll D R. Ultrastructure and antigenicity of the unique cell wall pimple of the Candidaopaque phenotype. J Bacteriol. 1990;172:224–235. doi: 10.1128/jb.172.1.224-235.1990. [DOI] [PMC free article] [PubMed] [Google Scholar]
- 3.Anderson J M, Soll D R. The unique phenotype of opaque cells in the white-opaque transition of Candida albicans. J Bacteriol. 1987;169:5579–5588. doi: 10.1128/jb.169.12.5579-5588.1987. [DOI] [PMC free article] [PubMed] [Google Scholar]
- 4.Balan I, Alarco A-M, Raymond M. The Candida albicans CDR3gene codes for an opaque-phase ABC transporter. J Bacteriol. 1997;179:7210–7218. doi: 10.1128/jb.179.23.7210-7218.1997. [DOI] [PMC free article] [PubMed] [Google Scholar]
- 5.Bedell G W, Soll D R. Effects of low concentrations of zinc on the growth and dimorphism of Candida albicans: evidence for zinc-resistant and -sensitive pathways for mycelium formation. Infect Immun. 1979;26:348–354. doi: 10.1128/iai.26.1.348-354.1979. [DOI] [PMC free article] [PubMed] [Google Scholar]
- 6.Church G M, Gilbert W. Genomic sequencing. Proc Natl Acad Sci USA. 1984;81:1991–1995. doi: 10.1073/pnas.81.7.1991. [DOI] [PMC free article] [PubMed] [Google Scholar]
- 7.De Bernardis F, Cassone A, Sturtevant J, Calderone R. Expression of Candida albicans SAP1 and SAP2in experimental vaginitis. Infect Immun. 1995;63:1887–1892. doi: 10.1128/iai.63.5.1887-1892.1995. [DOI] [PMC free article] [PubMed] [Google Scholar]
- 7a.Ernst, Joachim. 1999. Personal communication.
- 8.Hube B, Turner C J, Odds F C, Eiffert H, Boulnois G J, Köchel H, Rüchel R. Sequence of the Candida albicansgene encoding the secretory aspartyl proteinase. J Med Vet Mycol. 1991;29:129–132. [PubMed] [Google Scholar]
- 9.Hube B, Monod M, Schofield D A, Brown A J, Gow N A. Expression of seven members of the gene family encoding secretory aspartyl proteinases in Candida albicans. Mol Microbiol. 1994;14:87–99. doi: 10.1111/j.1365-2958.1994.tb01269.x. [DOI] [PubMed] [Google Scholar]
- 10.Hube B, Sanglard D, Odds F C, Hess D, Monod M, Schäfer W, Brown A J P, Gow N A R. Disruption of each of the secreted aspartyl proteinase genes SAP1, SAP2, and SAP3 of Candida albicansattenuates virulence. Infect Immun. 1997;65:3529–3538. doi: 10.1128/iai.65.9.3529-3538.1997. [DOI] [PMC free article] [PubMed] [Google Scholar]
- 11.Kennedy M J, Rogers A L, Hanselman L A, Soll D R, Yancey R J. Variation in adhesion and cell surface hydrophobicity in Candida albicanswhite and opaque phenotypes. Mycopathologia. 1988;102:149–156. doi: 10.1007/BF00437397. [DOI] [PubMed] [Google Scholar]
- 12.Kolotila M P, Diamond R D. Effects of neutrophils and in vitro oxidants on survival and phenotypic switching of Candida albicansWO-1. Infect Immun. 1990;58:1174–1179. doi: 10.1128/iai.58.5.1174-1179.1990. [DOI] [PMC free article] [PubMed] [Google Scholar]
- 13.Kvaal C A, Srikantha T, Soll D R. Misexpression of the white-phase-specific gene WH11 in the opaque phase of Candida albicansaffects switching and virulence. Infect Immun. 1997;65:4468–4475. doi: 10.1128/iai.65.11.4468-4475.1997. [DOI] [PMC free article] [PubMed] [Google Scholar]
- 14.Lee K L, Buckley H R, Campbell C C. An amino acid liquid synthetic medium for development of mycelial and yeast forms of Candida albicans. Sabouraudia. 1975;13:148–153. doi: 10.1080/00362177585190271. [DOI] [PubMed] [Google Scholar]
- 15.Lockhart S R, Nguyen M, Srikantha T, Soll D R. A MADS box protein consensus binding site is necessary and sufficient for activation of the opaque-phase-specific gene OP4 of Candida albicans. J Bacteriol. 1998;180:6607–6616. doi: 10.1128/jb.180.24.6607-6616.1998. [DOI] [PMC free article] [PubMed] [Google Scholar]
- 15a.Lockhart, S. R., T. Srikantha, and D. R. Soll. Unpublished observations.
- 16.Losberger C, Ernst J F. Sequence of the Candida albicansgene encoding actin. Nucleic Acids Res. 1989;22:9488. doi: 10.1093/nar/17.22.9488. [DOI] [PMC free article] [PubMed] [Google Scholar]
- 17.Morrow B, Srikantha T, Soll D R. Transcription of the gene for a pepsinogen, PEP1, is regulated by white-opaque switching in Candida albicans. Mol Cell Biol. 1992;12:2997–3005. doi: 10.1128/mcb.12.7.2997. [DOI] [PMC free article] [PubMed] [Google Scholar]
- 18.Morrow B, Srikantha T, Anderson J, Soll D R. Coordinate regulation of two opaque-specific genes during white-opaque switching in Candida albicans. Infect Immun. 1993;61:1823–1828. doi: 10.1128/iai.61.5.1823-1828.1993. [DOI] [PMC free article] [PubMed] [Google Scholar]
- 19.Morrow B, Ramey H, Soll D R. Regulation of phase-specific genes in the more general switching system of Candida albicansstrain 3153A. J Med Vet Mycol. 1994;32:287–294. doi: 10.1080/02681219480000361. [DOI] [PubMed] [Google Scholar]
- 20.Odds F C. Switch of phenotype as an escape mechanism of the intruder. Mycoses. 1997;40(Suppl. 2):9–12. doi: 10.1111/j.1439-0507.1997.tb00556.x. [DOI] [PubMed] [Google Scholar]
- 21.Ray T L, Payne C D. Scanning electron microscopy of epidermal adherence and cavitation in murine candidiasis: a role for Candidaacid proteinase. Infect Immun. 1988;56:1942–1949. doi: 10.1128/iai.56.8.1942-1949.1988. [DOI] [PMC free article] [PubMed] [Google Scholar]
- 22.Ray T L, Wuepper K D. Experimental cutaneous candidiasis in rodents. J Investig Dermatol. 1976;66:29–33. doi: 10.1111/1523-1747.ep12478053. [DOI] [PubMed] [Google Scholar]
- 23.Rikkerink E H A, Magee B B, Magee P T. Opaque-white phenotype transition: a programmed morphological transition in Candida albicans. J Bacteriol. 1988;170:895–899. doi: 10.1128/jb.170.2.895-899.1988. [DOI] [PMC free article] [PubMed] [Google Scholar]
- 24.Rüchel R. Properties of a purified proteinase from the yeast Candida albicans. Biochim Biophys Acta. 1981;659:99–113. doi: 10.1016/0005-2744(81)90274-6. [DOI] [PubMed] [Google Scholar]
- 25.Sanglard D, Ischer F, Monod M, Dogra S, Prasad R, Bille J. ASM Conference on Candida and Candidiasis. Washington, D.C: American Society for Microbiology; 1999. Analysis of the ATP-binding cassette (ABC)-transporter gene CDR4 from Candida albicans, abstr. C27. [Google Scholar]
- 26.Schaller M, Schäfer W, Korting H C, Hube B. Differential expression of secreted aspartyl proteinases in a model of human oral candidosis and in patient samples from the oral cavity. Mol Microbiol. 1998;29:605–615. doi: 10.1046/j.1365-2958.1998.00957.x. [DOI] [PubMed] [Google Scholar]
- 27.Schiestl R H, Gietz R D. High efficiency transformation of intact yeast cells using single stranded nucleic acids as a carrier. Curr Genet. 1989;16:339–346. doi: 10.1007/BF00340712. [DOI] [PubMed] [Google Scholar]
- 28.Slutsky B, Staebell M, Anderson J, Risen L, Pfaller M, Soll D R. “White-opaque transition”: a second high-frequency switching system in Candida albicans. J Bacteriol. 1987;169:189–197. doi: 10.1128/jb.169.1.189-197.1987. [DOI] [PMC free article] [PubMed] [Google Scholar]
- 29.Soll D R, Anderson J, Bergen M. The developmental biology of the white-opaque transition in Candida albicans. In: Prasad R, editor. Candida albicans: cellular and molecular biology. New York, N.Y: Springer Verlag; 1991. pp. 20–45. [Google Scholar]
- 30.Soll D R. High-frequency switching in Candida albicans. Clin Microbiol Rev. 1992;5:183–203. doi: 10.1128/cmr.5.2.183. [DOI] [PMC free article] [PubMed] [Google Scholar]
- 31.Soll D R. The emerging molecular biology of switching in Candida albicans. ASM News. 1997;62:415–420. [Google Scholar]
- 32.Soll D R. Gene regulation during high frequency switching in Candida albicans. Microbiology. 1997;143:279–288. doi: 10.1099/00221287-143-2-279. [DOI] [PubMed] [Google Scholar]
- 33.Srikantha T, Soll D R. A white-specific gene in the white-opaque switching system of Candida albicans. Gene. 1993;131:53–60. doi: 10.1016/0378-1119(93)90668-s. [DOI] [PubMed] [Google Scholar]
- 33a.Srikantha, T., and D. R. Soll. Unpublished data.
- 34.Srikantha T, Chandrasekhar A, Soll D R. Functional analysis of the promoter of the phase-specific WH11 gene of Candida albicans. Mol Cell Biol. 1995;15:1797–1805. doi: 10.1128/mcb.15.3.1797. [DOI] [PMC free article] [PubMed] [Google Scholar]
- 35.Srikantha T, Morrow B, Schröppel K, Soll D R. The frequency of integrative transformation correlates with the transcriptional state of phase-specific genes of Candida albicans. Mol Gen Genet. 1995;246:342–352. doi: 10.1007/BF00288607. [DOI] [PubMed] [Google Scholar]
- 36.Srikantha T, Klapach A, Lorenz W W, Tsai L K, Laughlin L A, Gorman J A, Soll D R. The sea pansy Renilla reniformis luciferase serves as a sensitive bioluminescent reporter for differential gene expression in Candida albicans. J Bacteriol. 1996;178:121–129. doi: 10.1128/jb.178.1.121-129.1996. [DOI] [PMC free article] [PubMed] [Google Scholar]
- 37.Srikantha T, Tsai L K, Soll D R. The WH11 gene of Candida albicansis regulated in two distinct developmental programs through the same transcription activation domains. J Bacteriol. 1997;179:3837–3844. doi: 10.1128/jb.179.12.3837-3844.1997. [DOI] [PMC free article] [PubMed] [Google Scholar]
- 38.Srikantha T, Soll D R. Expression of the two component histidine kinase regulator CaNIK1 of Candida albicansis regulated by switching and dimorphism. Microbiology. 1998;144:2715–2729. doi: 10.1099/00221287-144-10-2715. [DOI] [PubMed] [Google Scholar]
- 39.Tsuboi R, Ogawa H, Bramono K, Richardson M D, Shankland G S, Crozier W J, Sei Y, Ninomiya J, Nakabayashi A, Takaiuchi I, Payne C D, Ray T. Pathogenesis of superficial mycoses. J Med Vet Mycol. 1994;32(Suppl. 1):91–104. doi: 10.1080/02681219480000751. [DOI] [PubMed] [Google Scholar]
- 40.Vargas K, Wertz P W, Drake D, Morrow B, Soll D R. Differences in adhesion of Candida albicans3153A cells exhibiting switch phenotypes to buccal epithelium and stratum corneum. Infect Immun. 1994;62:1328–1335. doi: 10.1128/iai.62.4.1328-1335.1994. [DOI] [PMC free article] [PubMed] [Google Scholar]
- 40a.Vargas, K., and D. R. Soll. Unpublished data.
- 41.Watts H J, Cheah F S, Hube B, Sanglard D, Gow N A. Altered adherence in strains of Candida albicansharboring null mutations in secreted aspartic proteinase genes. FEMS Microbiol Lett. 1998;159:129–135. doi: 10.1111/j.1574-6968.1998.tb12851.x. [DOI] [PubMed] [Google Scholar]
- 42.White T C, Miyasaki S H, Agabian N. Three distinct secreted aspartyl proteinases in Candida albicans. J Bacteriol. 1993;175:6126–6133. doi: 10.1128/jb.175.19.6126-6133.1993. [DOI] [PMC free article] [PubMed] [Google Scholar]
- 43.Wright R J, Carne A, Hieber A D, Lamont I L, Everson G W, Sullivan P A. A second gene for secreted aspartate proteinase in Candida albicans. J Bacteriol. 1992;174:7848–7853. doi: 10.1128/jb.174.23.7848-7853.1992. [DOI] [PMC free article] [PubMed] [Google Scholar]


