

Abstract
Aims
Automated interpretation of electrocardiograms (ECGs) using deep neural networks (DNNs) has gained much attention recently. While the initial results have been encouraging, limited attention has been paid to whether such results can be trusted, which is paramount for their clinical implementation. This study aims to systematically investigate uncertainty estimation techniques for automated classification of ECGs using DNNs and to gain insight into its utility through a clinical simulation.
Methods and results
On a total of 526 656 ECGs from three different datasets, six different methods for estimation of aleatoric and epistemic uncertainty were systematically investigated. The methods were evaluated based on ranking, calibration, and robustness against out-of-distribution data. Furthermore, a clinical simulation was performed where increasing uncertainty thresholds were applied to achieve a clinically acceptable performance. Finally, the correspondence between the uncertainty of ECGs and the lack of interpretational agreement between cardiologists was estimated. Results demonstrated the largest benefit when modelling both epistemic and aleatoric uncertainty. Notably, the combination of variational inference with Bayesian decomposition and ensemble with auxiliary output outperformed the other methods. The clinical simulation showed that the accuracy of the algorithm increased as uncertain predictions were referred to the physician. Moreover, high uncertainty in DNN-based ECG classification strongly corresponded with a lower diagnostic agreement in cardiologist’s interpretation (P < 0.001).
Conclusion
Uncertainty estimation is warranted in automated DNN-based ECG classification and its accurate estimation enables intermediate quality control in the clinical implementation of deep learning. This is an important step towards the clinical applicability of automated ECG diagnosis using DNNs.
Keywords: Electrocardiogram, Deep learning, Uncertainty, Triage, Clinical implementation
Graphical Abstract

Introduction
Worldwide, more than 300 million electrocardiograms (ECGs) are annually acquired, making it the most widespread cardiological diagnostic test in use. The ECG is utilized in daily clinical practice to diagnose a wide range of potentially life-threatening abnormalities and its correct interpretation requires expert knowledge from an experienced cardiologist, which might not always be directly available. Moreover, the massive number of ECGs acquired places a considerable logistic burden on the clinical routine.1 Computerized interpretation of the ECG (CIE) has become increasingly important in supporting clinical practice. However, CIE has not yet been able to reach cardiologist-level accuracy, and over-reading automated ECG interpretations remains necessary.2
Substantial improvement in CIE is forthcoming with the development of deep learning algorithms that can learn abstract features from the raw ECG signal without the need for laborious hand-crafted feature extraction. Recent studies have shown encouraging results of deep neural networks (DNNs) applied to ECGs, ranging from detection of selected arrhythmias or conduction disorders to comprehensive interpretation for automatic triage.3–5 While such reports have demonstrated the efficacy of deep learning in ECG analysis, there are additional challenges to be addressed before deep learning-based methods can be deployed in clinical practice.6
One such challenge is found in the fact that current deep learning models are architecturally forced to provide an output that translates to a diagnosis or prediction, while not reporting back to the user the degree to which such output might be uncertain (i.e. to which degree the model does not know the output is indeed correct). This output is provided even when the model has not seen the input before. Therefore, all prior deep learning models reported have been promoted without any evaluation or management of the uncertainty associated with their estimations.7,8 It has been argued that the Softmax output (the probability distribution of predicted classes) of a regular DNN can also be interpreted as a measure of uncertainty. However, research has shown that this produces erroneous predictions with high confidence on unseen data and is therefore unsuitable for safety-critical applications.9
In clinical practice, expert clinicians consult colleagues or literature when confronted with complex cases that carry diagnostic uncertainty, which is then addressed through re-evaluation and consensus. Accordingly, it is highly desirable for deep learning algorithms employed in CIE to report some measure of uncertainty along with their diagnostic or predictive output so that equivocal cases can be re-evaluated by an experienced cardiologist.
For any diagnostic or predictive model, there are two distinct causes for the uncertainty of its prediction. These two are referred to as aleatoric and epistemic uncertainty (Supplementary material online, Figure S1).10 Aleatoric uncertainty arises from noise inherent in the data, such as high-frequency noise, lead reversals, baseline drift, or borderline cases present in the ECG recording and can therefore not be reduced by further data collection. Alternatively, epistemic uncertainty is caused by a lack of knowledge from the algorithm, which for instance has not been exposed to a specific (disease) pattern during training. Epistemic uncertainty can therefore be reduced by further exposure of the model to additional data. Both types of uncertainty influence the confidence associated with a model’s output and several different approaches exist to estimate aleatoric and epistemic uncertainty. However, to the best of our knowledge, none of these have been applied to DNN-based CIE.11
In this study, we aimed to systematically investigate the feasibility and performance of multiple uncertainty estimation methods for deep learning-based ECG analysis across different local and publicly available datasets and tasks. Additionally, we show which methods are the most useful to improve the clinical value of these algorithms through a clinical simulation.
Methods
Training data acquisition
Three 12-lead ECGs datasets were used to evaluate the uncertainty estimation methods. The UMCU-Triage and UMCU-Diagnose datasets were used to compare methods between an easier (UMCU-Diagnose) and challenging (UMCU-Triage) task. The publicly available CPSC2018 dataset was employed to increase the reproducibility of our experiments and to compare results between a small (CPSC2018) and large (UMCU-Diagnose) dataset. The UMCU-Triage and UMCU-Diagnose datasets contain standard 12-lead ECGs acquired between January 2000 and August 2019 on all non-cardiology wards and outpatient clinics, the Intensive Care Unit and the Emergency Department of the University Medical Center Utrecht (UMCU, Utrecht, the Netherlands). The ECGs were acquired using a General Electric MAC 5500 (GE Healthcare, Chicago, IL, USA) and raw 10 s 12-lead ECG data waveforms were utilized. Extracted data were de-identified in accordance with the EU General Data Protection Regulation and written informed consent was waived by the ethical committee. All ECGs were interpreted by a cardiologist or cardiologist-in-training as part of the regular clinical workflow, and structured diagnosis labels were extracted from free-text interpretations using a text-mining algorithm described previously.3 The CPSC2018 dataset was described in detail elsewhere and contains 12-lead ECGs acquired at 11 different hospitals across China.12
Training data labelling
The UMCU-Triage DNN performs a comprehensive ECG triage task and classifies ECGs into one of four distinct triage categories based on how promptly a cardiologist must be consulted: normal (no consultation necessary), abnormal not acute (low priority consultation), abnormal subacute (moderate priority consultation), and abnormal acute (high priority consultation). The ECG diagnoses and their corresponding triage categories were described before.3 The CPSC2018 and UMCU-Diagnose datasets were used for a specific ECG diagnosis classification task and were annotated with eight ECG diagnoses: normal, atrial fibrillation, left bundle branch block, right bundle branch block, premature atrial contraction, premature ventricular contraction, ST-segment depression, and ST-segment elevation.
Validation data acquisition
The UMCU-Triage dataset was split into training and validation sets in a 95:5% ratio at the individual patient level. The independent test set consisted of 984 randomly sampled ECGs from different patients, annotated by a panel of five practicing senior electrophysiologist–cardiologists.3 All ECGs were interpreted by two blinded annotators, and, in case of disagreement, a third annotator was consulted. A majority vote policy was used to get the final triage class. All patients in the test set were excluded from the training and validation datasets. The UMCU-Diagnose dataset was trained and tested using a random train/validation/test split of 90:5:5% on the patient level. The CPSC2018 data was divided according to a 90:10% train/validation split, and testing was performed with the official CPSC2018 test data which contains 300 ECGs.11
Deep neural network architecture
The base DNN architecture used in all experiments was based on an Inception Residual Network, which was described before by Van de Leur et al.3 This model consists of 37 dilated single-dimensional convolutional layers, which convolve along the time-axis of the ECG (Supplementary material online, Figure S2). The models were trained using the Adam optimizer with a learning rate of 0.0005.13 Training was performed for 20 epochs, using mini-batches of size 128. To counteract class-imbalance in the data, the focal loss was used as the loss function with focusing parameter set to .14 Complementary architecture details are provided in the Supplementary material online, Methods.
Uncertainty estimation
Four methods for epistemic uncertainty, two methods for aleatoric uncertainty and their possible combinations were compared. The epistemic methods compared were: Monte Carlo dropout (MCD), Bayesian neural network with variational inference (VI), ensemble (ENS), and snapshot ensemble (SSE).15–19 The aleatoric methods compared were: auxiliary output (AUX) and Bayesian decomposition (BD).10,20,21 The estimation of epistemic uncertainty in all methods works in a similar way: (i) multiple predictions are obtained for a single ECG by training multiple networks (ENS and SSE) or by sampling from the same network (VI and MCD), (ii) the class with the highest mean probability is selected, and (iii) the variance over the probabilities for that class is used as the measure for uncertainty. Aleatoric uncertainty is either modelled directly using an auxiliary output (either independently or combined with ENS, SSE, and MCD) or Bayesian decomposition of the output of a Bayesian network (VI). Thus, for all methods, we get a new probability measure (the mean of the probabilities), referred to as the confidence, and an extra measure of uncertainty (the variance over the probabilities). An overview of the methods is given in Table 1 and Figure 1, and the methods and implementation details are described extensively in the Supplementary material online, Methods and Supplementary material online, Table S1.
Table 1.
Description of evaluated uncertainty estimation methods
| Method | Description |
|---|---|
| Epistemic | |
| Monte Carlo dropout (MCD) | Dropout is kept on during test time, thereby creating a different dropout mask of the network every time a prediction is made. Through making multiple predictions on the same input ECG with differing dropout masks, varying predictions are obtained. The variance within these predictions is the estimated epistemic uncertainty. |
| Simple to implement and can be applied to all existing models without retraining given that dropout was used. | |
| Variational inference (VI) | Weights of the neural network are replaced by distributions, creating a Bayesian neural network. These distributions can be sampled to obtain a set of weights, which can be used to make predictions. Once trained, the distributions are sampled multiple times to obtain multiple sets of weights, which are used to make multiple predictions on the same input ECG. The variance within these predictions functions as the estimated epistemic uncertainty. |
| Theoretically sound approach to uncertainty but requires adjustment of network and training logic and training can be difficult and time-intensive. | |
| Ensemble (ENS) | Multiple the same neural networks are randomly initialized and trained on the same data, resulting in an ensemble of neural networks. After training, each ensemble member predicts on the same input ECG. The predictions are averaged, and the variance within the predictions is the estimated epistemic uncertainty. |
| Simple to implement and can be applied to all existing models but training logic needs slight changes and training demands more time. | |
| Snapshot ensemble (SSE) | The snapshot ensemble method is similar to the normal ensemble, but now only a single neural network is trained. During training, a cyclical learning rate is used, causing the network to converge during lower learning rates, and diverge again when the cycle restarts and learning rate goes up. After training, the snapshot ensemble is created by initializing individual neural networks with the trained weights from epochs where the learning rate was low. The individual members make predictions, and the variance of those predictions is the epistemic uncertainty. |
| Same as ensemble but training time is drastically reduced. | |
| Aleatoric | |
| Auxiliary output (AUX) | The auxiliary output method adds an additional output neuron to the last layer of the neural network for each class. These neurons are tasked with estimating the aleatoric uncertainty. The neurons are incorporated into the loss function during training, and thereby directly learn the aleatoric uncertainty present in the data. Once trained, the value of the auxiliary output neuron corresponding to the predicted class is the estimated aleatoric uncertainty. |
| Possibility to add aleatoric uncertainty estimation to non-Bayesian networks. Simple to implement, requires changing the last layer of the architecture. | |
| Bayesian decomposition (BD) | The Bayesian decomposition method works with the variational inference method. It decomposes the predictive distribution of a Bayesian neural network into an epistemic and aleatoric part directly. |
| Possibility to add aleatoric uncertainty estimation to Bayesian networks. Simple to implement when the network is already Bayesian. | |
Figure 1.

Overview of the uncertainty estimation concept and the epistemic uncertainty estimation methods. All methods work similarly to human uncertainty (in the top box, illustrated as several brains), where there are multiple reviewers interpreting the same electrocardiogram. The uncertainty is then calculated as the variance over these different predictions for the same electrocardiogram. With deep neural networks multiple predictions can be achieved using ensembles (i.e. training the same network multiple times), MC dropout (i.e. removing some nodes randomly during prediction), or variational inference (i.e. sampling from the same network with distributions as weights multiple times).
Next to regular evaluation on data the algorithm was trained on, the uncertainty methods were also evaluated for their ability to detect out-of-distribution (OOD) data, i.e., ECGs containing diagnoses that the network has never been seen before. This could happen when the algorithm is applied in a new setting with a different disease distribution than in the training dataset. OOD data were created by excluding ECGs of a specific class during training and adding those ECGs to the test set. The OOD classes were ECGs with acute arrhythmias (such as ventricular tachycardia) for UMCU-Triage (part of the abnormal acute class) dataset and atrial fibrillation for UMCU-Diagnose and CPSC2018 datasets.
Clinical simulation
A clinical scenario was simulated where a DNN is applied in a clinical setting with different thresholds (Figure 2). In this simulation, every ECG is first classified by the DNN and the corresponding uncertainty estimate is obtained. Next, the results were split into a trusted and rejected group by applying a threshold based on the estimated uncertainty. This ensures that only ECGs with certain predictions are trusted, and uncertain ECGs can be then evaluated by a cardiologist. The performance of the trusted predictions was evaluated using the accuracy for every threshold. For the OOD setting, the influence of the threshold on the rate of rejection of the OOD class was visualized. The clinical simulation was performed using the same test sets as the other experiments.
Figure 2.

Flowchart of the possible clinical implementation. The deep neural network provides a certainty value first, which is compared with a predefined threshold. Only interpretations where the deep neural network is certain about are then automatically interpreted. The uncertain electrocardiograms are interpreted by the physician. This example shows an incorrect prediction by algorithm, where subtle ST-depressions are interpreted as aspecific ST-segment abnormalities. Due to the low certainty, this example will be passed on the physician for interpretation, that classified it as acute.
Correspondence with cardiologist’s lack of agreement
We investigated whether predictions regarding ECGs which the uncertainty estimation methods marked as uncertain, corresponded with the ECGs on which cardiologist’s diagnoses differed. A unique opportunity to perform this evaluation was found in the UMCU-Triage test set since it contains annotations from multiple cardiologists. The agreement between the cardiologists was used as a proxy for their diagnostic certainty, which was then compared to the total estimated uncertainty of the DNN on the same ECGs.
Statistical analysis
For each base network, discriminatory performance was evaluated using the macro-averaged one-vs.-one area under the receiver operating characteristic curve. Base network calibration was assessed using calibration plots. The uncertainty estimation methods were evaluated based on ranking, calibration, and robustness against OOD data, followed by a clinical simulation in which uncertain predictions were excluded. The evaluation metrics are described below.
The ranking is concerned with the ordering of uncertainties and evaluates whether high certainty predictions align with high accuracy. The ranking was measured using the Area Under the Confidence-Oracle error (AUCO) metric (also referred to as Area Under the Sparsification Error curve).22,23 The AUCO compares the theoretically best possible ordering based on the obtained Brier score to the ordering based on the estimated uncertainty, which are called oracle-error and confidence-error, respectively. The AUCO is then the area between the oracle-error and confidence-error curves, which measures the difference between the perfect ordering and the ordering made by the uncertainty estimation method.
In contrast to ranking, calibration looks at the actual value of the estimated confidence individually, and tests whether the estimates are over- or under-confident. To measure calibration, a calibration plot was created by splitting the mean maximum Softmax probabilities into 10 bins and calculating the accuracy over each bin. A perfectly calibrated model outputs probabilities that match up with the accuracy and would therefore lie on the diagonal. Probabilities above or below the diagonal are referred to as over-confident or under-confident, respectively. Calibration was measured using the Expected Calibration Error (ECE), which quantifies the difference on the calibration plot between the model’s confidence and the perfect diagonal.24
The difference in the estimated uncertainty between the ECG where the cardiologists agreed and disagreed was assessed using the median and interquartile range (IQR) and Mann–Whitney U test, as the data were not normally distributed. These were evaluated for the total UMCU-Triage test set and in a per-class fashion. A P-value below 0.05 was considered statistically significant.
Results
Data distribution
The UMCU-Triage and -Diagnose datasets contained 316 987 and 194 880 ECGs, respectively, while the CPSC2018 dataset contained 6877 ECGs. The class distribution in the different datasets is shown in Table 2. The UMCU-Triage test set consisted of 984 ECGs of unique patients of which 418 were normal, 410 abnormal not acute, 80 abnormal subacute, and 76 abnormal acute. The UMCU-Diagnose and CPSC2018 test set consisted of 10 089 and 300 ECGs respectively, with similar distribution to Table 2.
Table 2.
Overview of dataset characteristics
| UMCU-Triage |
UMCU-Diagnose |
CPSC2018 |
||||||
|---|---|---|---|---|---|---|---|---|
| Class | N | % | Class | N | % | Class | N | % |
| Normal | 138 774 | 43.78 | Normal | 109 787 | 56.35 | Normal | 918 | 13.35 |
| Abnormal, not acute | 139 656 | 44.06 | Atrial fibrillation | 20 073 | 10.30 | Atrial fibrillation | 1098 | 15.97 |
| Abnormal, sub-acute | 23 113 | 7.29 | First-degree atrioventricular block | 8411 | 4.32 | First-degree atrioventricular block | 704 | 10.24 |
| Abnormal, acute | 15 444 | 4.87 | Left bundle branch block | 6290 | 3.23 | Left bundle branch block | 207 | 3.01 |
| Right bundle branch block | 13 568 | 6.96 | Right bundle branch block | 1695 | 24.65 | |||
| Premature atrial contraction | 9258 | 4.75 | Premature atrial contraction | 556 | 8.08 | |||
| Premature ventricular contraction | 9580 | 4.92 | Premature ventricular contraction | 672 | 9.77 | |||
| ST-segment depression | 13 538 | 6.85 | ST-segment depression | 825 | 12.00 | |||
| ST-segment elevated | 4375 | 2.24 | ST-segment elevated | 202 | 2.94 | |||
| Total | 316 987 | Total | 194 880 | Total | 6877 | |||
Base network comparison
The mean AUCs of the base DNN and models with uncertainty estimation methods on in-distribution setting were 0.95 ± 0.0044 for the UMCU-Triage dataset, 0.99 ± 0.0016 for the UMCU-Diagnose dataset and 0.92 ± 0.0159 for CPSC2018 dataset. This shows that the models have similar performance and can therefore be compared fairly. In Figure 3, the calibration of the base network on all datasets is shown. The base network’s probability was up to 15% under-confident on the UMCU-Triage and UMCU-Diagnose datasets in the in-distribution setting and up to 30% over-confident on both the in- and OOD setting for the CPSC2018 dataset.
Figure 3.

Calibration of the base network in the in-distribution (A) and out-of-distribution (B) setting for all datasets. In a calibration plot, the predicted probability or confidence of the network is grouped into ten bins from low (i.e. 20–30%) to high (i.e. 90–100%). For all these bins, the accuracy in that bins is calculated. A perfectly calibrated model outputs confidences that match up exactly with the accuracy. A model which predicts higher probabilities than the accuracy is over-confident, which can be observed by a line that falls under the diagonal. An under-confident model is the opposite and lies above the diagonal. The base models without uncertainty estimation are op to 30% over- or under-confident.
Ranking
The VI model obtained the best-ranking score among the models with a single uncertainty estimation method on the in-distribution setting of UMCU-Triage (Table 3). When combined with BD, ranking improved significantly, and VI+BD obtained the best ranking scores on both in- and OOD setting. The best performing uncertainty estimation methods for UMCU-Diagnose were VI, ENS, VI+BD, and ENS+AUX for the in-distribution, and MCD for the OOD setting. For CPSC2018, the ENS model obtained the lowest AUCO on in-distribution setting, and VI+BD on the OOD setting. When comparing between in and OOD setting, the AUCO for OOD data was generally higher than in the in-distribution setting. In Table 3, all AUCO scores are displayed. The ranking plots for all datasets are displayed in Supplementary material online, Figures S3–S5.
Table 3.
Ranking performance measured using area under the confidence-oracle error (AUCO)
| Method | Uncertainty type | UMCU-Triage |
UMCU-Diagnose |
CPSC2018 |
|||
|---|---|---|---|---|---|---|---|
| In-dist. | OOD | In-dist. | OOD | In-dist. | OOD | ||
| None | — | 0.05 | 0.07 | 0.02 | 0.04 | 0.21 | 0.28 |
| MCD | Epistemic | 0.11 | 0.15 | 0.03 | 0.03 | 0.15 | 0.20 |
| VI | Epistemic | 0.08 | 0.10 | 0.02 | 0.04 | 0.20 | 0.17 |
| ENS | Epistemic | 0.11 | 0.10 | 0.02 | 0.04 | 0.14 | 0.22 |
| SSE | Epistemic | 0.11 | 0.10 | 0.03 | 0.04 | 0.24 | 0.28 |
| AUX | Aleatoric | 0.10 | 0.09 | 0.07 | 0.08 | 0.18 | 0.23 |
| MCD+AUX | Total | 0.09 | 0.12 | 0.03 | 0.04 | 0.18 | 0.31 |
| VI+BD | Total | 0.06 | 0.07 | 0.02 | 0.04 | 0.20 | 0.15 |
| ENS+AUX | Total | 0.08 | 0.10 | 0.02 | 0.04 | 0.16 | 0.26 |
| SSE+AUX | Total | 0.12 | 0.10 | 0.05 | 0.04 | 0.26 | 0.42 |
The AUCO is the difference between a perfect ranking. The AUCO of individual epistemic uncertainty estimation methods is improved when combined with a method for estimating aleatoric uncertainty. Bold values denote the lowest value in that dataset.
AUX, auxiliary output; BD, Bayesian decomposition; ENS, ensemble; MCD, Monte-Carlo dropout; OOD, out-of-distribution; SSE, snapshot ensemble; VI, variational inference.
Calibration
The ECEs for all uncertainty estimation methods were lower than the base network, with the auxiliary output method on the CPSC2018 dataset being the only exception (Table 4). On UMCU-Triage, the best-calibrated method was the SSE+AUX for both in-distribution and OOD setting. For UMCU-Diagnose, the lowest ECEs were obtained by the VI, AUX, and VI+BD methods on the in-distribution setting, and MCD+AUX, ENS+AUX, and SSE+AUX on OOD setting. For the CPSC2018 dataset, SSE, ENS+AUX, and SSE+AUX were the most calibrated methods on in-distribution, and the ENS+AUX model obtained the lowest ECE on OOD setting. Table 4 shows the calibration results and calibration plots for all methods and datasets are shown in Supplementary material online, Figures S6–S8.
Table 4.
Calibration measured in Expected Calibration Error
| Method | Uncertainty | UMCU-Triage |
UMCU-Diagnose |
CPSC2018 |
|||
|---|---|---|---|---|---|---|---|
| In-dist. | OOD | In-dist. | OOD | In-dist. | OOD | ||
| None | — | 0.11 | 0.10 | 0.09 | 0.03 | 0.17 | 0.25 |
| MCD | Epistemic | 0.08 | 0.05 | 0.06 | 0.04 | 0.07 | 0.12 |
| VI | Epistemic | 0.07 | 0.08 | 0.02 | 0.06 | 0.09 | 0.11 |
| ENS | Epistemic | 0.06 | 0.07 | 0.03 | 0.04 | 0.09 | 0.18 |
| SSE | Epistemic | 0.05 | 0.04 | 0.04 | 0.04 | 0.06 | 0.09 |
| AUX | Aleatoric | 0.04 | 0.05 | 0.02 | 0.05 | 0.18 | 0.26 |
| MCD+AUX | Total | 0.07 | 0.07 | 0.03 | 0.04 | 0.14 | 0.24 |
| VI+BD | Total | 0.07 | 0.08 | 0.02 | 0.06 | 0.09 | 0.11 |
| ENS+AUX | Total | 0.08 | 0.07 | 0.04 | 0.04 | 0.06 | 0.06 |
| SSE+AUX | Total | 0.03 | 0.03 | 0.04 | 0.04 | 0.06 | 0.07 |
The acquired Expected Calibration Errors are lower for models with uncertainty estimation compared to the base model without uncertainty estimation. Bold values denote the lowest value in that dataset.
AUX, auxiliary output; BD, Bayesian decomposition; ENS, ensemble; MCD, Monte-Carlo dropout; SSE, snapshot ensemble; VI, variational inference.
Clinical simulation
The clinical simulation uncertainty threshold plot for the UMCU-Triage dataset in the in-distribution setting is displayed in Figure 4. The results show that the exclusion of uncertain ECGs improves the accuracy of all models. The VI+BD model had the steepest upward slope, and thus excluded the uncertain ECGs the fastest, thereby increasing overall model accuracy at the highest rate. Within Table 5, the accuracies of the models with uncertainty thresholds applied at 25%, 50%, and 75% are displayed for the in-distribution setting, and in Table 6 for the OOD setting. The accuracy of all models increased when estimated uncertain samples were removed.
Figure 4.
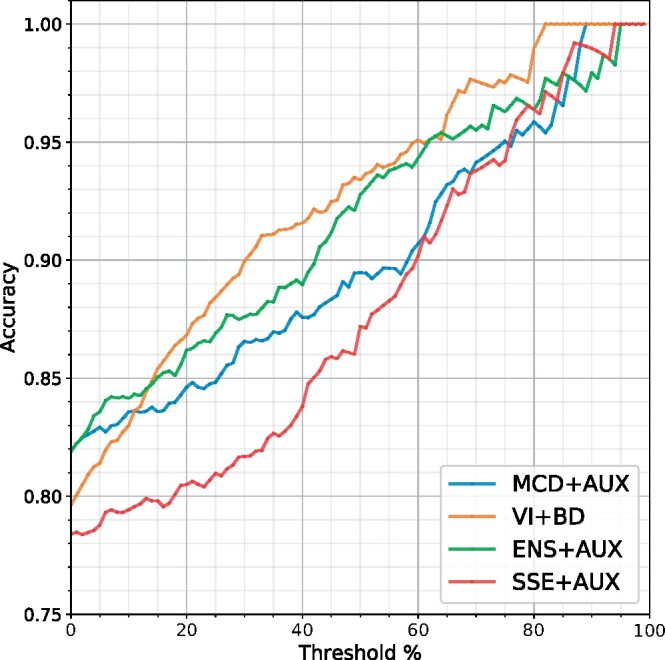
Clinical simulation with accuracies of predictions as a function of excluding uncertain electrocardiograms on the in-distribution setting of the UMCU-Triage dataset. The threshold percentage corresponds to the percentage of data that needs to be evaluated by a physician after exclusion. Through excluding uncertain electrocardiograms, accuracy of all models improved. The VI+BD model had the steepest upward slope, and thus excluded the uncertain electrocardiograms the fastest, thereby increasing overall model accuracy at the highest rate. AUX, auxiliary output; BD, Bayesian decomposition; ENS, ensemble; MCD, Monte-Carlo dropout; SSE, snapshot ensemble; VI, variational inference.
Table 5.
Accuracy scores for non-thresholded (0%) and thresholded (25%, 50%, 75%) predictions on all datasets on in-distribution setting
| Method | UMCU-Triage |
UMCU-Diagnose |
CPSC2018 |
|||||||||
|---|---|---|---|---|---|---|---|---|---|---|---|---|
| 0% | 25% | 50% | 75% | 0% | 25% | 50% | 75% | 0% | 25% | 50% | 75% | |
| MCD | 0.82 | 0.86 | 0.88 | 0.90 | 0.92 | 0.96 | 0.98 | 1.00 | 0.69 | 0.76 | 0.88 | 0.93 |
| VI | 0.80 | 0.85 | 0.91 | 0.98 | 0.91 | 0.97 | 0.99 | 1.00 | 0.70 | 0.74 | 0.77 | 0.87 |
| ENS | 0.81 | 0.85 | 0.88 | 0.90 | 0.92 | 0.97 | 0.99 | 1.00 | 0.73 | 0.82 | 0.91 | 0.93 |
| SSE | 0.81 | 0.83 | 0.88 | 0.93 | 0.91 | 0.96 | 0.99 | 1.00 | 0.66 | 0.65 | 0.71 | 0.73 |
| AUX | 0.81 | 0.84 | 0.88 | 0.96 | 0.92 | 0.95 | 0.95 | 0.95 | 0.71 | 0.75 | 0.87 | 0.93 |
| MCD+AUX | 0.82 | 0.85 | 0.89 | 0.95 | 0.92 | 0.96 | 0.99 | 1.00 | 0.72 | 0.79 | 0.85 | 0.93 |
| VI+BD | 0.80 | 0.88 | 0.93 | 0.98 | 0.91 | 0.98 | 0.99 | 1.00 | 0.70 | 0.73 | 0.79 | 0.89 |
| ENS+AUX | 0.82 | 0.87 | 0.93 | 0.96 | 0.92 | 0.98 | 0.99 | 1.00 | 0.73 | 0.77 | 0.83 | 0.95 |
| SSE+AUX | 0.78 | 0.81 | 0.87 | 0.94 | 0.91 | 0.95 | 0.97 | 0.99 | 0.66 | 0.67 | 0.75 | 0.81 |
Predictions are thresholded by removing 25%, 50%, and 75% of the estimated most uncertain samples. Model accuracy increases for all methods and dataset when uncertain samples are removed. Bold values denote the highest value in that dataset.
AUX, auxiliary output; BD, Bayesian decomposition; ENS, ensemble; MCD, Monte-Carlo Dropout; SSE, snapshot ensemble; VI, variational inference.
Table 6.
Accuracy scores for non-thresholded (0%) and thresholded (25%, 50%, 75%) predictions on all datasets on out-of-distribution setting
| Method | UMCU-Triage |
UMCU-Diagnose |
CPSC2018 |
|||||||||
|---|---|---|---|---|---|---|---|---|---|---|---|---|
| 0% | 25% | 50% | 75% | 0% | 25% | 50% | 75% | 0% | 25% | 50% | 75% | |
| MCD | 0.80 | 0.82 | 0.83 | 0.87 | 0.82 | 0.94 | 0.99 | 1.00 | 0.59 | 0.66 | 0.80 | 0.88 |
| VI | 0.81 | 0.86 | 0.90 | 0.93 | 0.81 | 0.93 | 0.98 | 1.00 | 0.61 | 0.70 | 0.79 | 0.93 |
| ENS | 0.82 | 0.87 | 0.89 | 0.93 | 0.83 | 0.92 | 0.98 | 1.00 | 0.62 | 0.69 | 0.83 | 0.88 |
| SSE | 0.80 | 0.85 | 0.90 | 0.93 | 0.82 | 0.92 | 0.98 | 1.00 | 0.56 | 0.56 | 0.61 | 0.77 |
| AUX | 0.80 | 0.85 | 0.91 | 0.96 | 0.82 | 0.92 | 0.95 | 0.96 | 0.60 | 0.68 | 0.78 | 0.85 |
| MCD+AUX | 0.80 | 0.84 | 0.89 | 0.92 | 0.82 | 0.94 | 0.99 | 0.99 | 0.57 | 0.63 | 0.71 | 0.81 |
| VI+BD | 0.81 | 0.88 | 0.93 | 0.97 | 0.81 | 0.93 | 0.99 | 1.00 | 0.61 | 0.72 | 0.84 | 0.93 |
| ENS+AUX | 0.81 | 0.88 | 0.90 | 0.93 | 0.83 | 0.93 | 0.99 | 1.00 | 0.61 | 0.60 | 0.62 | 0.84 |
| SSE+AUX | 0.79 | 0.83 | 0.90 | 0.95 | 0.82 | 0.93 | 0.98 | 0.99 | 0.58 | 0.57 | 0.57 | 0.53 |
Predictions are thresholded by removing 25%, 50%, and 75% of the estimated most uncertain samples. Model accuracy increases for all methods and dataset when uncertain samples are removed, except for the model with SSE+AUX. Bold values denote the highest value in that dataset.
AUX, auxiliary output; BD, Bayesian decomposition; ENS, ensemble; MCD, Monte-Carlo Dropout; SSE, snapshot ensemble; VI, variational inference.
In Figure 5, the normalized per-class thresholding plots for the VI+BD and ENS+AUX models on the UMCU-Diagnose dataset are shown. The ECGs containing atrial fibrillation are of average uncertainty in the in-distribution setting, but in the OOD setting where the models have never seen atrial fibrillation before, the ECGs with atrial fibrillation are marked with high uncertainty, and thereby removed at the fastest rate. Plots for the other datasets are shown in Supplementary material online, Figures S9 and S10.
Figure 5.

Normalized per-class thresholding plots of the VI+BD (A, B) and ENS+AUX (C, D) models on the UMCU-Diagnose dataset. The first column (A, C) is for the in-distribution setting, the second column (B, D) is for the out-of-distribution setting. Classes with high uncertainty are removed first and have a steep downward slope. In the in-distribution plots (A, C), the model was trained on all classes, including atrial fibrillation. These plots show that the algorithm is certain about prediction atrial fibrillation, as these samples are excluded slower than other classes. In the out-of-distribution plots (B, D), the algorithm was trained on a dataset that contained no atrial fibrillation electrocardiograms. These plots show that the model is now very uncertainty about this unseen class, as it excludes the atrial fibrillation electrocardiograms first. AF, atrial fibrillation; I-ABV, first degree atrioventricular block; LBBB, left bundle branch block; PAC, premature atrial contraction; PVC, premature atrial contraction; RBBB, right bundle branch block; STD, ST-depression; STE, ST-elevation.
Correspondence with cardiologist’s lack of agreement
The cardiologists showed moderate agreement on the triage class in the UMCU-Triage expert test set and agreed on 736 of the 984 ECGs (75%, Cohen’s kappa 0.60, P < 0.001). The highest agreement was observed in the normal class (77%) and the lowest in the abnormal acute class (61%). The total certainty was lower for ECGs in which cardiologists’ annotations did not agree (median 39%, IQR 43%) as compared to ECGs in which cardiologists did agree (median 55%, IQR 50%, overall P < 0.001). The certainty was the highest for the normal class (median 73%, IQR 40%) and the lowest for the abnormal acute class (median 22%, IQR 26%). The consensus of the panel of cardiologists is plotted against the median total uncertainty per class for the VI+BD method in Figure 6.
Figure 6.

Correspondence of uncertainty with cardiologist’s lack of agreement. The electrocardiograms in the expert test set of UMCU-Triage are grouped by consensus between two cardiologists and compared with the estimated uncertainty for these electrocardiograms, both per-class and overall. The algorithm is more certain about electrocardiograms where the cardiologists agreed. Moreover, the algorithm is most certain about the normal electrocardiograms and least certain about the abnormal, acute electrocardiograms, which is also the smallest class. **P < 0.01, **** P < 0.0001. ns, not significant.
Discussion
This study is the first to systematically investigate the feasibility and performance of uncertainty estimation methods for the automated classification of ECGs using DNNs. Our calibration results documented that the regular DNN is up to 30% either over- or under-confident, stressing the need for adequate uncertainty estimation (Figure 3). We demonstrated how implementing uncertainty estimation improves both calibration and ranking across datasets with differing sizes and tasks. The proposed methods therefore provide an improved and better-calibrated probability measure together with an additional uncertainty measure. While pressure testing this new uncertainty measure in a safe and insightful clinical simulation, we showed that by thresholding the uncertainty estimates and thereby rejecting uncertain ECGs markedly improves accuracy in the remaining data. Furthermore, out-of-distribution ECG diagnoses that the algorithm has not seen during training are rejected faster. Finally, these uncertainties were shown to significantly correlate with the disagreement that exists between cardiologists in clinical ECG interpretation.
When implementing new technologies into clinical practice, knowing its limitations is of the utmost importance, especially if the technology concerns ‘black-box’ algorithms such as DNNs. Surprisingly, while there is a rapid growth of publications on DNNs that perform ECG analyses, we found none that included uncertainty estimations. When training a DNN for a specific task such as ECG interpretation, the algorithm is constitutionally forced to accept every input and assign it to an output, even in the cases where the algorithm’s estimations carry great uncertainty. The results from the DNNs without uncertainty estimation in this study showed that the network was under-confident on the large UMCU-Triage and UMCU-Diagnose dataset, while over-confident on the relatively small CPSC2018 dataset. Such discrepancies, if left unchecked, could potentially lead to unfavourable or potentially dangerous situations when applied in a clinical setting where a patient could be wrongly diagnosed by a DNN prediction with high Softmax probability. These findings demonstrate that out-of-the-box DNN predictions should not be blindly trusted without estimating their prediction uncertainty. In our opinion, incorporating the estimation of the uncertainty of DNN predictions is therefore an essential prerequisite when applying an algorithm into clinical practice.
Uncertainty estimation techniques
The variety of estimation methods employed (and their combinations) allowed us to extensively investigate their comparative performance. In the ranking results for the UMCU-Triage dataset, we demonstrated that when comparing models with only epistemic uncertainty estimation methods to models with both epistemic and aleatoric uncertainty estimation, the ranking improves for the latter. Therefore, it seems that aleatoric uncertainty is beneficial to the ranking score on a large dataset such as UMCU-Triage. This is in line with earlier work stating that aleatoric uncertainty is more important for large datasets because all the epistemic uncertainty has been taken away through providing the network with enough training data.10 It is therefore important to model aleatoric uncertainty when dealing with large datasets. Regarding the calibration results, we found that the ECEs for all networks with uncertainty estimation methods were lower than the ECEs of the baseline network. Thus, calibration performance improved noticeably in all the networks that employed uncertainty estimation. These findings clearly demonstrate the benefits of modelling uncertainty for the calibration of a DNN. When comparing the calibration scores on the small CPSC2018 dataset, we observed that the ECE of the AUX model was the largest out of all models. The only model with uncertainty estimation that performed worse than the base network was thus a model that only modelled aleatoric uncertainty, whereas all other models that have epistemic uncertainty estimation improved upon the base network. This strongly suggests that it may be more important to model epistemic uncertainty for small datasets because there is still much epistemic uncertainty present after training, which is confirmed in earlier work.10
Therefore, through our experiments, we found that epistemic uncertainty should be modelled for small datasets and aleatoric uncertainty for large datasets. Preferably, however both should be modelled, which is why we only consider models that estimated both types of uncertainty. From these models, the MCD+AUX model displayed large over-confidence on the OOD setting of CPSC2018 (as shown in Table 4) and is therefore not recommended. The SSE+AUX model’s showed poor ranking in all datasets in both the in-distribution and OOD datasets and this model is therefore also not recommended. Overall, the VI+BD and ENS+AUX models performed best for improving ranking and calibration across datasets and tasks in both the in-distribution and OOD setting and are therefore recommended as a starting point in similar ECG diagnosis settings. However, further research is needed to confirm the generalizability of our results in other settings.
Our findings for the ENS method align with recent research where this method also performed best out of the tested uncertainty estimation methods. However, the results for the VI method differ from these studies, that found VI to perform best on small datasets but was outperformed by other methods on the large ImageNet dataset.11,25 We believe the difference in outcomes is due to the fact that all our datasets are an order of magnitude smaller than ImageNet, and we therefore do not observe the same effect. Finally, one study recommended the MCD method; however, they did not perform testing on OOD data, which is where we found the method to be over-confident.11
Clinical simulation
In our analyses, the accuracy of all models increased when estimated uncertain samples were removed (Tables 5 and 6, Figure 4). These findings show that the estimated uncertainty can be used as a threshold, so only certain samples are ultimately classified by an actually accurate model. Such an implementation is highly attractive in a clinical setting, so that the ECGs with high estimated uncertainty (which the network is prone to misdiagnose), can be passed on to a cardiologist for further analysis. The thresholds for when to trust the network and when to consult a cardiologist can be set according to the required accuracy for the specific task or setting. Employing a clinical workflow with such an intermediate ‘quality control’ structure is envisioned to greatly reduce clinical workload while maintaining or improving the quality of diagnoses.
Both the recommended VI+BD and ENS+AUX methods perform well in quickly increasing accuracy in the group with trusted classifications when the threshold increases, both in an in-distribution and OOD setting (Tables 5 and 6, Figure 4). For the UMCU-Diagnose dataset’s in-distribution setting, an uncertainty threshold of only 25% results in a near-perfect accuracy of 98% in the trusted group (Table 5). For the UMCU-Triage task, which is more difficult than predicting a single diagnostic statement, we observed that 75% of the ECGs needed to be excluded to gain the same near-perfect accuracy. This indicates that the network is more uncertain about this task. The same holds for the CPSC2019 dataset, where the high uncertainty is likely due to the small sample size. The thresholded OOD results revealed that after excluding 25% of uncertain samples, most of the obtained accuracies returned to normal in-distribution levels, hinting that the bulk of the OOD data had been excluded (Table 6). This exhibits the possibility of excluding new or rare diseases present in the ECG which the DNN had not seen before.
After training, an uncertainty estimation method is expected to ascribe high uncertainty to predictions on the unseen OOD class. When focusing on the OOD class specifically, the per-class thresholding plots (Figure 5) for the UMCU-Diagnose dataset show that the VI+BD and ENS+AUX methods estimated a higher uncertainty for the OOD ECGs compared to in-distribution ECGs. This finding suggests that the uncertainty estimation methods correctly detected the OOD ECGs, by ascribing them high uncertainty. However, the uncertainty does not increase further when the OOD ECGs already belong to the most uncertain class, as observed for the UMCU-Triage dataset in Supplementary material online, Figure S9. Furthermore, the OOD ECGs are not always identified as most uncertain, as is the case for the ENS+AUX method on the CPSC2018 dataset shown in Supplementary material online, Figure S10. However, when comparing the obtained AUCO scores between in-distribution and OOD setting, it was also observed that the AUCOs for the OOD setting are generally higher, suggesting that introducing OOD data can degrade ranking. The tested uncertainty estimation methods are therefore not completely robust against OOD data, and this remains a point of improvement.
Correspondence with cardiologist’s lack of agreement
Most interestingly, uncertainty was shown to significantly correlate with the lack of diagnostic agreement encountered even between experienced cardiologists when interpreting an ECG. This seems to suggest that the cardiologists and DNNs may struggle with the similar complex patterns in challenging ECGs, either due to aleatoric uncertainty caused by noise or borderline cases inherent in the data or through epistemic uncertainty of ECGs with rare abnormalities. This notion represents a solid step towards confident clinical deployment based on the assurance that uncertainty estimation methods function as expected and align with cardiologists on what is most worth their restricted clinical time.
Limitations
This study has several limitations to address. First of all, the test-sets of UMCU-Triage and CPSC2018 were small, and results on these datasets are therefore prone to stochasticity. Secondly, the OOD class on the UMCU-Triage test set only constituted 1.8% of the data, which complicated the interpretation of the thresholding results. Thirdly, the ECGs in the CPSC2018 dataset are of varying length between 6 and 60 s. We extracted only the first 10-s and zero-padded ECGs which were shorter, which could potentially lead to missing features in the ECG. Fourthly, experiments were performed on a single DNN architecture, which reduces the generalizability of the results towards other DNN architectures. Residual convolutional neural networks are, however, the most commonly used in DNN-based analysis of ECGs.26
Clinical perspectives and future work
Our study demonstrated that through uncertainty estimation, we are coming one step closer to applying DNNs in a clinical setting. Firstly, our study dealt with multi-class classification, where only a single class is present in the ECG. However, in the real world, it often occurs that multiple diseases are present within the same ECG. Therefore, it might be interesting to investigate uncertainty estimation for networks that accommodate for multi-label classification too. Secondly, we observed that the average estimated uncertainty differs per class, as displayed in Figure 6. This allows for the setting of class-specific thresholds, because the estimated certainty for a common class lies much higher than for an uncommon class. Future studies should investigate whether novel uncertainty estimation methods could account for these different uncertainty thresholds per class, as this might be necessary for specific clinical problems. Moreover, the effect of pre-training, over-sampling, or data augmentation on uncertainty in imbalanced or small datasets should be investigated. Thirdly, a visualization of the estimated uncertainty could guide cardiologists into understanding why a DNN had difficulties interpreting ECGs. This could be performed using a technique such as Guided Grad-CAM.27 Finally, the estimated uncertainties could also be used to improve DNNs, which can be achieved in two phases. Firstly, it might be used during training as a guide towards parts of the data that the DNN is uncertain about, where cleaning or additional data is necessary. Secondly, during use in clinical practice an active learning workflow is possible, where uncertain ECGs are interpreted by a cardiologist and the DNN continuously improves by learning from these ECGs.
In conclusion, this is the first study to apply and systematically investigate uncertainty estimation techniques on DNN-based CIE. We demonstrated the need for uncertainty estimation and showed that through its implementation, ECGs that a DNN would otherwise classify incorrectly can be excluded and passed on to a cardiologist for further review. Furthermore, we found a strong correlation between estimated uncertainty and disagreement between cardiologists. This study shows the possibility of strengthening the application of DNNs in practice through uncertainty estimation and is an important step towards the clinical applicability of automated ECG diagnosis through deep learning.
Lead author biography

Jeroen Vranken recently received his master's degree in artificial intelligence at the University of Amsterdam. He wrote his thesis on uncertainty estimation for deep learning algorithms in the field of medical artificial intelligence. His interests lie in novel applications of artificial intelligence techniques, with a focus on deep learning, image recognition, and recurrent neural networks. His ambition is to utilize artificial intelligence to make a positive environmental and societal impact.

Rutger van de Leur is a medical doctor and epidemiologist-in-training with a focus on medical statistics and machine learning, currently pursuing a PhD at the University Medical Center Utrecht on the use of deep neural networks for automated interpretation of the ECG. He is interested in innovations for successful implementation of AI into clinical practice and for using deep learning on rare cardiac diseases.
Code availability
Code is made publicly available at: https://github.com/rutgervandeleur/uncertainty.
Supplementary material
Supplementary material is available at European Heart Journal – Digital Health.
Supplementary Material
Acknowledgements
We gratefully acknowledge the support of NVIDIA Corporation with the donation of the Titan Xp GPU used for this research.
Funding
The Netherlands Organisation for Health Research and Development (ZonMw) (104021004).
Conflict of interest: none declared.
Data availability
The CPSC2018 data underlying this article are available at https://doi.org/10.1166/jmihi.2018.2442. The UMCU data cannot be shared publicly due to the privacy of individuals that participated in the study.
References
- 1. Cook DA, Oh S-Y, Pusic MV.. Accuracy of physicians’ electrocardiogram interpretations. Jama Intern Med 2020;180:1461. [DOI] [PMC free article] [PubMed] [Google Scholar]
- 2. Schläpfer J, Wellens HJ.. Computer-interpreted electrocardiograms benefits and limitations. J Am Coll Cardiol 2017;70:1183–92. [DOI] [PubMed] [Google Scholar]
- 3. van de Leur RR, Blom LJ, Gavves E, Hof IE, van der Heijden JF, Clappers NC, et al. Automatic triage of 12-lead electrocardiograms using deep convolutional neural networks. J Am Heart Assoc 2020;9:e015138. [DOI] [PMC free article] [PubMed] [Google Scholar]
- 4. Hannun AY, Rajpurkar P, Haghpanahi M, Tison GH, Bourn C, Turakhia MP, Ng AY. . Cardiologist-level arrhythmia detection and classification in ambulatory electrocardiograms using a deep neural network. Nat Med 2019;25:65–9. 10.1038/s41591-018-0268-330617320 [DOI] [PMC free article] [PubMed] [Google Scholar]
- 5. Ribeiro AH, Ribeiro MH, Paixao GMM, Oliveira DM, Gomes PR, Canazart JA, Canazart, JA Ferreira, MPS Andersson, CR Macfarlane, PW. Meira JW Schön, TB Ribeiro, ALPet al. Automatic diagnosis of the 12-lead ECG using a deep neural network. Nat Commun 2020;11:1760. [DOI] [PMC free article] [PubMed] [Google Scholar]
- 6. van de Leur RR, Boonstra MJ, Bagheri A, Roudijk RW, Sammani A, Taha K, et al. Big data and artificial intelligence: opportunities and threats in electrophysiology. Arrhythmia Electrophysiol Rev 2020;9:146–54. [DOI] [PMC free article] [PubMed] [Google Scholar]
- 7. Ghahramani Z. Probabilistic machine learning and artificial intelligence. Nature 2015;521:452–459. [DOI] [PubMed] [Google Scholar]
- 8. Leibig C, Allken V, Ayhan MS, Berens P, Wahl S.. Leveraging uncertainty information from deep neural networks for disease detection. Sci Rep 2017;7:1–14. [DOI] [PMC free article] [PubMed] [Google Scholar]
- 9. Louizos C, Welling M.. Multiplicative normalizing flows for variational bayesian neural networks. In: Precup TD and Whye Y (eds). Proceedings of the 34th International Conference on Machine Learning (Proceedings of Machine Learning Research; vol. 70). Sydney, Australia: PMLR; 2017. p2218–2227. [Google Scholar]
- 10. Kendall A, Gal Y. What uncertainties do we need in Bayesian deep learning for computer vision? In: Guyon I, Luxburg UV, Bengio S, Wallach H, Fergus R, Vishwanathan S, Garnett R (eds). Advances in Neural Information Processing Systems 30. Long Beach, California, USA; 2017. p5575–5585.
- 11. Filos A, Farquhar S, Gomez AN, Rudner TGJ, Kenton Z, Smith L, et al. A systematic comparison of Bayesian deep learning robustness in diabetic retinopathy tasks. arXiv preprint arXiv:1912.10481. https://arxiv.org/abs/1912.10481 (9 December 2019).
- 12. Ng, EYK, Liu F, Liu C, Zhao L, Zhang X, Wu X, Xu X, Liu, Y, Ma C, Wei S, He Z, Li J. An open access database for evaluating the algorithms of electrocardiogram rhythm and morphology abnormality detection. J Med Imag Health 2018;8:1368–1373. [Google Scholar]
- 13. Kingma DP, Ba J.. Adam: a method for stochastic optimization. In: Bengio Y, LeCun Y (eds). 3rd International Conference on Learning Representations. San Diego, CA, USA: Conference Track Proceedings; 2015. [Google Scholar]
- 14. Lin TY, Goyal P, Girshick R, He K, Dollar P. Focal loss for dense object detection. In: 2017 IEEE International Conference on Computer Vision ICCV, vol. 2017. Venice, Italy; 2017. p2999–3007.
- 15. Gal Y, Ghahramani Z. Dropout as a Bayesian approximation: representing model uncertainty in deep learning. In: Balcan MF, Weinberger KQ (eds). 33rd International Conference on Machine Learning, ICML 2016, vol. 7. New York City, New York, USA; 2016. p1651–1660.
- 16. Blundell C, Cornebise J, Kavukcuoglu K, Wierstra D. Weight uncertainty in neural networks. Proceedings of the 32nd International Conference on Machine Learning, in Proceedings of Machine Learning Research 37. 2015;37. p1613–1622.
- 17. Kingma DP, Salimans T, Welling M. Variational dropout and the local reparameterization trick. In: Cortes C, Lawrence N, Lee D, Sugiyama M, Garnett R (eds). Advances in Neural Information Processing Systems 28 (NIPS 2015).. Montréal, Canada; 2015. p2575–2583.
- 18. Huang G, Li Y, Pleiss G, Liu Z, Hopcroft JE, Weinberger KQ. Snapshot ensembles: train 1, get M for free. In: 5th International Conference on Learning Representations, ICLR 2017 - Conference Track Proceedings. Toulon, France; 2017. p1–14.
- 19. Beluch WH, Genewein T, Nurnberger A, Kohler JM. The power of ensembles for active learning in image classification. In: 2018 IEEE CVF Conference on Computer Vision and Pattern Recognition (CVPR). Salt Lake City, UT, USA; 2018. p9368–9377.
- 20. Depeweg S, Hernandez-Lobato JM, Doshi-Velez F, Udluft S.. Decomposition of uncertainty in Bayesian deep learning for efficient and risk-sensitive learning. In: International Conference on Machine Learning 2018. 2018. p1184-1193.
- 21. Kwon Y, Won JH, Kim BJ, Paik MC. Uncertainty quantification using Bayesian neural networks in classification: application to biomedical image segmentation. Comput Stat Data Anal 2020;142.:106816. 10.1016/j.csda.2019.106816 p106816 [DOI] [Google Scholar]
- 22. Scalia G, Grambow CA, Pernici B, Li Y-P, Green WH. Evaluating scalable uncertainty estimation methods for DNN-based molecular property prediction. Journal of chemical information and modeling. 2020;60(6):2697–717. 2019; 1–52. 10.1021/acs.jcim.9b00975 32243154 [DOI] [PubMed] [Google Scholar]
- 23. Ilg E, Cicek O, Galesso S, Klein A, Makansi O, Hutter F, et al. Uncertainty estimates and multi-hypotheses networks for optical flow. In: Ferrari V, Hebert M, Sminchisescu C, Weiss Y, (eds). Computer Vision – ECCV 2018. Cham: Springer International Publishing; 2018. p. 677–93. 2018. p677–693.
- 24. Naeini MP, Cooper GF, Hauskrecht M.. Obtaining well calibrated probabilities using Bayesian Binning. In: Proceedings of AAAI Conference on Artificial Intelligence, vol. 4. 2015.. p2901–2907. [PMC free article] [PubMed] [Google Scholar]
- 25. Ovadia Y, Fertig E, Ren J, Nado Z, Sculley D, Nowozin S, et al. Can you trust your model’s uncertainty? Evaluating predictive uncertainty under dataset shift. Advances in Neural Information Processing Systems. 2019;32. p13991–14002.
- 26. Hong S, Zhou Y, Shang J, Xiao C, Sun J.. Opportunities and challenges of deep learning methods for electrocardiogram data: a systematic review. Comput Biol Med 2020;122:103801. [DOI] [PubMed] [Google Scholar]
- 27. Selvaraju RR, Cogswell M, Das A, Vedantam R, Parikh D, Batra D. Grad-CAM: visual explanations from deep networks via gradient-based localization. In: 2017 IEEE International Conference on Computer Vision ICCV, vol. 2017. Venice, Italy; 2017. p618–626.
Associated Data
This section collects any data citations, data availability statements, or supplementary materials included in this article.
Supplementary Materials
Data Availability Statement
The CPSC2018 data underlying this article are available at https://doi.org/10.1166/jmihi.2018.2442. The UMCU data cannot be shared publicly due to the privacy of individuals that participated in the study.