Abstract
Aims
Deep learning (DL) has emerged in recent years as an effective technique in automated ECG analysis.
Methods and results
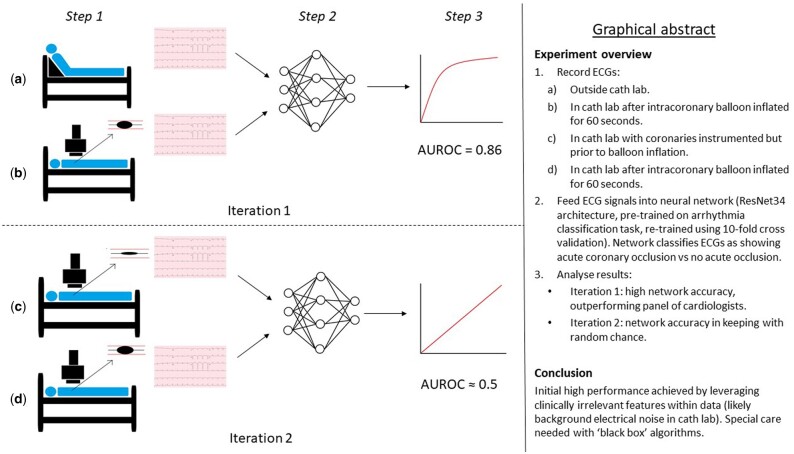
A retrospective, observational study was designed to assess the feasibility of detecting induced coronary artery occlusion in human subjects earlier than experienced cardiologists using a DL algorithm. A deep convolutional neural network was trained using data from the STAFF III database. The task was to classify ECG samples as showing acute coronary artery occlusion, or no occlusion. Occluded samples were recorded after 60 s of balloon occlusion of a single coronary artery. For the first iteration of the experiment, non-occluded samples were taken from ECGs recorded in a restroom prior to entering theatres. For the second iteration of the experiment, non-occluded samples were taken in the theatre prior to balloon inflation. Results were obtained using a cross-validation approach. In the first iteration of the experiment, the DL model achieved an F1 score of 0.814, which was higher than any of three reviewing cardiologists or STEMI criteria. In the second iteration of the experiment, the DL model achieved an F1 score of 0.533, which is akin to the performance of a random chance classifier.
Conclusion
The dataset was too small for the second model to achieve meaningful performance, despite the use of transfer learning. However, ‘data leakage’ during the first iteration of the experiment led to falsely high results. This study highlights the risk of DL models leveraging data leaks to produce spurious results.
Keywords: Deep learning, Artificial intelligence, STEMI, ECG
Graphical Abstract
Introduction
Smith et al.1 noted ST-segment elevation (STE) as an electrocardiogram (ECG) feature following the ligation of coronary arteries in canine models in 1918. Since then, it has become the gold standard bedside test for diagnosing transmural myocardial infarction (MI) caused by acute complete thrombotic coronary occlusion (ACTCO). The decision to activate the primary percutaneous coronary intervention pathway is generally contingent upon its presence.2 The principal rationale for this practice can be summarized thus: (i) STE is known to be very specific for acute MI3 and (ii) patients with STE, on average, benefit from primary PCI where patients with non-STEMI may not.4
However, STE’s sensitivity for acute MI may be as low as 50%5 and there have been few large-scale studies evaluating alternative models for predicting which patients will benefit from primary PCI.6 Furthermore, such attempts have principally focussed on extending urgent revascularization to ‘high risk’ NSTEMIs, generally defined using a very small number of hand-crafted features (sometimes just two or three) and not incorporating ECG features.7,8 It could be argued that such low-dimensional feature representations poorly express the complex physiology of the patient with acute MI, and that an approach incorporating more relevant features might be more effective.
In the domain of atrial fibrillation (AF) detection, DL models have been shown to match ‘expert level’ performance in the context of ambulatory recordings.9 This is the highest possible performance one could expect for a task where the gold standard diagnostic criteria are based on expert interpretation of ECG data. In the domain of acute myocardial ischaemia, on the other hand, it is possible to use composite definitions that do not rely on ECG criteria but incorporate biochemical and angiographic data.3 Therefore, it is plausible that a DL model could not only match but also outperform, existing gold standard ECG criteria.
The aim of this study was to establish whether a DL algorithm can detect ACTCO, as defined by angiographically proven acute coronary occlusion, by leveraging more complex ECG features than a manual approach would allow.
Methods
Data acquisition
ECG signals were downloaded from the STAFF III database (Physionet).10–12 This contains a collection of ECGs taken from 104 patients undergoing prolonged intracoronary balloon inflation. The records consist of nine lead ECGs at 1000 Hz (investigators can calculate the three augmented limb leads if they wish). 76 records contain baseline ECGs obtained in a relaxing room prior to transfer to the theatre. The inflations lasted an average of 262 s, with 84 lasting in excess of 5 min. Annotations contain the time of balloon inflations and deflations, contrast injection times and anatomical position of the balloons.
STAFF III remains one of the most valuable datasets for groups studying the early ECG effects of prolonged, total coronary occlusion in humans. It is the only publicly available dataset that contains angiographically proven acute coronary artery occlusion without pre-selecting subjects based on ECG criteria nor chest pain.
Basic demographic information from the 76 STAFF III subjects included as per the original inclusion criteria (described below) are shown in Table 1.
Table 1.
(First iteration) Demographic details, including subgroups defined by anatomical location of balloon inflation.
| Patient characteristics | All patients | LMS | LAD | Diag | LCx | RCA |
|---|---|---|---|---|---|---|
| Male, n (%) | 51 (67.1) | 2 (100) | 11 (52.4) | 2 (100) | 10 (62.5) | 26 (74.3) |
| Female | 25 | 0 | 10 | 0 | 6 | 9 |
| Age, mean years (range) | 60 (32–100) | 62 (55–70) | 61 (40–85) | 53 (53–54) | 65 (32–100) | 58 (38–80) |
Diag, diagonal branch; LAD, left anterior descending; LCx, left circumflex; LMS, left main stem; RCA, right coronary artery.
Ethical considerations
No ethical issues were identified with this study, as it involved open data from an anonymized, publicly available database. This decision was ratified by the heads of research governance at two of the participating academic centres (Ulster University and Southern Health and Social Care Trust).
Inclusion/exclusion criteria
Initially, only records that included relaxing room ECGs were deemed eligible, as these were used as the non-ischaemic samples. Records where balloon inflations lasted less than 90 s were excluded as they contained insufficient ischaemic samples.
Several subjects underwent multiple inflations in different anatomical locations. Only data from the first inflation was used due to concerns that ‘hangover’ electrical effects from previous inflations may confound results.
The study was executed and written up following completion of this initial protocol. However, following a conversation with a group who have worked extensively with the STAFF III database (including its creator), it was pointed out that the 28 patients excluded because they had no ECG from the relaxing room could be included if the beginning of their theatre ECG (taken prior to catheter insertion) was used as an alternative baseline.
It was decided that the experiment should be re-run with the inclusion criteria thus amended. It was also felt that standardizing the baseline ECG acquisition by using pre-catheterization theatre ECGs for all patients would be more methodologically sound.
Algorithm design
The model was a 34-layer convolutional neural network (CNN) with residual connections culminating in a fully connected layer with a single, sigmoid-activated output node. Researchers from the Stanford Machine Learning Group have identified this architecture as being particularly well-suited to processing ECG signal data,9 and our group has previously presented work using similar models for automated detection of atrial fibrillation (AF).13 The model was initiated using weights from the AF task, on the assumption that many ECG features learned during arrhythmia analysis would improve generalisation in the setting of ischaemia detection. This is known as ‘transfer learning’ and can allow DL models to train for complex tasks on relatively small datasets.14
During the training process, ECG signals were split into 1-s segments. Each ECG window was reshaped into a 9000-dimensional vector (9 leads × 1000 Hz × 1 s). The loss was calculated using binary cross-entropy, where non-ischaemic samples were labelled 0, ischaemic traces 1.
Model evaluation
The model was evaluated using a five-fold cross-validation (CV) process, whereby each of five versions of the model was trained on data from 80% of the patients and tested on data from the remaining 20%. The experiment was subsequently repeated using a 10-fold CV process whereby data was split into 80% training, 10% validation and 10% test sets. This was to ensure the five-fold CV process did not encourage overfitting.
Testing was undertaken using one 10-s trace for each patient taken from the baseline ECG (non-ischaemic examples) and one 10-s trace for each patient taken 60 s into balloon occlusion of a coronary artery (positive examples). Ten seconds was chosen because it is the standard length of printed 12-lead ECGs used to diagnose STEMI and would facilitate a fair comparison with cardiologist-labelled benchmarks.
The input vector for the model comprised a tensor of shape [batch size, 10, 9000]. The final dimension comprised one second of samples for each of nine leads at 1000 Hz concatenated into a 9000-dimensional vector (the augmented limb leads were not explicitly calculated for the model). The penultimate dimension represented the 10 s of the ECG.
Benchmarks
Three consultant cardiologists were given all of the test traces in a random order and asked to label them as showing either no signs of ischaemia, non-specific ischaemic changes, or STE. These results were used as a basis for comparison with the DL model performance as described below.
Statistical analysis
The accuracy of each classifier was calculated by dividing the number of correct labels with the total number of ECGs labelled. The consensus opinion of the three cardiologists regarding both non-specific ischaemic changes and STE was taken to be the current gold standard in clinical practice. This was evaluated against the DL model’s accuracy using the Chi-square test. For each classifier sensitivity, specificity, positive predictive value (PPV), and F1 score (see equation 1 below) were calculated.
A receiver operating characteristic (ROC) curve was plotted for the DL model and area under the ROC (AUROC) calculated.
Interrogating the model
Attention heatmaps were generated using selective input masking. The fully trained model was shown each ECG in the test set with 50 ms segments ‘blanked out’ (by substituting voltage values for zero). The greater the difference between the original prediction and the new prediction, the higher the value assigned to the masked part of the ECG on the heatmap. The process was repeated until a value had been assigned to each 50 ms window of each ECG.
Results
First iteration of the study using original inclusion and exclusion criteria
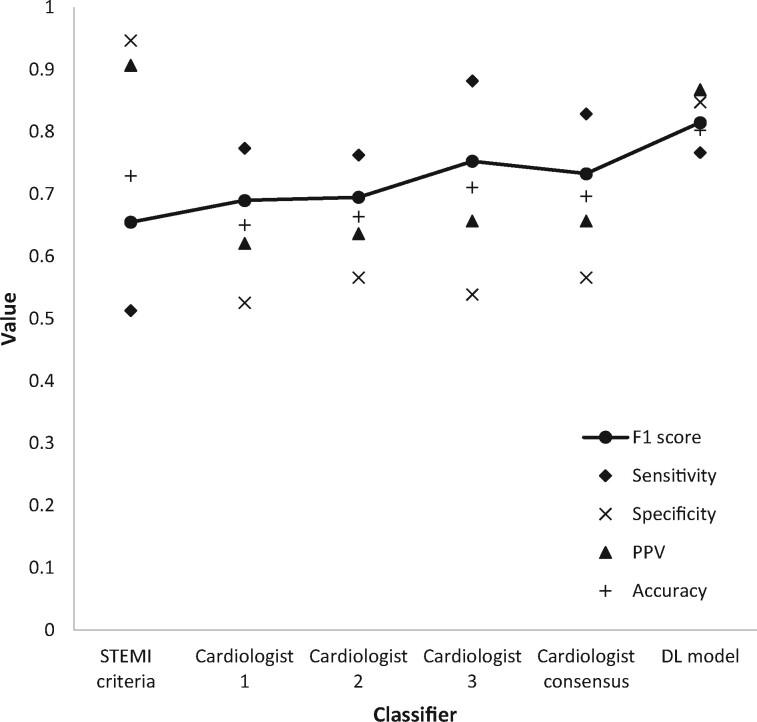
The results of ECG analysis by ST-elevation criteria (as defined by consensus opinion among the three cardiologists), individual analysis by each expert using a combination of both STEMI criteria and non-specific ischaemic changes, consensus opinion among the experts using both STEMI criteria and non-specific ischaemic changes, and analysis by the DL model are shown in Figure 1. The DL model had both the highest accuracy (0.803) and the highest F1 score (0.814). Classification using the STEMI criteria produced the highest specificity (0.947). Cardiologist 3 achieved the highest sensitivity (0.842).
Figure 1.
(First iteration) – Performance metrics of each classifier across the whole dataset.
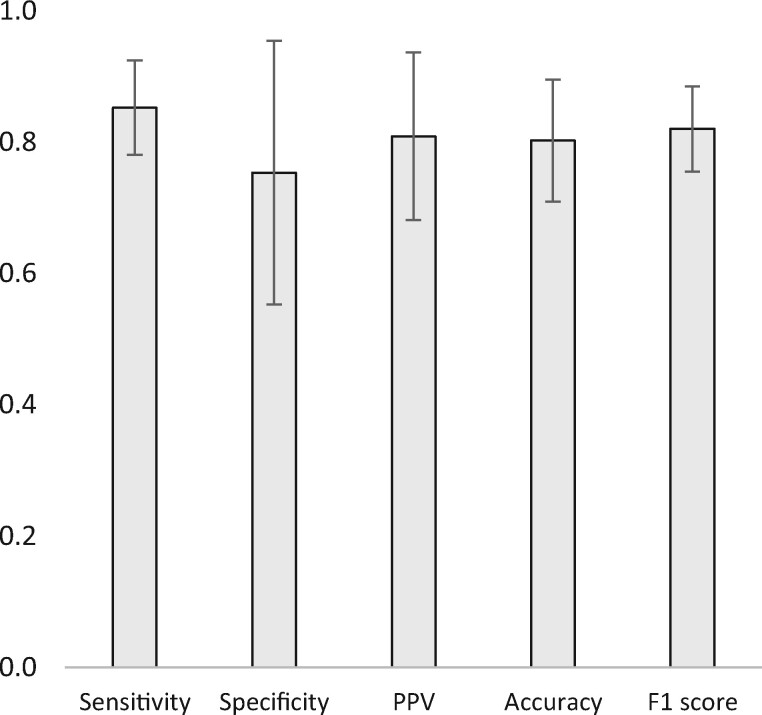
The confusion matrices used to calculate these results are included in Appendix 1. As previously noted, the DL model’s results were calculated by taking the mean results of each cycle of the five-fold CV process. Confidence intervals (95%) for these results are shown in Figure 2.
Figure 2.
(First iteration) Results from the five-fold cross-validation process of the deep learning model across the whole dataset (averages and 95% confidence intervals).
The difference in accuracy between the DL model and the consensus cardiologist opinion for any type of ischaemic change was evaluated using the Chi-square test and found to be significant using a threshold of 0.05 (P = 0.0469). Marginal homogeneity was evaluated using McNemar’s test. Results are shown in Table 2.
Table 2.
(First iteration) Classifier concordance calculated using McNemar's test
| STEMI | Cardiologist 1 | Cardiologist 2 | Cardiologist 3 | DL model | |
|---|---|---|---|---|---|
| STEMI | — | 0.193 | 0.126 | 0.699 | 0.177 |
| Cardiologist 1 | 0.193 | — | 0.856 | 0.238 | 0.009 |
| Cardiologist 2 | 0.126 | 0.856 | — | 0.201 | 0.004 |
| Cardiologist 3 | 0.699 | 0.238 | 0.201 | — | 0.065 |
| DL model | 0.177 | 0.009 | 0.004 | 0.065 | — |
Statistically significant results (P < 0.05) in bold.
Figure 3 shows the receiver operating characteristic (ROC) curve for the DL model. Area under the ROC (AUROC) was 0.860.
Figure 3.
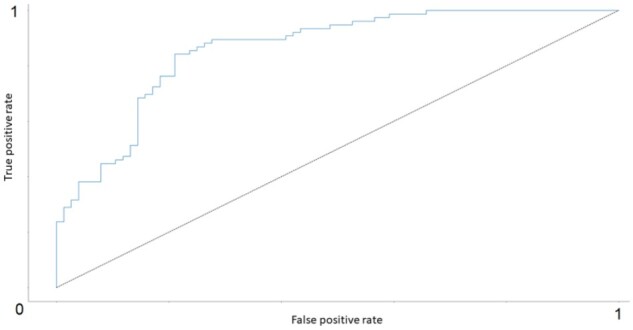
(First iteration) ROC curve for the DL model (AUROC = 0.860). The dotted black line represents the ROC for a binary classifier based on random chance where AUROC = 0.5.
Results were reproducible using a 10-fold CV process as described in the methods section.
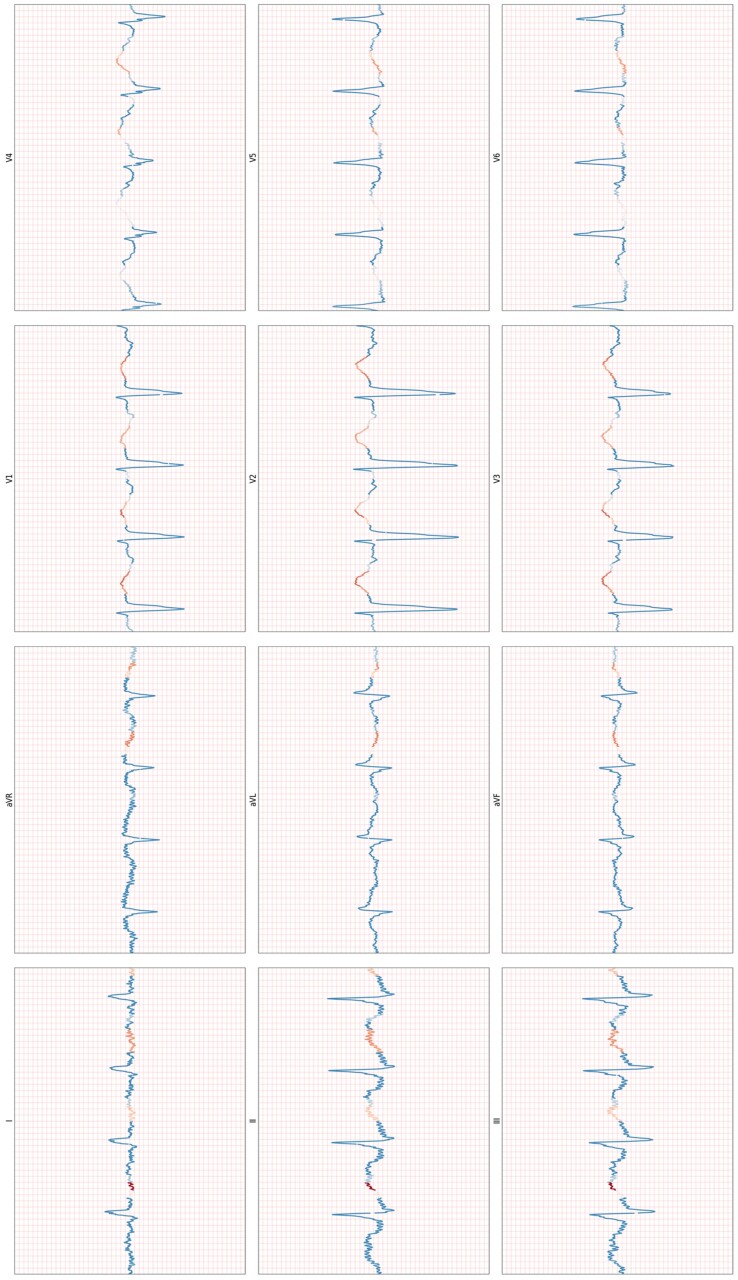
Attention heatmaps appeared to show that the model was primarily focussing on the latter part of the QRS complex or the ST-T segment. (See Figure 4 for an example.)
Figure 4.
(First iteration) An example heat map for an ischaemic example, obtained selectively masking input data to establish which parts of the ECG the model relies on most to make its prediction.
Second iteration of the study using amended inclusion and exclusion criteria
Following amendment of the inclusion criteria, so that baseline samples were obtained from theatre ECGs, 99 patients were included in the second run of the experiment. The model was retrained using the same five-fold CV process, the same data sampling methods and the same hyperparameters as the first run.
Accuracy was 0.555 (standard deviation 0.08, 95% confidence interval 0.505–0.605). F1 score was 0.533 (standard deviation 0.17, 95% confidence interval 0.433–0.633). The experiment was repeated in case the stochastic nature of the DL approach has resulted in particularly poor results, but there was no change.
The results provide a case study that clearly demonstrates that a DL model that, under certain conditions, Maya achieve high accuracy scores due to its ability to also exploit confounders and data leakages. This explains why the results in iteration 1 are superior to the results in iteration 2. The high performance in iteration 1 is likely due to the DL model detecting ‘noise’ as opposed to detecting ischaemia.
Discussion
This single centre, retrospective, observational study of 104 patients investigated the ability of a DL model to predict hyperacute myocardial ischaemia from ECG recordings. The first iteration, which obtained non-ischaemic samples from resting room ECGs, appeared to have an ability to detect ischaemia. The second iteration, which obtained non-ischaemic samples from inside theatres, was negative. In the first iteration, the model appeared to outperform a panel of three cardiologists with statistical significance. On the latter occasion, the model performed at the level of a random chance classifier. The likely explanation for the discrepancy in results is that the first model learned to associate background electrical noise in theatre with ischaemic samples during the first run of the experiment. Background electrical activity in cardiac theatres is known to manifest on ECGs (including noise in the 100 Hz range from fluoroscopy).15 And given that the ‘ischaemic’ ECGs exhibited this noise, the algorithm was able to discriminate between ischaemia and non- ischaemia by simply detecting the noise in the ‘ischaemic’ ECGs. This is referred to as data leakage or a confounding factor.
During the second run, all samples were acquired in theatre and the model’s true ability to discern causative (as opposed to purely correlative) links within the data was revealed. The hypothesis had been that transfer learning from an arrhythmia detection task may allow the model to glean generalizable insights from a small dataset16 but the results demonstrate that this was not the case.
This experiment is not the first study showcasing how DL models can leverage confounding factors within the data to produce spuriously high performance: a number of similar occurrences have been described in healthcare and other domains.17–20 Deep learning is currently receiving much attention in the domain of automated ECG interpretation, as it is in the fields of cardiac imaging, coronary evaluation, and heart failure.21 It is, therefore, particularly important that the cardiology community be aware of its pitfalls as well as its strengths.
We acknowledge that this was a highly speculative experiment at increased risk of spurious results due to a small study cohort and retrospective, observational setting.22 We also recognize that neither cross-validation nor any other approach to validation guarantees against such an outcome, and agree with recent calls for more ML and DL applications to be in evaluated prospective, multi-centre clinical trials.23–25 However, it must be noted that even DL algorithms trained on huge datasets and extensively validated by world-leading technical experts can behave in surprising, unacceptable and sometimes catastrophic ways.26,27 In addition, such tools may not integrate well into current clinical practice, where transparency is highly prized.28,29
It is our conclusion that AI in the medical domain must always retain a degree of ‘explainability’ in order to facilitate human oversight and supervision. This does not necessarily require an exhaustive account of a DL model’s logic, which is encoded by the state of millions of coefficients within a complex computing graph14 and may be impossible to explain in human terms. Rather, we propose that it falls to the clinical community to stipulate a set of minimum requirements for what we determine to be acceptable transparency in future cardiac DL applications.
In summary, DL continues to show significant promise and has many potential applications in modern medical practice.30 However, it remains a nascent technology and further work is needed in the field. We particularly advocate future research that will support the development of standardized frameworks for acceptable transparency of these applications and we look forward to future discussions of this issue.
Acknowledgements
The corresponding author of this article (Rob Brisk) holds a PhD scholarship from the Eastern Corridor Medical Engineering Centre that is supported by the European Union’s INTERREG VA Programme, managed by the Special EU Programmes Body (SEUPB). This research was also supported by the Craigavon Cardiac Care Association, whom we wish to thank for their active support of cardiovascular research in Northern Ireland over the last 50 years. We would also like to thank Physionet for providing the open-access ECG data used for this study.
Conflict of interest: none declared.
Data availability
The data underlying this article are available at the STAFF III database on Physionet, at https://physionet.org/content/staffiii/1.0.0/.
Appendix
Appendix 1 (First iteration) The confusion matrices from the overall classification task.
| STEMI | Predicted: YES | Predicted: NO |
|---|---|---|
| Actual: YES | 39 | 37 |
| Actual: NO | 4 | 72 |
| Cardiologist 1 | ||
| Actual: YES | 58 | 18 |
| Actual: NO | 33 | 43 |
| Cardiologist 2 | ||
| Actual: YES | 59 | 17 |
| Actual: NO | 36 | 40 |
| Cardiologist 3 | ||
| Actual: YES | 67 | 9 |
| Actual: NO | 35 | 41 |
| DL model | ||
| Actual: YES | 66 | 10 |
| Actual: NO | 20 | 56 |
References
- 1. Smith FM. The ligation of coronary arteries with electrocardiographic study. Arch Internal Med, 1918;22:8–27. [DOI] [PMC free article] [PubMed] [Google Scholar]
- 2. Ibanez B, James S, Agewall S, Antunes MJ, Bucciarelli-Ducci C, Bueno H, Caforio AL, Crea F, Goudevenos JA,, Halvorsen S.. 2017 ESC Guidelines for the management of acute myocardial infarction in patients presenting with ST-segment elevation: The Task Force for the management of acute myocardial infarction in patients presenting with ST-segment elevation of the European Society of Cardiology (ESC). Eur Heart J 2017;39:119–177. [DOI] [PubMed] [Google Scholar]
- 3. Menown I, Mackenzie G,, Adgey A.. Optimizing the initial 12-lead electrocardiographic diagnosis of acute myocardial infarction. Eur Heart J 2000;21:275–283. [DOI] [PubMed] [Google Scholar]
- 4. Cox DA, Stone GW, Grines CL, Stuckey T, Zimetbaum PJ, Tcheng JE, Turco M, Garcia E, Guagliumi G, Iwaoka RS.. Comparative early and late outcomes after primary percutaneous coronary intervention in ST-segment elevation and non-ST-segment elevation acute myocardial infarction (from the CADILLAC trial). Am J Cardiol 2006;98:331–337. [DOI] [PubMed] [Google Scholar]
- 5. Pollehn T, Brady WJ, Perron AD, MORRIS F.. The electrocardiographic differential diagnosis of ST segment depression. Emerg Med J 2002;19:129–135. [DOI] [PMC free article] [PubMed] [Google Scholar]
- 6. Banning AS, Gershlick AH.. Timing of intervention in non-ST segment elevation myocardial infarction. Eur Heart J Suppl 2018;20(suppl_B):B10–B20. [Google Scholar]
- 7. Badings EA, Dambrink JH, Tjeerdsma G, Rasoul S, Timmer JR, Lok DJ.. Early or late intervention in high-risk non-ST-elevation acute coronary syndromes: results of the ELISA-3 trial. EuroIntervention 2013;9:54–61. [DOI] [PubMed] [Google Scholar]
- 8. Mehta SR, Granger CB, Boden WE, Steg PG, Bassand J, Faxon DP, Afzal R, Chrolavicius S, Jolly SS, Widimsky P.. Early versus delayed invasive intervention in acute coronary syndromes. N Engl J Med 2009;360:2165–2175. [DOI] [PubMed] [Google Scholar]
- 9. Hannun AY, Rajpurkar P, Haghpanahi M, Tison GH, Bourn C, Turakhia MP, Ng AY.. Cardiologist-level arrhythmia detection and classification in ambulatory electrocardiograms using a deep neural network. Nat Med 2019;25:65. [DOI] [PMC free article] [PubMed] [Google Scholar]
- 10. Martínez JP, Pahlm O, Ringborn M, Warren S, Laguna P, Sörnmo L.. The STAFF III database: ECGs recorded during acutely induced myocardial ischemia. 2017 Computing in Cardiology (CinC) 2017, IEEE, 2017; pp. 1–4. [Google Scholar]
- 11. Pettersson J, Carro E, Edenbrandt L, Maynard C, Pahlm O, Ringborn M, Sörnmo L, Warren SG, Wagner GS.. Spatial, individual, and temporal variation of the high-frequency QRS amplitudes in the 12 standard electrocardiographic leads. Am Heart J 2000;139:352–358. [DOI] [PubMed] [Google Scholar]
- 12. Goldberger AL, Amaral LA, Glass L, Hausdorff JM, Ivanov PC, Mark RG, Mietus JE, Moody GB, Peng C, Stanley HE.. PhysioBank, PhysioToolkit, and PhysioNet: components of a new research resource for complex physiologic signals. Circulation 2000;101:e215–e220. [DOI] [PubMed] [Google Scholar]
- 13. Brisk R, Bond R, Banks E, Piadlo A, Finlay D, Mclaughlin J, Mceneaney D.. Deep learning to automatically interpret images of the electrocardiogram: do we need the raw samples? J Electrocardiol 2019;57S:S65–S69. [DOI] [PubMed] [Google Scholar]
- 14. Goodfellow I, Bengio Y, Courville A.. 2016. Deep Learning . Cambridge, MA: MIT Press. [Google Scholar]
- 15. Haar CCT, Maan AC, Schalij MJ, Swenne CA.. ST and ventricular gradient dynamics during percutaneous transluminal coronary angioplasty. 2012 Computing in Cardiology 2012,IEEE, 2012; pp. 341–344. [Google Scholar]
- 16. Yu X, Aloimonos Y.. Attribute-based transfer learning for object categorization with zero/one training example. In: Daniilidis K, Maragos P, Paragios N (eds) Computer Vision – ECCV 20, 10 2010. Berlin: Springer, 2010; pp. 127–140. [Google Scholar]
- 17. Caruana R, Lou Y, Gehrke J, Koch P, Sturm M, Elhadad N. Intelligible models for healthcare: Predicting pneumonia risk and hospital 30-day readmission. In: Proceedings of the 21th ACM SIGKDD International Conference on Knowledge Discovery and Data Mining 2015, ACM, 2015; pp. 1721–1730.
- 18. Barocas S, Selbst AD.. Big data's disparate impact. Calif L Rev 2016;104:671. [Google Scholar]
- 19. Sweeney L. Discrimination in online ad delivery. Communications of the ACM 2013;56:44–54. [Google Scholar]
- 20. Saunders J, Hunt P, Hollywood JS.. Predictions put into practice: a quasi-experimental evaluation of Chicago’s predictive policing pilot. J Exp Criminol 2016;12:347–371. [Google Scholar]
- 21. Lopez-Jimenez F, Attia Z, Arruda-Olson AM, Carter R, Chareonthaitawee P, Jouni H, Kapa S, Lerman A, Luong C, Medina-Inojosa JR.. Artificial intelligence in cardiology: present and future. Mayo Clin Proc 2020;95:1015–1039. [DOI] [PubMed] [Google Scholar]
- 22. Bollen CW, Hoekstra MO, Arets H.. Pooling of studies in meta-analysis of observational research leads to precise but spurious results. Pediatrics 2006;17:261–262. [DOI] [PubMed] [Google Scholar]
- 23. Liu X, Faes L, Calvert MJ, Denniston AK.. Extension of the CONSORT and SPIRIT statements. Lancet 2019;394:1225. [DOI] [PubMed] [Google Scholar]
- 24. Liu X, Rivera SC, Faes L, Ruffano LFD, Yau C, Keane PA, Ashrafian H, Darzi A, Vollmer SJ, Deeks J.. Reporting guidelines for clinical trials evaluating artificial intelligence interventions are needed. Nat Med 2019;25:1467–1468. [DOI] [PubMed] [Google Scholar]
- 25. Luo W, Phung D, Tran T, Gupta S, Rana S, Karmakar C, Shilton A, Yearwood J, Dimitrova N, Ho TB.. Guidelines for developing and reporting machine learning predictive models in biomedical research: a multidisciplinary view. J Med Internet Res 2016;18:e323. [DOI] [PMC free article] [PubMed] [Google Scholar]
- 26. Howard A, Borenstein J.. The ugly truth about ourselves and our robot creations: the problem of bias and social inequity. Sci Eng Ethics 2018;24:1521–1536. [DOI] [PubMed] [Google Scholar]
- 27. Stilgoe J. Machine learning, social learning and the governance of self-driving cars. Soc Stud Sci 2018;48:25–56. [DOI] [PubMed] [Google Scholar]
- 28. Hirsh J, Guyatt G.. Clinical experts or methodologists to write clinical guidelines? Lancet 2009. 374:273–275. [DOI] [PubMed] [Google Scholar]
- 29. Norheim OF. Healthcare rationing—are additional criteria needed for assessing evidence based clinical practice guidelines? BMJ 1999;319:1426–1429. [DOI] [PMC free article] [PubMed] [Google Scholar]
- 30. Esteva A, Robicquet A, Ramsundar B, Kuleshov V, Depristo M, Chou K, Cui C, Corrado G, Thrun S, Dean J.. A guide to deep learning in healthcare. Nat Med 2019;25:24–29. [DOI] [PubMed] [Google Scholar]
Associated Data
This section collects any data citations, data availability statements, or supplementary materials included in this article.
Data Availability Statement
The data underlying this article are available at the STAFF III database on Physionet, at https://physionet.org/content/staffiii/1.0.0/.


