Abstract
Aims
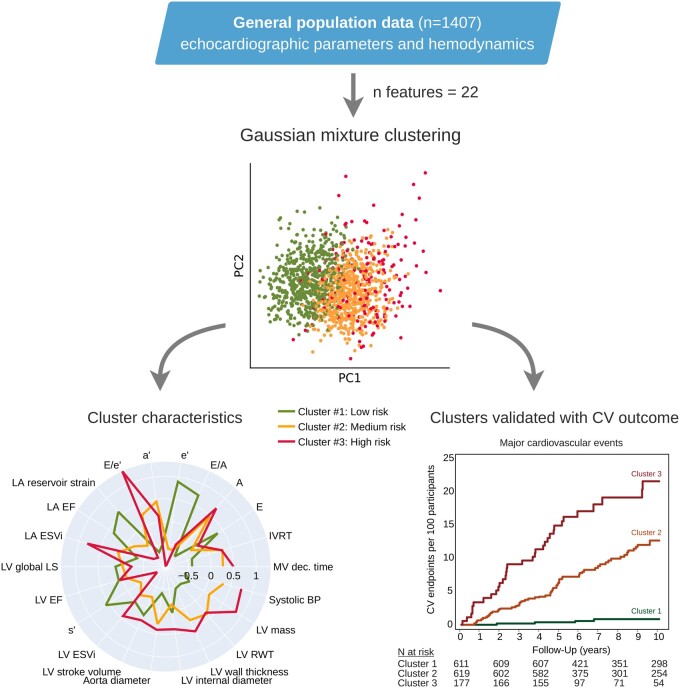
There is a need for better phenotypic characterization of the asymptomatic stages of cardiac maladaptation. We tested the hypothesis that an unsupervised clustering analysis utilizing echocardiographic indexes reflecting left heart structure and function could identify phenotypically distinct groups of asymptomatic individuals in the general population.
Methods and results
We prospectively studied 1407 community-dwelling individuals (mean age, 51.2 years; 51.1% women), in whom we performed clinical and echocardiographic examination at baseline and collected cardiac events on average 8.8 years later. Cardiac phenotypes that were correlated at r > 0.8 were filtered, leaving 21 echocardiographic features, and systolic blood pressure for phenogrouping. We employed hierarchical and Gaussian mixture model-based clustering. Cox regression was used to demonstrate the clinical validity of constructed phenogroups. Unsupervised clustering analyses classified study participants into three distinct phenogroups that differed markedly in echocardiographic indexes. Indeed, cluster 3 had the worst left ventricular (LV) diastolic function (i.e. lowest e’ velocity and left atrial (LA) reservoir strain, highest E/e’, and LA volume index) and LV remodelling. The phenogroups were also different in cardiovascular risk factor profiles. We observed increase in the risk for incidence of adverse events across phenogroups. In the third phenogroup, the multivariable adjusted risk was significantly higher than the average population risk for major cardiovascular events (51%, P = 0.0028).
Conclusion
Unsupervised learning algorithms integrating routinely measured cardiac imaging and haemodynamic data can provide a clinically meaningful classification of cardiac health in asymptomatic individuals. This approach might facilitate early detection of cardiac maladaptation and improve risk stratification.
Keywords: Echocardiography, Machine learning, Cluster analysis, Left ventricular dysfunction, Left ventricular remodelling
Graphical Abstract
Introduction
At present, the heart health status could be characterized by using widely available imaging techniques, such as echocardiography. The current diagnostic imaging algorithms used in clinic to detect cardiac dysfunction and remodelling focuses on advanced stages of heart failure (HF) and, therefore, might be less helpful in identifying asymptomatic patients who are at risk of cardiovascular adverse events. To date, numerous population studies validated the best imaging criteria for detection of left heart dysfunction and remodelling in the community.1–5 For instance, in a general population cohort, echocardiographic indexes reflecting left ventricular (LV) diastolic dysfunction, low longitudinal strain, left atrial (LA) dysfunction, and cardiac remodelling/hypertrophy emerged independently from traditional risk factors associated with fatal and non-fatal cardiovascular outcome.5 Thus, the amount of information to improve cardiovascular risk stratification in asymptomatic subjects that can be derived from echocardiographic images, is substantial.
Nowadays, echocardiography is relatively affordable as compared to other imaging techniques, and in the new era of precise ultrasound characterization of myocardial performance and automatic post-processing of echocardiographic images it becomes an important instrument in preventive cardiology.6 However, until now we have not fully explored the potential of such vast amount of data. Recent efforts aimed at the characterization of cardiac performance using unsupervised cluster analysis approaches, which offer the potential of unbiased mapping of echocardiographic features. However, these studies are limited to the prognosis mainly in symptomatic HF patients.7–9 To our knowledge, no such analyses were done in asymptomatic subjects at risk recruited from the general population so far. Therefore, in this study, we tested the hypothesis that unsupervised clustering analysis utilizing routinely measured echocardiographic indexes reflecting left heart structure and function could identify phenotypically distinct groups of individuals in the general population. We also explored whether these echocardiographic phenogroups (profiles) were associated with different prognoses.
Methods
Study participants
The ethics committee of the University of Leuven approved the Flemish Study on Environment, Genes, and Health Outcomes (FLEMENGHO), a large family-based population resource on the genetic epidemiology of cardiovascular phenotypes.2,5 From 1985 to 2005, we identified a random population sample stratified by sex and age from a geographically defined area in northern Belgium as described elsewhere.2 From 2005 to 2014, we invited 1851 former participants for a technical examination, including echocardiography. We obtained written informed consent from 1447 subjects (participation rate, 78.2%). For this analysis, we excluded 40 subjects from analysis, because of atrial fibrillation (n = 10), the presence of an artificial pacemaker (n = 6), or suboptimal echocardiographic image quality (n = 24). Thus, the study cohort included 1407 participants with complete information for echocardiographic variables.
Echocardiography
Echocardiographic methods are detailed in the online Supplementary material online, Methods section.
Data acquisition
Two experienced observers did the ultrasound examination, using a Vivid7 Pro and Vivid E9 (GE Vingmed, Horten, Norway) interfaced with a 2.5–3.5-MHz phased-array probe, according to the standardized protocol2 and the recent recommendations. With the subjects in partial left decubitus and breathing normally, the observer obtained images, together with a simultaneous ECG signal, along with the parasternal long and short axes and from the apical four- and two-chamber long-axis views. All recordings included at least five cardiac cycles and were digitally stored for off-line analysis.
Off-line analysis
The post-processing of echocardiograms was performed by one experienced observer (T.K.) blinded to the participants’ characteristics. Digitally stored images were analysed using a workstation running the EchoPac software, version BT113 (GE Vingmed, Horten, Norway). All measurements were averaged over three heart cycles for statistical analysis. The methodology of echocardiographic indexes assessment is provided in the Supplementary material online, Methods.
Clinical data
We administered a standardized questionnaire to collect information on the subject’s medical history, smoking and drinking habits, and medication intake. We verified and supplemented self-reported diseases by medical records provided by general practitioners and regional hospitals. Body mass index (BMI) was weight in kilograms divided by the square of height in metres. Brachial blood pressure (BP) was the average of five auscultatory readings obtained in seated position. Hypertension was defined as a BP of at least 140 mmHg systolic or 90 mmHg diastolic or the use of antihypertensive drugs. Fasting blood samples were drawn for measurement of important routinely measured biochemical features, such as blood glucose, and lipid profile. Diabetes mellitus was determined by self-report, a fasting glucose level of at least 126 mg/dL, or the use of antidiabetic agents. We applied the sex-specific Pooled Cohort Equations for white participants between 40 and 79 years old (n = 1039) to estimate the 10-year risk for a first atherosclerotic cardiovascular disease (ASCVD) event as endorsed by the 2013 ACC/AHA Guideline on the Assessment of Cardiovascular Risk.10
Assessment of outcome
Outcomes were adjudicated against source documents, as described in previous publications.2,5 We ascertained vital status of FLEMENGHO participants until 31 December 2019. We obtained the International Classification of Disease codes for the immediate and underlying cause of death. We collected information on the incidence of cardiovascular non-fatal events via a follow-up visit or a telephone interview with repeat administration of the same standardized questionnaire used at baseline. In all participants (n = 1407), we also checked and ascertained information on diseases against the medical records of general practitioners and in the regional hospitals. Major cardiovascular events comprised cardiovascular death, non-fatal stroke, and cardiac events (myocardial infarction, coronary revascularization, HF, atrial fibrillation, and pacemaker). In the study, participants who experienced cardiovascular events, we only considered the first event per participant.
Cluster analysis
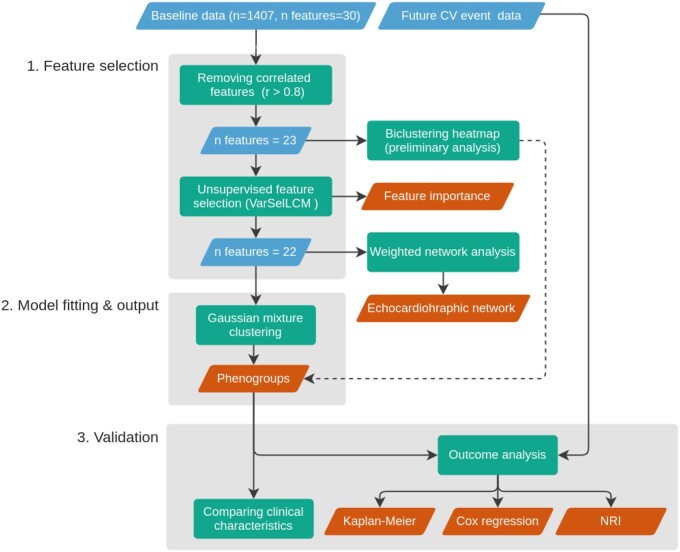
We used Python 3.8 (https://www.python.org) environment to conduct the unsupervised analysis to identify specific participant phenogroups and investigate their associations with clinical parameters at baseline or incidence of cardiovascular events.11 R (4.0.2, https://www.r-project.org) was used for unsupervised feature selection using library VarSelLCM (2.1.3), the remaining libraries are for Python. Figure 1 presents the steps of a machine learning pipeline applied in our analysis. A Jupyter notebook with Python code producing the results is available at the following link: https://github.com/HCVE/echo-clustering.
Figure 1.
Unsupervised machine learning workflow. The blue and orange rhomboids represent the input data and the output of the analysis, respectively. Rectangles describe the performed analytical steps. Arrows show the workflow of the analysis. The dashed line represents the supportive evidence for the phenogroups. For a detailed explanation see the Methods section.
Features selection
For the cluster analysis, we considered 30 routinely measured echocardiographic and haemodynamic features, which were standardized to the mean of 0 and the standard deviation of 1. We constructed Pearson’s correlation matrix using pandas library (1.1.2) to identify highly correlated features (>0.8) and kept the more representative of the correlated parameters based on their clinical relevance and previously reported relationships with adverse events. Additionally, we plotted Maximal Information Coefficient (MIC) matrix to further check association between the variables. We also employed weighted network analysis methods to illustrate the interrelations of measured variables. First, the reduced feature set was used to construct Pearson’s correlation matrix. Second, the correlation matrix was passed to NetworkX (2.5) library, which was utilized to compute weighted node connectivity (the sum of the edge weights for edges incident to that node), and layout the graph using Fruchterman–Reingold force-directed algorithm.12 Third, we applied the Louvain method for module detection in this network using the python-louvain (0.14) package.13
Consequently, we applied the R package VarSelLCM, version 2.1.3 for automatic feature selection. VarSelLCM selects relevant features using a model-based clustering framework by optimizing a modified integrated complete-data likelihood.14
Model fitting
The clustering approaches were taken from the scikit-learn library, version 0.23.11 First, we performed preliminary analysis with biclustering heatmap based on hierarchical clustering with Euclidean distance and Ward linkage to identify echocardiographic patterns that would define subsets of participants. The heatmap was created using the seaborn library, version 0.10.1. As a second step, we used Gaussian mixture model-based clustering, fit with an expectation maximization algorithm.15 Advantages of Gaussian mixture model-based clustering over other approaches are related to (i) possibilities of statistical analysis using the underlying probabilistic framework, (ii) estimating cluster parameters from soft assignments, (iii) noise modelling, and (iv) formation of clusters of different size and shape.15 The optimal number of clusters (k) was obtained based on the Bayesian information criterion (BIC) for every tested k and its associated selected features as implemented in the scikit-learn library.11 Then, k with the lowest BIC is the estimate of an appropriate number of clusters. Radar charts were used to visualize echocardiographic and haemodynamic features across clusters.
Statistical analysis
For database management and conventional statistics, we used SAS software, version 9.3 (SAS Institute, Cary, NC, USA).
Validation of phenogroups
First, we compared clinical and echocardiographic characteristics across phenogroups to characterize their clinical relevance. Means of continuous variables and proportions of categorical variables were compared using a large sample z-test and the χ2 statistics, respectively. Second, we used the Kaplan–Meier method to estimate the cumulative incidence of adverse events according to the phenogroups and to compute standardized hazard ratios (HRs) using Cox regression. We expressed the risk in each phenogroup relative to the overall risk in the whole study population. The baseline cardiovascular risk factors considered as covariables in Cox regression were sex, age, body mass index, smoking, serum cholesterol, antihypertensive treatment, and diabetes mellitus. We also calculated Cox regression HR for major cardiovascular events per cluster while adjusting the model for continuous ASCVD risk. Finally, we assessed the added ability of phenogroups to predict fatal and nonfatal major cardiovascular events, using the net reclassification improvement (NRI) as described by Pencina et al.16
Results
Cluster analysis of echocardiographic features
The 1407 participants (51.1% women) included 611 (43.4%) hypertensive subjects of whom 347 (56.8%) were on antihypertensive drug treatment. The mean age at baseline was 51.2 ± 15.7 years. We determined the correlation among the echocardiographic and haemodynamic features used for clustering in order to select a feature subset for subsequent modelling (Supplementary material online, Figure S1A). We removed seven highly correlated features (LA area change, LA EDV index, LA diastolic and systolic area index, e’/a’, intraventricular septum thickness, and Pulse pressure; Supplementary material online, Figure S1C). We also checked the correlation using MIC (Supplementary material online, Figure S1B). Although MIC is scaled differently, it shares a strongly overlapping subset of features with Pearson’s correlation coefficient (Supplementary material online, Figure S1C). We kept the more representative of the correlated parameters, leaving 23 features for subsequent unsupervised learning analysis. The network constructed on the preselected echocardiographic features using the weighted correlation network analysis methods is shown in Supplementary material online, Figure S1D. The network analysis mainly serves as a visualization of the interconnectedness of the echocardiographic parameters and justifies the use of distribution-based clustering that can capture correlation and dependence between features.
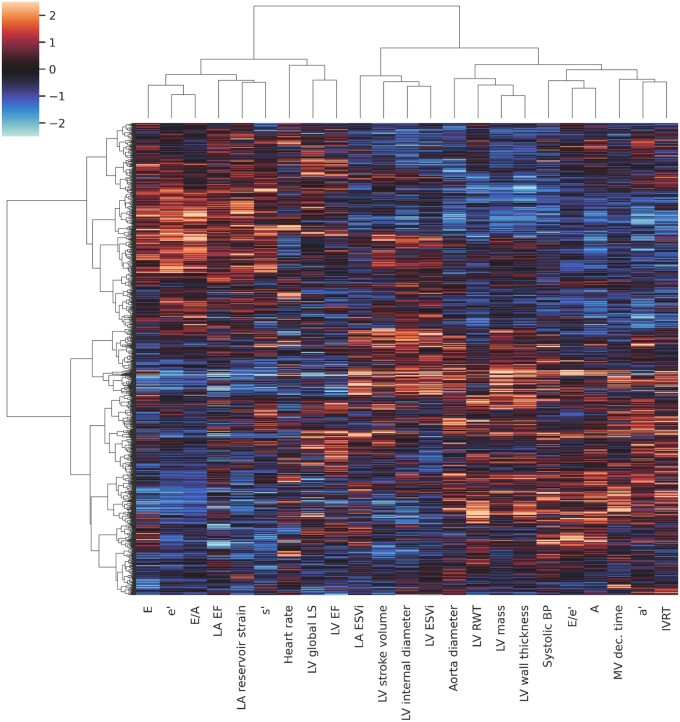
Figure 2 presents a phenogrouping heatmap based on agglomerative hierarchical biclustering. A visual inspection of this heatmap indicated the presence of two or three clusters (Figure 2). According to the BIC value for every k, the optimal number of clusters was three as a lower BIC value means a better fit (Figure 3). In addition, VarSelLCM package was used to demonstrate importance of relevant features for clustering. For k = 3, all included echocardiographic features and systolic blood pressure were considered as relevant except heart rate. Discriminative power of each of used features is shown in Figure 4. The fact that heart rate was less discriminative was also visible in the biclustering heatmap (Figure 2) and, thus, was not considered in the future cluster analysis.
Figure 2.
Phenogrouping heatmap showing grouping of individuals based on agglomerative hierarchical biclustering analysis of echocardiographic and haemodynamic variables. The rows represent individuals, the columns represent features, and the colour indicates z-score of the particular value. Red indicates increased values; blue indicates decreased values. A, late peak diastolic velocity of mitral blood flow; a’, late peak diastolic myocardial velocity; E, early peak diastolic velocity of mitral blood flow; e’, early peak diastolic myocardial velocity; ESVi, end-systolic volume index; IVRT, isovolumetric relaxation time; LV, left ventricular; LA, left atrial; LA EF, left atrial emptying fraction; LV EF, left ventricular ejection fraction; LS, longitudinal strain; MV, mitral velocity; RWT, relative wall thickness; s’, peak systolic myocardial velocity.
Figure 3.
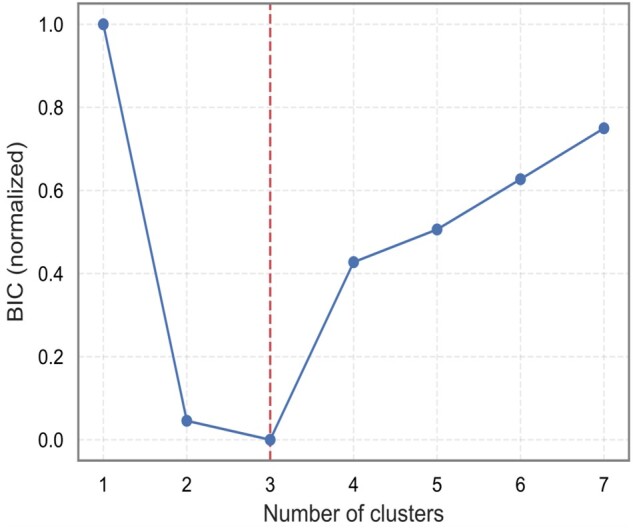
Selection of optimal number of clusters (k) according to the Bayesian Information Criterion. The values were normalized to range (0, 1). Lower value means better fit.
Figure 4.
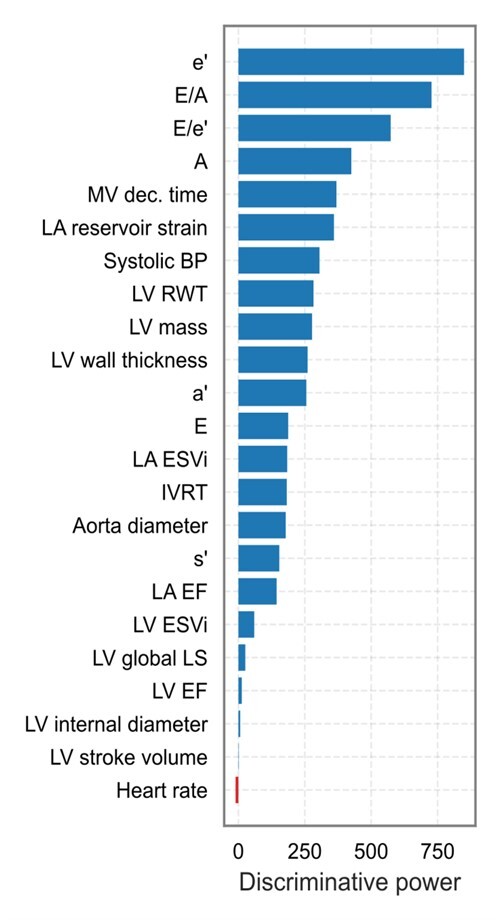
Discriminative power of echocardiographic features and systolic blood pressure used for phenogrouping. Discriminative power of each of variable is defined as the logarithm of the ratio between the probability that the variable is relevant for the clustering, given the best partition, and that the variable is irrelevant for the clustering. The greater this index, the more the variable distinguishes the clusters. Heart rate is marked in red because it was not selected by VarSelLCM as relevant feature for clustering. A, late peak diastolic velocity of mitral blood flow; a’, late peak diastolic myocardial velocity; E, early peak diastolic velocity of mitral blood flow; e’, early peak diastolic myocardial velocity; ESVi, end-systolic volume index; IVRT, isovolumetric relaxation time; LV, left ventricular; LA, left atrial; LA EF, left atrial emptying fraction; LV EF, left ventricular ejection fraction; LS, longitudinal strain; MV, mitral velocity; RWT, relative wall thickness; s’, peak systolic myocardial velocity.
Model-based clustering produces a mixture with every individual’s membership assigned to each of the clusters with a certain probability. Supplementary material online, Figure S2 shows such probabilistic assignments of individuals to the clusters. Most individuals (n = 1282; 91%) belonged to a single cluster with a probability of >95%, although some participants (n = 125) were located between two clusters. Supplementary material online, Figure S2B shows principal component analysis plot of the individuals with two components assigned to a particular cluster.
Clinical relevance of constructed phenogroups (clusters)
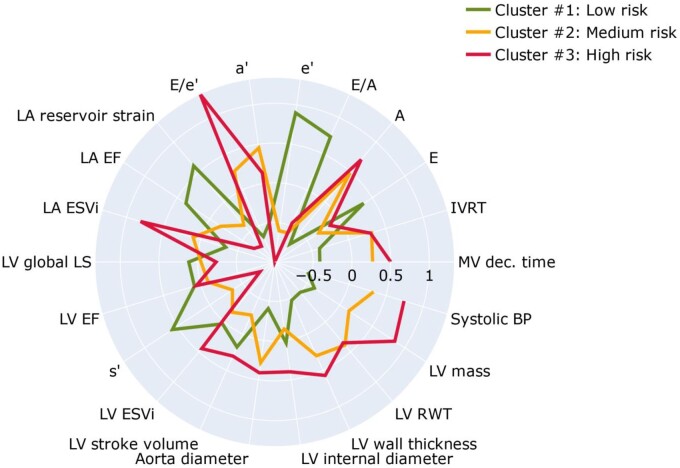
Table 1 lists the important clinical and echocardiographic characteristics by phenogroups. In addition, radar charts of the echocardiographic features (Figure 5) visualize the profile of these features in the three phenogroups (clusters) derived from the model-based clustering approach. Phenogroup 1 had the lowest LV mass, LA maximum volume, E/e’ ratio, peak A and a’ velocities, and the highest e’ velocity and LA reservoir strain and emptying fraction (Figure 5). This cluster included predominantly young and healthy participants with the lowest rate of hypertension and other risk factors (Table 1). On the other hand, phenogroup 3 had the highest LV mass, LA maximum volume, E/e’ ratio, and the lowest e’, s’, and LA reservoir strain. This cluster comprised mainly of participants with hypertension, diabetes, and previous cardiac events. For phenogroup 2, average values of echocardiographic indexes used for clustering were in between those of clusters 1 and 3 (Table 1 and Figure 5).
Table 1.
Clinical characteristics of participants by phenogroups
| Characteristics | Phenogroup 1 n = 611 |
Phenogroup 2 n = 619 |
Phenogroup 3 n = 177 |
|---|---|---|---|
| Anthropometrics | |||
| Female, n (%) | 303 (49.6) | 325 (52.5) | 91 (51.4) |
| Age, years | 38.3 ± 11.4 | 59.9 ± 10.2* | 65.1 ± 11.3*,** |
| Body mass index, kg/m² | 24.5 ± 3.65 | 27.9 ± 4.32* | 28.2 ± 4.52* |
| Systolic pressure, mmHg | 120.7 ± 11.9 | 136.2 ± 16.8* | 143.4 ± 18.3*,** |
| Diastolic pressure, mmHg | 77.5 ± 8.87 | 83.6 ± 9.55* | 81.3 ± 9.97*,** |
| Heart rate, b.p.m. | 63.6 ± 9.11 | 64.2 ± 9.16 | 63.0 ± 10.5 |
| Questionnaire data | |||
| Current smoking, n (%) | 144 (23.5) | 89 (14.4)* | 15 (8.5)* |
| Drinking alcohol, n (%) | 277 (45.3) | 220 (35.5)* | 63 (35.6)* |
| Hypertensive, n (%) | 88 (14.4) | 393 (63.5)* | 130 (73.5)* |
| Treated for hypertension, n (%) | 29 (4.75) | 221 (35.7)* | 97 (54.8)*,** |
| History of cardiac disease, n (%) | 3 (0.49) | 41 (6.62)* | 38 (21.5)*,** |
| Diabetes, n (%) | 2 (0.33) | 41 (6.62)* | 18 (10.2)* |
| History of renal disease, n (%) | 21 (3.4) | 152 (24.6)* | 58 (32.8)*,** |
| History of chronic obstructive lung disease, n (%) | 19 (3.1) | 34 (5.5)* | 14 (7.9)* |
| Biochemical data | |||
| Serum creatinine, μmol/L | 77.6 ± 13.9 | 81.2 ± 18.3* | 81.5 ± 16.4* |
| Total cholesterol, mmol/L | 4.91 ± 0.92 | 5.28 ± 0.97* | 5.10 ± 0.98*,** |
| ASCVD risk score | 3.72 (040‒20.9) | 15.4 (1.41‒42.6)* | 24.0 (1.82‒55.0)*,** |
| Echocardiographic indexes | |||
| Aorta diameter, cm | 2.88 ± 0.36 | 3.17 ± 0.42* | 3.23 ± 0.40* |
| LV structure | |||
| LV internal diameter, cm | 5.04 ± 0.44 | 4.96 ± 0.45* | 5.21 ± 0.55*,** |
| LV wall thickness, cm | 0.83 ± 0.11 | 0.94 ± 0.12* | 0.97 ± 0.13*,** |
| Relative wall thickness | 0.34 ± 0.04 | 0.39 ± 0.06* | 0.39 ± 0.06* |
| LV mass index, g/m2.7 | 82.6 ± 16.6 | 93.9 ± 19.4* | 108.9 ± 27.5*,** |
| LV hypertrophy, n (%) | 36 (5.89) | 153 (24.7)* | 83 (46.9)*,** |
| LV systolic function | |||
| LV end-systolic volume index, mL/m² | 21.1 ± 5.20 | 19.9 ± 4.61* | 23.6 ± 10.13*,** |
| Stroke volume index, mL/m² | 33.5 ± 6.79 | 30.3 ± 6.16* | 34.6 ± 10.03** |
| Ejection fraction, % | 61.4 ± 5.42 | 60.3 ± 5.23* | 61.3 ± 9.51 |
| LV longitudinal strain, % | 19.5 ± 2.01 | 19.2 ± 2.21* | 18.7 ± 3.05*,** |
| s' peak, cm/s | 9.62 ± 1.34 | 8.18 ± 1.26* | 7.52 ± 1.55*,** |
| Left atrium | |||
| LA maximal volume index, mL/m² | 27.9 ± 6.71 | 32.0 ± 8.99* | 38.7 ± 11.90*,** |
| LA emptying fraction, % | 62.3 ± 6.65 | 57.7 ± 8.09* | 53.1 ± 10.53*,** |
| LA reservoir strain, % | 37.5 ± 8.23 | 28.1 ± 7.90* | 24.4 ± 7.05*,** |
| LV diastolic velocities and time | |||
| E peak, cm/s | 79.2 ± 14.6 | 67.9 ± 15.0* | 70.7 ± 19.8* |
| A peak, cm/s | 49.5 ± 10.5 | 69.9 ± 13.2* | 73.8 ± 21.8*,** |
| E/A ratio | 1.67 ± 0.48 | 0.99 ± 0.23* | 1.06 ± 0.47* |
| e' peak, cm/s | 14.3 ± 2.53 | 8.86 ± 1.74* | 7.42 ± 2.39* |
| a' peak, cm/s | 8.53 ± 1.91 | 10.57 ± 1.79* | 9.89 ± 2.32*,** |
| E/e’ ratio | 5.59 ± 0.95 | 7.74 ± 1.39* | 10.27 ± 3.94*,** |
| IVRT, ms | 83.6 ± 14.7 | 95.6 ± 16.7* | 95.5 ± 18.3* |
| Deceleration time, ms | 149.0 ± 24.3 | 174.8 ± 38.7* | 183.7 ± 50.5*,** |
| LV diastolic dysfunction, n (%) | 3 (0.49) | 146 (23.6)* | 103 (58.2)*,** |
Values are expressed as mean (±SD) or number of subjects (%). LV hypertrophy was a LV mass index of 52 g/m2.7 in men and 45 g/m2.7 in women or more.
A, late peak diastolic velocity of mitral blood flow; a’, late peak diastolic myocardial velocity; ASCVD, atherosclerotic cardiovascular disease; E early peak diastolic velocity of mitral blood flow; e’, early peak diastolic myocardial velocity; IVRT, isovolumetric relaxation time; LV, left ventricular; LA, left atrial; s’, peak systolic myocardial velocity.
Significance for between-phenogroups differences
P < 0.05 vs. Cluster 1.
Significance for between-phenogroups differences
P < 0.05 vs. Cluster 2.
Figure 5.
Radar charts of the echocardiographic features and systolic blood pressure illustrate the superposition of these features in each of the three clusters. The green, orange, and red plot lines compare the cluster standardized values expressed as z-score relative to the population average (0) across all of the 22 dimensions used as inputs to the clustering process. A, late peak diastolic velocity of mitral blood flow; a’, late peak diastolic myocardial velocity; E, early peak diastolic velocity of mitral blood flow; e’, early peak diastolic myocardial velocity; ESVi, end-systolic volume index; IVRT, isovolumetric relaxation time; LV, left ventricular; LA, left atrial; LA EF, left atrial emptying fraction; LV EF, left ventricular ejection fraction; LS, longitudinal strain; MV, mitral velocity; RWT, relative wall thickness; s’, peak systolic myocardial velocity.
Outcome analysis
In our population-based cohort, the median follow-up was 8.8 years (5th to 95th percentile, 4.1–13.2). During 11 947 person-years of follow-up, 104 participants experienced at least one fatal or non-fatal major cardiovascular endpoint (8.7 events per 1000 person-years). Supplementary material online, Table S1 lists the cause-specific incidence of cardiovascular mortality and morbidity during follow-up.
We observed a significant increase in the risk for all major cardiovascular outcome across phenogroups: from 4 in the first (incidence rate, 1.2/1000 person-years), 64 in the second (9.6/1000 person-years), and 36 in the third cluster (15.2/1000 person-years). Figure 6A demonstrates the Kaplan–Meier cumulative incidence of composite major cardiovascular events in clusters (log-rank test P < 0.0001) and the fully adjusted HRs expressing the risk in each cluster compared with the average risk in the whole cohort. In the third phenogroup, the risk was significantly higher than the average risk for major cardiovascular events (51%, P = 0.0028), whereas in the first phenogroup, the risk was significantly lower by 56% (P = 0.014) for all cardiovascular events (Figure 6B). Similar results were obtained when we adjusted the Cox model for the ASCVD score in 1039 subjects with calculated scores (Figure 6C).
Figure 6.
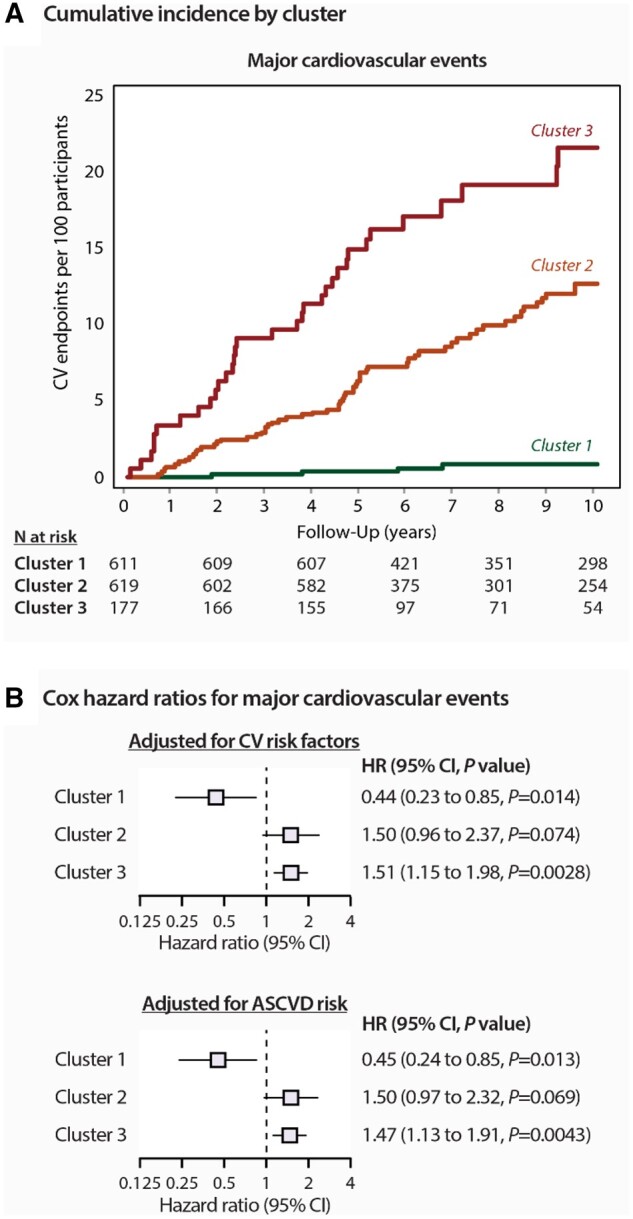
Risk for major cardiovascular events by phenogroup. (A) Incidence of adverse events are shown by clusters. P log rank was <0.0001 for both plots. (B) Cox regression hazard ratios (95% confidence interval) The hazard ratios express the risks in each cluster compared with the average risk in the whole cohort. In the upper panel, the model was adjusted for the following the covariables: sex, age, body mass index, serum cholesterol, current smoking, antihypertensive drug treatment, and diabetes mellitus. In the bottom panel, the model was adjusted for ASCVD risk score.
The category-free NRIs for the addition phenogroups in predicting major cardiovascular events was 0.39 (95% CI: 0.18–0.57; P = 0.00016), representing a significant improvement of the ability of the Cox model including phenogroups to discriminate between subjects with and without adverse events.
Discussion
To facilitate early detection of cardiac maladaptation, we applied unsupervised clustering analysis utilizing routinely measured echocardiographic indexes reflecting left heart structure and function in a large prospective general population study. In our analysis, we identified three clusters of participants with similar patterns of left heart phenotypes. Because of the unsupervised nature of clustering, the validation of the resulting echocardiographic-based cardiac profiling is a key issue. With this regard, we demonstrated that after full adjustment for important covariables or ASCVD score, participants belonging to the third cluster had significantly increased risks of major cardiovascular events as compared to the average risk in the whole cohort. As quantified by the NRI statistics, including echocardiographic phenogroups to the Cox model improved the discrimination between subjects with and without adverse events as compared to a model including conventional cardiovascular risk factors.
Echocardiography plays a central role in the evaluation of heart function and structure. In addition to conventional and Doppler echocardiography and along with measurements of LV volumes and ejection fraction, the speckle tracking technique opens up the possibility of non-invasively evaluating myocardial deformation (strain) of left atrium and ventricle.17 Studies in patients and populations explored the independent prognostic role of the echocardiographic indexes.1–5,18,19 Recently, we demonstrated that a combination of these echocardiographic criteria was complementary to traditional risk factors (ASCVD score) to predict outcome in 984 community-dwelling individuals between 40 and 79 years old without a history of cardiovascular diseases.2 Indeed, the incidence rate of the composite cardiovascular and cardiac events increased with the increasing number of LV abnormalities, suggesting that all these features (abnormal diastolic function parameters, increased LV mass, low LA and ventricular strain, etc.) are useful for risk stratification in the community if they were analysed in complex.2 Therefore, the comprehensive assessment of cardiac function and structure, in which phenogrouping plays a major role, would be important for a better stratification in patients at high cardiovascular risk.
However, current threshold values and available decision tree algorithms combining the echocardiographic parameters for assessment of, for instance, LV diastolic function are based on expert opinion and observations in symptomatic HF patients and, therefore, are not always helpful to detect cardiac malfunction especially in individuals with early changes in cardiac function but who are at high cardiovascular risk.19 Moreover, the complexity of the numerous schemas used for assessment of LV diastolic function and interactions of the echocardiographic features as demonstrated in our network analysis should also be acknowledged. To address this issue of unbiased assessment of cardiac function and structure, we demonstrated that unsupervised machine learning algorithms integrating routinely measured cardiac imaging data can provide a clinically meaningful profiling of cardiac health in asymptomatic individuals at risk. Indeed, in this study, the participants belonging to the first phenogroup of echocardiographic profile were characterized by favourable LV function and structure characteristics as well as cardiovascular risk function profiles (younger subjects, low prevalence of hypertension, obesity, and diabetes). As expected, the risk of adverse cardiovascular outcomes was the lowest in this cluster as compared to the average population risk. On the other hand, cluster 3 included older subjects with unfavourable echocardiographic profiles (left heart dysfunction and hypertrophy) and prevalent cardiovascular risk factors who had a higher risk of adverse cardiovascular events during follow-up. Cluster 2 was intermediate between clusters 1 and 3 with regards to prevalence of cardiovascular risk profile and left heart dysfunction and remodelling as well as incidence of cardiovascular events. Of note, after full adjustment for important risk factors, the risks of major cardiovascular events were significantly elevated in participants belonging to echocardiographic phenogroup 3 as compared to the average population risk after more than 7 years of follow-up.
This study also extends the applications of machine learning approaches to echocardiographic phenogrouping to a general population. Indeed, previously published studies utilized mainly supervised machine learning techniques that rely on a predefined outcome such as mortality to learn specific discriminative information that could be derived from a mixture of clinical as well as echocardiographic features.20 This approach is different from the unsupervised method we applied. In fact, unsupervised methods offer a more exploratory approach to high-throughput data analysis in which it is not necessary to predefine patterns of interest (or outcome). Unsupervised analysis also has the advantage that it is unbiased by prior ‘expert’ knowledge, such as the arbitrary discretization of diastolic function patterns, into easily recognizable classes particularly in asymptomatic individuals. For these reasons, unsupervised cluster analysis could be a vital and easy applicable tool in the evaluation of echocardiograms in high-risk patients with hypertension, diabetes, obesity, etc. With this regard, Lancaster et al.21 explored the usefulness of applying unsupervised clustering in 886 consecutive patients referred for echocardiographic assessment of cardiac (diastolic) function. By utilizing a very limited set of the echocardiographic features (n = 4), the authors demonstrated that unsupervised hierarchical clustering might help to better characterize diastolic function patterns in this preselected group of patients.21 On the other hand, to our knowledge, our study is the first to apply automatic model-based clustering to construct integrative echocardiography-based profiles of cardiac health in a general population and validate the predictive value of these profiles using the multivariate Cox proportional hazards model and the NRI index.
Despite the overwhelming evidence highlighting the usefulness of echocardiographic phenotyping for cardiovascular risk stratification in a subclinical setting, current guidelines do not support the use of echocardiography for basic screening in primary prevention of cardiovascular diseases.22,23 Main reason for this is the lack of clear selective screening strategies to identify individuals at risk who would benefit most from in-depth cardiac phenotyping. Recently, we built machine learning classifiers combining routinely measured clinical and laboratory data and ECG which have shown high accuracy for LV diastolic dysfunction and hypertrophy prediction in a population-based cohort.24 These machine learning classifiers might be used in clinical practice as a screening tool to preselect subjects for cardiac phenomapping and, therefore, tailored risk factors management.24 However, both recently developed machine learning applications require further validation in external population cohorts and integration in software for research and clinical use. On the other hand, other imaging modalities such as cardiac magnetic resonance characterizing cardiac structure and function might be also used for patient phenogrouping, although more research needs to be done regarding the clinical relevance and cost-effectiveness of this approach particularly in the primary care settings.
Limitations
Our study has to be interpreted within the context of its potential limitations and strengths. First, echocardiographic measurements are prone to error. In this study, one experienced observer recorded all echocardiographic images using a highly standardized imaging protocol. All digitally stored images were centrally post-processed by a single observer. Second, our phenogroups were derived from a particular community-based cohort from Belgium. We might improve the generalizability of our phenogroups by further validation of this computer algorithm in other cohorts for precise and fast cardiac health profiling. Third, we included in our analysis 82 (5.8%) participants with a previous history of cardiac diseases. However, we applied adjustment for previous cardiac disease. Moreover, in a sensitivity analysis, after exclusion participants with previous cardiac diseases, our findings remained consistent (Supplementary material online, Figure S3).
Conclusions
In conclusion, unsupervised learning algorithms integrating routinely measured cardiac imaging and haemodynamic data can provide a clinically meaningful classification of cardiac health in asymptomatic individuals. Using these phenogroups, we might facilitate early detection of cardiac dysfunction/remodelling and improve risk stratification. Indeed, as we demonstrated in this study, our clustering model can triage high-risk individuals in the primary care settings in addition to commonly used ASCVD risk scores. This would create opportunities to intervene early in the course of heart maladaptation and prevent progression to more advanced stages and adverse events.
Supplementary material
Supplementary material is available at European Heart Journal – Digital Health online.
Funding
This work was supported by the Research Unit Hypertension and Cardiovascular Epidemiology received grants from Internal Funds KU Leuven (PDM/19/153) and the Research Foundation Flanders (FWO grants G.0880.13; 11Z0916N; 1225021N; 1S07421N; G0C5319N).
Conflict of interest: none declared.
Data availability
The data that support the findings of this study are available on reasonable request from the corresponding author (T.K.). The datasets are not publicly available as they contain information that could compromise the privacy of the research participants. A Jupyter notebook with Python code producing the clustering results is available at the following link: https://github.com/HCVE/echo-clustering.
Supplementary Material
References
- 1. Gong FF, Campbell DJ, Prior DL.. Noninvasive cardiac imaging and the prediction of heart failure progression in preclinical stage A/B subjects. JACC Cardiovasc Imaging 2017;10:1504–1519. [DOI] [PubMed] [Google Scholar]
- 2. Cauwenberghs N, Hedman K, Kobayashi Y, Vanassche T, Haddad F, Kuznetsova T.. The 2013 ACC/AHA risk score and subclinical cardiac remodeling and dysfunction: Complementary in cardiovascular disease prediction. Int J Cardiol 2019;297:67–74. [DOI] [PubMed] [Google Scholar]
- 3. Morris DA, Belyavskiy E, Aravind-Kumar R, Kropf M, Frydas A, Braunauer K, Marquez E, Krisper M, Lindhorst R, Osmanoglou E, . et al. Potential usefulness and clinical relevance of adding left atrial strain to left atrial volume index in the detection of left ventricular diastolic dysfunction. JACC Cardiovasc Imaging 2018;11:1405–1415. [DOI] [PubMed] [Google Scholar]
- 4. Vakili BA, Okin PM, Devereux RB.. Prognostic implications of left ventricular hypertrophy. Am Heart J 2001;141:334–341. [DOI] [PubMed] [Google Scholar]
- 5. Kuznetsova T, Cauwenberghs N, Knez J, Yang W-Y, Herbots L, D’hooge J, Haddad F, Thijs L, Voigt J-U, Staessen JA.. Additive prognostic value of left ventricular systolic dysfunction in a population-based cohort. Circ Cardiovasc Imaging 2016;9:e004661. [DOI] [PubMed] [Google Scholar]
- 6. Tajik AJ. Machine learning for echocardiographic imaging: embarking on another incredible journey. J Am Coll Cardiol 2016;68:2296–2298. [DOI] [PubMed] [Google Scholar]
- 7. Omar AMS, Narula S, Abdel Rahman MA, Pedrizzetti G, Raslan H, Rifaie O, Narula J, Sengupta PP.. Precision phenotyping in heart failure and pattern clustering of ultrasound data for the assessment of diastolic dysfunction. JACC Cardiovasc Imaging 2017;10:1291–1303. [DOI] [PubMed] [Google Scholar]
- 8. Shah SJ, Katz DH, Selvaraj S, Burke MA, Yancy CW, Gheorghiade M, Bonow RO, Huang CC, Deo RC.. Phenomapping for novel classification of heart failure with preserved ejection fraction. Circulation 2015;131:269–279. [DOI] [PMC free article] [PubMed] [Google Scholar]
- 9. Tabassian M, Sunderji I, Erdei T, Sanchez-Martinez S, Degiovanni A, Marino P, Fraser AG, D'hooge J.. Diagnosis of heart failure with preserved ejection fraction: machine learning of spatiotemporal variations in left ventricular deformation. J Am Soc Echocardiogr 2018;31:1272–1284.e9. [DOI] [PubMed] [Google Scholar]
- 10. Goff DCJ, Lloyd-Jones DM, Bennett G, Coady S, D’Agostino RB, Gibbons R, Greenland P, Lackland DT, Levy D, O’Donnell CJ, Robinson JG, Schwartz JS, Shero ST, Smith Jr SC, Sorlie P, Stone NJ, Wilson PWF, Jordan HS, Nevo L, Wnek J, Anderson JL, Halperin JL, Albert NM, Bozkurt B, Brindis RG, Curtis LH, DeMets D, Hochman JS, Kovacs RJ, Ohman EM, Pressler SJ, Sellke FW, Shen W-K, Smith Jr SC, Tomaselli GF.. ACC/AHA guideline on the assessment of cardiovascular risk: a report of the American College of cardiology/American heart association task force on practice guidelines. Circulation 2013;129:S49–S73. [DOI] [PubMed] [Google Scholar]
- 11. Pedregosa F, Varoquaux G, Gramfort A, Michel V, Thirion B, Grisel O, Blondel M, Prettenhofer P, Weiss R, Dubourg V, Vanderplas J, Passos A, Cournapeau D, Brucher M, Perrot M, Duchesnay E.. Scikit-learn: machine learning in Python. J Mach Learn Res. 2011;12:2825–2830. [Google Scholar]
- 12. Fruchterman TMJ, Reingold EM.. Graph drawing by force‐directed placement. J Softw Pract Exper. 1991;21:1129–1164. [Google Scholar]
- 13. Blondel VD, Guillaume J-L, Lambiotte R, Lefebvre E.. Fast unfolding of communities in large networks. Stat Mech 2008;10:P10008. doi:10.1088/1742-5468/2008/10/P10008. [Google Scholar]
- 14. Marbac M, Sedki M.. VarSelLCM: an R/C++ package for variable selection in model-based clustering of mixed-data with missing values. Bioinformatics 2019;35:1255–1257. [DOI] [PubMed] [Google Scholar]
- 15. Deng H, Han J.. Probabilistic models for clustering. In: Aggarwal CC, Reddy CK, eds. Data Clustering: Algorithms and Applications, 1st edn. Chapman & Hall/CRC data mining and knowledge discovery series, 2014:p61–p86. [Google Scholar]
- 16. Pencina MJ, D'Agostino RB Sr, Steyerberg EW.. Extensions of net reclassification improvement calculations to measure usefulness of new biomarkers. Stat Med 2011;30:11–21. [DOI] [PMC free article] [PubMed] [Google Scholar]
- 17. Thomas JD, Popović ZB.. Assessment of left ventricular function by cardiac ultrasound. J Am Coll Cardiol 2006;48:2012–2025. [DOI] [PubMed] [Google Scholar]
- 18. Cauwenberghs N, Haddad F, Sabovčik F, Kobayashi Y, Amsallem M, Morris DA, Voigt JU, Kuznetsova T.. Subclinical left atrial dysfunction profiles for prediction of cardiac outcome in the general population. J Hypertens 2020;38:2465–2474. doi:10.1097/HJH.0000000000002572. [DOI] [PubMed] [Google Scholar]
- 19. Chetrit M, Cremer PC, Klein AL.. Imaging of diastolic dysfunction in community-based epidemiological studies and randomized controlled trials of HFpEF. JACC Cardiovasc Imaging 2020;13:310–326. [DOI] [PubMed] [Google Scholar]
- 20. Samad MD, Ulloa A, Wehner GJ, Jing L, Hartzel D, Good CW, Williams, Haggerty CM, Fornwalt BK.. Predicting survival from large echocardiography and electronic health record datasets: optimization with machine learning. JACC Cardiovasc Imaging 2019;12:681–689. [DOI] [PMC free article] [PubMed] [Google Scholar]
- 21. Lancaster MC, Salem Omar AM, Narula S, Kulkarni H, Narula J, Sengupta PP.. Phenotypic clustering of left ventricular diastolic function parameters: patterns and prognostic relevance. JACC Cardiovasc Imaging 2019;12:1149–1161. [DOI] [PubMed] [Google Scholar]
- 22. Marwick TH, Gillebert TC, Aurigemma G, Chirinos J, Derumeaux G, Galderisi M, Gottdiener J, Haluska B, Ofili E, Segers P, Senior R, Tapp RJ, Zamorano JL.. Recommendations on the use of echocardiography in adult hypertension: a report from the European Association of Cardiovascular Imaging (EACVI) and the American Society of Echocardiography (ASE). J Am Soc Echocardiogr 2015;28:727–754. [DOI] [PubMed] [Google Scholar]
- 23. Williams B, Mancia G, Spiering W, Agabiti Rosei E, Azizi M, Burnier M, Clement DL, Coca A, de Simone G, Dominiczak A, Kahan T, Mahfoud F, Redon J, Ruilope L, Zanchetti A, Kerins M, Kjeldsen SE, Kreutz R, Laurent S, Lip GYH, McManus R, Narkiewicz K, Ruschitzka F, Schmieder RE, Shlyakhto E, Tsioufis C, Aboyans V, Desormais I.. 2018 ESC/ESH Guidelines for the management of arterial hypertension. Eur Heart J 2018;39:3021–3104.30165516 [Google Scholar]
- 24. Sabovčik F, Cauwenberghs N, Kouznetsov D, Haddad F, Alonso-Betanzos A, Vens C, Kuznetsova T.. Applying machine learning to detect early stages of cardiac remodelling and dysfunction. Eur Heart J Cardiovasc Imaging 2020;Jun 26:jeaa135. doi:10.1093/ehjci/jeaa135. [DOI] [PubMed] [Google Scholar]
Associated Data
This section collects any data citations, data availability statements, or supplementary materials included in this article.
Supplementary Materials
Data Availability Statement
The data that support the findings of this study are available on reasonable request from the corresponding author (T.K.). The datasets are not publicly available as they contain information that could compromise the privacy of the research participants. A Jupyter notebook with Python code producing the clustering results is available at the following link: https://github.com/HCVE/echo-clustering.


