Abstract
Aims
A widely practiced intervention to modify cardiac health, the effect of physical activity on older adults is likely heterogeneous. While machine learning (ML) models that combine various systemic signals may aid in predictive modelling, the inability to rationalize predictions at a patient personalized level is a major shortcoming in the current field of ML.
Methods and results
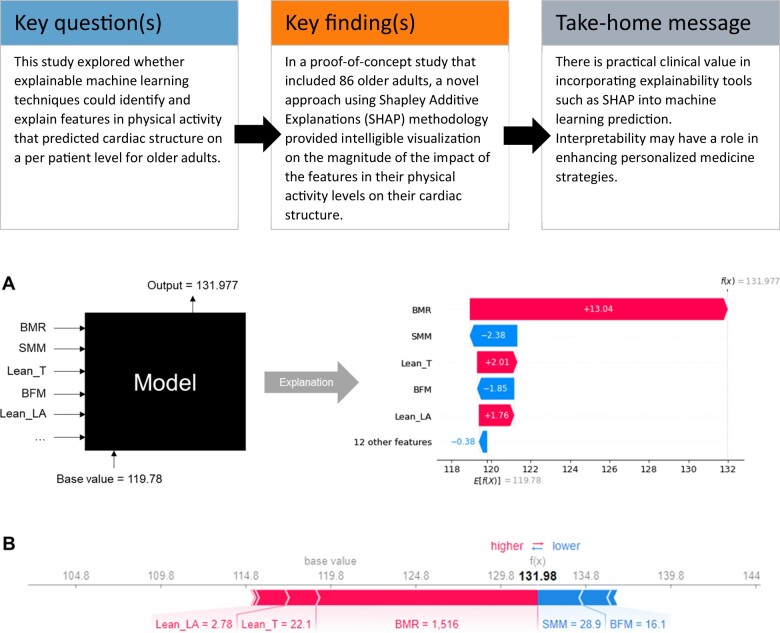
We applied a novel methodology, SHapley Additive exPlanations (SHAP), on a dataset of older adults n = 86 (mean age 72 ± 4 years) whose physical activity levels were studied alongside changes in their left ventricular (LV) structure. SHAP was tested to provide intelligible visualization on the magnitude of the impact of the features in their physical activity levels on their LV structure. As proof of concept, using repeated K-cross-validation on the train set (n = 68), we found the Random Forest Regressor with the most optimal hyperparameters, which achieved the lowest mean squared error. With the trained model, we evaluated its performance by reporting its mean absolute error and plotting the correlation on the test set (n = 18). Based on collective force plot, individually numbered patients are indicated on the horizontal axis, and each bandwidth implies the magnitude (i.e. effect) of physical parameters (higher in red; lower in blue) towards prediction of their LV structure.
Conclusions
As a tool that identified specific features in physical activity that predicted cardiac structure on a per patient level, our findings support a role for explainable ML to be incorporated into personalized cardiology strategies.
Keywords: Artificial intelligence, Cardiology, Machine learning, Ageing, Physical activity, Explainable, SHAP
Graphical Abstract
Introduction
Currently, multiple groups are working on developing machine learning (ML) techniques for cardiovascular disease.1–3 A common theme across this rapidly burgeoning field is the experimental use of heterogeneous methodologies. While the pursuit to fine-tune ML models in disease prediction is an ongoing one, there is far less work on operationalizing these models for future clinical translation.
Backed by power in large datasets present in population-based healthcare, we anticipate immense potential for ML to influence healthcare goals of interest to large population sets. The field of physical activity is a prime example, where strategies personalized to individuals will likely have widespread healthcare impact. Physical activity has an important role in modulating the impact of population ageing on cardiovascular disease as well as ageing-related declines in muscle mass and overall function.4 However, there is wide interindividual variation in responses to physical activity.5
As physical activity is a major modifiable lifestyle factor that can mitigate ageing-related changes in cardiovascular function in conjunction to sarcopenia and frailty, focusing work from ML to personalize physical activity strategies is likely impactful.
In this work, we applied the SHapley Additive exPlanations (SHAP) methodology on a dataset of older adults whose physical activity levels were studied in conjunction with changes in their left ventricular (LV) structure. We hypothesize that intelligent visualization of physical factors of greatest impact on LV structure by the SHAP approach would identify unique features on a per patient level.
Materials and methods
Study population
We studied data from a random pilot sample of human subjects recruited from the Cardiac Ageing Study (CAS),6 a prospective study initiated in 2014 that examines characteristics and determinants of cardiovascular function in elderly adults. The current study sample consisted of men and women who participated in the baseline CAS 2014–2017 examination who had no self-reported history of physician-diagnosed cardiovascular disease (such as coronary heart disease, atrial fibrillation), stroke, or cancer. Written informed consent was obtained from participants upon enrolment. The SingHealth Centralised Institutional Review Board (CIRC/2014/628/C) had approved the study protocol.
Subjects underwent transthoracic echocardiography. Briefly, echocardiography was performed using ALOKA α10 with a 3.5 MHz probe. In each subject, standard echocardiography, which included 2D, M-mode, pulse Doppler, and tissue Doppler imaging, was performed in the standard parasternal and apical (apical four-chamber, apical two-chamber, and apical long) views, and three cardiac cycles were recorded. Left ventricular ejection fraction and LV mass were measured. From the parasternal long-axis view, LV dimensions were assessed and LV mass was calculated using the Devereux’s formula.7 All measurements were measured by the same operator, and the measurements were averaged over three cardiac cycles and adjusted by the RR interval.
Machine learning
With the collected data, the participants’ physical functional parameters were identified and grouped together as features (Supplementary material online, Appendix SA). They were then used to predict the target variable, LV mass. The dataset was randomly divided, with 80% used for training (n = 68) and 20% used for testing (n = 18). Missing feature data were also replaced with mean values.
The Random Forest (RF) is an ML technique based on a collection of decision trees.8 Given our small dataset, RF is a suitable choice of model because it can handle large numbers of variables with relatively small numbers of observations.9 The RF does this by including many trees, in which each tree is generated for a portion of the data which is randomly sampled with replacement. Each tree generates an output and the RF inference is determined according to the aggregate of the output from the different trees. The ability of the RF to deal with a non-linear boundary and the combination of outputs from multiple trees allows the technique to give an accurate output.8
In our approach, we used grid search and four-fold cross-validation on the train set to find the optimal RF Regressor, which had the lowest mean validation mean squared error. The final tuned parameters were listed in Supplementary material online, Table S1. With the trained model, we evaluated its performance by reporting its mean absolute error and plotting the correlation on the test set.
Using SHAP to interpret model
SHAP was used as a unified framework to interpret model predictions. Specifically, we used Tree SHAP, a variant of SHAP to provide explanations for the individual predictions made by RF. We created waterfall and individual force plots, where each feature value was visualized as a force that either increases or decreases the base value. Shapley values were aggregated to provide global importance.
Results
We used RF regression to analyse the dataset and complemented it with SHAP to interpret the output. The objective is to rank variables by local and global importance, for determining LV structure, among a cohort of community older adults involved in physical activity.
The baseline clinical characteristics and cardiovascular measurement of the study population are described in Table 1.
Table 1.
Baseline clinical characteristics and cardiovascular measurements of the study population
| Study population (n = 86) | |
|---|---|
| Clinical covariates | |
| Age, years | 72 (4.2) |
| Female sex (%) | 43 (50) |
| Weight, kg | 59.6 (10.7) |
| Systolic blood pressure, mmHg | 150 (37.1) |
| Diastolic blood pressure, mmHg | 73 (10.7) |
| Pulse, beats per minute | 74 (13.0) |
| Physical functional parameters | |
| Skeletal muscle mass, kg | 22.0 (4.6) |
| Body fat mass, kg | 19.3 (6.8) |
| Percentage body fat, % | 31.4 (8.0) |
| Waist–hip ratio | 0.9 (0.06) |
| Fitness score | 66.2 (9.2) |
| Basal metabolic rate, kcal | 1255 (167.2) |
| Arm mass, kg | 2.0 (.5) |
| Trunk mass, kg | 18.3 (3.4) |
| Appendicular lean mass, kg | 16.4 (3.8) |
| Cardiac measurements by echocardiography | |
| Interventricular septum thickness at end-diastole (IVSD) (cm) | 0.8 (0.1) |
| Interventricular septum thickness at end-systole (IVSS) (cm) | 1.2 (0.2) |
| Left ventricular internal diameter end-diastole (LVIDD) (cm) | 4.4 (0.5) |
| Left ventricular internal diameter end-systole (LVIDS) (cm) | 2.4 (0.5) |
| Left ventricular posterior wall end-diastole (LVPWD) (cm) | 0.8 (0.1) |
| Left ventricular posterior wall end-systole (LVPWS) (cm) | 1.4 (0.2) |
| Left ventricular outflow tract (LVOT) (cm) | 2.1 (0.3) |
| Aortic diameter (AO), cm | 3.0 (0.5) |
| Left atrium (LA) (cm) | 3.6 (0.6) |
| Left ventricular ejection fraction (LVEF) (%) | 75 (7.3) |
| Left ventricular fractional shortening (LVFS) (%) | 44 (6.8) |
| Left ventricular mass, g | 119 (42.7) |
| Left atrial volume, mL | 36 (12) |
| Peak velocity flow in early diastole E (MV E peak), m/s | 0.6 (0.1) |
| Peak velocity flow in late diastole by atrial contraction A (MV A peak), m/s | 0.8 (0.2) |
| Ratio MV E peak: MV A peak | 0.9 (0.3) |
| Mitral valve flow deceleration time (MV DT) (ms) | 200 (31) |
| Pulmonary artery systolic pressure (PASP) (mmHg) | 27 (6.4) |
Standard deviations are in parentheses.
Based on the test set (Figure 1), there is an observed correlation between the predicted and actual values with R2 value of 0.67. Both curves follow each other closely and an acceptable mean absolute error of 18.917 (<1 SD of 47.704 for the test set distribution). This implies that our RF model is moderately accurate at predicting the LV mass.
Figure 1.
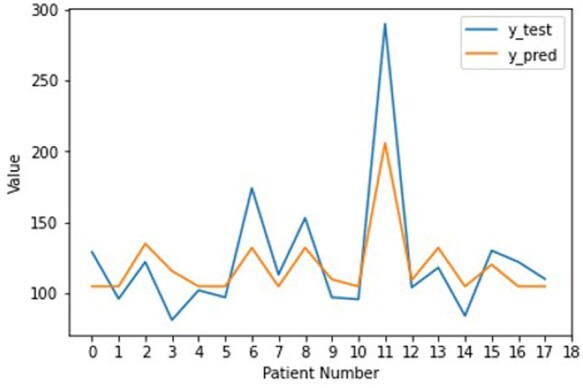
Line plots comparing the true and predicted left ventricular mass by the Random Forest Regressor on the test set.
Based on the train set (Figure 2), basal metabolic rate (BMR) was the most important feature in determining the LV structure due to its greatest average impact on the model output, as indicated by the mean absolute SHAP values. Other features such as appendicular lean mass (ALM) were found to have unimportant as their mean SHAP values were zero. As a more informative alternative, Figure 3 describes the relationship between the features and their global impact based on the computed SHAP values for each instance. For example, higher BMR contributed to a larger LV mass, showing positive correlation. This is because a high BMR feature value (in red) maps to a higher positive SHAP value, which is equivalent to the positive change in value from the expected LV mass prediction for that observation. On the other hand, a low BMR feature value (in blue) generally maps to a lower SHAP value that falls within the left distribution, where most of them correspond to a negative contribution to the expected output.
Figure 2.
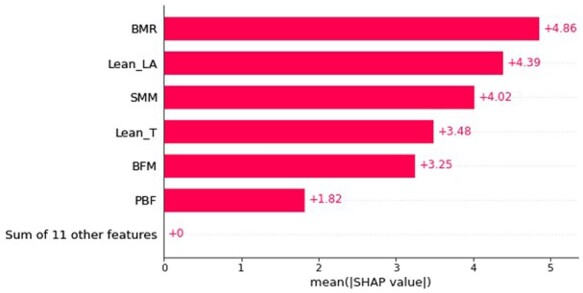
Bar plot consisting of features sorted by their importance, which is measured as the mean absolute SHapley Additive exPlanations values, within the train set.
Figure 3.
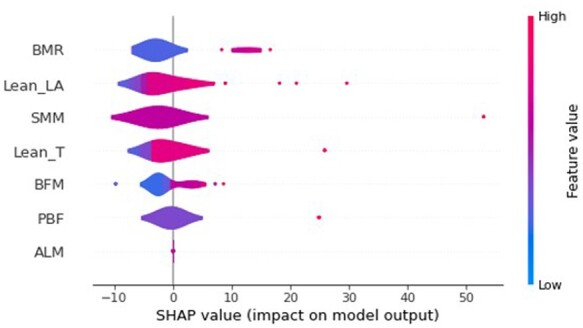
Summary plot describing the relationship between the value of the feature and the impact on the prediction within the train set. Only the top seven features were displayed.
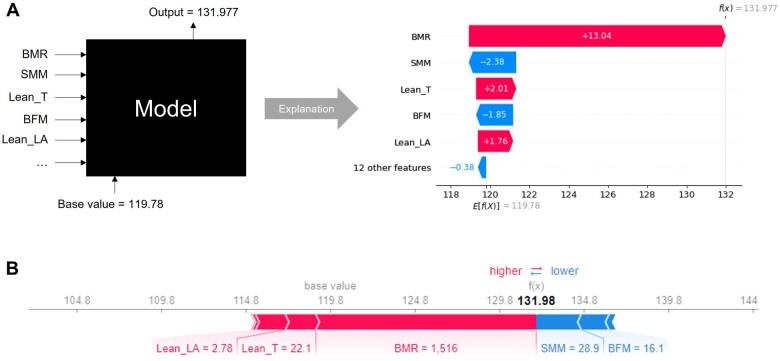
Based on the test set (Figure 4), the SHAP TreeExplainer visually provides local interpretability to a model’s prediction for an individual patient in two related flavours. Figure 4A can be thought of as the decomposed version of Figure 4B, detailing the model’s decision in a sequential manner. This is because each of the feature contribution can be independently calculated using SHAP values and then summed up to give the final prediction. For example, when predicting the LV mass for Patient #6, a BMR feature value of 1516 contributed a corresponding SHAP value of 13.04, resulting in a final predicted LV mass of 132. It can also be observed that the effect of BMR for this patient outweighs other weaker positive factors [e.g. Lean T and arm mass (Lean LA)] and negative factors [e.g. skeletal muscle mass (SMM) and body fat mass (BFM)].
Figure 4.
SHapley Additive exPlanations provides explainability to the predicted left ventricular mass of the black box Random Forest Regressor for Patient #6 in the form of waterfall plot (A) and individual force plot (B).
Individual force plots can also be combined to produce stacked SHAP explanations, which can be arranged according to their original ordering (Figure 5) or clustering similarity (Supplementary material online, Figure SA). Based on the test set, Figure 5 resembles the line plot for the predicted values in Figure 1, where the vertical axis describes the predicted LV mass by the RF Regressor while the horizontal axis shows the original patient ordering. Each band width implies the magnitude (i.e. effect) of physical parameters (higher in red; lower in blue) towards prediction of their LV structure. Again, using Patient #6 as an example, BMR was observed to be the single predominant positive factor on LV mass, outweighing other weaker positive factors and negative factors. In contrast, LV mass in Patient #11 was predicted jointly by several positive factors (e.g. SMM, BMR, Lean T). This suggests that intervening on these prominent physical functional parameters (in red) would more likely improve the cardiac health state of Patient #11, as opposed to Patient #6 who has less deterministic parameters.
Figure 5.
Collective force plot for test set based on original patient ordering. The plot has been superimposed to show the impact of the physical functional parameters for Patients #6 and #11.
A heatmap plot with the same clustering order, yielding the same curve can also be presented (Supplementary material online, Figure SA). In both figures, clinicians can see that Patients #6, #8, and #12 were grouped as similar instances (renamed as instances 1, 2, and 3, respectively) due to their comparable features after clustering. The clinicians can therefore infer that these patients in the same subgroup can be characterized as having similarly high BMR as the main contributor to their poor cardiac outcome, which also suggests activities that can lower their BMR may be effective for this group of patients.
Discussion
In this exploratory work, we demonstrated the utility of SHAP to enhance interpretation of factors associated with physical activity and cardiac structure.
In contrast to vast volumes of work performed on optimizing model accuracy,1–3 ML work on model interpretability is scarce. However, our work adds to recent work by a handful of others who recognize the value of SHAP for model interpretation. In the field of cardiology, Lu et al.10 used XGBoost regression in conjunction with SHAP analyses to identify heart failure clinical subtypes based on electronic health records. Their model utilized structured data from electronic health records to aid clinicians in detecting heart failure stages but did not include other clinical information. In our work, we studied clinical parameters in conjunction with patient-specific LV structure and determined the relative importance of patient-specific factors. The use of transthoracic echocardiogram11 as an imaging test of choice for LV assessment is an added novelty of our work. Similarly, another recent study used SHAP approach to depict electrocardiographic features associated with LV geometry.12 Taken together, innovative solutions that combine clinical parameters with detailed cardiovascular imaging may represent novel approaches for ML interpretation.
The existing gaps in ML work that are geared towards visual interpretation present fresh opportunities for this field. In a large review comprising of 103 cohorts and over 3 million individuals,13 most studies in ML only reported the best performing models and evaluation metrics that were suited to their own dataset. While these methods should continue to form the backbone of ML work, stronger emphasis on interpretability could further enhance clinical applications. The clinicians also may be able to better corroborate findings across different studies despite the technical heterogeneity (e.g. hyperparameter selection, data partitioning). In this study, we showed that the RF regression model performed well in predicting the LV mass using a set of physical functional parameters, and further demonstrated the use of SHAP as a visualization tool to provide informative plots based on explanations that justify the model’s decision.
As a unified framework for interpreting model predictions, SHAP is associated with three key desirable properties, namely local accuracy, missingness and consistency.14 These properties make SHAP a superior method over other attribution methods such as Local Interpretable Model-Agnostic Explanations (LIME).15 On a local level, individual force plot and waterfall plot can be created for every instance, where each feature value can be visualized as a force that either increases or decreases the base value (i.e. the average of all predictions). Furthermore, all the individual force plots can also be stacked horizontally to produce a collective force plot and placed side by side according to clustering similarity, allowing clinicians to easily identify groups of similar instances.
As an extension, Shapley values can also be aggregated to provide global interpretability. Global importance can be calculated by summing the absolute Shapley values per feature across the data as a way of quantifying the marginal contribution of each predictor towards the target variable. By sorting the features in decreasing order of importance, the feature importance plot allows clinicians to visualize the most important features that require more attention. It is critical to point out that the implementation of SHAP, which is based on the magnitude of feature attributions, is different from the permutation feature importance, which is based on the decrease in model performance.
SHAP also offers summary plot, which may be more informative as it combines feature importance with feature effects as well as shows the relationship between the value of a feature and its impact on the prediction from a more global perspective. Finally, a heatmap can also be plotted, which allows for data in two dimensions. The variable feature importance is sorted in descending order along the vertical axis and uses hot-to-cold scheme to reflect the features’ contributions towards the predictions for the instances that lie on the horizontal axis.
The potential impact of local explanations for ML models is profound. The incorporation of an explainability tool like SHAP into clinical workflow is especially important in overcoming the resistance of adopting such black box models due to the perils of blindly trusting their outputs at face value. Understanding why these algorithms make certain predictions is just as crucial as their accuracy because it facilitates transparency and can assist the clinicians to make more informed decisions. The upshot of this implementation is that patient outcomes may improve. Further research in this area is needed.
Our exploratory work may be limited by a small dataset. However, the goal of this exploration was to determine suitable ML methods to present data in clinically useful ways, rather than on model accuracy. In the area of interpretability, we have confined our results to using SHAP methodology. We acknowledge that there may be other methodology for interpretability, such as LIME,16 counterfactual fairness,17 and justification narratives18 that are available in the wider AI field. However, in our task which requires the measurement of feature importance for the clinicians to interpret, SHAP stands out as the only additive feature attribution method that satisfies the two key properties of consistency and accuracy.14
Conclusion
There appears to be practical clinical value in incorporating explainability tools such as SHAP into ML prediction. Interpretability may have a role in enhancing personalized medicine strategies. With some guidance, the generated SHAP plots are easy to understand with the well-designed colour variations and intuitive labels, even for a layman without any background in ML. The SHAP API is also publicly available and well-documented,19 hence it can be easily integrated into any user interface that supports python. We hope our work provides the motivation for the medical industry to begin incorporating such explainability tools into their workflow with the overall goal of improving personalized medicine.
Supplementary material
Supplementary material is available at European Heart Journal – Digital Health online.
Supplementary Material
Acknowledgements
We thank the staff of the laboratories involved for participating in the conduct of the study.
Declaration of Helsinki
The authors state that their study complies with the Declaration of Helsinki, that the locally appointed ethics committee has approved the research protocol and that informed consent has been obtained from the subjects.
Funding
The Cardiac Aging Study has received funding support from the National Medical Research Council of Singapore (MOH-000153), Hong Leong Foundation, Duke-NUS Medical School, Estate of Tan Sri Khoo Teck Puat, and Singhealth Foundation. The funders had no role in the design and conduct of the study; collection; management, analysis, and interpretation of the data; and preparation, review, or approval of the manuscript.
Conflict of interest: none declared.
Data availability
Data cannot be shared publicly for ethical reasons due to institutional restrictions.
Contributor Information
De Rong Loh, Duke-NUS Medical School, 8 College Road, Singapore 169857, Singapore; Singapore University of Technology and Design, 8 Somapah Road, Singapore 487372, Singapore.
Si Yong Yeo, Singapore University of Technology and Design, 8 Somapah Road, Singapore 487372, Singapore.
Ru San Tan, Duke-NUS Medical School, 8 College Road, Singapore 169857, Singapore; National Heart Centre Singapore, 5 Hospital Drive, Singapore 169609, Singapore.
Fei Gao, Duke-NUS Medical School, 8 College Road, Singapore 169857, Singapore; National Heart Centre Singapore, 5 Hospital Drive, Singapore 169609, Singapore.
Angela S Koh, Duke-NUS Medical School, 8 College Road, Singapore 169857, Singapore; National Heart Centre Singapore, 5 Hospital Drive, Singapore 169609, Singapore.
References
- 1. Weng SF, Reps J, Kai J, Garibaldi JM, Qureshi N. Can machine-learning improve cardiovascular risk prediction using routine clinical data? PLoS One 2017;12:e0174944. [DOI] [PMC free article] [PubMed] [Google Scholar]
- 2. Kumari CU, Murthy ASD, Prasanna BL, Reddy MPP, Panigrahy AK. An automated detection of heart arrhythmias using machine learning technique: SVM. Mater Today Proc 2021;45:1393–1398. [Google Scholar]
- 3. Li JP, Haq AU, Din SU, Khan J, Khan A, Saboor A. Heart disease identification method using machine learning classification in E-healthcare. IEEE Access 2020;8:107562–107582. [Google Scholar]
- 4. Marzetti E, Calvani R, Tosato M, et al. ; SPRINTT Consortium. Physical activity and exercise as countermeasures to physical frailty and sarcopenia. Aging Clin Exp Res 2017;29:35–42. [DOI] [PubMed] [Google Scholar]
- 5. Moreno-Agostino D, Daskalopoulou C, Wu Y-T, et al. The impact of physical activity on healthy ageing trajectories: evidence from eight cohort studies. Int J Behav Nutr Phys Act 2020;17:92. [DOI] [PMC free article] [PubMed] [Google Scholar]
- 6. Keng BMH, Gao F, Teo LLY, et al. Associations between skeletal muscle and myocardium in aging: a syndrome of “cardio-sarcopenia”? J Am Geriatr Soc 2019;67:2568–2573. [DOI] [PMC free article] [PubMed] [Google Scholar]
- 7. Lang RM, Badano LP, Mor-Avi V, et al. Recommendations for cardiac chamber quantification by echocardiography in adults: an update from the American Society of Echocardiography and the European Association of Cardiovascular Imaging. J Am Soc Echocardiogr 2015;28:1–39. [DOI] [PubMed] [Google Scholar]
- 8. Breiman L. Random forests. Mach Learn 2001;45:5–32. [Google Scholar]
- 9. Grömping U. Variable importance assessment in regression: linear regression versus random forest. Am Stat 2009;63:308–319. [Google Scholar]
- 10. Lu S, Chen R, Wei W, Lu X. Understanding heart-failure patients EHR clinical features via SHAP interpretation of tree-based machine learning model predictions. 2021; arXiv:2103.11254. [PMC free article] [PubMed]
- 11. Mitchell C, Rahko PS, Blauwet LA, et al. Guidelines for performing a comprehensive transthoracic echocardiographic examination in adults: recommendations from the American Society of Echocardiography. J Am Soc Echocardiogr 2019;32:1–64. [DOI] [PubMed] [Google Scholar]
- 12. Angelaki E, Marketou ME, Barmparis GD, et al. Detection of abnormal left ventricular geometry in patients without cardiovascular disease through machine learning: An ECG-based approach. J Clin Hypertens (Greenwich) 2021;23:935–945. [DOI] [PMC free article] [PubMed] [Google Scholar]
- 13. Krittanawong C, Virk HUH, Bangalore S, et al. Machine learning prediction in cardiovascular diseases: a meta-analysis. Sci Rep 2020;10:16057. [DOI] [PMC free article] [PubMed] [Google Scholar]
- 14. Lundberg SM, Lee S-I. A Unified Approach to Interpreting Model Predictions. In: NIPS'17: Proceedings of the 31st International Conference on Neural Information Processing Systems 2017, pp. 4768–4777. Curran Associates, Inc. [Google Scholar]
- 15. Ribeiro MT, Singh S, Guestrin C. “Why should i trust you?”: explaining the predictions of any classifier. 2016; 10.1145/2939672.2939778. [DOI] [Google Scholar]
- 16. Ribeiro MT, Singh S, Guestrin C. Anchors: high-precision model-agnostic explanations. In: 32nd AAAI Conference on Artificial Intelligence, AAAI 2018. 2018; pp. 1527–1535. https://ojs.aaai.org/index.php/AAAI/article/view/11491.
- 17. Kusner M, Loftus JRussell C, Silva R. Counterfactual fairness. In: Proc. 31st int. Conf. Neural Information Processing Systems NIPS’17, Red Hook, NY, USA, 2017, pp. 4069–4079. Curran Associates Inc.
- 18. Biran O, Mckeown K. Justification narratives for individual classifications. In: AutoML Workshop at ICML. 2014; pp. 1–7. http://www.cs.columbia.edu/nlp/papers/2014/justification_automl_2014.pdf.
- 19. Lundberg SM. API Reference—SHAP Latest Documentation. 2018. https://shap-lrjball.readthedocs.io/en/latest/api.html.
Associated Data
This section collects any data citations, data availability statements, or supplementary materials included in this article.
Supplementary Materials
Data Availability Statement
Data cannot be shared publicly for ethical reasons due to institutional restrictions.


