

Abstract
The elemental composition, mineral phases, and crystalline structure of nephrite jade were investigated using calibration-free laser-induced breakdown spectroscopy (CF-LIBS), Raman spectroscopy, and X-ray diffraction (XRD). For compositional analysis, the laser-induced plasma was generated on the surface of nephrite jade. The plasma emissions were then acquired and analyzed, which revealed several elements in the sample, including Si, Mg, Ca, Li, Fe, Al, Na, K, and Ni. The plasma temperature was extracted from the Boltzmann plot before and after two-step self-absorption correction, and used in CF-LIBS calculations to get the elemental concentration. After self-absorption correction, the quantitative results obtained using CF-LIBS were found to be in close agreement with ICP-OES. The Raman spectrum of nephrite jade exhibits Si-O and M-OH stretching vibrations in the regions of 100 cm−1 to 1200 cm−1 and 3600 cm−1 to 3700 cm−1, respectively, whereas the XRD spectrum revealed the monoclinic crystalline phase of tremolite.
Keywords: Nephrite jade, Spectroscopic analysis, Two-step self-absorption correction, CF-LIBS, ICP-OES, XRD analysis
Nephrite jade; Spectroscopic analysis; Two-step self-absorption correction; CF-LIBS; ICP-OES; XRD analysis
1. Introduction
Nephrite jade is a metamorphic mineral that varies in color from light to dark green, white, pinkish, yellow, tobacco-brown, and bluish-black depending on the concentration of silicate, calcium, magnesium, iron, and other trace elements [1], [2]. An assortment of research studies about nephrite jade's structural and compositional analysis have been reported. Axel et al. performed the compositional analysis of the nephrite jade collected from southern Siberia, Russia, using secondary ion mass spectrometry (SIMS) [3]. Hongsheng et al. used laser ablation inductively coupled plasma mass spectrometry (LA-ICP-MS) to determine the trace as well as rare-earth elements in the nephrite samples and X-ray diffraction to find the crystalline structure [4]. Jianlong et al. classified the nephrite samples collected from five different geographical sites in China, Russia, and Korea using laser-induced breakdown spectroscopy (LIBS) multivariant methods [5]. Zeshan et al. identified nephrite samples using LIBS and laser ablation time-of-flight mass spectrometry (LA-TOF-MS). The determined ratio revealed that nephrite jade is Ferro-actinolite [6]. Yi et al. investigated the color, phase, and structural changes of nephrite as a function of temperature using XRD, UV-Vis, SEM, TGA, and FTIR [7].
LIBS is an atomic spectroscopy technique widely used for the determination of elemental composition. It offers numerous advantages over other analytical techniques, such as no or little sample preparation, in-situ detection, and real-time multi-elemental analysis [8], [9], [10], [11], [12]. In LIBS, the sample is irradiated with a high-energy focused laser pulse, forming transitory plasma [13], [14]. The plasma is then used for the quantitative elemental analysis, either using a calibration-based or calibration-free method (CF-LIBS). The calibration-based LIBS is the most reliable and widely used approach. It utilizes matrix-matched standard reference materials (SRM) to build calibration curves. When matrix-matched SRMs are not available, as in the present case, the CF-LIBS is used as an alternative approach, which determines the relative elemental concentration without using standard reference material, provided that the assumptions such as stoichiometric ablation, optically thin plasma condition, and local thermodynamic equilibrium (LTE) are fulfilled [15], [16], [17], [18], [19]. In the conventional CF-LIBS approach, the plasma temperature and the y-intercepts of Boltzmann plots of all the species are required for estimating the concentration of sample species. The plasma temperature is determined either using the Boltzmann plot or the Saha-Boltzmann plot. The accuracy of plasma temperature is affected by the presence of self-absorption, which subsequently reduces the accuracy of quantitative results [20], [21]. Several methods have been reported in the literature to evaluate and correct self-absorption in the emission lines [22], [23]. Sun et al. proposed an internal reference method for self-absorption correction (IRSAC), in which an internal reference line, free from self-absorption was used to correct the spectral intensities of other self-absorbed emission lines. After self-absorption correction, the quantitative results were significantly closer to the certified concentration than those obtained with conventional CF-LIBS [24].
The mineral phases and crystalline structures of a gemstone define its quality and are used to differentiate its different varieties. Raman spectroscopy and XRD are two widely used analytical techniques for determining the mineral phases and crystalline structure of a material. Due to their non-destructive nature, these techniques are considered suitable for analyzing gems and other geochemical samples [25], [26], [27]. In the literature, these techniques are also employed to investigate the mineral phases and crystalline structure of nephrite jade [28], [29], [30], [31].
The present study aims to perform the elemental, spectroscopic, and structural analysis of nephrite jade gemstone using LIBS, Raman spectroscopy, and XRD. The quantitative analysis of nephrite jade was performed with CF-LIBS. To improve the accuracy of quantitative results, a two-step self-absorption correction method was applied, which corrects the spectral line intensities of elemental species that were used in the Boltzmann plot to determine the accurate value of plasma temperature. The plasma temperature and corrected intensities were used in the CF-LIBS method to extract the relative elemental composition. The CF-LIBS results obtained after self-absorption correction were in close agreement with ICP-OES. Further, the mineral phases of the nephrite jade were investigated with Raman spectroscopy, while crystalline structural and lattice parameters were determined with XRD.
2. Experimental details
The sample of nephrite jade was collected from nephrite ore mines in the Bajaur district, KPK province of Pakistan. The sample was cleaned in the ultrasonic bath by adding a drop of house detergent to water and kept for 20 minutes. Thereafter, the sample was put in distilled water, washed with ethanol for 20 minutes, and dried in an ambient atmosphere. The collected sample has a smooth surface, and its color ranges from light to dark green with little white spots on its surface, as shown in Fig. 1(a). The micro image of nephrite jade taken by SEM (FEI Nova NanoSEM 450) depicts the growth of fine, randomly aligned tremolite bundles of different sizes and shapes, as shown in Fig. 1(b). The standard concentration of elements was determined by ICP-OES in which a 20 mg finely ground sample was dispersed into a concentrated mixture of HNO3 (9 mL) and HF (3 mL) acids, prepared in triplicate, followed by microwave digestion using the EPA-3052 method. The sample was then heated in a Teflon cup using a microwave digester, Anton Paar-Multiwave GO, operating at 180 °C for 9.30 min, providing heat at the rate of 10 °C/min. Finally, the prepared sample was analyzed using the Agilent Technologies 5110-vdv ICP-OES system.
Figure 1.

A macro image of a nephrite jade sample captured by a CCD camera is shown in Fig. 1(a), while Fig. 1(b) represents a micro-image captured by a SEM.
The schematic of the experimental setup used to record the LIBS emission spectrum is shown in Fig. 2. The third harmonic (355 nm) of a Q-switched Nd:YAG (Quantel, Q-Smart 850) laser, of maximum pulse energy of 230 mJ with a pulse duration of 5 ns was focused on the sample using a convex lens of 25 cm focal length on an area of cm2, on the sample surface. The flash lamp Q-switch delay was used to vary the energy of the laser pulses and was monitored with an energy meter (Maestro-Gentec). The sample was placed on a two-dimensional rotating stage to ensure a fresh surface for every laser pulse. The emitted optical radiations were collected by a collecting lens (0°–45° field of view) attached to the bundle of six fiber optic cables placed normal to the incident laser beam. The collected radiation was sent to LIBS2500+ spectrometer via these optical fibers. The LIBS2500+ has six spectrometers, with each having a resolution of 0.1 nm. The LIBS2500+ multichannel spectrometer can record the spectrum ranging from 230 nm to 805 nm. The optical spectrum was acquired at a detector gate delay of 2.5 μs and fixed gate width of 2.1 ms, and the dark signal of the detector was registered and subtracted from the observed signal by OOILIBS plus software.
Figure 2.

The LIBS experimental setup used to record the emission spectrum.
The Raman spectrum of nephrite jade was recorded to investigate the mineral phases by illuminating the sample continuously for 30 seconds by a 532 nm circularly polarized excitation source of 30 microwatt power. The backscattered light signals were collected on a grating-based spectrometer (Horiba iHR550). To eliminate the uncertainty, an average of five spectra was used for analysis.
The crystalline structure and chemical composition of the sample was determined by recording the XRD spectrum with an X' Pert Pro laboratory diffractometer (PAN analytical) using CuK ( nm) as an X-ray source. The X-ray tube was operated at a potential difference of 40 kV and a current of 30 mA. The XRD data was collected in a step size of 0.04°.
3. Result and discussion
3.1. Spectral analysis
Fig. 3(a-d) illustrates a typical LIBS emission spectrum of nephrite jade, recorded under optimized experimental conditions using 355 nm laser pulses from Nd:YAG laser in the spectral range from 230 nm to 805 nm. The spectrum was recorded in the air at a fixed laser energy of 50 mJ per pulse. The spectrum is composed of numerous spectral lines corresponding to various neutral and singly ionized species present in the sample. The spectrum was analyzed, and the emission lines of elements were identified using the NIST database and pure elemental spectra [32]. In the spectrum, the emission lines of Si, Fe, Ca, Mg, Na, Li, Al, Ni, and K belonging to neutral or singly ionized species were detected. The emission lines used for the determination of plasma temperature and elemental concentration using CF-LIBS are given in Table 1.
Figure 3.

The recorded emission spectrum of nephrite jade ranging from (a) 230–380 nm, (b) 380–520 nm, (c) 520–660 nm, and (d) 660–800 nm, along with the identified labeled spectral lines of neutral and ionic species on the spectrum.
Table 1.
List of neutral species with wavelength and self-absorption correction coefficients used in quantitative analysis. The wavelengths in bold represent the internal reference lines of each species.
| Element | Wavelength (nm) | S.A coefficient after 1st correction | S.A coefficient after 2nd correction |
|---|---|---|---|
| Ca I | 422.67 | 0.65 | 0.31 |
| 428.30 | 0.46 | 0.21 | |
| 428.94 | 0.60 | 0.28 | |
| 430.77 | 0.73 | 0.34 | |
| 442.54 | 0.60 | 0.28 | |
| 443.50 | 0.52 | 0.24 | |
| 445.47 | 0.30 | 0.14 | |
| 487.81 | 1.00 | 0.47 | |
| 643.91 | 0.29 | 0.13 | |
| Mg I | 285.21 | 0.03 | 0.01 |
| 383.23 | 0.09 | 0.04 | |
| 383.83 | 0.07 | 0.03 | |
| 516.73 | 1.00 | 0.45 | |
| 517.27 | 0.69 | 0.30 | |
| 518.36 | 0.56 | 0.25 | |
| Si I | 243.52 | 0.04 | 0.01 |
| 250.69 | 0.04 | 0.02 | |
| 252.41 | 0.05 | 0.02 | |
| 252.85 | 0.04 | 0.02 | |
| 263.13 | 0.09 | 0.04 | |
| 288.16 | 0.05 | 0.02 | |
| 390.55 | 1.00 | 0.41 | |
| Fe I | 248.32 | 0.14 | 0.11 |
| 252.28 | 0.65 | 0.53 | |
| 344.06 | 0.87 | 0.71 | |
| 382.04 | 0.31 | 0.80 | |
| 438.35 | 1.00 | 0.81 | |
| K I | 404.41 | 1.00 | 0.91 |
| 766.49 | 0.28 | 0.23 | |
| 769.90 | 0.31 | 0.27 | |
| Al I | 308.21 | 0.27 | 0.19 |
| 309.27 | 1.00 | 0.90 | |
| 394.40 | 0.41 | 0.29 | |
| 396.15 | 0.21 | 0.15 | |
| Ni I | 349.30 | 0.96 | 0.84 |
| 356.64 | 1.00 | 0.88 | |
| 361.94 | 0.76 | 0.61 | |
| Na I | 330.23 | 1.00 | 0.90 |
| 588.99 | 0.38 | 0.31 | |
| 589.59 | 0.26 | 0.21 | |
| Li I | 460.29 | 1.00 | 0.90 |
| 610.35 | 0.44 | 0.31 | |
| 670.78 | 0.26 | 0.19 | |
3.2. Compositional analysis using CF-LIBS technique
The quantitative analysis of nephrite jade was performed using the CF-LIBS technique. The line intensity measured in the temporal window of data acquisition can be expressed as follows:
| (1) |
where the wavelength λ corresponds to a specific transition between two energy levels (Upper) and (lower) of a particular element, F is the experimental factor whose value depends upon the plasma number density, plasma volume, and efficiency of the optical system, is the concentration of element “s” in the sample, is the transition probability between energy levels i and j of the selected line, is the degeneracy of the upper level, is the partition function of a particular element “s”, is the Boltzmann constant, and T represents the plasma temperature. In equation (1), the values of spectroscopic parameters , , and were taken from the NIST database [32], while the parameters F, and T were determined by analyzing the recorded emission spectrum. The plasma temperature was determined by drawing the Boltzmann plot using the integrated line intensities of the spectral lines and other spectroscopic parameters were taken from the NIST database.
The Boltzmann plot of Si, Ca, Fe, and Mg before self-absorption correction (SAC) is illustrated in Fig. 4(a). According to the assumption of optically thin and LTE plasma, the linear fitting of the Boltzmann plot of every element gives a set of parallel lines of nearly the same slope but with different intercepts. The slope is used to extract plasma temperature. In the present case, the slope of the Boltzmann plot of each element is different, which predicts that plasma is thick and emission lines are self-absorbed. The emission lines of an element, having a large transition probability and a smaller value of upper-level energy, are severely affected by self-absorption as compared to other emission lines [24]; therefore, the data points in Fig. 4(a) of the Boltzmann plot are scattered, showing poor linear fitting, and the determined plasma temperature has high uncertainty, which ultimately reduces the accuracy of quantitative analysis. In this situation, the average plasma temperature extracted from the slope of the Boltzmann plots before SAC was 24000 K. After self-absorption correction, data points on Boltzmann plots in Fig. 4(b, c) are stretched along the fitted line, which results in good linear fitting, accurate plasma temperature, and consequently reliable elemental analysis.
Figure 4.

The Boltzmann plots of neutral species of nephrite jade (a) Before self-absorption correction (b) After first self-absorption correction (c) After second self-absorption correction.
The condition of optically thin plasma can be verified by comparing the observed line intensities of two lines of the same element and the same charge state to those calculated by the known atomic parameters of lines [33].
| (2) |
where and are the intensities of the selected spectral lines at the wavelength and . The spectroscopic parameter corresponds to the transition probability from upper to lower level, and are the energy and statistical weight of the upper level of the line of intensity , while corresponds to transition probability from upper to lower level, and are the energy and statistical weight of the upper level of the line of intensity . The term values on the left side of equation (2) are determined using the recorded line intensities, while the right side of the equation contains the spectroscopic parameters of lines whose values are obtained from the NIST database. To verify the condition of optically thin plasma, spectral lines with a common upper energy level or close-lying energy levels were used to minimize temperature dependence [34]. The spectroscopic parameters of Ca, Si, Mg, and Fe were used in equation (2) to calculate the ratio of the line intensities, as given in Table 2. The comparison between calculated and measured line intensities revealed that the difference in line intensity ratios exceeded the experimental errors, indicating that plasma was not optically thin, and the recorded spectrum seems to be affected by self-absorption. Self-absorption has a non-uniform effect on the specific wavelengths of an element, particularly for those found in higher concentrations. Due to self-absorption, the spectral line intensities were observed to be lower than their actual values, reducing the accuracy of CF-LIBS results. Thus, the evaluation of self-absorption to correct the emission line intensities is mandatory to determine the accurate values of plasma parameters and reliable quantitative results.
Table 2.
Comparison of the calculated and measured line intensity ratios and their percentage differences.
| Element | Wavelength (nm) | Intensity Ratio |
Percentage difference | |
|---|---|---|---|---|
| Calculated using | Measured from | |||
| equation (2) | the spectrum | |||
| Ca I | 428.30 | 1.20 | 0.96 | 22% |
| 428.94 | ||||
| Si I | 252.41 | 0.82 | 0.58 | 34% |
| 252.85 | ||||
| Mg I | 517.26 | 0.60 | 0.79 | 27% |
| 518.36 | ||||
| Fe I | 248.32 | 2.79 | 1.97 | 34% |
| 252.28 | ||||
To correct the line intensities, the self-absorption correction coefficients were evaluated using the internal reference line method in which the spectral line belonging to the atomic transition with a low value of transition probability and high upper-level energy is assumed to be the least self-absorbed and used as an internal reference line to determine the coefficient of self-absorption using the following equation (3).
| (3) |
where, is the self-absorption correction coefficient. The value of is considered 1 when the line is free of self-absorption and decreases from unity as the effect of self-absorption increases. The value of the correction coefficient of other spectral lines can be determined using the following equation
| (4) |
where, is the wavelength of the selected internal reference line, while λ represents the wavelength of the line whose spectral intensity will be corrected. The determination of the self-absorption correction coefficient from equation (4) requires the plasma temperature, which has been extracted from the Boltzmann plot of uncorrected emission lines of Si, Mg, Ca, and Fe. After the determination of the self-absorption correction coefficient, the corrected spectral intensity of line is calculated using equation (5).
| (5) |
In IRSAC, the selection of the internal reference line is a critical step because it plays a key role in correcting the self-absorption effect. Initially, an emission line of an element with high upper-level energy and a lower transition probability was considered as an internal reference line and used to correct the intensities of other lines of the same element. These corrected line intensities were used to draw the Boltzmann plot. When the linear fitting of the Boltzmann plot does not show good linearity, and the Pearson correlation coefficient is not close to unity, the internal reference line has to be changed. The internal reference lines of all the elements are given in Table 1 in bold letters. The average plasma temperature determined after the first SAC was 17750 K.
The line intensities of internal reference lines can also be affected by self-absorption and need correction before applying the IRSAC method. Hence, the line width ratio method was used to correct the intensities of the internal reference lines. In the line width ratio method, the SAC coefficient was determined using equation (6) [35].
| (6) |
Where, Δλ is the FWHM of the Lorentzian component of the selected spectral line affected by the self-absorption, is the true value of FWHM of the same line, when it is not affected by the self-absorption effect and α is taken as −0.54 [22], [36]. The Stark broadening is the main broadening mechanism in LIBS, that correlates with the electron number density and Stark broadening parameter ω, as given in equation (7).
| (7) |
The electron number density was determined by the Stark broadening line profile of the hydrogen line at 656.3 nm because the line is least affected by the self-absorption effect [22], [37].
| (8) |
where, is FWHM of line and is the half-width of the reduced Stark profile taken from the literature [38]. The value of the calculated electron number density using equation (8) is found to be .
The value of the Stark broadening parameter ω for the selected internal reference lines has been taken from the literature [39]. When the Stark parameter of the selected internal reference line is unknown, the following equation (9) can be used to determine its value [36], [40].
| (9) |
Where, is the broadening of the reference line whose Stark broadening parameter is found in the literature, ω, and Δλ are the Stark broadening parameter and width of lines with unknown Stark parameters, respectively. The SAC coefficients have been determined by equation (6), which are used to correct the intensities of the selected internal reference lines. These corrected internal reference lines of elements are used to correct the intensities of other lines by the IRSAC method for the second time. The calculated SAC coefficient of internal reference lines from the line width ratio method and the SAC coefficient of other lines calculated by the IRSAC method for the second time are given in Table 1. After the second correction, the points on the Boltzmann plot showed good linearity. The calculated value of average plasma temperature after the second self-absorption correction was 15800 K. The uncertainty in determining the plasma temperature is approximately 10% due to uncertainties in integrated line intensities, transition probabilities, and fitting procedure. The plasma temperature was then used in the CF-LIBS equations to determine the partition function, experimental factor, and elemental concentration.
The partition function of an element at any particular temperature was determined using equation (10).
| (10) |
The experimental factor F in equation (11) was determined by the normalization as given below
| (11) |
Thus, the relative abundance of the excited species “s” was determined using equation (12).
| (12) |
while the concentration of singly ionized species, as denoted by was determined using the Saha-Boltzmann equation, given by equation (13) [33], [41].
| (13) |
where, and are the relative abundance and and are the partition functions of specie “s” in the consecutive ionization stages, and is the ionization energy. Since the recorded LIBS spectrum only contains the emission lines of neutral and singly ionized species, therefore only these two species contribute mainly to elemental concentration as follows;
| (14) |
where is the sum of the concentration of all elements in the sample. Equation (14) gives the relative concentration of the element “s” in the sample.
The correctness of the elemental concentration determined by CF-LIBS primarily depends upon the accuracy of line intensities, which depends on the experimental factors and plasma conditions. Plasma conditions affect the total number density, plasma temperature, and electron number density of the plasma [42]. In particular, self-absorption severely influences the line intensities, which leads to the poor fitting of Boltzmann plots, and the results have a high relative error in concentration measurement. We have applied IRSAC method with and without self-absorption correction of the internal reference line to improve line intensities and CF-LIBS results of nephrite jade. The concentrations of the principal elements were more accurately determined compared to those of the trace elements, which exhibited relatively higher errors. The line intensities of the trace elements were much lower, and a small error in the calculation of plasma temperature may cause a significant percentage variation in the relative concentration of trace elements which is consistent with the literature [42]. The quantitative results obtained after the first self-absorption correction using the IRSAC method are significantly improved as compared to the quantitative results obtained without the self-absorption correction. However, the results obtained after the second self-absorption correction using the line width ratio and the IRSAC method are in good agreement with those of ICP-OES, as shown in Table 3 and Fig. 5.
Table 3.
The relative concentration of elements in the nephrite jade sample.
| Technique | Elements wt.% |
|||||||||
|---|---|---|---|---|---|---|---|---|---|---|
| Ca | Fe | Mg | Si | Li | Al | K | Na | Ni | ||
| CF-LIBS | Before self-absorption correction | 32.38 | 11.14 | 18.81 | 29.16 | 1.19 | 1.26 | 4.49 | 2.33 | 1.62 |
| After first self-absorption correction | 22.36 | 7.30 | 15.34 | 52.11 | 0.42 | 0.36 | 2.24 | 0.88 | 0.64 | |
| After second self-absorption correction | 19.12 | 5.59 | 14.17 | 57.96 | 0.04 | 0.08 | 1.66 | 0.75 | 0.59 | |
| ICP-OES | 18.70 | 6.12 | 14.27 | 57.89 | 0.06 | 0.09 | 1.67 | 0.72 | 0.61 | |
Figure 5.

The relative concentration of elements found in nephrite jade determined by CF-LIBS and ICP-OES.
3.3. The Raman spectroscopy
Fig. 6 illustrates the Raman spectra of nephrite jade recorded with two different gratings (300 and 1200 lines per millimeter). The recorded spectrum of the sample was compared with the reported spectrum of nephrite jade in literature, which reveals that tremolite is the main mineral phase in the sample [28], [29], [43]. In the recorded spectrum, two regions, 100 cm−1–1200 cm−1 and 3600 cm−1–3700 cm−1 are of interest. The first region contains Si-O vibrations, which can be used for the identification of nephrite jade. The peaks at 1061 cm−1, 1030 cm−1, and 932 cm−1 represent the Si-O stretching vibrations, whereas the peak at 674 cm−1 represents the symmetric Si-O-Si stretching vibrations. Other peaks observed in the spectrum at 418 cm−1, 397 cm−1, 372 cm−1, 253 cm−1, 225 cm−1, and 180 cm−1 correspond to the lattice vibrations in the sample. In the second region of interest, the peak observed at 3675 cm−1 represents the M-OH stretching vibrations. In the literature, up to three peaks are reported in the region of 3600–3700 cm−1 depending on the Fe2+ concentration. The peak intensities and their spectral positions are also dependent on Fe2+ concentration. The low-intensity peak at 3675 cm−1 predict the small concentration of Fe2+ [28], [29].
Figure 6.
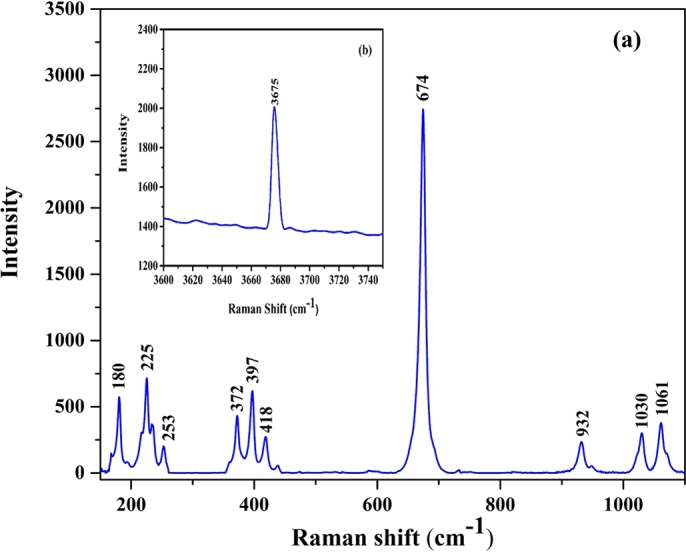
The recorded Raman spectrum of nephrite jade (a) illustrate the region from 100 cm−1 −1200 cm−1 (b) illustrate the region from 3600 cm−1–3700 cm−1.
3.4. XRD phase analysis
X-ray diffraction (XRD) is one of the most extensively used analytical techniques for determining the presence of crystalline phases in geochemical samples. The recorded XRD spectrum of nephrite jade is illustrated in Fig. 7. Two crystalline phases of nephrite jade, tremolite, and actinolite amphibole are reported in the literature depending upon the concentration of Mg and Fe. The XRD spectrum of nephrite jade contains several peaks that are well-matched with the tremolite powder diffraction file (PDF#44-1402) reference card and the XRD spectrum reported in the literature [7], [31]. Therefore, the nephrite jade sample is mainly composed of tremolite amphibole. The high intensity distinct sharp peaks observed in the spectrum at 2θ values of 9.8°, 10.5°, 26.4°, 27.2°, 28.6°, 30.4°, and 33.2° correspond to hkl values of , , , , , and of tremolite crystal as reported in the database of the international center for diffraction data (ICCD) PDF#44-1402 [44]. The sharp and well-matched characteristic peaks of the XRD spectrum provided evidence of the high crystallinity of tremolite. Under the optimized conditions, no peak of trace elements was observed. The tremolite has a monoclinic crystal structure [45]. The lattice parameters of the monoclinic crystal can be determined by the equation.
| (15) |
where h, k, and l correspond to the mirror indices, a, b, c, and β correspond to the lattice parameters, and d represents the interplanar spacing. The lattice parameters determined by equation (15) are Å, Å, Å, and , while the value of α and γ is 90°.
Figure 7.

The XRD spectrum of nephrite jade recorded in the 2θ range of 5° to 65°.
In the above study, it has been demonstrated that LIBS technique can be used for qualitative and quantitative elemental analysis of geological materials and has the potential to be an alternate technique for qualitative and quantitative analysis in mines and ores. The mineral phases of nephrite jade were identified by Raman spectroscopy, and nature of the crystalline structure was determined by XRD pattern. The XRD analysis can be used to determine the geological origin, texture, and correlations because crystalline structure, chemical composition, mineral phases, color, and density are the fundamental characteristics of geochemical materials.
4. Conclusion
In the present work, CF-LIBS, Raman spectroscopy, and XRD analysis have been employed to extract the elemental quantitative analysis, mineral phases, and crystallographic information of nephrite jade gemstones. The recorded LIBS spectrum of nephrite jade has confirmed the presence of Si, Mg, Ca, Li, Fe, Al, K, Na, and Ni. The quantitative analysis was performed using a two-step self-absorption correction in CF-LIBS. The first self-absorption correction was made using IRSAC method, in which the internal reference lines were considered free of self-absorption. In the second self-absorption correction, the intensities of internal reference lines were corrected by line width ratio method. These corrected internal reference lines were again used in the IRSAC methodology. The value of plasma temperature determined by Boltzmann plot before and after the self-absorption correction was used in the CF-LIBS method to determine the relative concentration of elements in nephrite jade. Finally, the quantitative results obtained from CF-LIBS after the second self-absorption correction were compared with the results of ICP-OES. The results after the second self-absorption correction are in good agreement with ICP-OES results. CF-LIBS detected silicon as the most abundant with 57.96%, followed by magnesium at 14.17%, calcium at 19.12%, and iron at 5.59% in nephrite Jade. In addition, the recorded Raman spectrum detected Si-O vibrations by the peaks observed in 100 cm−1 to 1200 cm−1, while M-OH stretching vibrations were confirmed by the peak detected in 3600 cm−1 to 3700 cm−1, and the XRD analysis confirmed the presence of tremolite crystals in the nephrite jade stone.
Declarations
Author contribution statement
Rameez Abbas Khan: Performed the experiments; Analyzed and interpreted the data; Wrote the paper.
M. Anwar-ul-Haq: Conceived and designed the experiments; Wrote the paper.
M. Qasim: Performed the experiments.
M. Sher Afgan: Contributed reagents, materials, analysis tools or data; Wrote the paper.
S.U. Haq: Analyzed and interpreted the data; Wrote the paper.
S. Zajif Hussain: Contributed reagents, materials, analysis tools or data.
Funding statement
Dr. Muhammad Anwar-ul-Haq was supported by Higher Education Commission, Pakistan (award no. 1868 (NRPU)).
Data availability statement
Data will be made available on request.
Declaration of interests statement
The authors declare no conflict of interest.
Additional information
No additional information is available for this paper.
References
- 1.Hawthorne F.C., Oberti R., Harlow G.E., Maresch W.V., Martin R.F., Schumacher J.C., Welch M.D. Nomenclature of the amphibole supergroup. Am. Mineral. 2012;97(11–12):2031–2048. [Google Scholar]
- 2.Bukanov V.V. Russian gemstones encyclopedia. Lithogr. 2006 [Google Scholar]
- 3.Schmitt A.K., Liu M.-C., Kohl I.E. Sensitive and rapid oxygen isotopic analysis of nephrite jade using large-geometry SIMS. J. Anal. At. Spectrom. 2019;34(3):561–569. [Google Scholar]
- 4.Xu H., Bai F., Jiang D. Geochemical characteristics and composition changes of tremolite at various stages in the mineralization process of nephrite from Tieli, Heilongjiang, Northeastern China. Arab. J. Geosci. 2021;14(3):1–18. [Google Scholar]
- 5.Yu J., Hou Z., Sheta S., Dong J., Han W., Lu T., Wang Z. Provenance classification of nephrite jades using multivariate LIBS: a comparative study. Anal. Meth. 2018;10(3):281–289. [Google Scholar]
- 6.Umar Z.A., Liaqat U., Ahmed R., Baig M.A. Classification of nephrite using calibration-free laser induced breakdown spectroscopy (CF–LIBS) with comparison to laser ablation–time-of-flight–mass spectrometry (LA–TOF–MS) Anal. Lett. 2020;53(2):203–216. [Google Scholar]
- 7.Bao Y., Zhao C., Li Y., Yun X. A method of determining heated ancient nephrite jades in China. Sci. Rep. 2018;8(1):1–11. doi: 10.1038/s41598-018-30564-w. [DOI] [PMC free article] [PubMed] [Google Scholar]
- 8.Harmon R.S., Senesi G.S. Laser-induced breakdown spectroscopy–a geochemical tool for the 21st century. Appl. Geochem. 2021;104929 [Google Scholar]
- 9.Lawley C.J., Somers A.M., Kjarsgaard B.A. Rapid geochemical imaging of rocks and minerals with handheld laser induced breakdown spectroscopy (LIBS) J. Geochem. Explor. 2021;222106694 [Google Scholar]
- 10.Chen T., Zhang T., Li H. Applications of laser-induced breakdown spectroscopy (LIBS) combined with machine learning in geochemical and environmental resources exploration. TrAC, Trends Anal. Chem. 2020;116113 [Google Scholar]
- 11.Umar Z.A., Ahmed N., Ahmed R., Liaqat U., Baig M.A. Elemental composition analysis of granite rocks using LIBS and LA-TOF-MS. Appl. Opt. 2018;57(18):4985–4991. doi: 10.1364/AO.57.004985. [DOI] [PubMed] [Google Scholar]
- 12.Harmon R.S., Russo R.E., Hark R.R. Applications of laser-induced breakdown spectroscopy for geochemical and environmental analysis: a comprehensive review. Spectrochim. Acta, Part B, At. Spectrosc. 2013;87:11–26. [Google Scholar]
- 13.Miziolek A.W., Palleschi V., Schechter I. Cambridge University Press; 2006. Laser Induced Breakdown Spectroscopy. [Google Scholar]
- 14.Raia V., Thakurb S. Physics of plasma in laser-induced breakdown spectroscopy. Laser-Induc. Breakdown Spectrosc. 2007:83–111. [Google Scholar]
- 15.Unnikrishnan V., Nayak R., Devangad P., Tamboli M., Santhosh C., Kumar G., Sardar D. Calibration based laser-induced breakdown spectroscopy (LIBS) for quantitative analysis of doped rare earth elements in phosphors. Mater. Lett. 2013;107322(324) [Google Scholar]
- 16.Shirvani-Mahdavi H., Shafiee P. Quantitative analysis of soil calcium by laser-induced breakdown spectroscopy using addition and addition-internal standardizations. Meas. Sci. Technol. 2016;27(12) [Google Scholar]
- 17.Davari S.A., Hu S., Mukherjee D. Calibration-free quantitative analysis of elemental ratios in intermetallic nanoalloys and nanocomposites using Laser Induced Breakdown Spectroscopy (LIBS) Talanta. 2017;164:330–340. doi: 10.1016/j.talanta.2016.11.031. [DOI] [PubMed] [Google Scholar]
- 18.Qasim M., Anwar-ul-Haq M., Afgan M.S., Haq S., Baig M. Quantitative analysis of saindha salt using laser induced breakdown spectroscopy and cross-validation with ICP-MS. Plasma Sci. Technol. 2020;22(7) [Google Scholar]
- 19.Ciucci A., Corsi M., Palleschi V., Rastelli S., Salvetti A., Tognoni E. New procedure for quantitative elemental analysis by laser-induced plasma spectroscopy. Appl. Spectrosc. 1999;53(8):960–964. [Google Scholar]
- 20.Aguilera J.A., Aragón C. Characterization of a laser-induced plasma by spatially resolved spectroscopy of neutral atom and ion emissions.: comparison of local and spatially integrated measurements. Spectrochim. Acta, Part B, At. Spectrosc. 2004;59(12):1861–1876. [Google Scholar]
- 21.Tognoni E., Cristoforetti G., Legnaioli S., Palleschi V., Salvetti A., Müller M., Panne U., Gornushkin I. A numerical study of expected accuracy and precision in calibration-free laser-induced breakdown spectroscopy in the assumption of ideal analytical plasma. Spectrochim. Acta, Part B, At. Spectrosc. 2007;62(12):1287–1302. [Google Scholar]
- 22.Qasim M., Anwar-ul-Haq M., Shah A., Afgan M.S., Haq S., Khan R.A., Baig M.A. Self-absorption effect in calibration-free laser-induced breakdown spectroscopy: analysis of mineral profile in Maerua oblongifolia plant. Microchem. J. 2022;175 [Google Scholar]
- 23.Bulajic D., Corsi M., Cristoforetti G., Legnaioli S., Palleschi V., Salvetti A., Tognoni E. A procedure for correcting self-absorption in calibration free-laser induced breakdown spectroscopy. Spectrochim. Acta, Part B, At. Spectrosc. 2002;57(2):339–353. [Google Scholar]
- 24.Sun L., Yu H. Correction of self-absorption effect in calibration-free laser-induced breakdown spectroscopy by an internal reference method. Talanta. 2009;79(2):388–395. doi: 10.1016/j.talanta.2009.03.066. [DOI] [PubMed] [Google Scholar]
- 25.Graves P., Gardiner D. Springer; Berlin, Heidelberg: 1989. Practical Raman Spectroscopy. [Google Scholar]
- 26.Nasdala L., Schmidt C. Applications of Raman spectroscopy in mineralogy and geochemistry. Elements: Int. Mag. Miner. Geochem. Petrol. 2020;16(2):99–104. [Google Scholar]
- 27.Venkateswarulu P., Rao K.S., Kasipathi C., Ramakrishna Y. Multielemental analyses of isomorphous Indian garnet gemstones by XRD and external pixe techniques. Appl. Radiat. Isot. 2012;70(12):2746–2754. doi: 10.1016/j.apradiso.2012.07.023. [DOI] [PubMed] [Google Scholar]
- 28.Feng X., Zhang Y., Lu T., Zhang H. Characterization of Mg and Fe contents in nephrite using Raman spectroscopy. Gems. Gemol. 2017;53(2) [Google Scholar]
- 29.Wang R., Zhang W.S. Application of Raman spectroscopy in the nondestructive analyses of ancient Chinese jades. J. Raman Spectrosc. 2011;42(6):1324–1329. [Google Scholar]
- 30.Adamo I., Bocchio R. Nephrite jade from Val Malenco, Italy: review and update. Gems. Gemol. 2013;49(2):98–106. [Google Scholar]
- 31.Shi M., Yu B.S., Guo Y., Yuan Y., Ng Y.N. Trans Tech Publ; 2015. Structural and Mineralogical Characterization of Green Nephrite in Hetian, Xinjiang, China; pp. 159–164. (Key Engineering Materials). [Google Scholar]
- 32.Kramida A., Ralchenko Y., Reader J. 2015. NIST Atomic Spectra Database (Ver. 5.3) [Google Scholar]
- 33.Unnikrishnan V., Mridul K., Nayak R., Alti K., Kartha V., Santhosh C., Gupta G., Suri B. Calibration-free laser-induced breakdown spectroscopy for quantitative elemental analysis of materials. Pramana. 2012;79(2):299–310. [Google Scholar]
- 34.Ahmed N., Abdullah M., Ahmed R., Piracha N.K., Baig M.A. Quantitative analysis of a brass alloy using CF-LIBS and a laser ablation time-of-flight mass spectrometer. Laser Phys. 2017;28(1) [Google Scholar]
- 35.El Sherbini A., El Sherbini T.M., Hegazy H., Cristoforetti G., Legnaioli S., Palleschi V., Pardini L., Salvetti A., Tognoni E. Evaluation of self-absorption coefficients of aluminum emission lines in laser-induced breakdown spectroscopy measurements. Spectrochim. Acta, Part B, At. Spectrosc. 2005;60(12):1573–1579. [Google Scholar]
- 36.El Sherbini A.M., Aboulfotouh A.-N., Rashid F., Allam S.H., Al-Kaoud A.M., El Dakrouri A., El Sherbini T.M. Spectroscopic measurement of Stark broadening parameter of the 636.2 nm Zn I-line. Nat. Sci. 2013 [Google Scholar]
- 37.Hahn D.W., Omenetto N. Laser-induced breakdown spectroscopy (LIBS), part I: review of basic diagnostics and plasma–particle interactions: still-challenging issues within the analytical plasma community. Appl. Spectrosc. 2010;64(12):335A–366A. doi: 10.1366/000370210793561691. [DOI] [PubMed] [Google Scholar]
- 38.Kepple P., Griem H.R. Improved Stark profile calculations for the hydrogen lines H α, H β, H γ, and H δ. Phys. Rev. 1968;173(1):317. [Google Scholar]
- 39.Griem H. Cambridge University Press; 1997. Principles of Plasma Spectroscopy. [Google Scholar]
- 40.Afgan M.S., Anwar-ul-Haq M., Haq S., Kalyar M., Baig M. Spectroscopic investigations of the laser induced thallium plasma. Laser Phys. 2018;29(1) [Google Scholar]
- 41.D'Andrea E., Pagnotta S., Grifoni E., Legnaioli S., Lorenzetti G., Palleschi V., Lazzerini B. A hybrid calibration-free/artificial neural networks approach to the quantitative analysis of LIBS spectra. Appl. Phys. B. 2015;118(3):353–360. [Google Scholar]
- 42.Fu Y., Hou Z., Li T., Li Z., Wang Z. Investigation of intrinsic origins of the signal uncertainty for laser-induced breakdown spectroscopy. Spectrochim. Acta, Part B, At. Spectrosc. 2019;155:67–78. [Google Scholar]
- 43.Shurvell H., Rintoul L., Fredericks P. Infrared and Raman spectra of jade and jade minerals. Int. J. Vib. Spectrosc. 2001;5(4) [Google Scholar]
- 44.Gates-Rector S., Blanton T. Cambridge University Press; Cambridge, MA, USA: 2020. Powder Diffraction File PDF4+ ICDD Release. [Google Scholar]
- 45.Comodi P., Mellini M., Ungaretti L., Zanazzi P.F. Compressibility and high pressure structure refinement of tremolite, pargasite and glaucophane. Eur. J. Mineral. 1991;3(3):485–499. [Google Scholar]
Associated Data
This section collects any data citations, data availability statements, or supplementary materials included in this article.
Data Availability Statement
Data will be made available on request.