

Abstract
G‐protein‐coupled receptors (GPCRs) are the most abundant receptor type in the human body and are responsible for regulating many physiological processes, such as sensation, cognition, muscle contraction and metabolism. Further, GPCRs are widely expressed in the brain where their agonists make up a large number of neurotransmitters and neuromodulators. Due to the importance of GPCRs in human physiology, genetically encoded sensors have been engineered to detect GPCR agonists at cellular resolution in vivo. These sensors can be placed into two main categories: those that offer real‐time information on the signalling dynamics of GPCR agonists and those that integrate the GPCR agonist signal into a permanent, quantifiable mark that can be used to detect GPCR agonist localisation in a large brain area. In this review, we discuss the various designs of real‐time and integration sensors, their advantages and limitations, and some in vivo applications. We also discuss the potential of using real‐time and integrator sensors together to identify neuronal circuits affected by endogenous GPCR agonists and perform detailed characterisations of the spatiotemporal dynamics of GPCR agonist release in those circuits. By using these sensors together, the overall knowledge of GPCR‐mediated signalling can be expanded.
Keywords: genetically encoded sensor, GPCR, neuromodulation, neurotransmission
G‐protein‐coupled receptor (GPCR) agonist sensors utilise downstream GPCR signalling events, such as GPCR conformational changes and protein binding, to give a measurable sensor readout.

1. INTRODUCTION
1.1. Importance of GPCR signalling
G‐protein‐coupled receptors (GPCRs) are seven‐transmembrane domain receptors responsible for modulating an abundance of physiological processes, including sensation, 1 cognition, 2 muscle contraction 3 and metabolism. 4 Consisting of more than 800 receptor types, GPCRs are the largest family of membrane receptors in the human body. 5 Once activated by external stimuli including small molecule neurotransmitters, peptides, lipids, ions and light, the GPCR undergoes a conformational change, which allows G‐protein and/or β‐arrestin binding. 6 , 7 , 8 G‐protein binding catalyses the activation of a downstream signalling cascade, where, depending on the G‐protein subtype, can cause a change in the intracellular concentration of second messengers, such as cAMP, IP3, Ca2+ and diacylglycerol, while β‐arrestin binding can cause internalisation of the GPCR 9 , 10 (Figure 1).
FIGURE 1.

Schematic of G‐protein‐coupled receptor (GPCR) signalling cascade. Agonist binding causes a conformational change in the GPCR, which recruits G‐proteins and/or β‐arrestin to the GPCR. G‐protein binding leads to a change in concentration of second messengers and β‐arrestin binding causes internalisation of the GPCR. These agonist‐induced changes can be utilised in sensors, where they can cause the change of fluorescence, an enzymatic readout, or the transcription of a reporter gene.
GPCR signalling malfunction is involved in a large number of diseases, such as heart disease, 11 depression, 12 dementia, 13 Alzheimer's disease, 13 Parkinson's disease 13 and Huntington's disease. 13 Approximately 35% of drugs approved by the U.S. Food and Drug Administration (FDA) target GPCRs. 14 Additionally, many neuromodulators and neurotransmitters are GPCR agonists, such as glutamate, γ‐aminobutyric acid (GABA), acetylcholine, serotonin, dopamine and various neuromodulating peptides. GPCRs, therefore, play critical roles in modulating the activity of the nervous system. GPCR activity is mainly regulated by the spatiotemporally regulated release of endogenous agonists. Therefore, there is particular interest in studying the spatiotemporal dynamics of endogenous GPCR agonists to understand how the precise timing and spatial localisation of GPCR activation affects the downstream signalling cascade and overall biological response.
1.2. Overview of genetically encoded sensors for detecting endogenous GPCR agonists
To gain information about the spatiotemporal dynamics of GPCR activation in biological models, a variety of genetically encoded sensors have been engineered to detect GPCR agonists. Bioanalytical methods, such as microdialysis 15 and fast scanning cyclic voltammetry, 16 , 17 , 18 , 19 have been useful for GPCR agonist detection; however, genetically encoded GPCR sensors provide unique advantages. Genetic encoding offers cell‐type specificity when imaging in the animal brain and can image at cellular or even subcellular resolution. Genetically encoded GPCR sensors, therefore, can be used to determine the precise localisation and release dynamics of GPCR agonist release.
Genetically encoded sensor designs are mainly based on the agonist‐induced conformational change of the third intracellular loop, G‐protein or β‐arrestin binding, or the change of concentration of second messengers (Figure 1). The readout of these sensors can be the activation of a fluorescent protein, an enzymatic reaction, or the transcription of a reporter gene.
Genetically encoded GPCR sensors can be divided into two main categories: those that offer real‐time information about GPCR agonist‐induced activation and those that integrate the GPCR agonist signal, leaving a permanent quantifiable signal over a large region of the brain (Figure 2). Real‐time sensors offer important information about the signalling dynamics of GPCRs and integrators can permanetely mark neurons exposed to GPCR agonists for further analysis. In this review, we will discuss the recent advancement of genetically encoded real‐time sensors and integrators for detecting GPCR agonists. We will also discuss how these two categories of sensors can be used together to provide detailed information about the spatiotemporal release of GPCR agonists in a whole brain at cellular resolution.
FIGURE 2.
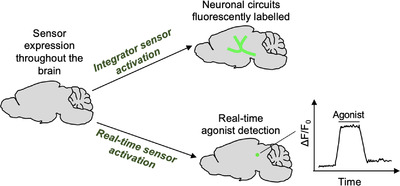
Integrators versus real‐time sensors. Integrators leave a permeant mark in the cells exposed to G‐protein‐coupled receptor (GPCR) agonists, so large brain regions can be analysed at cellular resolution. Real‐time sensors can be used to observe the real‐time agonist‐induced neuronal activity.
2. Genetically encoded real‐time sensors
A variety of genetically encoded real‐time sensors for detecting GPCR agonists have been recently developed using five major strategies: (1) intra‐ or intermolecular resonance energy transfers; (2) circularly permuted green fluorescent protein (cpGFP) insertion into periplasmic binding proteins; (3) cpGFP inserted into the third intracellular loop of a GPCR; (4) translocation assays; and (5) detection of second messengers following GPCR activation. Real‐time sensors are beneficial for studying the signalling kinetics of neurotransmitters and neuromodulators; therefore, these sensors benefit from having fast on and off rates. In this review, we will focus on the various designs of real‐time sensors, but we will not discuss in detail the kinetics of real‐time sensors. Readers can see reference 20 for time constant values of many of the sensors discussed here.
2.1. FRET‐ and BRET‐based sensors
Fluorescence resonance energy transfer (FRET)‐based GPCR agonist sensors use a donor and acceptor fluorescent protein, where the donor's emission spectrum overlaps with the acceptor's excitation spectrum. FRET efficiency is inversely proportional to r raised to the sixth power, where r is the distance between the donor and acceptor fluorophore. Therefore, FRET efficiency can be highly sensitive to GPCR activation‐dependent conformational change. The FRET fluorescent protein pairs can either be placed on different locations on the same GPCR (intramolecular FRET) or one protein can be fused to the GPCR and the other can be fused to a protein interactor, such as a G‐protein mimic or β‐arrestin (intermolecular FRET). Bioluminescence resonance energy transfer (BRET) is similar to FRET, except that a bioluminescent protein acts as the energy donor to activate the fluorescent protein acceptor. 21
Here, we will mainly discuss the FRET‐ and BRET‐based sensors that can potentially be used for detection of GPCR agonists in vivo at cellular resolution. For a more comprehensive review of FRET‐ and BRET‐based GPCR sensors, see reference. 21 We will divide FRET and BRET sensors into four main categories: (1) those that detect G‐protein activation; (2) those that detect β‐arrestin recruitment; (3) those that detect intramolecular GPCR conformational changes; and (4) those that detect the conformational change of binding proteins.
2.1.1. BRET and FRET sensors based on G‐protein binding and activation
To detect G‐protein activation, a bioluminescent protein, such as Renilla luciferase (Rluc) or the smaller luciferase enzyme, Nano Luciferase (NLuc), 22 fused to a GPCR can act as the BRET donor and a fluorescent protein, such as Venus or yellow fluorescent protein (YFP), fused to a Gα‐protein or a Gα‐mimic can act as the BRET acceptor. When the GPCR is activated by its agonist, the Gα‐protein/mimic binds to the intracellular portion of the GPCR, thereby bringing the two BRET pairs into proximity where energy transfer can take place (Figure 3A,B). BRET‐based GPCR sensors have been used to detect GPCR activation at subcellular resolution in cell cultures to observe activation at the plasma membrane, Golgi apparatus and endosomes. 23
FIGURE 3.

Fluorescence resonance energy transfer (FRET) and bioluminescence resonance energy transfer (BRET)‐based sensors. (A) Resonance energy transfer (RET)‐based sensor, where one RET pair is attached to the Gα‐protein and the other is attached to the G‐protein‐coupled receptor (GPCR). GPCR activationrecruits the G‐proteins, increasing the energy transfer efficiency. Acc, RET acceptor. (B) RET‐based sensor, where one RET pair is attached to the Gα‐protein mimic, such as a miniG protein or a nanobody, and the other is attached to the GPCR. GPCR activation recruits the G‐protein mimic, increasing the energy transfer efficiency. (C) Schematic of BERKY. BRET pairs are separated by an ER/K α‐helix linker, where the acceptor is at the end of the linker and the donor is at the start of the linker, fused to the membrane. KB‐1753, a peptide that binds to the active Gα‐protein, is attached to the acceptor pair. Agonist results in G‐protein activation which results in KB‐1753 binding and an increase in energy transfer efficiency. (D) RET‐based sensor, where one RET pair is attached to the Gα‐protein and the other is attached to the Gβ‐ and γ‐proteins. GPCR activation causes the distance to increase between the Gα and Gβγ proteins, decreasing the energy transfer efficiency. (E) RET‐based sensor, where one RET pair is attached to β‐arrestin and the other is attached to the GPCR. GPCR activation recruits β‐arrestin, increasing the energy transfer efficiency. (F) RET‐based sensor, where RET pairs are attached to either terminus of β‐arrestin. Agonist activation of the GPCR causes a conformational change in β‐arrestin, where there is an increase in energy transfer efficiency. (G) RET‐based sensor, where one RET pair is attached to the third intracellular loop of the GPCR and the other is attached to the GPCR's C‐terminal tail. Agonist‐induced activation causes a conformational change in the GPCR, thereby changing the energy transfer efficiency.
G‐protein‐based BRET sensors have been developed for several GPCRs, including the β2‐adrenergic receptor (β2AR), α2‐adrenergic receptor (α2AR), vasopressin 2 receptor (V2R), sensor neuron‐specific receptor and thromboxane A2 receptor. In these sensors, a BRET acceptor, GFP10, was fused to G‐proteins and a BRET donor, RLuc, was fused to the GPCR 24 (Table 1). These sensors can monitor agonist‐induced desensitisation in real time. 24
TABLE 1.
Real‐time sensors
| Sensor type | NT/NM detection | SNR | Affinity for ligand (EC50/IC50/Kd) | Model | References |
|---|---|---|---|---|---|
| FRET based | Acetylcholine | 100% | 600 nM carbachol | CHO, HEK | 36 , 43 |
| Epinephrine/norepinephrine | 32% | 12 nM–17 μM | HEK, CHO, PC12 | 37 , 38 , 42 , 43 , 44 , 57 , 58 , 60 , 62 , 63 | |
| Bradykinin | 60% | NA | HEK | 45 , 61 | |
| Adenosine | 16% | NA | HEK | 44 | |
| Histamine | 20% | ∼1 μM | HeLa, MEF | 33 | |
| Lysophosphatidic acid | 40% | NA | HeLa | 34 | |
| Parathyroid hormone | 20% | 16 nM | HEK | 57 | |
| Adenine and uridine nucleotides | 4% | NA | HEK | 59 | |
| Glycine (GlyFS) | ∼20% | 20 μM | HEK, brain tissue | 64 | |
| Glutamate (FLIPE) | 27% | 0.6 μM–1 mM | PC12, neuron culture | 65 | |
| BRET based | Epinephrine/norepinephrine | 300% | 9.1 pM–120 nM isoproterenol | HEK, HeLa, neuron culture and mice | 23 , 24 , 32 , 35 , 39 , 40 , 41 , 46 , 53 , 54 , 55 , 56 |
| Acetylcholine | 450% |
0.77 μM carbachol ∼1 μM acetylcholine |
HEK | 23 , 32 , 35 , 39 , 40 , 56 | |
| Angiotensin II | 130% | 1–4.2 nM | HEK | 35 , 50 , 54 , 55 , 56 | |
| Chemokine ligands 19 and 21 | 130% | NA | HEK | 56 | |
| Chemokine ligands 3, 4, 3‐like 1 | ∼18% | NA | HEK | 39 , 55 | |
| C‐X‐C motif chemokine 12 | ∼38% | NA | HEK | 39 | |
| Calcitonin gene‐related peptide | ∼20% | NA | HEK | 39 | |
| Prostaglandin E2 | ∼55% | NA | HEK | 39 | |
| Vasoactive intestinal peptide | ∼25% | NA | HEK | 39 | |
| Secretin | ∼17% | NA | HEK | 39 | |
| Glucagon‐like peptide‐1 and glucagon | 120% | NA | HEK | 56 | |
| Platelet‐activating factor | 3.6% | NA | HEK | 55 | |
| Serotonin | 130% | NA | HEK | 56 | |
| Endogenous opioids | 2.5% |
0.09 nM salvinorin A 5.9–580 nM DAMGO |
HEK | 25 , 39 , 40 , 41 , 55 | |
| Endocannabinoids | NA | 49–65 nM WIN 55,212‐2 | HEK | 41 | |
| Neurotensin | NA | 34–390 pM | HEK | 41 | |
| Adenosine | NA | ∼0.5 μM | HEK | 23 | |
| Thyrotropin‐releasing hormone | NA | 8.8 nM | HEK, COS‐1 | 47 , 48 | |
| Oxytocin | NA | NA | COS‐7 | 49 | |
| Vasopressin | 130% | 3 nM AVP | HEK and mice | 24 , 39 , 50 , 51 , 52 , 55 , 56 | |
| Parathyroid hormone | 6.8% | 10 nM | HEK | 54 | |
| Dopamine | NA | ∼0.1 μM | HEK | 23 , 39 , 40 | |
| Thromboxane | 50% | 9.6 nM U46619 | HEK | 24 , 35 | |
| Sensory neuron‐specific receptor | NA | NA | HEK | 24 | |
| Endothelin‐1 | NA | ∼1 nM | HEK | 23 | |
| Bradykinin | NA | NA | HEK | 40 | |
| Melanocortin | NA | NA | HEK | 50 | |
| SnFRs | Glutamate | ∼25 | 0.6–600 μM | HEK, neuron culture, Caenorhabditis elegans, zebrafish, mice, ferrets | 66 , 67 , 68 , 69 |
| GABA | ∼1.7 | 30–110 μM | HEK, neuron culture, mice and zebrafish | 70 | |
| Acetylcholine | 14 | 0.4–35 μM | HEK, neuron culture, C. elegans, fly, zebrafish, mouse | 71 , 73 | |
| Serotonin | 17 | 390 μM | HEK, neuron culture, mice | 72 | |
|
GRAB |
Dopamine | 3.4 | 4–130 nM | HEK, neuron culture, fly, zebrafish, mice | 77 , 89 |
| Epinephrine/norepinephrine | 2.3 | 83–930 nM | HEK, neuron culture, zebrafish, mice | 81 | |
| Serotonin | 2.8 | 14 nM | HEK, neuron culture, flies, mice | 79 | |
| Endocannabinoids | 9.5 |
9 μM 2‐AG 0.8 μM AEA |
HEK, neuron culture, mice | 83 | |
| Adenosine | ∼2.0 | 60 nM–3.6 μM | HEK, neuron culture, mice | 84 , 85 | |
| Acetylcholine | 2.8 | 0.7 μM | HEK, neuron culture, flies, mice | 86 , 87 | |
| Lights | Dopamine | 9.3 | 4.1 nM–1.6 μM | HEK, neuron culture, mice, rats | 76 , 90 |
| Dynorphin | 0.6 | NA | HEK, mice | 76 , 78 | |
| Serotonin | 0.8 | 26 nM | HEK, neuron culture, mice | 80 | |
| Epinephrine/norepinephrine | 2.1 | 760 nM | HEK, neuron culture, mice | 76 , 82 |
Abbreviations: ∼Estimated values, because raw values were not available in the publication. All values were rounded to 1–2 significant digits. For all signal‐to‐noise ratios (SNR), the highest values were taken from the publications referenced. For the EC50/Kd values, a range of values were recorded from the publications referenced. EC50/Kd values for different versions of a sensor are included in the range. For those tested in multiple cell types, the SNR and EC50/Kd range are chosen for the cell type that gave the best SNR and lowest EC50/Kd. For fluorescence resonance energy transfer (FRET) and bioluminescence resonance energy transfer (BRET) sensors, the agonist‐induced percent change in BRET/FRET efficiency were recorded as either the agonist‐induced change of fluorescence over the original fluorescence or the signal in the presence of agonist over the background signal without agonist. The SNR of the intermolecular BRET sensors were not recorded in the table because the majority of these sensors were reported to have ‘0’ BRET without agonist, making it impossible to calculate a percent change. BRET, bioluminescence resonance energy transfer; CHO, Chinese hamster ovary cells; FRET, fluorescence resonance energy transfer; GRAB, G‐protein‐coupled receptor (GPCR) activation‐based; HEK, human embryonic kidney cells; MEF, mouse embryonic fibroblast; NT/NM, neurotransmitter/neuromodulator; SnFR, sensing fluorescent reporter; SNR, signal‐to‐noise ratio.
Conformation‐specific nanobodies engineered to bind to active GPCRs have been used as Gα‐mimics and are advantageous in their easy expression in cell culture and high affinities for active GPCRs. These nanobodies have been used in BRET‐based sensors, where one BRET pair is attached to the nanobody and the other is attached to the corresponding GPCR to give an increase in BRET signal upon GPCR activation 25 (Figure 3B). Alternatively, a nanobody that binds to the inactive GPCR, such as Nb6 for the kappa opioid receptor (KOR), can see a decrease in BRET signal upon GPCR activation. 25 Although this tool has not been used in any in vivo applications, it was able to observe the different conformational states of KOR induced by different ligands. 25 A disadvantage of nanobody‐based BRET sensors is that only a few GPCRs have conformation‐specific nanobody binders. These nanobody–GPCR pairs include Nb39 and Nb6 for opioid receptors (ORs), 26 , 27 Nb80 for β2AR, 28 Nb.AT110 for angiotensin receptors 29 and Nb9‐8 for the M2‐muscarinic receptors 30 to name a few.
For GPCRs without conformation‐specific nanobodies, miniG proteins can be used as G‐protein mimics. MiniG proteins are derived from the Gα subunit of the G‐protein complex, but with the membrane anchor and Gβγ binding surface removed, thereby allowing easier protein expression than the wild‐type Gα‐protein. 31 MiniG‐based BRET sensors have been developed by fusing the miniG protein to the BRET acceptor, such as Venus, and fusing the donor, such as Rluc or NLuc, to the GPCR (Figure 3B). In the presence of agonist, miniG can bind to the GPCR and cause an increase in BRET signal. MiniG‐based BRET sensors are very versatile, having been designed for several Gα‐protein types: Gαi/o, Gαs, Gα12/13 and Gαq/11. 23 Consequently, miniG protein‐based BRET sensors can be used for a wide variety of GPCRs in cell culture; however, to our knowledge, miniG protein‐based BRET sensors have not been used in vivo.
Fusion of the GPCR to the BRET pair involves genetically altering the GPCR; consequently, these types of sensors cannot detect endogenous GPCR activation. Alternatively, BERKY is a BRET‐based GPCR agonist sensor that does not alter the endogenous GPCR and can, therefore, detect endogenous GPCR agonists (Figure 3C). BERKY is a single protein chain where the BRET donor, NLuc, is bound to a membrane anchoring sequence and the acceptor, YFP, is bound to a synthetic peptide called KB‐1753. The donor and acceptor BRET pairs are separated by an ER/K α‐helix linker. Once the Gα‐protein is activated, KB‐1753 interacts with the guanosine triphosphate‐bound Gα‐protein, bringing YFP to the membrane and increasing BRET. BERKY sensors have also been developed for Gαq, Gα13, Gβγ and Rho to probe the activation of endogenous GPCRs. 32 Additionally, BRET and FRET pairs inserted into the Gαβγ heterotrimer have also proven useful in measuring endogenous GPCR activation. The proximity of the Gα and Gβγ subunits changes based on the activation state of the GPCR, thereby changing the energy transfer efficiency and indicating GPCR activation 33 , 34 , 35 , 36 , 37 , 38 , 39 (Figure 3D). Finally, NanoBRET was engineered by fusing Nluc to GRK3ct, a GPCR kinase, and Venus to Gβγ to observe G‐protein activation. 40 While the above two types of BRET sensors can monitor GPCR activation without direct fusion to the GPCR, they can result in false positives since the sensor activation is dependent on general GPCR activity and not the specific activity of the GPCR of interest. Consequently, control studies without the expression of the GPCR of interest is needed to ensure the sensor activation observed is due to the GPCR of interest.
The advantage of G‐protein binding and activation‐based BRET sensors is that these sensors have been illustrated for a wide variety of G‐protein subtypes (Gαi, Gαo, Gαs, Gαq, Gα12 and Gα13), enabling the detection of a large number of GPCR agonists. 21 A disadvantage of BRET sensors is that they have poor sensitivity for some G‐protein subtypes. 21 However, a higher sensitivity can be achieved by systematic optimisation of the insertion points for the BRET pairs. This systematic optimisation was performed in the BRET biosensors TRUPATH, where 14 BRET‐based GPCR sensors were developed. 41 Still, individual optimisation for each BRET biosensor is strenuous, making it desirable to have a more universal sensor design platform.
In a similar design to the BRET sensors, FRET sensors have been developed with the fluorescent proteins cyan fluorescent protein (CFP) and YFP, where one FRET pair is attached to the GPCR and the other is attached to the G‐protein or G‐protein mimic. The activation of the GPCR causes YFP to come in proximity to CFP and energy transfer can occur (Figure 3B). This sensor type has been developed for the α2AAR, 42 , 43 the muscarinic‐M4 receptor, 43 the A2A‐adenosine receptor 44 and the β1‐adrenergic receptor 44 (Table 1). Enhanced CFP (ECFP) and enhanced green fluorescent protein (EGFP) were used as FRET pairs for the bradykinin receptor type 2. 45 FRET has faster kinetics than BRET; however, FRET's need for excitation of the donor fluorescent proteins could lead to cell damage or photobleaching. BRET's use of a chemical substrate, therefore, can be less destructive for the cell.
2.1.2. BRET and FRET sensors based on GPCR–β‐arrestin interaction
BRET sensors have been designed based on the intermolecular interaction between β‐arrestin and the active GPCR's C‐terminus. Rluc as the BRET donor has been fused to the C‐terminus of a GPCR and YFP as the BRET acceptor has been fused to β‐arrestin2 to detect the activation of β2AR, 46 the thyrotropin releasing hormone receptor 47 , 48 and the oxytocin receptor 49 (Figure 3E). Additionally, RLuc and GFP from Renilla reniformis have been attached to a GPCR and the transmembrane domain, respectively, where β‐arrestin‐induced internalisation causes a change in energy transfer efficiency. 50 This sensor type has been designed for the angiotensin II receptor type 1, melanocortin type 4 receptor, and the V2R and can be used to interrogate receptor activation as well as GPCR recycling events. 50 The GFP and RLuc BRET pair fused to V2R and β‐arrestin, respectively, was also used to interrogate how palmitoylation of the V2R carboxyl tail affects β‐arrestin recruitment. 51
A BRET sensor with improved efficiency was designed, in which the V2R is fused to hRLuc/RLuc8 and β‐arrestin2 is fused to a modified form of GFP, called 2GFP. 52 Cells expressing the above BRET sensor were transplanted into a mouse kidney and a transparent, plastic window was fitted into the skin and body wall adjacent to the kidney. The window enables BRET to be measured in deep tissues. 52 The same BRET pair was used to design a BRET‐based GPCR sensor by fusing β2AR to Rluc and β‐arrestin2 to 2GFP. 53 Due to poor light penetration in deep tissues, sufficient BRET signal was only achieved in the testes of mice and not in other tissues. 53 In future work, a red‐shifted BRET pair can improve BRET detection in deep tissues.
BRET sensors have also been developed to detect the specific conformational change found in β‐arrestin upon recruitment to the GPCR. To design this sensor, RLuc and YFP have been attached to either terminus of β‐arrestin, 54 , 55 as well as NLuc and a red‐shifted fluorescent protein 56 (Figure 3F). Different from the above intermolecular BRET sensors, these BRET sensors detect the intramolecular BRET efficiency change due to arrestin's conformational change. Compared to intermolecular BRET and FRET, intramolecular BRET and FRET have a smaller change in the distance between the BRET/FRET pairs and, therefore, a lower signal dynamic range. However, these intramolecular β‐arrestin‐based BRET sensors can observe the different types of active conformations that β‐arrestin adopts and have been used for a variety of GPCRs, such as the angiotensin 1 receptor, vasopressin receptors 1 and 2, β1 and β2‐adrenergic receptors, muscarinic 1 receptor, chemokine receptor 5, delta opioid receptor (DOR), serotonin receptor, platelet‐activating factor receptor, chemokine receptor type 7 and the glucagon‐like peptide‐1 receptor. 54 , 55 , 56
Similar to the G‐protein‐based FRET design, CFP and YFP have been used as FRET pairs. One FRET pair is attached to the GPCR and the other is attached to β‐arrestin1 or 2 (Figure 3E). These sensors have been applied in cell cultures to determine the time it takes β‐arrestin2 to be recruited to the parathyroid hormone 1 receptor 57 and β2AR. 58 They have also been applied to determine the differential recruitment of β‐arrestin1 and 2 to P2Y2R. 59
Compared to the G‐protein‐based sensors, β‐arrestin‐based BRET and FRET real‐time sensors can generate a stable on‐signal, because the GPCR–β‐arrestin interaction occurs on the order of minutes to tens of minutes, while the GPCR–G‐protein interaction is much more transient, on the order of seconds. Consequently, β‐arrestin‐based BRET and FRET real‐time sensors are also limited by their off kinetics. Additionally, not all GPCRs strongly recruit β‐arrestin. Therefore, G‐protein‐ and β‐arrestin‐based BRET and FRET sensors should be chosen depending on their different applications.
2.1.3. BRET and FRET sensors based on the conformational changes in the GPCR
G‐protein‐based BRET sensors require knowledge of the specific G‐protein type that binds to the GPCR which is not always known. β‐Arrestin‐based BRET sensors need to use GPCRs that couple strongly to β‐arrestin which, as stated previously, is not true for all GPCRs. To address these limitations in sensor designs, BRET and FRET sensors have been developed that utilise the conformational change of the GPCR upon activation rather than utilising the intermolecular interactions of the G‐proteins and β‐arrestin with the GPCR. Theoretically, these types of sensors should be more universal given that all GPCRs undergo a conformational change upon activation. CFP can be inserted into the third intracellular loop of the GPCR where the major conformational change takes place upon GPCR activation, and YFP can be fused to the C‐terminus of the GPCR, or the other way around (Figure 3G). This strategy has been used for the parathyroid hormone receptor 1 and α2AAR to observe the different conformational changes of GPCRs induced by different types of ligands. 57 , 60 These sensors have been developed for other types of GPCRs as well 61 , 62 , 63 (Table 1). These intramolecular sensors based on the conformational changes in the GPCR have a lower signal dynamic range than the intermolecular BRET and FRET sensors.
2.1.4. BRET and FRET for detecting the conformational change of binding proteins
Although the majority of FRET/BRET sensors for GPCR agonists involve GPCRs or G‐proteins in their design, the glycine FRET sensor (GlyFS) and the glutamate sensor (FLIPE) use soluble protein domains that can bind to glycine and glutamate in their sensor designs. In GlyFS, two FRET pairs, ECFP and Venus, were both attached to a rationally designed soluble glycine binding protein. 64 Glycine binding to the sensor reduces the FRET between the two fluorescent proteins (Figure 4A). GlyFs was used in acute hippocampal slices to reveal changes of extracellular glycine concentrations during development, enrichment of glycine outside of the synapse, and the increase of extracellular glycine from neuroplasticity. 64 The glutamate sensor, FLIPE, has a similar design to GlyFs, where ECFP and Venus were inserted into a soluble glutamate binding protein, ybeJ. 65 FLIPE was used to show that glutamate uptake in the cytosol of PC12 cells has a minimal effect on overall cytosolic glutamate levels. 65
FIGURE 4.

Periplasmic binding protein (PBP)‐based tools. (A) Resonance energy transfer pairs are attached to PBPs. Ligand binding induces a conformational change in the PBP, which results in a change in energy transfer efficiency. (B) PBPs are attached to either terminus of circularly permuted green fluorescent protein (cpGFP), where ligand binding to the PBP causes a conformational change in cpGFP, resulting in a fluorescence change.
2.1.5. Summary of advantages and limitations of BRET‐ and FRET‐based GPCR sensors
BRET‐ and FRET‐based sensors have been designed for a wide variety of GPCRs, mainly based on the activated GPCR's interaction with G‐proteins or β‐arrestin or the conformational change of the GPCR to indicate GPCR activation. BRET and FRET designs are highly versatile and can be generally applied to most GPCRs by using different types of Gα‐proteins or β‐arrestin. However, BRET is limited by the low signal intensity of luminescence which requires longer BRET acquisition time. FRET is limited in its signal‐to‐noise ratio (SNR), which is most commonly <100%, due to potential spectral overlap or non‐proximity‐based energy transfer. Here, we define SNR for real‐time sensors as either the agonist‐induced change of fluorescence over the initial fluorescence or the signal over background ratio. Additionally, these sensors take extensive engineering to determine the correct placement of the donor and acceptor, so the specific conformation‐induced change of the distance of the FRET donor–acceptor pair can be maximal. Lastly, BRET and FRET require the use of two fluorescence channels, limiting the use of multiple fluorescence markers and sensors.
To overcome these limitations, single fluorescent‐protein‐based systems have been developed by using cpGFP. Circular permutation involves the fusion of the original N‐ and C‐terminus of a protein and the creation of a new N‐ and C‐terminus in a different position on the protein. cpGFP was engineered to have its new N‐ and C‐terminus near the fluorophore pocket, thereby making the fluorophore more exposed to the solvent environment. Environmental changes around the cpGFP fluorophore can cause a change in the fluorescence emission intensity. This resulting change in fluorescence is instantaneous and reversible, making cpGFP a good tool for real‐time detection of neurotransmitters and neuromodulators. cpGFP as a real‐time sensor has been used in two ways: (1) cpGFP inserted into periplasmic binding proteins; and (2) cpGFP inserted into the third intracellular loop of a GPCR.
2.2. Single‐colour fluorescent sensors based on cpGFP insertion into periplasmic binding proteins
Fluorescent sensors for several neuromodulators and neurotransmitters have been engineered using periplasmic binding proteins, receptors found in bacteria that undergo a conformational change in the presence of a variety of small molecules. Specifically, these are Venus‐fly trap‐like proteins that close in the presence of their binding ligand. cpGFP was inserted into periplasmic binding proteins to create a series of neurotransmitter and neuromodulator sensors, named sensing fluorescent reporters (SnFRs). For the SnFR design, ligand binding causes a conformational change in the periplasmic binding proteins which causes a change in the fluorophore environment of cpGFP, resulting in a fluorescence change (Figure 4B). SnFRs have been developed to detect several GPCR ligands, including glutamate, GABA, acetylcholine and serotonin, with SNR from 1 to 25 (Table 1). The glutamate version of SnFR, called iGluSnFR, has been used to detect glutamate in Caenorhabditis elegans, zebrafish, mice and ferrets. 66 The original iGluSnFR used circular permuted enhanced GFP (cpEGFP) but new versions have since been developed with circularly permuted super folder GFP (SF‐iGluSnFR) which has higher expression level and fluorescent signals. 67 Additionally, different coloured variants and variants with a variety of affinities for glutamate have been developed. 67 More recently, iGluSnFR3 was developed through directed evolution and has a higher SNR, dynamic range, expression and photostability than SF‐iGluSnFR. 68 Finally, faster versions of iGluSnFR have been developed to resolve individual glutamate release events in rat hippocampal slices. 69 The SnFR engineering technique has also been used to engineer a sensor for an important inhibitory neurotransmitter, GABA. iGABASnFR has been used in vivo to track the concentration of GABA in the mitochondria in zebrafish models and track the GABA signalling dynamics during interictal spikes and seizures in mice. 70 Recently, iAChSnFR was developed to detect acetylcholine release in mice, zebrafish, flies and C. elegans. 71
Naturally occurring periplasmic binding proteins do not exist for the majority of neurotransmitters and neuromodulators, limiting the generalizability of the SnFR design; however, engineering of the binding pocket of existing periplasmic binding proteins could lead to the development of new sensors. Using machine learning, researchers re‐engineered the binding pocket of iAChSnFR's periplasmic binding protein to bind to serotonin, generating iSeroSnFR. iSeroSnFR was used to detect serotonin release in mice during different behavioural assays, such as fear conditioning, social interaction and sleep/wake transitions. 72 Further, site‐saturated mutagenesis of a periplasmic binding protein was performed to select for a variant that can bind specifically to nicotinic acetylcholine receptor agonists, thereby creating iNicSnFR. iNicSnFR was used to determine the rate at which different nicotinic receptor agonists leave the endoplasmic reticulum. 73 The iNicSnFR was subsequently mutated using site‐saturated mutagenesis and rational design to select for variants that specifically bind to S‐methadone and not cholinergic ligands; this sensor is called iS‐methadoneSnFR. 74
To further illustrate the versatility of the SnFR design platform, a new set of SnFRs were developed recently for a series of smoking‐cessation drugs: dianicline, cytisine, 10‐fluorocytisine and 9‐bromo‐10‐ethylcytisine. These sensors are called iDrugSnFRs and have been used to determine the differing rates of membrane crossing of smoking‐cessation drugs, a property that affects the drug's pharmokinetics. 75
The application of the SnFR sensors has been demonstrated in a variety of model organisms to interrogate the neurobiology underlying various neurotransmitter and neuromodulator‐mediated signalling events. The wide applicability of SnFRs for in vivo experiments illustrates the usefulness and robustness of the sensor design.
2.3. Single‐colour fluorescent sensors based on cpGFP insertion into the third intracellular loop of GPCRs
GPCR activation‐based (GRAB) and light sensors were developed by inserting cpGFP into the third intracellular loop of a GPCR. Upon agonist binding, the third intracellular loop undergoes a conformational change that changes the fluorophore environment of cpGFP, resulting in a fluorescence change (Figure 5). These sensors have been developed to detect dopamine, 76 , 77 endogenous opioid peptides, 76 , 78 serotonin, 79 , 80 noradrenaline, 76 , 81 , 82 endocannabinoids, 83 adenosine 84 , 85 and acetylcholine 86 , 87 with most SNRs ranging between 2 and 10 (Table 1). For some versions of these sensors, portions of the third intracellular loop have been truncated to allow a larger fluorescence change. Different linkers connecting cpGFP to the third intracellular loop have also been screened to change the sensitivity and SNR of the sensors. Both rational design and site‐saturated mutagenesis have been used to engineer these sensors and improve their SNR and overall brightness. 88 In addition, red‐shifted versions have been developed for both GRAB and light sensors to allow for multiplexed imaging of different neurotransmitters and neuromodulators at a single time. 89 , 90 For a more comprehensive overview of the engineering used to design the GRAB/light sensors, see reference. 88
FIGURE 5.

Circularly permuted green fluorescent protein (cpGFP) inserted into the third intracellular loop of a G‐protein‐coupled receptor (GPCR). Upon agonist‐induced GPCR activation, the third intracellular loop of the GPCR undergoes a conformational change, changing the fluorophore environment of cpGFP and resulting in a fluorescence change.
GRAB sensors have been used in a variety of in vivo models, including flies, zebrafish and mice. 77 Light sensors have been illustrated in vivo in mice and rats. 76 These sensors were used in animal models to reveal important information about neurotransmitter and neuromodulator‐mediated neurobiology. To highlight a few applications, the GRABAdo sensor was used to study sleep homeostasis and found that adenosine is at high concentration during rapid eye movement (REM) sleep, but low outside of the REM sleep cycle. 84 Using GRABAdo, researchers also found that the activation of glutamatergic neurons resulted in an increase of adenosine. Further, dLight helped researchers find that heroin activates dopaminergic neurons located in the medial area of the VTA, 91 dopamine is involved in relapse and alcohol‐seeking behaviours, 92 and that the pattern of morphine exposure affects dopamine release in the nucleus accumbens. 93 GRABDA was used to show that alcohol, but not fat, significantly increased dopamine in the nucleus accumbens and that fat, but not alcohol, increased dopamine in the dorsal striatum. 94
2.4. Translocation assays
Rather than genetically altering the GPCR, translocation assays can be performed to indicate GPCR activation. When a GPCR is activated, GPCR‐interacting proteins can translocate from the cytoplasm to the cell membrane or from the membrane to the cytoplasm. Consequently, these interacting proteins, such as β‐arrestin, 95 , 96 , 97 protein kinase C 95 and G‐proteins/mimics 98 , 99 have been tagged with fluorescent proteins and their agonist‐induced translocation has been detected with high‐magnification imaging. Total internal reflection fluorescence microscopy has also been used to analyse the fluorescence ∼100 nm from the cell surface, allowing measurements of fluorescence on the membrane only. 98 A major limitation of translocation assays is their low SNR.
2.5. Detection of second messengers
The activation of a GPCR can increase or decrease the concentration of second messengers, such as cAMP, IP3, Ca2+ and diacylglycerol. Consequently, sensors that can detect the concentration of second messengers can be used to detect GPCR activation by an agonist. These sensors can be generalizable to many GPCRs, because the activation of most GPCRs will cause a change in the concentration of at least one of the second messengers previously mentioned. However, second messaging events can also be caused by non GPCR‐mediated signalling, potentially giving false positive signals. It is, therefore, better to use GPCR agonist sensors that detect more upstream signals, such as conformational changes in the GPCR or β‐arrestin/G‐protein binding, when available.
One of the most widely used second messenger sensors, GCaMP, was first developed in 2001 to detect intracellular calcium changes in living cells. 100 GCaMP involves the fusion of a calcium‐dependent protein binding pair, M13 and calmodulin, to either terminus of cpGFP. In the presence of calcium, these proteins bind, changing the fluorophore environment of cpGFP and resulting in a fluorescence change (Figure 6A). After 20 years of dedicated work in sensor optimisation, improved versions of GCaMP have been published that have better SNR, heightened brightness, faster kinetics and heightened calcium sensitivity than the original version. 101 , 102 , 103 , 104 GCaMP has been used in a variety of model organisms in vivo, such as C. elegans, 102 , 104 flies, 101 , 102 , 103 , 104 mice 101 , 102 , 103 , 104 and zebrafish. 101 , 102 Further, GCaMP has been used in vivo to detect calcium spiking in axons, illustrating its subcellular resolution. 105 The impact of GCaMP on the field of neuroscience cannot be understated. Because this review focuses on neuromodulators and not calcium sensors, a more extensive review of GCaMP and its different optimised versions, as well as other genetically encoded calcium sensors, can be found in references. 106 , 107
FIGURE 6.

Sensors that detect secondary messengers. (A) Calcium‐sensing proteins, calmodulin and M13, are attached to either terminus of circularly permuted green fluorescent protein (cpGFP). In the presence of calcium, calmodulin and M13 interact, resulting in a change in the fluorophore environment of cpGFP and a fluorescence increase. (B) Schematic of CAMYEL. Bioluminescence resonance energy transfer (BRET) pairs RLuc and yellow fluorescent protein (YFP) are tethered to EPAC. cAMP binding causes a conformational change in EPAC, where the energy transfer efficiency is decreased. (C) EPAC was attached to either terminus of cpGFP. cAMP‐induced EPAC conformational change results in a change in cpGFP fluorescence. (D) PKCγ, which only binds to diacylglycerol (DAG), is tethered to either terminus of cpGFP. DAG induces a conformational change in PKCγ, changing the cpGFP fluorescence.
A FRET sensor used to detect cAMP, called CAMYEL, was developed by inserting a protein that interacts with cAMP, EPAC, in between two BRET pairs, YFP and RLuc. 108 Upon the binding of cAMP to CAMYEL, there is a quantifiable decrease in BRET signal (Figure 6B). This tool was used to discover that sphingosine 1‐phosphate can increase the amount of intracellular cAMP that is stimulated by isoproterenol and prostaglandin E2.108 In addition to CAMYEL, many other FRET sensors for cAMP detection have been developed and are summarised in reference. 109 EPAC was also inserted into cpGFP, where cAMP binding to cpGFP causes a change in cpGFP fluorescence intensity 110 (Figure 6C).
A fluorescent sensor for diacylglycerol was developed by fusing cpGFP to an isoform of protein kinase II that only responds to diacylglycerol 111 (Figure 6D). This diacylglycerol sensor was, then, improved by replacing cpGFP with the brighter mNeonGreen fluorescent protein. 110 Additionally, FRET was used to develop a sensor for protein kinase A activity, an important protein in downstream GPCR signal transduction. 112
3. GPCR agonist integration sensors
Integration‐based GPCR agonist sensors integrate the GPCR agonist signal into a permanent and measurable readout for further analysis post mortem. Integration sensors have complementary strengths to real‐time sensors by enabling the examination of the localisation of GPCR agonists across a large area of interest or the whole brain to interrogate a GPCR's effect on neuronal circuitry globally. Additionally, through permanent neuronal labelling, integrators allow further interrogation of the neuronal circuits of interest. Integration‐based GPCR agonist sensors have been engineered for a wide variety of GPCRs and can be divided into three main categories based on their signal output: (1) transcriptional activation; (2) cpGFP fluorophore formation; and (3) split protein complementation sensors.
3.1. Transcriptional activation‐based GPCR agonist integration sensors
A transcriptional activation‐based GPCR sensor uses unique transcription factors and promoters that are orthogonal with the cellular system to activate a reporter gene upon agonist binding. The reporter genes commonly code for fluorescent proteins, so that activation of the sensors by GPCR agonists will fluorescently label the cells. Transcription‐based GPCR sensors were first developed in 2008, in which the C‐terminus of the V2R was fused to the tTA transcription factor via the N1a tobacco etch virus (TEV) protease cleavage site (TEVcs), and β‐arrestin2 was fused to TEV protease 113 (Figure 7A). In the presence of the V2R agonist, the β‐arrestin2 fused to TEV protease will bind to the C‐terminus of V2R, bringing the protease in proximity to TEVcs for cleavage to take place, releasing tTA. No longer tethered to the membrane, tTA can then translocate to the nucleus and activate a tTA‐dependent reporter gene. This sensor design, called Tango, was developed for 89 other GPCRs, illustrating the robustness of the technique. 113 It is important to note, however, that the V2R's C‐terminal tail needs to be added to the other GPCRs to enhance β‐arrestin2 recruitment and consequently increase the SNR. Here, we define SNR of integrators as the signal over background ratio.
FIGURE 7.

Integrators. (A) Schematic of Tango. The C‐terminus of the G‐protein‐coupled receptor (GPCR) is fused with a tobacco etch virus protease cleavage site (TEVcs) and transcription factor (TF). β‐Arrestin is tethered to a TEV protease. Agonist binding to the GPCR recruits β‐arrestin, where the TEV protease can then cut at the TEVcs, releasing the TF so it can translocate to the nucleus and activate a reporter gene. (B) Schematic of iTango2. Same basic mechanism as Tango, except the TEV protease is split into two components (TEV‐N and TEV‐C) that are fused to β‐arrestin and the GPCR. Additionally, the light oxygen voltage sensing (AsLOV2) domain cages the TEVcs. Agonist recruits β‐arrestin fused split TEV to the GPCR, where the split protease components can reassociate and light uncages TEVcs, allowing the protease to cut and release the TF. (C) Schematic of SPARK. Same basic mechanism as iTango2, except the TEV protease is not split, a truncated protease is used instead. Additionally, evolved LOV (eLOV) is used instead of AsLOV2. (D) Schematic of SPOTIT. Circularly permuted green fluorescent protein (cpGFP) and Nb39 are tethered to the C‐terminus of the GPCR. Nb39 inhibits cpGFP fluorophore formation. Agonist activates the opioid receptor (OR), recruiting Nb39 to the third intracellular loop, releasing cpGFP and allowing the fluorophore to form. (E) Schematic of SPOTon. Same basic mechanism of SPOTIT, except cpGFP‐Nb39 is fused to FK506 binding protein (FKBP) and the OR is fused to FKBP‐rapamycin binding domain (FRB). Rapamycin induces heterodimerisation of FKBP and FRB, bringing cpGFP‐Nb39 to the OR. Opioid activates the OR, recruiting Nb39 to the third intracellular loop and allowing the cpGFP fluorophore to mature. (F) Schematic of Trio. GFP is split into three component: β1‐9, β10 and β11. β10 is attached to β‐arrestin, β11 is attached to the GPCR and β1‐9 is expressed in the cytosol. Agonist‐induced GPCR activation recruits β‐arrestin to the C‐terminus of the GPCR, allowing the three split components of GFP to re‐associate and a fluorescence increase.
To apply Tango to the majority of the druggable GPCRs within the human genome, PRESTO‐Tango was developed. 114 PRESTO‐Tango uses a ‘modular design strategy’ to efficiently design Tango‐based GPCR sensors for over 300 GPCRs. The researchers, then, demonstrated these 300+ Tango‐based sensors can be used to test compounds against nearly the entire druggable human GPCR genome. They tested two compounds against 133 GPCR‐Tango targets and showed that one compound, lysergic acid diethylamide, has activities against GPCRs that were not previously known. 114 Additionally, they screened 91 GPCR‐Tango targets against FDA‐approved drugs and found that the diabetes drug, nateglinide, has activity against MRGPRX4, a receptor thought to be involved in pain and itch. 114
The PRESTO‐Tango system represents one of the most widely applied high‐throughput screening platform for GPCR ligands. However, its application in detecting GPCR ligands has so far been limited to cell cultures. In the PRESTO‐Tango system, the TEV protease has basal cleavage activity that could accumulate over time in animal models, reducing the SNR. Additionally, Tango activation requires hours of GPCR agonist incubation due to the low catalytic efficiency of the TEV protease. To overcome these limitations, a light‐activated Tango was developed in 2017 called inducible Tango (iTango2). 115
Because integrators can start accumulating background signal immediately after the sensor is expressed, iTango2's use of a light gating reduces the overall background of the system and allows signal to accumulate only in the light window. Additionally, light can be used as a temporal gating to record signalling events during a specific behaviour. The iTango2 design differs from Tango in two main ways (Figure 7B). First, the TEV protease is split into two halves, where one is tethered to β‐arrestin2 and the other is attached to the C‐terminus of the GPCR. Second, an engineered lightsensing protein based on Avena sativa phototropin 1 light‐oxygen‐voltage 2 domains (AsLOV2) is added to cage the TEVcs in the dark state. In light, the Jα helix of the AsLOV2 protein undergoes a conformational change, uncaging the TEVcs to be accessible to the TEV protease. Agonist activation recruits β‐arrestin2, bringing split TEV protease half TEV‐C to the GPCR‐TEV‐N fusion protein, and allowing the split TEV protease to reconstitute. Therefore, only in the presence of both light and agonist activation will the split TEV protease be reconstituted and can cleave the light‐uncaged TEVcs, releasing tTA. iTango2 showed a SNR 20‐fold higher than the original Tango system. 115 iTango2 has been developed for DRD2, 115 cannabinoid receptor type 1, 115 serotonin receptor 1A, 115 neuropeptide Y receptor type 1 115 and the oxytocin receptor 116 (Table 2). Additionally, iTango2 has been used to label dopamine‐sensitive neuronal populations during reward‐based learning in mice 115 and was used to detect the change of CCR5 activity after learning in mice. 117
TABLE 2.
Integrator sensors
| Sensor type | NT/NM detection | SNR | EC50 | Model | References |
|---|---|---|---|---|---|
| TANGO | Has been developed for over 300 GPCRs | 1.3–180 | NA | HEK, neuron culture, mouse | 113 , 114 |
| iTANGO | Dopamine | 8.9 | ∼50 nM | HEK, neuron culture, mice | 115 , 117 |
| Cannabinoid | ∼3.6 | NA | Neuron culture | 115 | |
| Serotonin | ∼4.5 | NA | Neuron culture | 115 | |
| Neuropeptide Y | ∼6.3 | NA | Neuron culture | 115 | |
| Oxytocin | 6.6 | ∼2.5 μM | HEK, neuron culture, mice | 116 | |
| SPARK | Epinephrine/norepinephrine | 24 | 52 nM iso | HEK | 118 , 122 |
| Motilin | 18 | NA | HEK | 118 | |
| Dopamine | 19 | NA | HEK | 118 | |
| Bombesin | 37 | NA | HEK | 118 | |
| Vasopressin | 4.2 | NA | HEK | 118 | |
| Angiotensin II | 1.4 | NA | HEK | 118 | |
| SPOTIT | Opioid peptides |
MOR: 13 KOR: 38 DOR: 2.7 |
15 nM fentanyl 0.77 μM salvinorin A |
HEK and neuron culture | 123 , 124 , 125 |
| Trio | Epinephrine/norepinephrine | NA | NA | HEK | 127 |
| Neurokinin | NA | NA | HEK | 127 | |
| Opioid peptides | NA | NA | HEK | 127 |
Note: ∼Estimated values, because raw values were not available in the publication. All values were rounded to 1–2 significant digits. For all signal‐to‐noise ratio (SNR), the highest values were taken from the publications referenced. For the EC50/Kd values, a range of values were recorded from the publications referenced. EC50/Kd values for different versions of a sensor are included in the range. For those tested in multiple cell types, the SNR and EC50/Kd range are chosen for the cell type that gave the best SNR and lowest EC50/Kd. For the integrator sensors, the SNR was calculated as the signal in the presence of agonist over the background signal without agonist. For the light‐gated integrators, the agonist‐dependent SNR in the presence of light was recorded.
Abbreviations: DOR, delta opioid receptor; GPCRs, G‐protein‐coupled receptors; HEK, human embryonic kidney cells; KOR, kappa opioid receptor; MOR, mu opioid receptor; NT/NM, neurotransmitter/neuromodulator; SNR, signal‐to‐noise ratio.
Similar to iTango2, SPARK is a light‐controlled, transcription‐based GPCR agonist sensor that utilises TEV protease cleavage to release a unique transcription factor that is tethered to the GPCR and can activate reporter gene expression 118 , 119 , 120 (Figure 7C). SPARK differs from iTango2 in two main ways. First, it does not use split TEV protease and instead uses a C‐terminal truncated TEV protease that has low affinity for the TEVcs. This allows protease cleavage only to occur when the TEV protease is brought to proximity to the TEVcs. Second, the TEVcs is caged by an evolved version of the AsLOV2 domain (eLOV). eLOV was evolved using directed evolution and was shown to have a 10× better light‐to‐dark signal ratio than the original AsLOV2. 121 In the initial testing of the SPARK design for detecting GPCR agonists, β2AR was fused to the eLOV domain‐caged TEVcs and a GAL4 transcription factor and β‐arrestin was fused to the truncated TEV protease. To illustrate the generalizability of SPARK in GPCR agonist detection, SPARK was tested with eight different GPCRs. Six of these GPCRs had robust light‐ and ligand‐dependent gene activation with five having ligand‐dependent SNR above 15 118 (Table 2).
One main advantage of the transcriptional system is the versatility of the signal output. To illustrate this, researchers used β2AR‐SPARK to drive luciferase expression, illustrating how SPARK can be used for high‐throughput screening assays that need an easily quantifiable readout. 118 SPARK and iTango were compared using the β2AR versions of both tools and transfection in HEK293T cells. SPARK was found to have a 16.4‐fold higher ligand‐dependent SNR 118 and a higher sensitivity than iTango2. 118
Recently, SPARK2 was developed using an evolved TEV protease, uTEV1Δ, with improved catalytic efficiency. 122 SPARK's activation efficiency is limited to the number of cleavage events performed by the TEV protease. Due to the relatively slow catalytic rate of the TEV protease, SPARK requires 10–15 min of light and agonist stimulation to see a sufficient signal, limiting its application in situations where the GPCR agonist‐induced protein–protein interaction (PPI) occurs on the order of seconds to a few minutes. SPARK2 uses uTEV1Δ which has a faster cleavage rate than the original TEV protease, and consequently only 1 min of light and agonist stimulation is needed to see a robust signal for β2AR‐SPARK2. 122
3.2. cpGFP fluorophore formation‐based GPCR agonist integration sensors
SPARK and TANGO are multi‐component systems, where the SNR is highly protein expression level‐dependent and multiple viruses need to be delivered in animal model studies. Single protein chain‐based integration systems could overcome some of the limitations of the multi‐component systems for interrogating GPCR signalling in a whole brain at cellular resolution. Recently, cpGFP‐based sensors with a fluorophore formation‐based mechanism have been developed to detect opioids for the mu opioid receptor (MOR), KOR, and delta opioid receptor (DOR) 123 (Table 2). Named SPOTIT1, these tools take advantage of the ability of Nb39 to both bind to the active MOR and inhibit cpGFP fluorophore formation, thereby providing a sufficient protein switch for opioid detection. As shown in Figure 7D, in the absence of opioids, Nb39 remains bound to cpGFP and cpGFP fluorophore formation is inhibited. In the presence of opioids, Nb39 dissociates from cpGFP to bind to the active OR. This allows the cpGFP fluorophore to form and, therefore, a subsequent fluorescence increase. SPOTIT1 showed a SNR up to 12.5 in HEK293T cell culture and was shown to be effective in detecting a variety of opioid agonists, such as peptide agonists, synthetic agonists and partial agonists. SPOTIT1 was also shown to be functional in neuronal cell culture, illustrating its potential applicability in animal models. However, SPOTIT1 had reduced brightness in neuronal cell culture. 123 To improve the brightness of the SPOTIT sensors, SPOTIT2 was developed by adding four amino acids to the N‐terminus of cpGFP to better encapsulate the fluorophore and increase its quantum yield. 124 In HEK293T cell culture, SPOTIT2 is 11× brighter than SPOTIT1 and 2.7× brighter in neuronal culture. Our lab recently tested SPOTIT2 in mice and a significant difference in signal was detected between the morphine‐ and saline‐treated mice (unpublished data), illustrating SPOTIT2's potential applications in animal models.
As an integration reporter, SPOTIT accumulates opioid signal over time until reaching a saturation point. Similarly, the background signal, which arises from the basal activity of the ORs, could also accumulate over time. To minimise the background signal accumulation, a chemical‐gated version of SPOTIT, called SPOTon, was designed. 125 In the SPOTon sensor design, SPOTIT is split into two components which are fused to a heterodimerising PPI pair, FK506 binding protein (FKBP) and FKBP‐rapamycin binding domain (FRB); the OR was fused to FRB and cpGFP‐Nb39 was fused to FKBP. In the presence of the small molecule rapamycin, FKBP and FRB heterodimerise, bringing cpGFP‐Nb39 to the OR and creating a functional opioid sensor. Then, the opioid‐activated OR can recruit Nb39, allowing the cpGFP fluorophore to form. This sensor had a comparable opioid‐dependent SNR as the SPOTIT sensors and strong rapamycin‐dependence. 125 Due to rapamycin's low blood–brain barrier (BBB) penetrability, the engineering of a chemical‐gated SPOTon that is activated with a BBB penetrable molecule would be needed for animal studies. Further, even though SPOTIT has only been demonstrated to detect OR agonists, the SPOTIT design could potentially be extended to other GPCR agonists by using other conformational specific binding nanobodies.
3.3. Split fluorescent protein complementation
Termed bimolecular fluorescence complementation (BiFC), split fluorescent protein components have low fluorescence when the split fluorescent protein halves are apart, due to the inability of the fluorophore to form, and a high fluorescence when the components re‐associate. Split fluorescent protein can be designed to be proximity dependent by tuning the binding affinity of the split components, such that the complementation of the components only occurs when they are brought into proximity. These proximity‐dependent split fluorescent protein can then be fused to PPI pairs to detect PPIs (Figure 7F).
Split GFP has been used extensively in BiFC assays to detect GPCR agonists. GFP has a 11‐stranded β‐barrel structure and, due to its very stable structure, can be split in a variety of positions. Tripartite GFP, where GFP is split at β‐strand 10 and 11 to give three fragments: β10, β11 and β1‐9, has better SNR than a bipartite system due to reduced reassociation of the split fragments in the absence of PPI. 126 Tripartite GFP was used to detect GPCR activation by fusing β11 to the C‐terminus of a GPCR, β10 to β‐arrestin, and expressing β1‐9. 127 Agonist‐induced GPCR activation recruits β‐arrestin to the GPCR's C‐terminus, allowing all three split fragments to re‐associate and fluorophore formation to occur (Figure 7F). This assay, named Trio, was generated for the protease‐activated receptor 1, β2AR, neurokinin receptor and MOR (Table 2). However, similar to Tango and SPARK, this system is limited to GPCRs that recruit β‐arrestin and is a multiple component system.
4. SUMMARY
Tables 1 and 2 list various real‐time sensors and integration sensors for a range of GPCR agonists discussed in this review. When choosing which existing sensor to use, one must consider both the SNR and affinity of the agonist for the sensor. Higher SNRs are generally preferred to provide a more robust and sensitive application in animal models. Sensors with a range of affinities for the agonist need to be evaluated in the specific animal model used for testing to determine which sensor can detect agonist concentrations with the highest dynamic range. While some sensors have been validated in animal models, many sensors have only been tested in cell cultures. For the latter, careful evaluations in animal models are needed before the sensors can be applied to study endogenous agonist release. In some cases, further engineering of the sensor SNR or affinity for ligand might be needed to achieve robust application in animal models.
Generally, real‐time sensors have lower SNRs than integration sensors, partially due to the mechanism of the sensor design and also their transient detection, while integration sensors can accumulate signals over time to provide an end point readout. However, real‐time sensors can record the agonist‐induced fluctuation of signal from the same cells; therefore, even a low percentage of signal change could potentially be detected if the background of the system is low. Integration sensors require higher SNRs than real‐time sensors, because their agonist‐induced signal changes are not compared within the same cell but, instead, between different animals treated under different conditions. Typically, a minimum SNR of 5 or higher is required for integration reporters. Additionally, due to the protein level‐dependence for integration sensors, single‐component integration reporters are less variable and more advantageous than multi‐component integration reporters.
Due to their complementary strengths and limitations, both real‐time and integration sensors are useful for studying endogenous GPCR agonist release and their effects on neuromodulation and other physiological processes. Genetically encoded real‐time sensors of GPCR agonists are useful for interrogating the spatiotemporal dynamics of GPCR signalling. However, real‐time imaging does not allow further interrogation of the cell population of interest. Cellular resolution integrators are useful for mapping GPCR agonist release in a large area, being able to interrogate whole‐brain neuronal circuitry and label neurons exposed to the agonists for further interrogation. Integration sensors can be used first for unbiased search of the neuronal circuits affected by endogenous GPCR agonists across the brain. Real‐time sensors can then be used to perform detailed characterisations of the spatiotemporal dynamics of endogenous GPCR agonist release in those circuits. The combined use of these sensors, therefore, can help expand our overall knowledge of GPCR‐mediated neuronal signalling.
CONFLICT OF INTEREST
The authors declare they have no conflicts of interest.
ACKNOWLEDGEMENTS
This work is supported by the University of Michigan. Wenjing Wang is supported by NIH R01DA05320001A1 and DP2MH132939. Kayla E. Kroning is supported by NIH F31MH12915001.
Kroning KE, Wang W. Genetically encoded tools for in vivo G‐protein‐coupled receptor agonist detection at cellular resolution. Clin Transl Med. 2022;12:e1124. 10.1002/ctm2.1124
Contributor Information
Kayla E. Kroning, Email: kaylakro@umich.edu.
Wenjing Wang, Email: wenjwang@umich.edu.
REFERENCES
- 1. Pan H‐L Wu Z‐Z, Zhou H‐Y, et al. Modulation of pain transmission by G‐protein‐coupled receptors. Pharmacol Ther. 2008;117:141‐161. [DOI] [PMC free article] [PubMed] [Google Scholar]
- 2. Leung C, Wong Y. Role of G protein‐coupled receptors in the regulation of structural plasticity and cognitive function. Molecules. 2017;22:1239. [DOI] [PMC free article] [PubMed] [Google Scholar]
- 3. Billington CK, Penn RB. Signaling and regulation of G protein‐coupled receptors in airway smooth muscle. Respir Res. 2003;4:2. [PMC free article] [PubMed] [Google Scholar]
- 4. Tzameli I. GPCRs—pivotal players in metabolism. Trends Endocrinol Metab. 2016;27:597‐599. [DOI] [PubMed] [Google Scholar]
- 5. Gacasan SB, Baker DL, Parrill AL. G protein‐coupled receptors: the evolution of structural insight. AIMS Biophys. 2017;4:491‐527. [DOI] [PMC free article] [PubMed] [Google Scholar]
- 6. Hamm HE. How activated receptors couple to G proteins. PNAS. 2001;98:4819‐4821. [DOI] [PMC free article] [PubMed] [Google Scholar]
- 7. Seyedabadi M, Gharghabi M, Gurevich EV, Gurevich VV. Receptor–arrestin interactions: the GPCR perspective. Biomolecules. 2021;11:218. [DOI] [PMC free article] [PubMed] [Google Scholar]
- 8. Wacker D, Stevens RC, Roth BL. How ligands illuminate GPCR molecular pharmacology. Cell. 2017;170:414‐427. [DOI] [PMC free article] [PubMed] [Google Scholar]
- 9. Newton AC, Bootman MD, Scott JD. Second messengers. Cold Spring Harb Perspect Biol. 2016;8:a005926. [DOI] [PMC free article] [PubMed] [Google Scholar]
- 10. Tian X, Kang DS, Benovic JL. β‐Arrestins and G protein‐coupled receptor trafficking. Handb Exp Pharmacol. 2014;219:173‐186. [DOI] [PMC free article] [PubMed] [Google Scholar]
- 11. Wang J, Gareri C, Rockman HA. G‐protein‐coupled receptors in heart disease. Circ Res. 2018;123:716‐735. [DOI] [PMC free article] [PubMed] [Google Scholar]
- 12. Szafran K Faron‐Górecka A, Kolasa M, et al. Potential role of G protein‐coupled receptor (GPCR) heterodimerization in neuropsychiatric disorders: a focus on depression. Pharmacol Rep. 2013;65:1498‐1505. [DOI] [PubMed] [Google Scholar]
- 13. Huang Y, Todd N, Thathiah A. The role of GPCRs in neurodegenerative diseases: avenues for therapeutic intervention. Curr Opin Pharmacol. 2017;32:96‐110. [DOI] [PubMed] [Google Scholar]
- 14. Sriram K, Insel PA. G protein‐coupled receptors as targets for approved drugs: how many targets and how many drugs? Mol Pharmacol. 2018;93:251‐258. [DOI] [PMC free article] [PubMed] [Google Scholar]
- 15. Chefer VI, Thompson AC, Zapata A, Shippenberg TS. Overview of brain microdialysis. Curr Protoc Neurosci. 2009;47:Unit7.1. [DOI] [PMC free article] [PubMed] [Google Scholar]
- 16. Calhoun SE, Meunier CJ, Lee CA, McCarty GS, Sombers LA. Characterization of a multiple‐scan‐rate voltammetric waveform for real‐time detection of met‐enkephalin. ACS Chem Neurosci. 2019;10:2022‐2032. [DOI] [PMC free article] [PubMed] [Google Scholar]
- 17. Dankoski EC, Wightman RM. Monitoring serotonin signaling on a subsecond time scale. Front Integr Neurosci. 2013;7:44. [DOI] [PMC free article] [PubMed] [Google Scholar]
- 18. Venton BJ, Cao Q. Fundamentals of fast‐scan cyclic voltammetry for dopamine detection. Analyst. 2020;145:1158‐1168. [DOI] [PMC free article] [PubMed] [Google Scholar]
- 19. Nicolai EN Trevathan JK, Ross EK, et al. Detection of norepinephrine in whole blood via fast scan cyclic voltammetry. In: Proceedings of the 2017 IEEE International Symposium on Medical Measurements and Applications (MeMeA). 2017:111‐116. [DOI] [PMC free article] [PubMed]
- 20. Wang H, Jing M, Li Y. Lighting up the brain: genetically encoded fluorescent sensors for imaging neurotransmitters and neuromodulators. Curr Opin Neurobiol. 2018;50:171‐178. [DOI] [PMC free article] [PubMed] [Google Scholar]
- 21. Zhou Y, Meng J, Xu C, Liu J. Multiple GPCR functional assays based on resonance energy transfer sensors. Front Cell Dev Biol. 2021;. 9:611443. [DOI] [PMC free article] [PubMed] [Google Scholar]
- 22. Hall MP, Unch J, Binkowski BF, et al. Engineered luciferase reporter from a deep sea shrimp utilizing a novel imidazopyrazinone substrate. ACS Chem Biol. 2012;7:1848‐1857. [DOI] [PMC free article] [PubMed] [Google Scholar]
- 23. Wan Q, Okashah N, Inoue A, et al. Mini G protein probes for active G protein‐coupled receptors (GPCRs) in live cells. J Biol Chem. 2018;293:7466‐7473. [DOI] [PMC free article] [PubMed] [Google Scholar]
- 24. Galés C, Rebois RV, Hogue M, et al. Real‐time monitoring of receptor and G‐protein interactions in living cells. Nat Methods. 2005;2:177‐184. [DOI] [PubMed] [Google Scholar]
- 25. Che T, English J, Krumm BE, et al. Nanobody‐enabled monitoring of kappa opioid receptor states. Nat Commun. 2020;11:1145. [DOI] [PMC free article] [PubMed] [Google Scholar]
- 26. Che T, Majumdar S, Zaidi SA, et al. Structure of the nanobody‐stabilized active state of the kappa opioid receptor. Cell. 2018;172:55‐67.e15. [DOI] [PMC free article] [PubMed] [Google Scholar]
- 27. Huang W, Manglik A, Venkatakrishnan AJ, et al. Structural insights into μ‐opioid receptor activation. Nature. 2015;524:315‐321. [DOI] [PMC free article] [PubMed] [Google Scholar]
- 28. Rasmussen SGF, Choi H‐J, Fung JJ, et al. Structure of a nanobody‐stabilized active state of the β2 adrenoceptor. Nature. 2011;469:175‐180. [DOI] [PMC free article] [PubMed] [Google Scholar]
- 29. Wingler LM, McMahon C, Staus DP, Lefkowitz RJ, Kruse AC. Distinctive activation mechanism for angiotensin receptor revealed by a synthetic nanobody. Cell. 2019;176:479‐490.e12. [DOI] [PMC free article] [PubMed] [Google Scholar]
- 30. Kruse AC, Ring AM, Manglik A, et al. Activation and allosteric modulation of a muscarinic acetylcholine receptor. Nature. 2013;504:101‐106. [DOI] [PMC free article] [PubMed] [Google Scholar]
- 31. Nehmea R, Carpenter B, Singhal A, et al. Mini‐G proteins: novel tools for studying GPCRs in their active conformation. PLoS One. 2017;12:1‐26. [DOI] [PMC free article] [PubMed] [Google Scholar]
- 32. Maziarz M, Park J‐C, Leyme A, et al. Revealing the activity of trimeric G‐proteins in live cells with a versatile biosensor design. Cell. 2020;182:770‐785.e16. [DOI] [PMC free article] [PubMed] [Google Scholar]
- 33. Adjobo‐Hermans MJ, Goedhart J, van Weeren L, et al. Real‐time visualization of heterotrimeric G protein Gq activation in living cells. BMC Biol. 2011;9:32. [DOI] [PMC free article] [PubMed] [Google Scholar]
- 34. Mastop M, Reinhard NR, Zuconelli CR, et al. A FRET‐based biosensor for measuring Gα13 activation in single cells. PLoS One. 2018;13:e0193705. [DOI] [PMC free article] [PubMed] [Google Scholar]
- 35. Saulière A, Bellot M, Paris H, et al. Deciphering biased‐agonism complexity reveals a new active AT1 receptor entity. Nat Chem Biol. 2012;8:622‐630. [DOI] [PubMed] [Google Scholar]
- 36. Azpiazu I, Gautam N. A fluorescence resonance energy transfer‐based sensor indicates that receptor access to a G protein is unrestricted in a living mammalian cell. J Biol Chem. 2004;279:27709‐27718. [DOI] [PubMed] [Google Scholar]
- 37. Bünemann M, Frank M, Lohse MJ. Gi protein activation in intact cells involves subunit rearrangement rather than dissociation. Proc Natl Acad Sci U S A. 2003;100:16077‐16082. [DOI] [PMC free article] [PubMed] [Google Scholar]
- 38. Frank M, Thümer L, Lohse MJ, Bünemann MG. Protein activation without subunit dissociation depends on a Gαi‐specific region. J Biol Chem. 2005;280:24584‐24590. [DOI] [PubMed] [Google Scholar]
- 39. Galés C, Van Durm JJJ, Schaak S, et al. Probing the activation‐promoted structural rearrangements in preassembled receptor‐G protein complexes. Nat Struct Mol Biol. 2006;13:778‐786. [DOI] [PubMed] [Google Scholar]
- 40. Masuho I, Ostrovskaya O, Kramer GM, Jones CD, Xie K, Martemyanov KA. Distinct profiles of functional discrimination among G proteins determine the actions of G protein‐coupled receptors. Sci Signal. 2015;8:ra123. [DOI] [PMC free article] [PubMed] [Google Scholar]
- 41. Olsen RHJ, DiBerto JF, English JG, et al. TRUPATH, an open‐source biosensor platform for interrogating the GPCR transducerome. Nat Chem Biol. 2020;16:841‐849. [DOI] [PMC free article] [PubMed] [Google Scholar]
- 42. Hein P, Frank M, Hoffmann C, Lohse MJ, Bünemann M. Dynamics of receptor/G protein coupling in living cells. EMBO J. 2005;24:4106‐4114. [DOI] [PMC free article] [PubMed] [Google Scholar]
- 43. Nobles M, Benians A, Tinker A. Heterotrimeric G proteins precouple with G protein‐coupled receptors in living cells. Proc Natl Acad Sci U S A. 2005;102:18706‐18711. [DOI] [PMC free article] [PubMed] [Google Scholar]
- 44. Hein P, Rochais F, Hoffmann C, et al. GS activation is time‐limiting in initiating receptor‐mediated signaling. J Biol Chem. 2006;281:33345‐33351. [DOI] [PubMed] [Google Scholar]
- 45. Philip F, Sengupta P, Scarlata S. Signaling through a G protein‐coupled receptor and its corresponding G protein follows a stoichiometrically limited model. J Biol Chem. 2007;282:19203‐19216. [DOI] [PubMed] [Google Scholar]
- 46. Angers S, Salahpour A, Joly E, et al. Detection of β 2‐adrenergic receptor dimerization in living cells using bioluminescence resonance energy transfer (BRET). Proc Natl Acad Sci U S A. 2000;97:3684‐3689. [DOI] [PMC free article] [PubMed] [Google Scholar]
- 47. Kroeger KM, Hanyaloglu AC, Seeber RM, Miles LEC, Eidne KA. Constitutive and agonist‐dependent homo‐oligomerization of the thyrotropin‐releasing hormone receptor. Detection in living cells using bioluminescence resonance energy transfer. J Biol Chem. 2001;276:12736‐12743. [DOI] [PubMed] [Google Scholar]
- 48. Hanyaloglu AC, Seeber RM, Kohout TA, Lefkowitz RJ, Eidne KA. Homo‐ and hetero‐oligomerization of thyrotropin‐releasing hormone (TRH) receptor subtypes: differential regulation of β‐arrestins 1 and 2. J Biol Chem. 2002;277:50422‐50430. [DOI] [PubMed] [Google Scholar]
- 49. Hasbi A, Devost D, Laporte SA, Zingg HH. Real‐time detection of interactions between the human oxytocin receptor and G protein‐coupled receptor kinase‐2. Mol Endocrinol. 2004;18:1277‐1286. [DOI] [PubMed] [Google Scholar]
- 50. Namkung Y, Le Gouill C, Lukashova V, et al. Monitoring G protein‐coupled receptor and β‐arrestin trafficking in live cells using enhanced bystander BRET. Nat Commun. 2016;7:12178. [DOI] [PMC free article] [PubMed] [Google Scholar]
- 51. Charest PG, Bouvier M. Palmitoylation of the V2 vasopressin receptor carboxyl tail enhances β‐arrestin recruitment leading to efficient receptor endocytosis and ERK1/2 activation. J Biol Chem. 2003;278:41541‐41551. [DOI] [PubMed] [Google Scholar]
- 52. Huang Q, Acha V, Yow R, Schneider E, Sardar DK, Hornsby PJ. Bioluminescence measurements in mice using a skin window. J Biomed Opt. 2007;12:054012. [DOI] [PubMed] [Google Scholar]
- 53. Audet M, Lagacé M, Silversides DW, Bouvier M. Protein–protein interactions monitored in cells from transgenic mice using bioluminescence resonance energy transfer. FASEB J. 2010;24:2829‐2838. [DOI] [PubMed] [Google Scholar]
- 54. Shukla AK, Violin JD, Whalen EJ, Gesty‐Palmer D, Shenoy SK, Lefkowitz RJ. Distinct conformational changes in β‐arrestin report biased agonism at seven‐transmembrane receptors. Proc Natl Acad Sci U S A. 2008;105:9988‐9993. [DOI] [PMC free article] [PubMed] [Google Scholar]
- 55. Charest PG, Terrillon S, Bouvier M. Monitoring agonist‐promoted conformational changes of β‐arrestin in living cells by intramolecular BRET. EMBO Rep. 2005;6:334‐340. [DOI] [PMC free article] [PubMed] [Google Scholar]
- 56. Oishi A, Dam J, Jockers R. β‐Arrestin‐2 BRET biosensors detect different β‐arrestin‐2 conformations in interaction with GPCRs. ACS Sens. 2020;5:57‐64. [DOI] [PubMed] [Google Scholar]
- 57. Vilardaga JP, Bünemann M, Krasell C, Castro M, Lohse MJ. Measurement of the millisecond activation switch of G protein‐coupled receptors in living cells. Nat Biotechnol. 2003;21:807‐812. [DOI] [PubMed] [Google Scholar]
- 58. Krasel C, Bünemann M, Lorenz K, Lohse MJ. Β‐Arrestin binding to the Β2‐adrenergic receptor requires both receptor phosphorylation and receptor activation. J Biol Chem. 2005;280:9528‐9535. [DOI] [PubMed] [Google Scholar]
- 59. Hoffmann C, Ziegler N, Reiner S, Krasel C, Lohse MJ. Agonist‐selective, receptor‐specific interaction of human P2Y receptors with β‐arrestin‐1 and ‐2. J Biol Chem. 2008;283:30933‐30941. [DOI] [PMC free article] [PubMed] [Google Scholar]
- 60. Vilardaga JP, Steinmeyer R, Harms GS, Lohse MJ. Molecular basis of inverse agonism in a G protein‐coupled receptor. Nat Chem Biol. 2005;1:25‐28. [DOI] [PubMed] [Google Scholar]
- 61. Chachisvilis M, Zhang YL, Frangos JA. G protein‐coupled receptors sense fluid shear stress in endothelial cells. Proc Natl Acad Sci U S A. 2006;103:15463‐15468. [DOI] [PMC free article] [PubMed] [Google Scholar]
- 62. Rochais F, Vilardaga J‐P, Nikolaev VO, Bünemann M, Lohse MJ, Engelhardt S. Real‐time optical recording of β1‐adrenergic receptor activation reveals supersensitivity of the Arg389 variant to carvedilol. J Clin Invest. 2007;117:229‐235. [DOI] [PMC free article] [PubMed] [Google Scholar]
- 63. Reiner S, Ambrosio M, Hoffmann C, Lohse MJ. Differential signaling of the endogenous agonists at the β2‐adrenergic receptor. J Biol Chem. 2010;285:36188‐36198. [DOI] [PMC free article] [PubMed] [Google Scholar]
- 64. Zhang WH, Herde MK, Mitchell JA, et al. Monitoring hippocampal glycine with the computationally designed optical sensor GlyFS. Nat Chem Biol. 2018;14:861‐869. [DOI] [PubMed] [Google Scholar]
- 65. Okumoto S, Looger LL, Micheva KD, Reimer RJ, Smith SJ, Frommer WB. Detection of glutamate release from neurons by genetically encoded surface‐displayed FRET nanosensors. PNAS. 2005;102:8740‐8745. [DOI] [PMC free article] [PubMed] [Google Scholar]
- 66. Marvin JS, Borghuis BG, Tian L, et al. An optimized fluorescent probe for visualizing glutamate neurotransmission. Nat Methods. 2013;10:162‐170. [DOI] [PMC free article] [PubMed] [Google Scholar]
- 67. Marvin JS, Scholl B, Wilson DE, et al. Stability, affinity, and chromatic variants of the glutamate sensor iGluSnFR. Nat Methods. 2018;15:936‐939. [DOI] [PMC free article] [PubMed] [Google Scholar]
- 68. Aggarwal A, Liu R, Chen Y, et al. Glutamate indicators with improved activation kinetics and localization for imaging synaptic transmission. bioRxiv. 2022. 10.1101/2022.02.13.480251 [DOI] [PMC free article] [PubMed] [Google Scholar]
- 69. Helassa N, Dürst C, Coates C, et al. Ultrafast glutamate sensors resolve high‐frequency release at Schaffer collateral synapses. Proc Natl Acad Sci U S A. 2018;115:5594‐5599. [DOI] [PMC free article] [PubMed] [Google Scholar]
- 70. Marvin JS, Shimoda Y, Magloire V, et al. A genetically encoded fluorescent sensor for in vivo imaging of GABA. Nat Methods. 2019;16:763‐770. [DOI] [PubMed] [Google Scholar]
- 71. Borden PM, Zhang P, Shivange AV, et al. A fast genetically encoded fluorescent sensor for faithful in vivo acetylcholine detection in mice, fish, worms and flies. bioRxiv. 2020. 10.1101/2020.02.07.939504 [DOI] [Google Scholar]
- 72. Unger EK, Keller JP, Altermatt M, et al. Directed evolution of a selective and sensitive serotonin sensor via machine learning. Cell. 2020;183:1986‐2002.e26. [DOI] [PMC free article] [PubMed] [Google Scholar]
- 73. Shivange AV, Borden PM, Muthusamy AK, et al. Determining the pharmacokinetics of nicotinic drugs in the endoplasmic reticulum using biosensors. J Gen Physiol. 2018;151:738‐757. [DOI] [PMC free article] [PubMed] [Google Scholar]
- 74. Muthusamy AK, Kim CH, Virgil SC, et al. Three mutations convert the selectivity of a protein sensor from nicotinic agonists to S‐methadone for use in cells, organelles, and biofluids. J Am Chem Soc. 2022;144:8480‐8486. [DOI] [PMC free article] [PubMed] [Google Scholar]
- 75. Nichols AL, Blumenfeld Z, Fan C, et al. Fluorescence activation mechanism and imaging of drug permeation with new sensors for smoking‐cessation ligands. Elife. 2022;11:e74648. [DOI] [PMC free article] [PubMed] [Google Scholar]
- 76. Patriarchi T, Cho JR, Merten K, et al. Ultrafast neuronal imaging of dopamine dynamics with designed genetically encoded sensors. Science. 2018;360:eaat4422. [DOI] [PMC free article] [PubMed] [Google Scholar]
- 77. Sun F, Zeng J, Jing M, et al. A genetically encoded fluorescent sensor enables rapid and specific detection of dopamine in flies, fish, and mice. Cell. 2018;174:481‐496.e19. [DOI] [PMC free article] [PubMed] [Google Scholar]
- 78. Abraham AD, Casello SM, Schattauer SS, et al. Release of endogenous dynorphin opioids in the prefrontal cortex disrupts cognition. Neuropsychopharmacology. 2021;46:2330‐2339. [DOI] [PMC free article] [PubMed] [Google Scholar]
- 79. Wan J, Peng W, Li X, et al. A genetically encoded sensor for measuring serotonin dynamics. Nat Neurosci. 2021;24:746‐752. [DOI] [PMC free article] [PubMed] [Google Scholar]
- 80. Dong C, Ly C, Dunlap LE, et al. Psychedelic‐inspired drug discovery using an engineered biosensor. Cell. 2021;184:2779‐2792.e18. [DOI] [PMC free article] [PubMed] [Google Scholar]
- 81. Feng J, Zhang C, Lischinsky JE, et al. A genetically encoded fluorescent sensor for rapid and specific in vivo detection of norepinephrine. Neuron. 2019;102:745‐761.e8. [DOI] [PMC free article] [PubMed] [Google Scholar]
- 82. Oe Y, Wang X, Patriarchi T, et al. Distinct temporal integration of noradrenaline signaling by astrocytic second messengers during vigilance. Nat Commun. 2020;11:471. [DOI] [PMC free article] [PubMed] [Google Scholar]
- 83. Dong A, He K, Dudok B, et al. A fluorescent sensor for spatiotemporally resolved imaging of endocannabinoid dynamics in vivo. Nat Biotechnol. 2022;40:787‐798. [DOI] [PMC free article] [PubMed] [Google Scholar]
- 84. Peng W, Wu Z, Song K, Zhang S, Li Y, Xu M. Regulation of sleep homeostasis mediator adenosine by basal forebrain glutamatergic neurons. Science. 2020;369:eabb0556. [DOI] [PubMed] [Google Scholar]
- 85. Wu Z, Cui Y, Wang H, et al. A GRAB sensor reveals activity‐dependent non‐vesicular somatodendritic adenosine release. bioRxiv. 2020. 10.1101/2020.05.04.075564 [DOI] [Google Scholar]
- 86. Jing M, Li Y, Zeng J, et al. An optimized acetylcholine sensor for monitoring in vivo cholinergic activity. Nat Methods. 2020;17:1139‐1146. [DOI] [PMC free article] [PubMed] [Google Scholar]
- 87. Jing M, Zhang P, Wang G, et al. A genetically encoded fluorescent acetylcholine indicator for in vitro and in vivo studies. Nat Biotechnol. 2018;. 36:726‐737. [DOI] [PMC free article] [PubMed] [Google Scholar]
- 88. Wu Z, Lin D, Li Y. Pushing the frontiers: tools for monitoring neurotransmitters and neuromodulators. Nat Rev Neurosci. 2022;23:257‐274. [DOI] [PMC free article] [PubMed] [Google Scholar]
- 89. Sun F, Zhou J, Dai B, et al. Next‐generation GRAB sensors for monitoring dopaminergic activity in vivo. Nat Methods. 2020;17:1156‐1166. [DOI] [PMC free article] [PubMed] [Google Scholar]
- 90. Patriarchi T, Mohebi A, Sun J, et al. An expanded palette of dopamine sensors for multiplex imaging in vivo. Nat Methods. 2020;17:1147‐1155. [DOI] [PMC free article] [PubMed] [Google Scholar]
- 91. Corre J, van Zessen R, Loureiro M, et al. Dopamine neurons projecting to medial shell of the nucleus accumbens drive heroin reinforcement. Elife. 2018;7:1‐22. [DOI] [PMC free article] [PubMed] [Google Scholar]
- 92. Liu Y, Jean‐Richard‐Dit‐Bressel P, Yau JO‐Y, et al. The mesolimbic dopamine activity signatures of relapse to alcohol‐seeking. J Neurosci. 2020;40:6409‐6427. [DOI] [PMC free article] [PubMed] [Google Scholar]
- 93. Lefevre EM, Pisansky MT, Toddes C, et al. Interruption of continuous opioid exposure exacerbates drug‐evoked adaptations in the mesolimbic dopamine system. Neuropsychopharmacology. 2020;45:1781‐1792. [DOI] [PMC free article] [PubMed] [Google Scholar]
- 94. Alhadeff AL, Goldstein N, Park O, Klima ML, Vargas A, Betley JN. Natural and drug rewards engage distinct pathways that converge on coordinated hypothalamic and reward circuits. Neuron. 2019;103:891‐908.e6. [DOI] [PMC free article] [PubMed] [Google Scholar]
- 95. Lecat S, Matthes HWD, Pepperkok R, Simpson JC, Galzi JL. A fluorescent live imaging screening assay based on translocation criteria identifies novel cytoplasmic proteins implicated in G protein‐coupled receptor signaling pathways. Mol Cell Proteomics. 2015;14:1385‐1399. [DOI] [PMC free article] [PubMed] [Google Scholar]
- 96. Barak LS, Ferguson SSG, Zhang J, Caron MG. A β‐arrestin/green fluorescent protein biosensor for detecting G protein‐coupled receptor activation. J Biol Chem. 1997;272:27497‐27500. [DOI] [PubMed] [Google Scholar]
- 97. Zhang J, Barak LS, Anborgh PH, Laporte SA, Caron MG, Ferguson SS. Cellular trafficking of G protein‐coupled receptor/β‐arrestin endocytic complexes. J Biol Chem. 1999;274:10999‐11006. [DOI] [PubMed] [Google Scholar]
- 98. Stoeber M, Jullié D, Lobingier BT, et al. A genetically encoded biosensor reveals location bias of opioid drug action. Neuron. 2018;98:963‐976.e5. [DOI] [PMC free article] [PubMed] [Google Scholar]
- 99. O'Neill PR, Karunarathne WKA, Kalyanaraman V, Silvius JR, Gautama N. G‐protein signaling leverages subunit‐dependent membrane affinity to differentially control βγ translocation to intracellular membranes. Proc Natl Acad Sci U S A. 2012;109:E3568‐E3577. [DOI] [PMC free article] [PubMed] [Google Scholar]
- 100. Nakai J, Ohkura M, Imoto K. A high signal‐to‐noise Ca2+ probe composed of a single green fluorescent protein. Nat Biotechnol. 2001;19:137‐141. [DOI] [PubMed] [Google Scholar]
- 101. Chen TW, Wardill TJ, Sun Yi, et al. Ultrasensitive fluorescent proteins for imaging neuronal activity. Nature. 2013;499:295‐300. [DOI] [PMC free article] [PubMed] [Google Scholar]
- 102. Akerboom J, Chen T‐W, Wardill TJ, et al. Optimization of a GCaMP calcium indicator for neural activity imaging. J Neurosci. 2012;32:13819‐13840. [DOI] [PMC free article] [PubMed] [Google Scholar]
- 103. Dana H, Sun Yi, Mohar B, et al. High‐performance calcium sensors for imaging activity in neuronal populations and microcompartments. Nat Methods. 2019;16:649‐657. [DOI] [PubMed] [Google Scholar]
- 104. Tian L, Hires SA, Mao T, et al. Imaging neural activity in worms, flies and mice with improved GCaMP calcium indicators. Nat Methods. 2009;6:875‐881. [DOI] [PMC free article] [PubMed] [Google Scholar]
- 105. Broussard GJ, Liang Y, Fridman M, et al. In vivo measurement of afferent activity with axon‐specific calcium imaging. Nat Neurosci. 2018;21:1272‐1280. [DOI] [PMC free article] [PubMed] [Google Scholar]
- 106. Oh J, Lee C, Kaang B‐K. Imaging and analysis of genetically encoded calcium indicators linking neural circuits and behaviors. Korean J Physiol Pharmacol. 2019;23:237. [DOI] [PMC free article] [PubMed] [Google Scholar]
- 107. Lohr C, Beiersdorfer A, Fischer T, et al. Using genetically encoded calcium indicators to study astrocyte physiology: a field guide. Front Cell Neurosci. 2021;15:690147. [DOI] [PMC free article] [PubMed] [Google Scholar]
- 108. Jiang LI, Collins J, Davis R, et al. Use of a cAMP BRET sensor to characterize a novel regulation of cAMP by the sphingosine 1‐phosphate/G13 pathway. J Biol Chem. 2007;282:10576‐10584. [DOI] [PMC free article] [PubMed] [Google Scholar]
- 109. Massengill CI, Day‐Cooney J, Mao T, Zhong H. Genetically encoded sensors towards imaging cAMP and PKA activity in vivo. J Neurosci Methods. 2021;362:109298. [DOI] [PMC free article] [PubMed] [Google Scholar]
- 110. Tewson PH, Martinka S, Shaner NC, Hughes TE, Quinn AM. New DAG and cAMP sensors optimized for live‐cell assays in automated laboratories. J Biomol Screen. 2016;21:298‐305. [DOI] [PMC free article] [PubMed] [Google Scholar]
- 111. Tewson PH, Quinn AM, Hughes TE. A multiplexed fluorescent assay for independent second‐messenger systems: decoding GPCR activation in living cells. J Biomol Screen. 2012;18:797‐806. [DOI] [PMC free article] [PubMed] [Google Scholar]
- 112. Ross BL, Tenner B, Markwardt ML, et al. Single‐color, ratiometric biosensors for detecting signaling activities in live cells. Elife. 2018;7:e35458. [DOI] [PMC free article] [PubMed] [Google Scholar]
- 113. Barnea G, Strapps W, Herrada G, et al. The genetic design of signaling cascades to record receptor activation. Proc Natl Acad Sci U S A. 2008;105:64‐69. [DOI] [PMC free article] [PubMed] [Google Scholar]
- 114. Kroeze WK, Sassano MF, Huang Xi‐P, et al. PRESTO‐Tango as an open‐source resource for interrogation of the druggable human GPCRome. Nat Struct Mol Biol. 2015;22:362‐369. [DOI] [PMC free article] [PubMed] [Google Scholar]
- 115. Lee D, Creed M, Jung K, et al. Temporally precise labeling and control of neuromodulatory circuits in the mammalian brain. Nat Methods. 2017;14:495‐503. [DOI] [PubMed] [Google Scholar]
- 116. Mignocchi N, Krüssel S, Jung K, Lee D, Kwon H‐B. Development of a genetically‐encoded oxytocin sensor. bioRxiv. 2020. 10.1101/2020.07.14.202598 [DOI] [Google Scholar]
- 117. Shen Y, Zhou M, Cai D, et al. CCR5 closes the temporal window for memory linking. Nature. 2022;606:146‐152. [DOI] [PMC free article] [PubMed] [Google Scholar]
- 118. Kim MW, Wang W, Sanchez MI, Coukos R, von Zastrow M, Ting AY. Time‐gated detection of protein–protein interactions with transcriptional readout. Elife. 2017;6:e30233. ‐ [DOI] [PMC free article] [PubMed] [Google Scholar]
- 119. Kroning KE, Wang W. Temporally gated molecular tools for tracking protein–protein interactions in live cells. Methods Enzymol. 2020;640:205‐223. [DOI] [PubMed] [Google Scholar]
- 120. Geng L, Kroning KE, Wang W. SPARK: a transcriptional assay for recording protein–protein interactions in a defined time window. Curr Protoc. 2021;1:e190. [DOI] [PubMed] [Google Scholar]
- 121. Wang W, Wildes CP, Pattarabanjird T, et al. A light‐ and calcium‐gated transcription factor for imaging and manipulating activated neurons. Nat Biotechnol. 2017;35:864‐871. [DOI] [PMC free article] [PubMed] [Google Scholar]
- 122. Sanchez MI, Ting AY. Directed evolution improves the catalytic efficiency of TEV protease. Nat Methods. 2020;17:167‐174. [DOI] [PMC free article] [PubMed] [Google Scholar]
- 123. Kroning KE, Wang W. Designing a single protein‐chain reporter for opioid detection at cellular resolution. Angew Chem Int Ed. 2021;60:13358‐13365. [DOI] [PubMed] [Google Scholar]
- 124. Kroning KE, Li M, Petrescu DI, Wang W. A genetically encoded sensor with improved fluorescence intensity for opioid detection at cellular resolution. Chem Commun. 2021;57:10560‐10563. [DOI] [PubMed] [Google Scholar]
- 125. Kroning KE, Li M, Shen J, Fiel H, Nassar M, Wang W. A modular fluorescent sensor motif used to detect opioids, protein–protein interactions, and protease activity. ACS Chem Biol. 2022;17:2212‐2220. [DOI] [PMC free article] [PubMed] [Google Scholar]
- 126. Cabantous S, Nguyen HB, Pedelacq J‐D, et al. A new protein–protein interaction sensor based on tripartite split‐GFP association. Sci Rep. 2013;3:1‐9. [DOI] [PMC free article] [PubMed] [Google Scholar]
- 127. Zhang Q, Zheng YW, Coughlin SR, Shu X. A rapid fluorogenic GPCR–β‐arrestin interaction assay. Protein Sci. 2018;27:874‐879. [DOI] [PMC free article] [PubMed] [Google Scholar]