Abstract
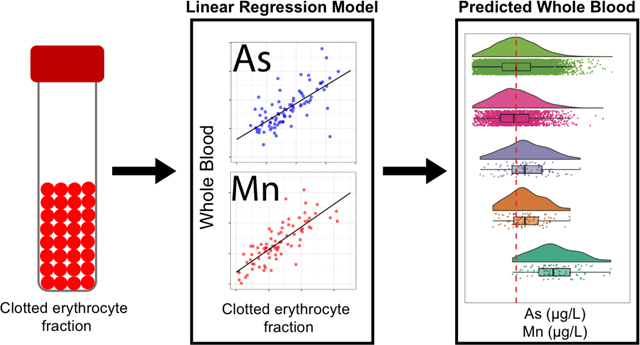
Exposure to arsenic (As) and manganese (Mn) from contaminated food, drinking water and dust are linked to a host of adverse health effects. The recent discovery of unmonitored community exposures to hazardous levels of metals, as seen in the Flint Water Crisis and East Chicago, have demonstrated a need for novel biomonitoring methods utilizing samples other than whole blood. Here, we present a method utilizing clotted erythrocyte fraction samples, a blood component commonly archived in biorepositories, to predict whole blood levels of As and Mn. This method would allow for innovative retrospective assessments of environmental exposures in previously unused samples. Whole blood and clotted erythrocyte fraction samples were simultaneously collected from 84 participants in the Airborne Exposure to Semivolatile Organic Pollutants (AESOP) cohort study of mother-child dyads in East Chicago. Clotted erythrocyte fraction samples were prepared by alkaline dilution and subsequently analyzed using inductively coupled plasma-mass spectrometry. A strong linear relationship was observed between whole blood and clotted erythrocyte fraction with Pearson correlation coefficients (r, p<0.001) of 0.74, and 0.82 for As and Mn, respectively. Modeled whole blood Mn levels predicted from clotted erythrocyte fractions evaluated at a test threshold representing the NHANES median of 9.7 μg/L, were found to have diagnostic sensitivity of 88% and specificity of 71%. Clotted erythrocyte partitioning of As was tested on a wide range of oral gavage doses using a rat model. Results from this investigation demonstrate clotted erythrocyte fraction samples are a viable alternative biological sample for retrospective public health surveillance of environmental exposure to As and Mn.
Keywords: Arsenic, Manganese, Clotted erythrocyte fraction, Red blood cell, Whole blood, Biomonitoring, Exposure assessment
Graphical Abstract
1. Introduction
Inorganic arsenic (As) exposure is associated with adverse respiratory, cardiovascular, neurological, and developmental effects1–3. Arsenic holds the top ranking on the current U.S. Agency for Toxic Substance and Disease Registry (ATSDR) substance priority list as well as being classified as a Group I carcinogen by the International Agency for Research on Cancer (IARC) and is associated with cancers of the skin, bladder and lungs and with compromised immunity against viral pathogens. There are a multitude of As exposure sources. The World Health Organization (WHO) estimates that 200 million people worldwide are exposed to As through drinking water at levels greater than the current 10 μg/L health-based standard4. Dietary exposures can occur via As-contaminated rice, fruits, and beverages5. This is a growing public health concern as there is a lack of regulatory oversight of As in food and in some cases dietary exposures can exceed drinking water exposures6, 7. Inhalation exposure to inorganic As from mining, smelting, and coal burning has also been epidemiologically linked to respiratory cancer8, 9.
Manganese (Mn) is a ubiquitous metal which is essential for the development and functioning of the central nervous system (CNS). The neurotoxicity of inhaled Mn has been well documented in occupational settings such as welding10, mining11, smelting12 and as a substitute for lead (Pb) in gasoline13. Acute exposure to high levels of Mn leads to Manganism, a Parkinson-like disorder first identified in 1837 14. Although Mn homeostasis is tightly regulated, adults, children, and infants in particular are vulnerable populations as mechanistic studies have shown that Mn can accumulate in the mitochondrion of neurons, astrocytes, oligodendrocytes disrupting ATP synthesis which can lead to irreversible effects15. Furthermore, several epidemiology studies have documented an association between low-level Mn exposure from drinking water and adverse impacts on children’s intellectual functions16. Drinking water is an important exposure pathway17 for both As and Mn, ultimately leading to co-exposures and increased risks of adverse health outcomes18, 19.
There are several biological samples used for monitoring environmental exposures to As and Mn. Whole blood20, 21, urine22, and toenail23 samples are the conventional samples utilized for As exposure assessment. Although use of urine samples is popular due to their less invasive collection process, they represent a smaller portion of total As body burden and can vary greatly with time and hydration status24. Whole blood As represents a more accurate and time-integrated measure of exposure. On the other hand, there is a lack of consensus on the best biomarker for Mn. While magnetic resonance imaging (MRI) is regarded as the gold standard for Mn exposure monitoring, its associated cost, accessibility, and complexity make it difficult to apply in large-scale population studies25. Consequently, whole blood and urine are the biological samples commonly utilized for public health surveillance of Mn. Similarly to As, urinary Mn levels represent a small fraction of the total body burden and some studies have found Mn levels in urine can fall below the analytical limit of detection (LOD)26. Several investigations into Mn in plasma/serum have revealed that despite being able to distinguish between exposed and unexposed groups, the relationship between plasma/serum concentrations and external exposure levels was weak27, 28.
Clotted erythrocyte fraction samples represent a significant compartment for metal uptake. As and Mn, like other metals, have similar physico-chemical properties to iron (Fe) and can compete with transmembrane transport processes of erythrocytes29, 30. Recently, clotted erythrocyte fraction samples have been getting more attention for application in large scale population studies for assessing Pb exposure31, inflammation32, oxidative stress33, and cancer34. However, information on using clotted erythrocyte fraction samples as a biomarker of environmental exposures, similarly to whole blood, is limited.
Here, we address this knowledge gap by presenting a simple and robust method for measuring concentrations of As and Mn in archived clotted erythrocyte fraction samples using inductively coupled plasma mass spectrometry (ICP-MS). Blood samples were collected from a cohort of mother-child dyads residing in East Chicago, Ind. under the Airborne Exposure to Semivolatile Organic Pollutants (AESOP) Study. Previous work by our group has documented significantly elevated Pb exposures in this community using both whole blood and archived clotted erythrocyte fraction samples31. East Chicago is an industrial hub with a history of numerous legacy and active sources of metals exposure. For instance, it was the site of lead-arsenate pesticide synthesis and storage, and contains the largest active steel production facility in North America. Samples were prepared using the National Health and Nutrition Examination Survey (NHANES)-approved alkaline dilution method35. Results from a comparison of whole blood and clotted erythrocyte fraction sample, as well as statistical and animal study-based validations are presented.
2. Materials and methods
2.1. Cohort sample collection, preservation, and storage
Samples were collected from participants of the AESOP Study which has been tracking mother-child dyads in East Chicago, Ind. and Columbus Junction, Iowa since 2008 to study exposures to persistent environmental pollutants. Mothers and children received detailed information about the study and gave written informed consent and assent before study entry. The study protocol was approved by the institutional review board (IRB) of the University of Iowa. Blood samples utilized for this study were collected in participants’ homes between April 2017 and March 2019. The demographics of AESOP Study participants contributing biospecimens for this analysis are shown in Table 1. Blood samples were collected using venipuncture into evacuated red top tubes with no preservatives (BD Vacutainer, Model No. 366430), and a tan top tubes coated with K2EDTA (BD Vacutainer, Model No. 367855) for whole blood. The tubes were placed on ice in a cooler and transported to our nearby field office. There, red top tubes were allowed to clot at room temperature for 30 min, then centrifuged at 3000 g for 10 min, followed by aliquoting of the serum, leaving behind the clotted erythrocyte fraction. Samples were then transported frozen on dry ice to the Human Toxicology and Exposomics Laboratory (HTEL) at the University of Iowa for storage in our biorepository at −86°C prior to analysis.
Table 1.
Demographics of the AESOP Study participants in East Chicago who provided blood for this study.
| Adult Women (Mothers) | ||||||
|
| ||||||
| 2017–2018 | 2018–2019 | |||||
|
|
||||||
| Characteristics | % | n | % | n | ||
|
| ||||||
| Total | - | 25 | - | 20 | ||
| Demographic | ||||||
| Mean Age, Years | 30–39 | 20 | 5 | 15 | 3 | |
| 40–49 | 48 | 12 | 50 | 10 | ||
| 50–59 | 32 | 8 | 35 | 7 | ||
| Race/Ethnicity | Hispanic | 75 | 18 | 75 | 15 | |
| Black | 17 | 4 | 15 | 3 | ||
| Non-Hispanic White | 8 | 2 | 10 | 2 | ||
| Education Level | 8th Grade or Less | 36 | 9 | 40 | 8 | |
| Some High School | 8 | 2 | 10 | 2 | ||
| High School Diploma/GED | 36 | 9 | 30 | 6 | ||
| Some College, No Degree | 16 | 4 | 15 | 3 | ||
| Two-Year Degree (AA/AS) | 4 | 1 | 5 | 1 | ||
| Average Yearly Income | Less than $19,999 | 44 | 11 | 50 | 10 | |
| Greater Than $19,999 | 56 | 14 | 50 | 10 | ||
|
| ||||||
| Children (at Enrollment) | ||||||
|
| ||||||
| 2017–2018 | 2018–2019 | |||||
|
|
||||||
| Characteristics (male/female) | % | n | % | n | ||
|
| ||||||
| Total | - | 26 (11/15) | - | 20 (6/14) | ||
| Demographic | ||||||
| Mean Age, Years | Under 18 | 31 | 8 (8/0) | 25 | 5 (5/0) | |
| 18–20 | 12 | 3 (2/1) | 10 | 2 (0/2) | ||
| 21+ | 57 | 15 (1/14) | 65 | 13 (12/1) | ||
| Race/Ethnicity | Hispanic | 73 | 19 (8/11) | 75 | 15 (4/11) | |
| Black | 19 | 5 (2/3) | 15 | 3 (2/1) | ||
| Non-Hispanic White | 8 | 2 (1/1) | 10 | 2 (1/1) | ||
2.2. Animals and Exposure
All animal protocols were approved by University of Iowa’s Institutional Animal Care and Use Committee (Protocol # 0071097). Animals were housed in a temperature and humidity-controlled room (21°C, 55% relative humidity) with a 12 h light/dark cycle and provided with food and water ad libitum. Adult female Sprague–Dawley rats, 10 weeks old (Envigo, Inc., Indianapolis, IN) were selected as our animal model. Four rats weighing 344 ± 25 g were exposed to sodium arsenite via oral gavage (1.5 mL) with each animal administered one dose (0.01, 0.1, 1.0, or 10.0 mg/kg). Retro-orbital blood samples were collected from each rat prior to As exposure to assess baseline levels. Sodium arsenite solutions used for oral gavage were prepared using drinking water collected from the vivarium. All animals were euthanized using isoflurane 24 h after exposure. Whole blood was collected by cardiac puncture using K2EDTA coated tubes and tubes without preservative and processed as described above to yield clotted erythrocyte and serum fractions.
2.3. Reagents and standards
All vials and containers used in this study were acid washed in 10% HCl solution overnight, rinsed with deionized water and left to dry in a Class II biosafety cabinet. All reagents were of trace metal grade or better. Concentrated HNO3 and HCl were purchased from Fisher Scientific. Deionized water (resistivity ≥ 18.2 MΩ*cm) was dispensed from our water purification system (GenPure Pro UV-TOC/UF, Thermo Scientific). Alkaline diluent solution was comprised of 0.4% (v/v) tetramethyl ammonium hydroxide (TMAH, Alfa Aesar), 1% (v/v) ethanol (Sigma-Aldrich), 0.01%(w/v) ammonium pyrrolidine dithiocarbamate (APDC, Alfa Aesar), 0.05% (v/v) Triton X-100™ (Sigma-Aldrich). Reagent grade sodium arsenite (purity ≥90%) was purchased from Sigma Aldrich (St. Louis, MO). National Institute of Standards and Technology (NIST) traceable single and multielement stock solutions were used for preparing internal standards, and calibration standard solutions were purchased from Inorganic Ventures (Christiansburg, VA).
2.4. Alkaline dilution
Whole blood and clotted erythrocyte fraction samples were prepared by alkaline dilution using a method17 developed by the Division of Laboratory Sciences at the Centers for Disease Control and Prevention (Method No. DLS- 3040.1–01). Briefly, 100 μL aliquot of either whole blood or clotted erythrocyte fraction was diluted 50-fold in a solution of 0.4% (v/v) TMAH, 1% (v/v) ethanol, 0.01% (w/v) APDC, 0.05% (v/v) Triton X-100™, with 5 μg/L of 103rhodium, 130tellerium, and 193iridium as internal standards. A pooled whole blood sample was utilized for creating matrix matched calibration standards. The homogeneity of the variance among aliquots of the pooled sample was assessed using Levene’s test (P-value > 0.05 indicated no statistically significant difference among aliquots). Note that the units represent different sample volumes. Meaning, respective samples are represented as μg of As/Mn in 1 liter of whole blood or μg of As/Mn in 1 liter of clotted erythrocyte fraction. As such, concentrations in clotted erythrocyte fraction samples are higher than whole blood.
2.5. ICP-MS Quality Assurance and Quality Control
Samples were analyzed with ICP-MS (Agilent 7900) using helium gas in collision cell mode to remove isobaric interferences such as 40Ar35Cl for As, 37Cl18O for Mn which in a single quadrupole mass spectrometer can lead to overestimation and affect sensitivity. Our laboratory is enrolled in the Lead and Multielement Proficiency Program (LAMP), a lab standardization program run by the Centers for Disease Control and Prevention (CDC)36. Each quarter, we blindly analyze a provided set of bovine blood samples and report results. The CDC then provides an assessment of the precision of participating laboratories’ measurements of Pb, cadmium, mercury, selenium, and Mn benchmarked against their standard value. Blood samples certified for As, under the Quebec Multielement External Quality Assessment Scheme (QMEQAS) were purchased from the Centre de Toxicologie du Québec (Quebec, Canada). QMEQAS samples were included in every sample batch run. Percent recoveries ranged from 85 to 90% and 94 to 129% for As and Mn, respectively. Limit of detection (LOD) calculated as 10 times the standard deviation of blanks was found to be 0.02 and 0.04 μg/L for As and Mn, respectively. Performance data on LAMP analyses and QMEQAS are provided in the supplementary materials (Table S1).
2.6. Statistical analysis
R-studio equipped with the ggplot2, “nhanesa” packages was utilized for statistical analyses. The Shapiro-Wilk (p≥0.05) test demonstrated that log-transformed elemental concentrations did not differ from a normal distribution. Linear regression modeling was used to assess relationships between whole blood measurements and clotted erythrocyte fraction samples. Pearson correlation coefficients of log-transformed data were calculated to assess goodness of fit of the linear model. Bland-Altman plots served to assess method differences. Diagnostic sensitivity and specificity were tested as a function of various blood level thresholds and using Receiver Operating Characteristics (ROC) analysis37. Raincloud plots were used as a data visualization technique for dataset comparisons38.
3. Results
3.1. Exposomic characteristics of AESOP Study cohort
In total, whole blood and clotted erythrocyte fraction samples from 84 subjects consisting of mother-child dyads were analyzed for this study with a combined sample size of 168. The children were enrolled in middle school and followed to adulthood. Demographic data of the AESOP Study participants who provided blood for this study are presented in Table 1. Whole blood As and Mn concentrations ranged from 0.17 to 1.73 μg/L and 5.34 to 26.19 μg/L, respectively. Clotted erythrocyte fraction concentrations of As and Mn ranged from 0.17 to 2.10 μg/L and 9.27 to 41.73 μg/L, respectively. A breakdown of whole blood As and Mn levels among AESOP Study participants stratified by mother, male and female children in East Chicago is presented in Table 2. A sex difference was observed in our cohort, in which female participants, both mother and child, were found to have significantly higher whole blood and clotted erythrocyte fraction Mn levels than males participants (p<0.05).
Table 2.
Breakdown of concentrations of arsenic, and manganese in whole blood of AESOP Study participants in East Chicago. NHANES data from 2017 to 2018 was filtered to match the demographic characteristics of AESOP subject types. Statistically significant differences were observed between NHANES and AESOP (2 years combined) mothers, all children, and female children. NHANES data for As was not available.
| Adult Women (Mothers) | ||||
|
| ||||
| 2017–2018 | 2018–2019 | NHANES 2017–2018 | ||
|
| ||||
| Measurement | ||||
|
| ||||
| Blood Arsenic (μg/L) | Mean ± SD | 0.53 ± 0.29 | 0.45 ± 0.21 | |
| Median | 0.42 | 0.31 | ||
| Geo Mean | 0.48 | 0.41 | ||
| IQR | 0.21 | 0.20 | ||
| Blood Manganese (μg/L) | Mean ± SD | 12.16 ± 3.43 | 12.37 ± 3.65 | 10.66 ± 3.90 ** |
| Median | 11.19 | 12.21 | 10.03 | |
| Geo Mean | 11.69 | 11.84 | 10.03 | |
| IQR | 5.12 | 5.91 | 4.65 | |
| Children | ||||
|
| ||||
| 2017–2018 | 2017–2018 | NHANES 2017–2018 | ||
|
| ||||
| Measurement (male/female) | ||||
|
| ||||
| Blood Arsenic (μg/L) | 0.53 ± 0.34 | 0.34 ± 0.214 | ||
| Mean ± SD | (0.53 ± 0.27 / 0.52 ± 0.39) | (0.23 ± 0.09 / 0.35 ± 0.16) | ||
| Median | 0.43 (0.45 / 0.38) | 0.30 (0.31 / 0.30) | ||
| Geo Mean | 0.45 (0.48 / 0.44) | 0.32 (0.32 / 0.32) | ||
| IQR | 0.33 (0.37 / 0.30) | 0.20 (0.11 / 0.20) | ||
| Blood Manganese (μg/L) | 12.37 ± 5.22 | 11.60 ± 3.57 | 10.33 ± 3.63 * | |
| Mean ± SD | (9.57 ± 2.98 / 14.42 ± 5.62) | (10.35 ± 3.33 / 12.13 ± 3.66) | ( 9.28 ± 2.84 / 11.33 ± 4.01*) | |
| Median | 11.02 (9.79 / 11.92) | 11.10 (11.36 / 10.98) | 10.33 (8.75 / 10.49) | |
| Geo Mean | 11.47 (9.16 / 13.53) | 11.07 (9.86 / 11.63) | 9.79 (8.89 / 10.72 ) | |
| IQR | 5.04 (3.71 / 7.05) | 5.91 (3.58 / 6.66) | 4.12 (3.33 / 4.82) | |
Two sample t test
p < 0.05
p < 0.01
3.3. Measured and modeled As and Mn in clotted erythrocyte fraction and whole blood in the AESOP Study
A scatterplot displaying the relationship between the concentration measured in whole blood against clotted erythrocyte fraction is displayed in Figure 1a for As and Figure 1b for Mn. The linear regression of whole blood and clotted erythrocyte fraction is displayed as a solid line. A strong linear relationship between whole blood and clotted erythrocyte fraction is observed for both As and Mn and confirmed with statistically significant slopes (β1) and correlation coefficients. The models were adjusted for age and gender but were not found to be confounding. Results from these adjustments are included in supplementary materials (Figure S1–S2).
Figure 1.
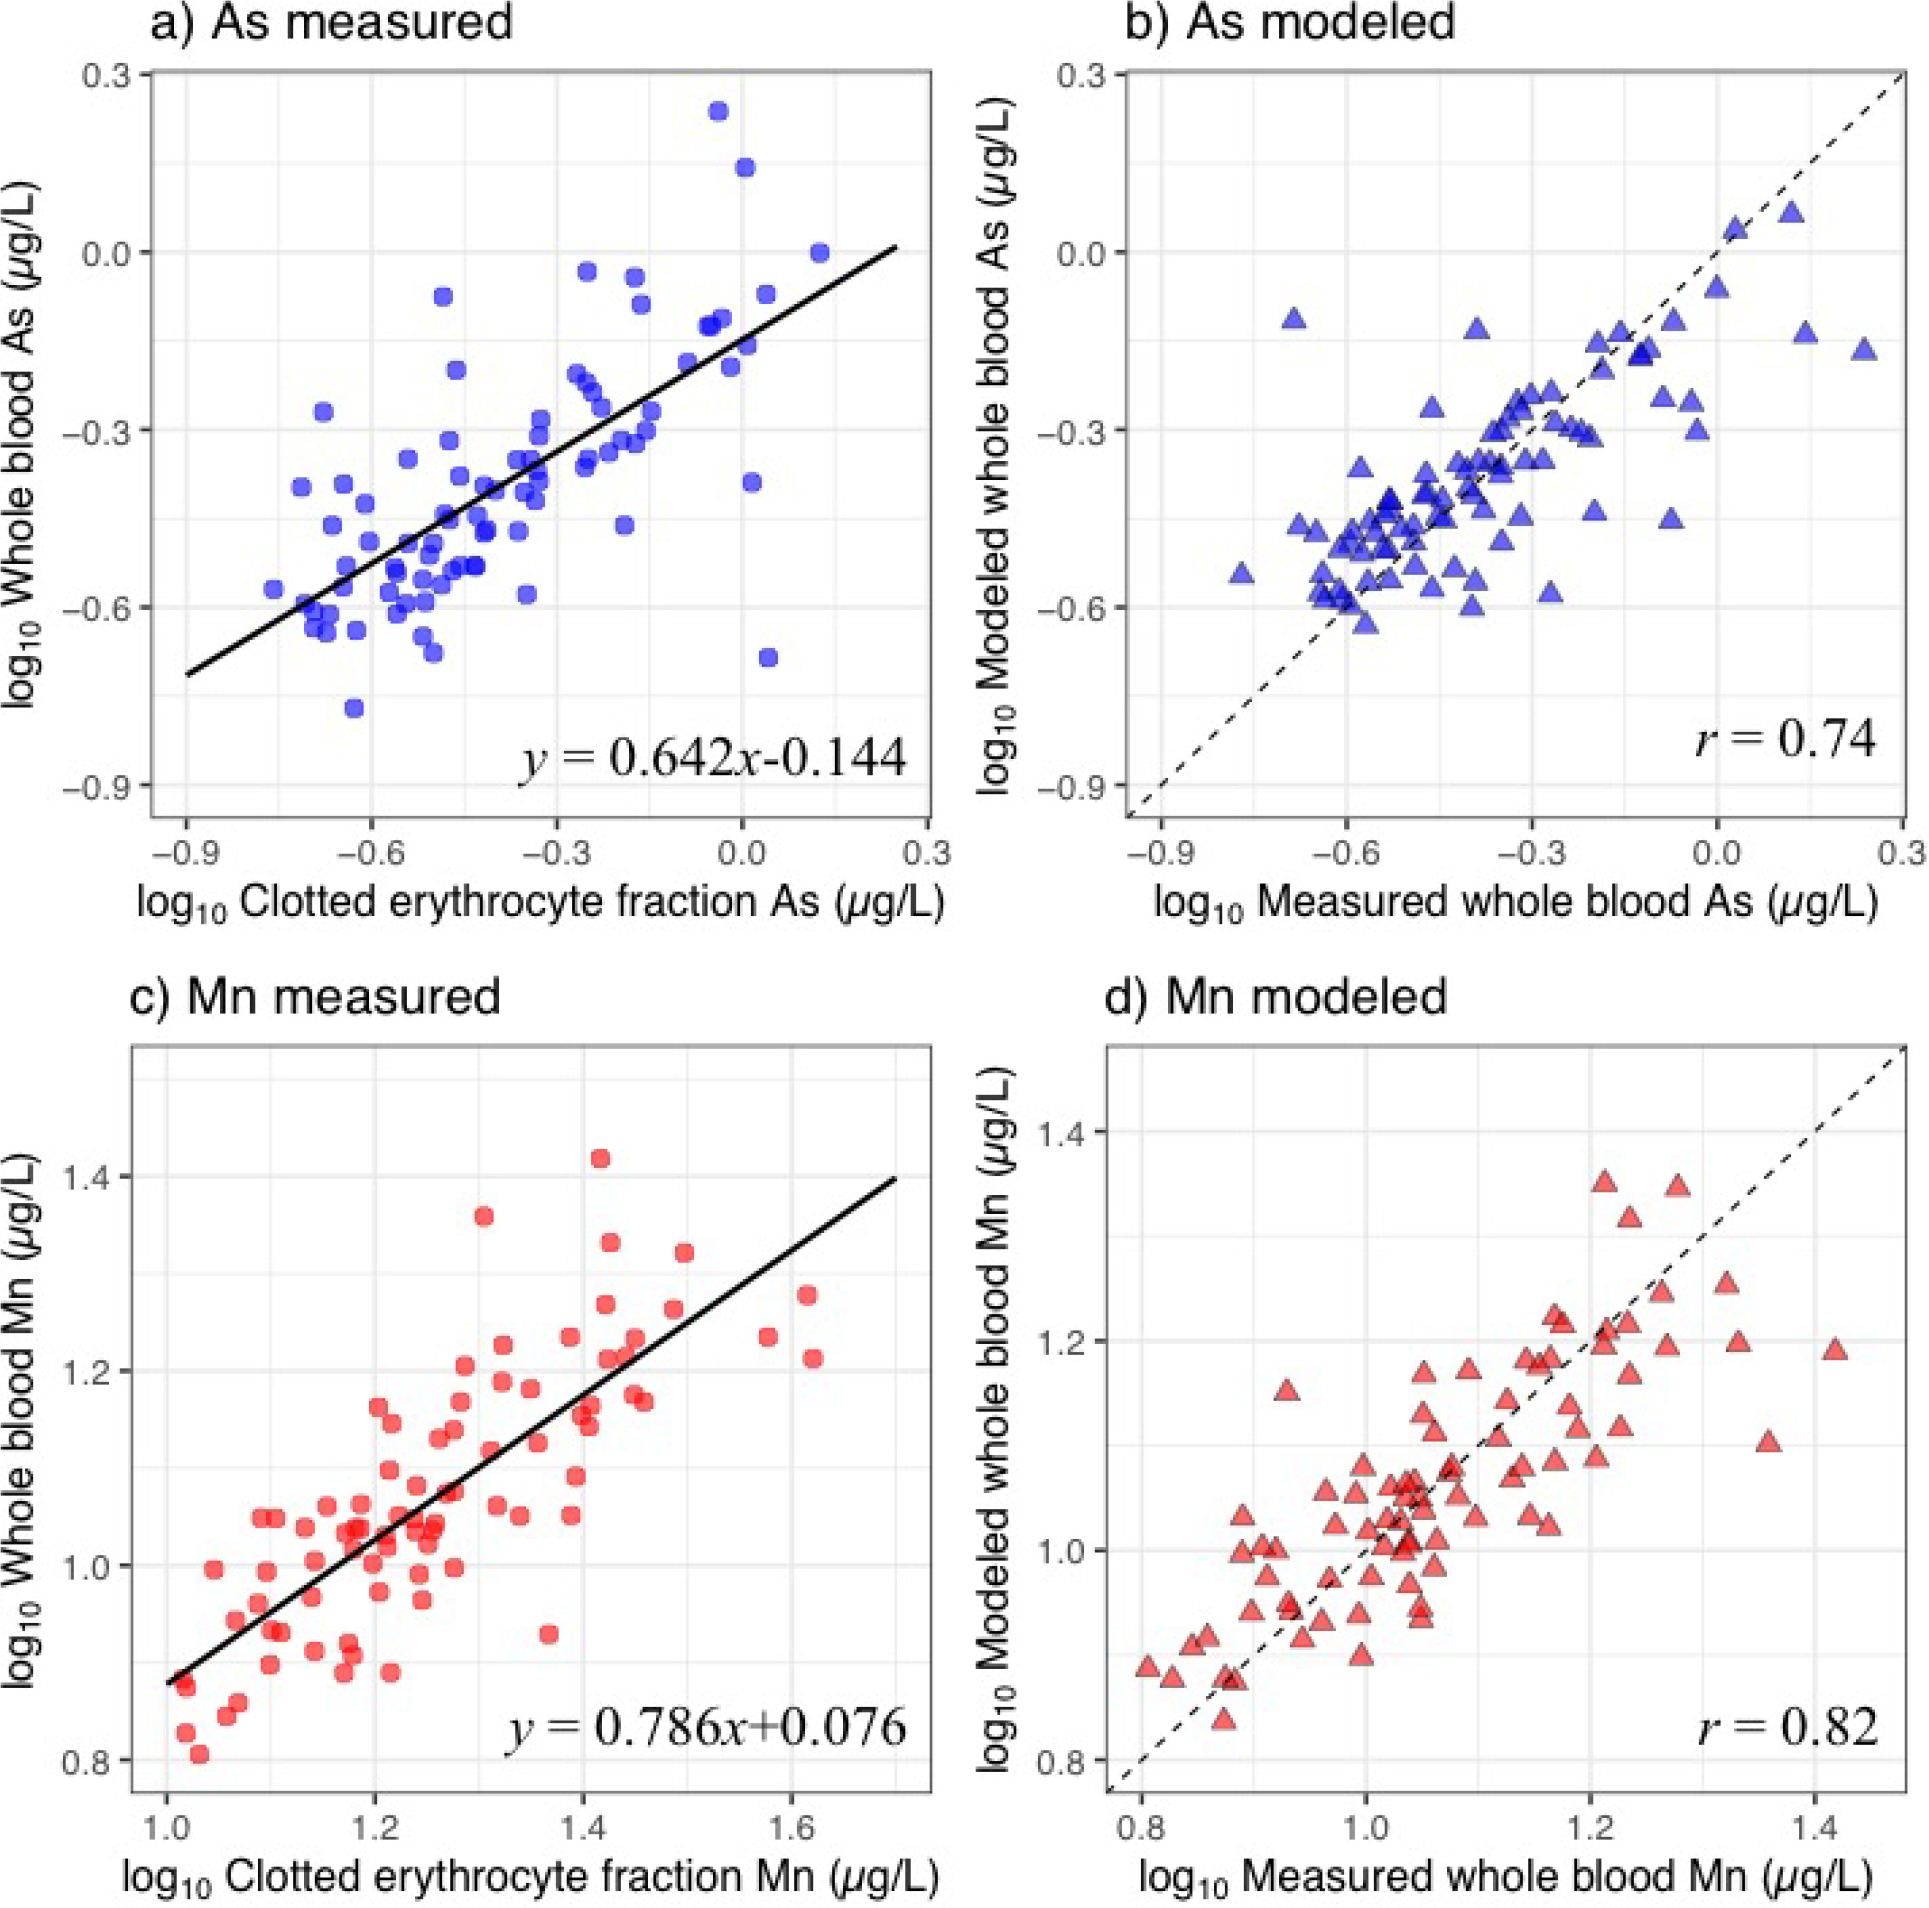
Plots of concentrations of arsenic (As) (a) and manganese (Mn) (c) measured in clotted erythrocyte fraction against whole blood overlaid with the linear regression line. Plots of concentrations of As (b) and Mn (d) measured in whole blood against modeled whole blood predicted from clotted erythrocyte fraction. Dashed line represents line of identity.
Values for β0 and β1 are shown in Figure 1a and 1c. The results from the linear regression model were used to predict values of whole blood using clotted erythrocyte fraction values as shown in Figure 1b for As and Figures 1d for Mn using Equation 1. Pearson correlation coefficients of measured whole blood against clotted erythrocyte fraction predicted whole blood levels were 0.74 and 0.82 for As and Mn, respectively.
| Equation 1: |
3.2. Clotted erythrocyte fraction partitioning of As in an animal model
Although a strong linear relationship between whole blood and clotted erythrocyte fraction for As was observed, the range of concentrations observed in our cohort was not particularly high. This is most likely a reflection of limited environmental exposures to As in our AESOP Study cohort in East Chicago. Whole blood measures of As were much higher in a prospective cohort study in Bangladesh21, where subjects were exposed to As-contaminated groundwater and had whole blood levels of As up to 100 μg/L. To confirm that As partitions to clotted erythrocyte fraction we conducted a small study in Sprague-Dawley rats. Each rat was exposed to a single dose of sodium arsenite via oral gavage (0.01, 0.1,1.0 or 10.0 mg/kg body weight). The first two doses were selected to represent exposures typical of those through diet and drinking water, respectively39. Whole blood As levels ranged from 15 to 95 mg/L, while corresponding clotted erythrocyte fraction levels ranged from 17 to 123 mg/L and were found to be strongly correlated (r=0.96), Figure 2. As concentrations measured in serum were much lower (28 to 246 μg/L) and were not correlated to whole blood As dose (r=0.60), Figure S3.
Figure 2.
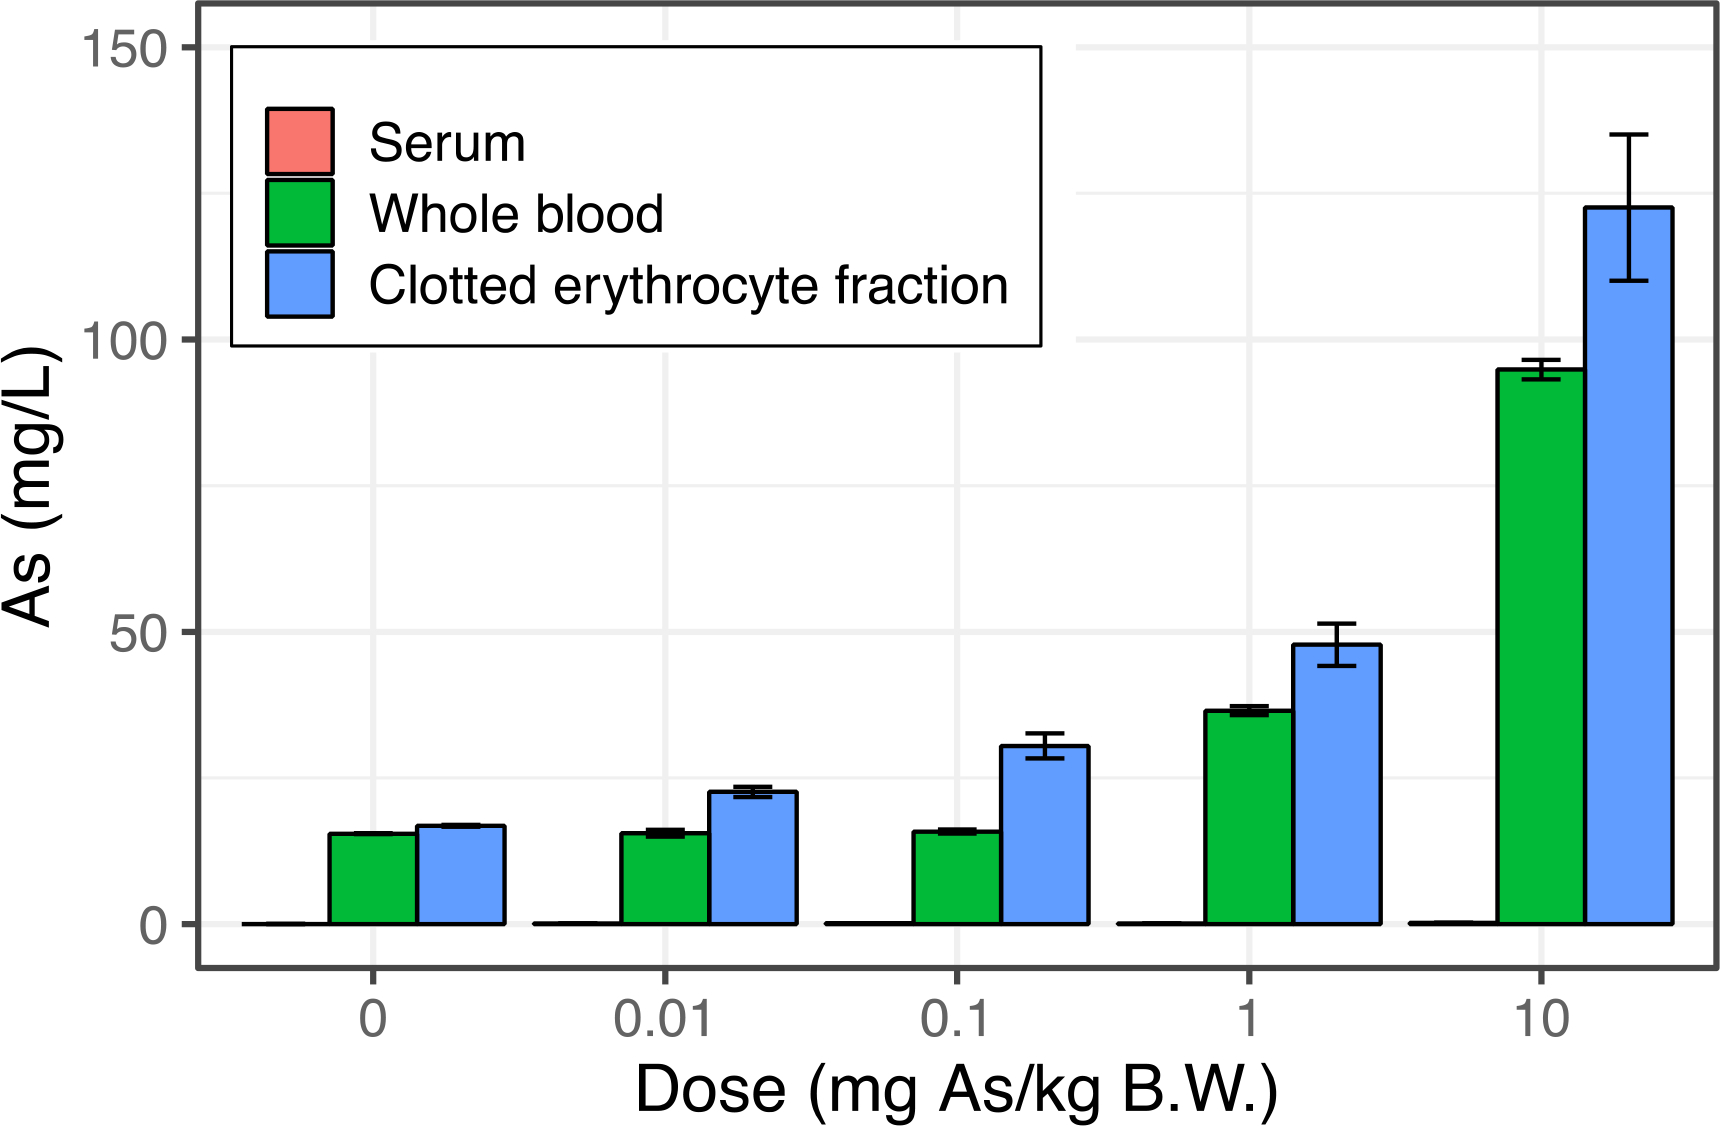
Concentrations of arsenic measured in serum, whole blood, and clotted erythrocyte fraction of Sprague Dawley rats at varying doses of sodium arsenite exposure by oral gavage. Concentrations of arsenic in serum were found to be orders of magnitude lower (~200 μg/L) compared to whole blood and clotted erythrocyte fraction suggesting the overwhelming majority of arsenic in whole blood is partitioned to erythrocytes. Error bars represent ±1 SD of triplicate analytical measurements.
3.5. Bland-Altman Analysis of Cohort Sample Data
In addition to evaluating the correlations between blood sample types, we also evaluated the differences by modifying the Bland-Altman (Figure S4) approach for assessing agreement between two clinical methods18. Rather than plotting the individual points which can make it difficult to visualize overall trends in the data, we plotted the distribution of the method difference between measured and modeled blood levels as a probability density function (Figure 3). The mean method difference between whole blood and clotted erythrocyte fraction is 0.03 ± 0.39 and 0.21 ± 5.14 μg/L for As and Mn, respectively. Dashed lines delineate errors calculated as 1.96*σ. The method differences were observed to be normally distributed.
Figure 3.
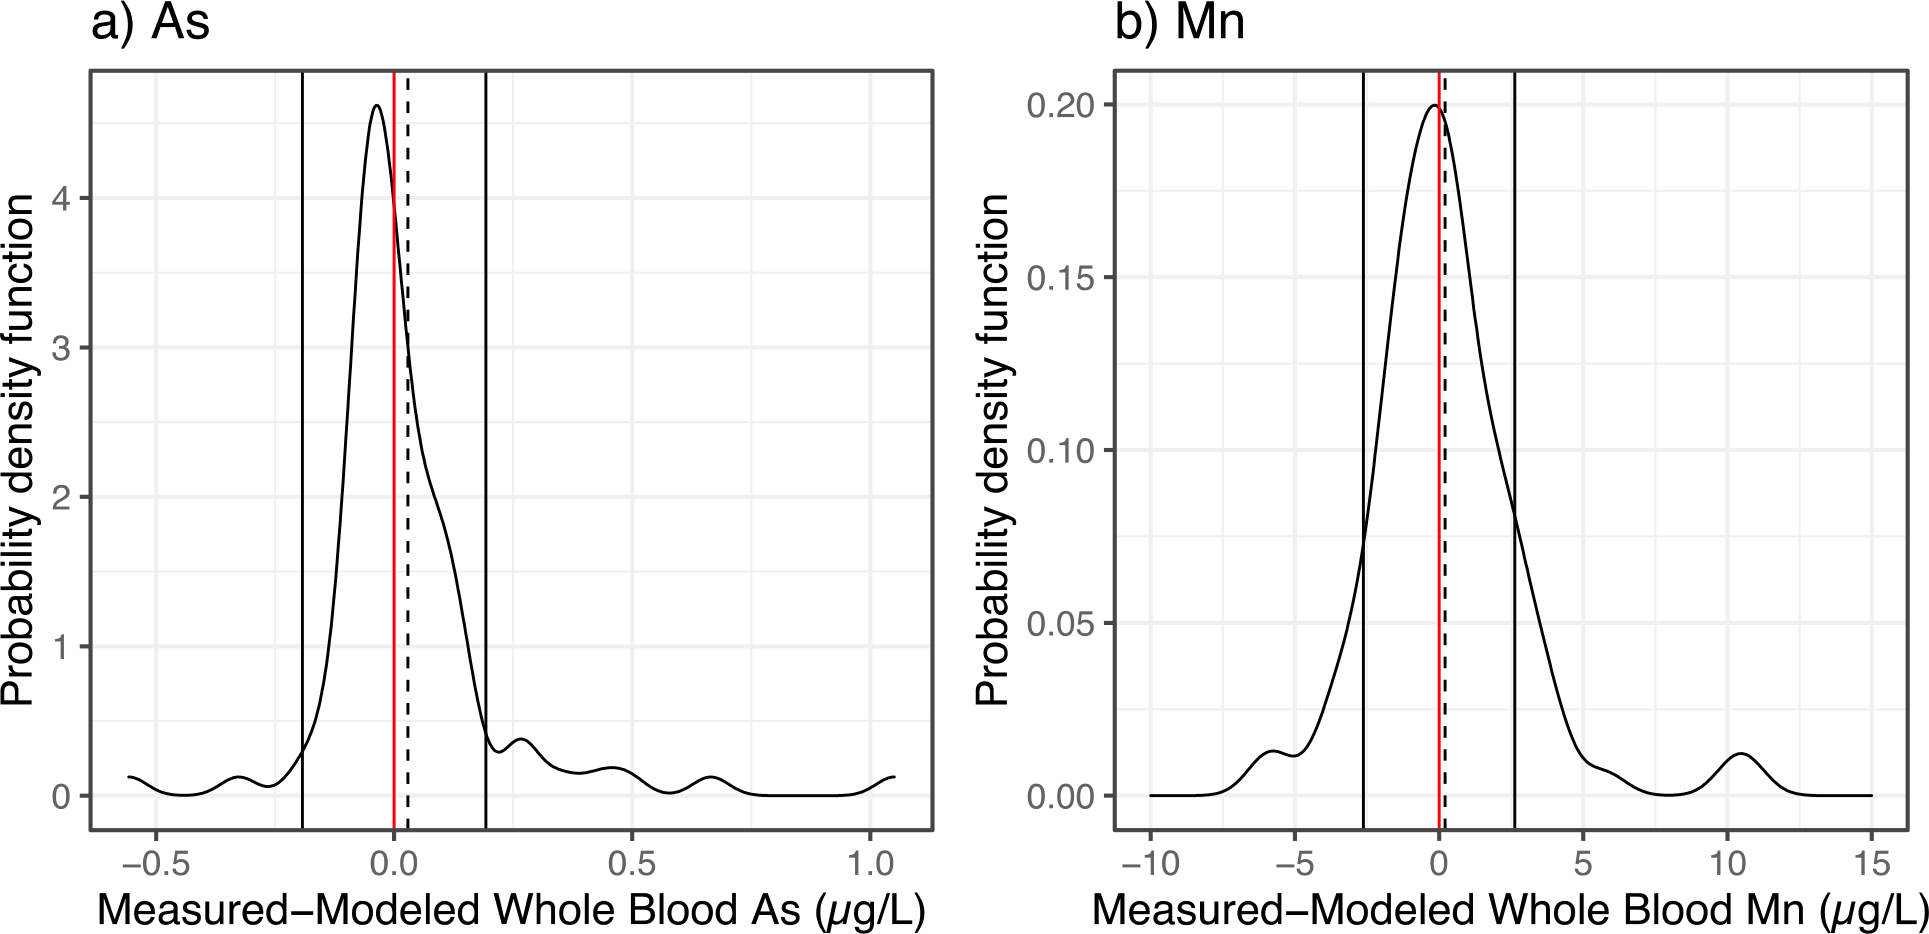
Modified visual representation of the Bland-Altman analysis showing the distribution of the differences between the measured and modeled whole blood levels for As (a), and Mn (b) predicted using clotted erythrocyte fraction samples. The solid vertical lines represent the 95% confidence interval and dashed lines represent the mean method difference. Red line represents a value of 0 for the difference between measured and modeled value.
3.6. Diagnostic Sensitivity and Specificity
Whole blood biomarkers of exposure are utilized for identifying subjects with elevated levels in clinical settings. For instance, blood Pb levels are compared to screening levels from the CDC at a reference value of 5 μg/dL40 to identify children who may be receiving unsafe exposures. However, such consensus reference values do not exist for As and Mn. As such, we evaluated the robustness of our method using multiple cutoff values, namely, quartiles of measured whole blood concentrations for the full range dataset for As and Mn. A powerful technique for assessing the diagnostic sensitivity and specificity of clinical tests and models is the receiver operating characteristic (ROC) plot41, 42.
Whole blood concentrations at quartiles 1, 2, and 3 were designated as the cutoff values for testing diagnostic sensitivity and specificity of the clotted erythrocyte fraction method with measured whole blood levels as designated as the “gold standard” comparison. Quartile based cutoff values tested for As were 0.29, 0.40, 0.54 μg/L, and for Mn were 9.2, 11.2, 14.6 μg/L. The area under the curve (AUC) from the ROC plot is used to gauge the overall performance of the model. An AUC value of 1 represents perfect classification. Thus, the closer the AUC value is to 1 the better. The AUC for As at quartile 1, 2, and 3 cutoffs were 0.84, 0.86, and 0.90, respectively (Figure 4). For Mn, the AUC at quartile 1, 2, and 3 cutoffs were 0.91, 0.91, and 0.96, respectively. These AUC values suggest that whole blood levels predicted from clotted erythrocyte fraction from our linear regression model can sufficiently discriminate between potential clinical and public health-based cutoffs for both As and Mn. Further details from the ROC analysis results can be found in supplementary materials (Table S2)
Figure 4.
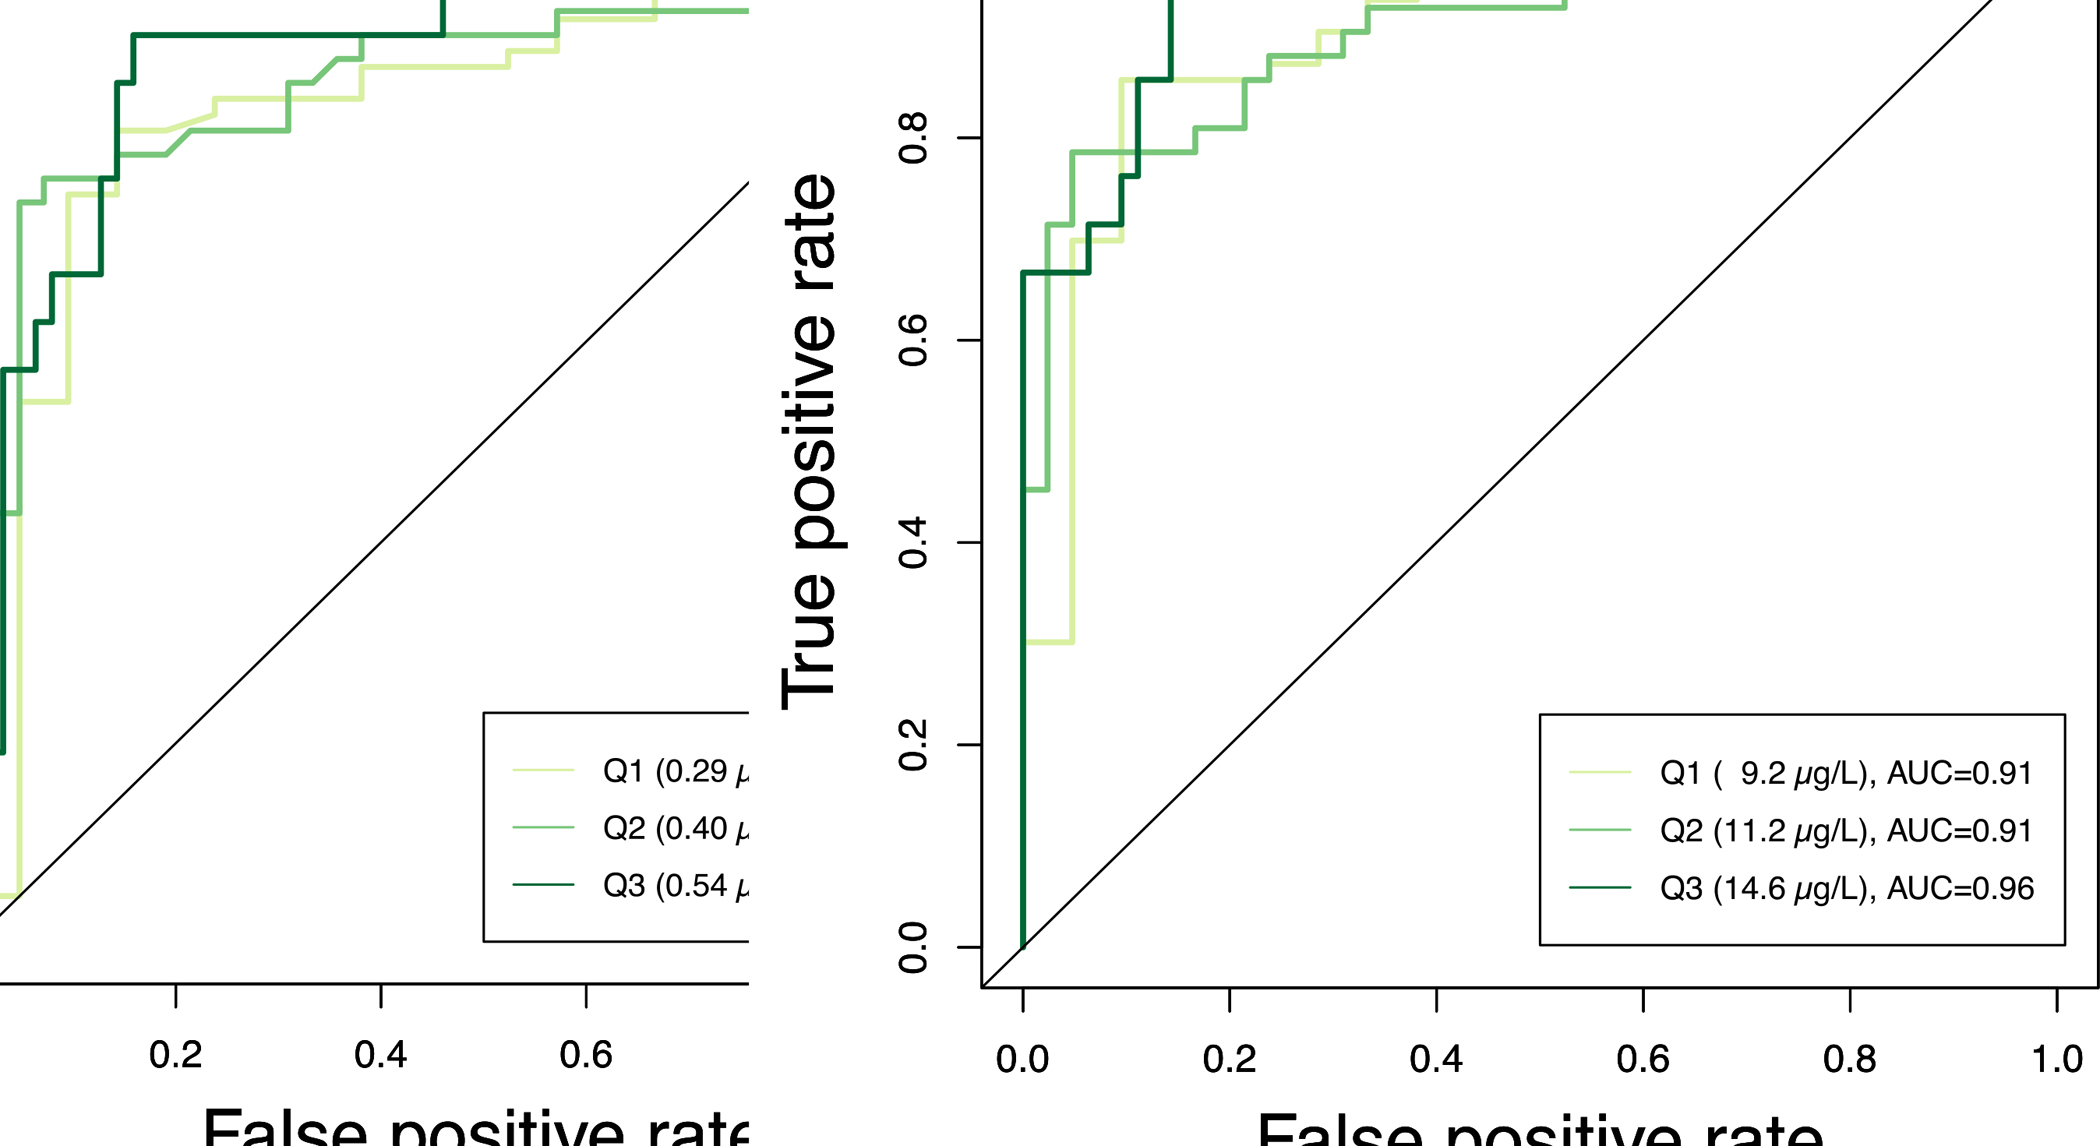
Receiver operating characteristic (ROC) analysis of true positive rate (sensitivity) and false positive rate (1-specificity) clotted erythrocyte fraction predicted whole blood levels for a) As, and b) Mn. The whole blood measurements were designated as the “gold standard” for binary classifications of cutoff values at quartiles (Q) 1, 2, and 3. Area under the curve (AUC) is provided as a measure of overall model performance. The identity line is plotted as a comparison to represent rates of binary classification occurring by chance.
The National Health and Nutrition Examination Survey (NHANES) collects data on numerous biomarkers within the US population. Under this initiative, whole blood Mn has also been measured. We evaluated the most current version of this dataset available from 2017 to 2018 to determine descriptive statistics of whole blood Mn levels in the US population (n=7,513). The levels ranged from 1.6 to 52 μg/L with a median and geometric mean (GM) of 9.7 μg/L, and arithmetic mean of 10.3 μg/L. Similar levels were observed after extracting the entire NHANES dataset to reflect demographic characteristics of our AESOP Study cohort (Figure 5 and 6). We tested the diagnostic sensitivity and specificity of our model to predict whole blood Mn from clotted erythrocyte fraction to test its performance at classifying subjects as being above or below the national median level. We determined our model performance was satisfactory with scores of 88% diagnostic sensitivity and 71% diagnostic specificity (Table 3).
Figure 5.
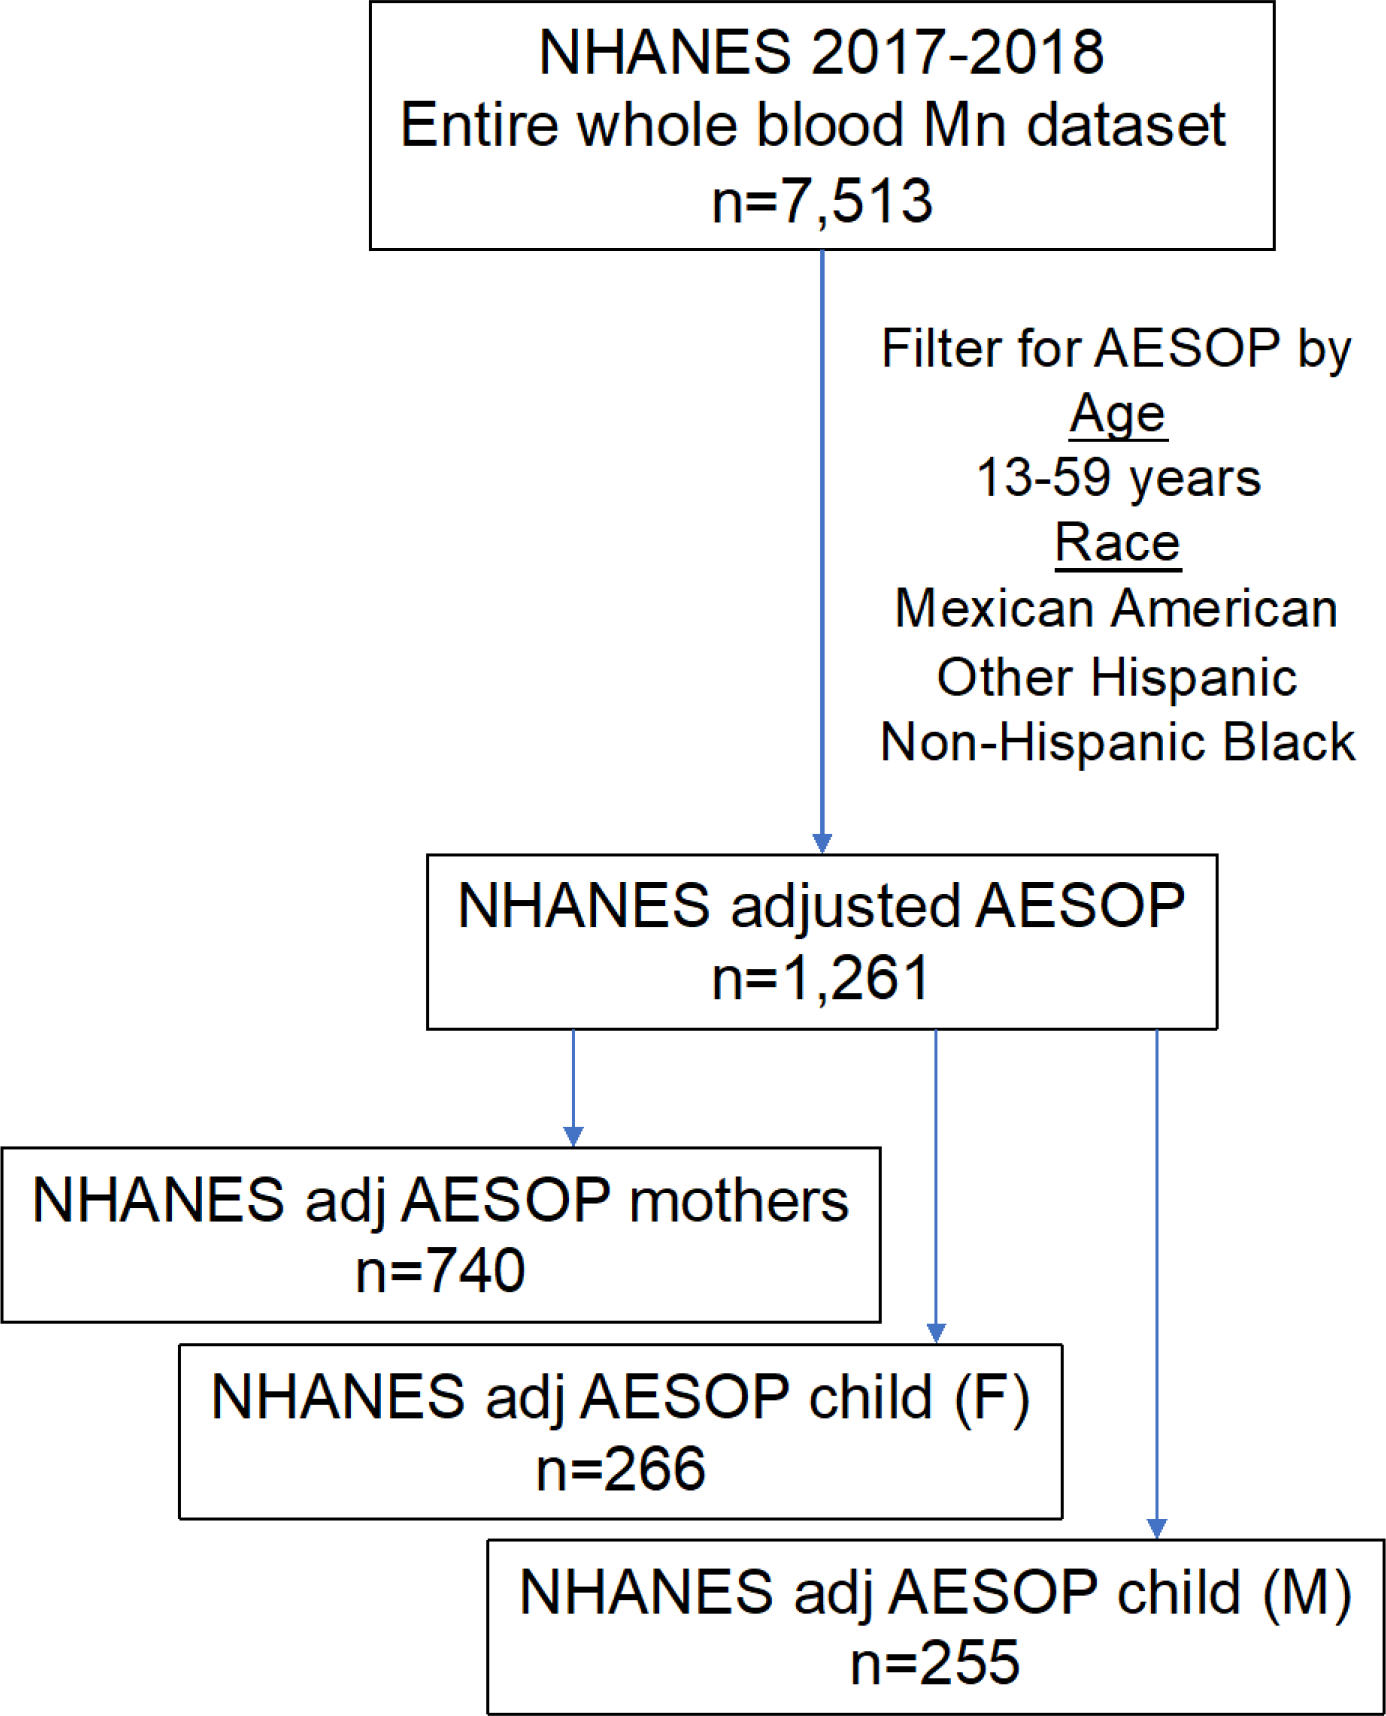
Schematic diagram displaying breakdown of NHANES whole blood manganese dataset adjusted by AESOP Study cohort demographic characteristics including age and race.
Figure 6.
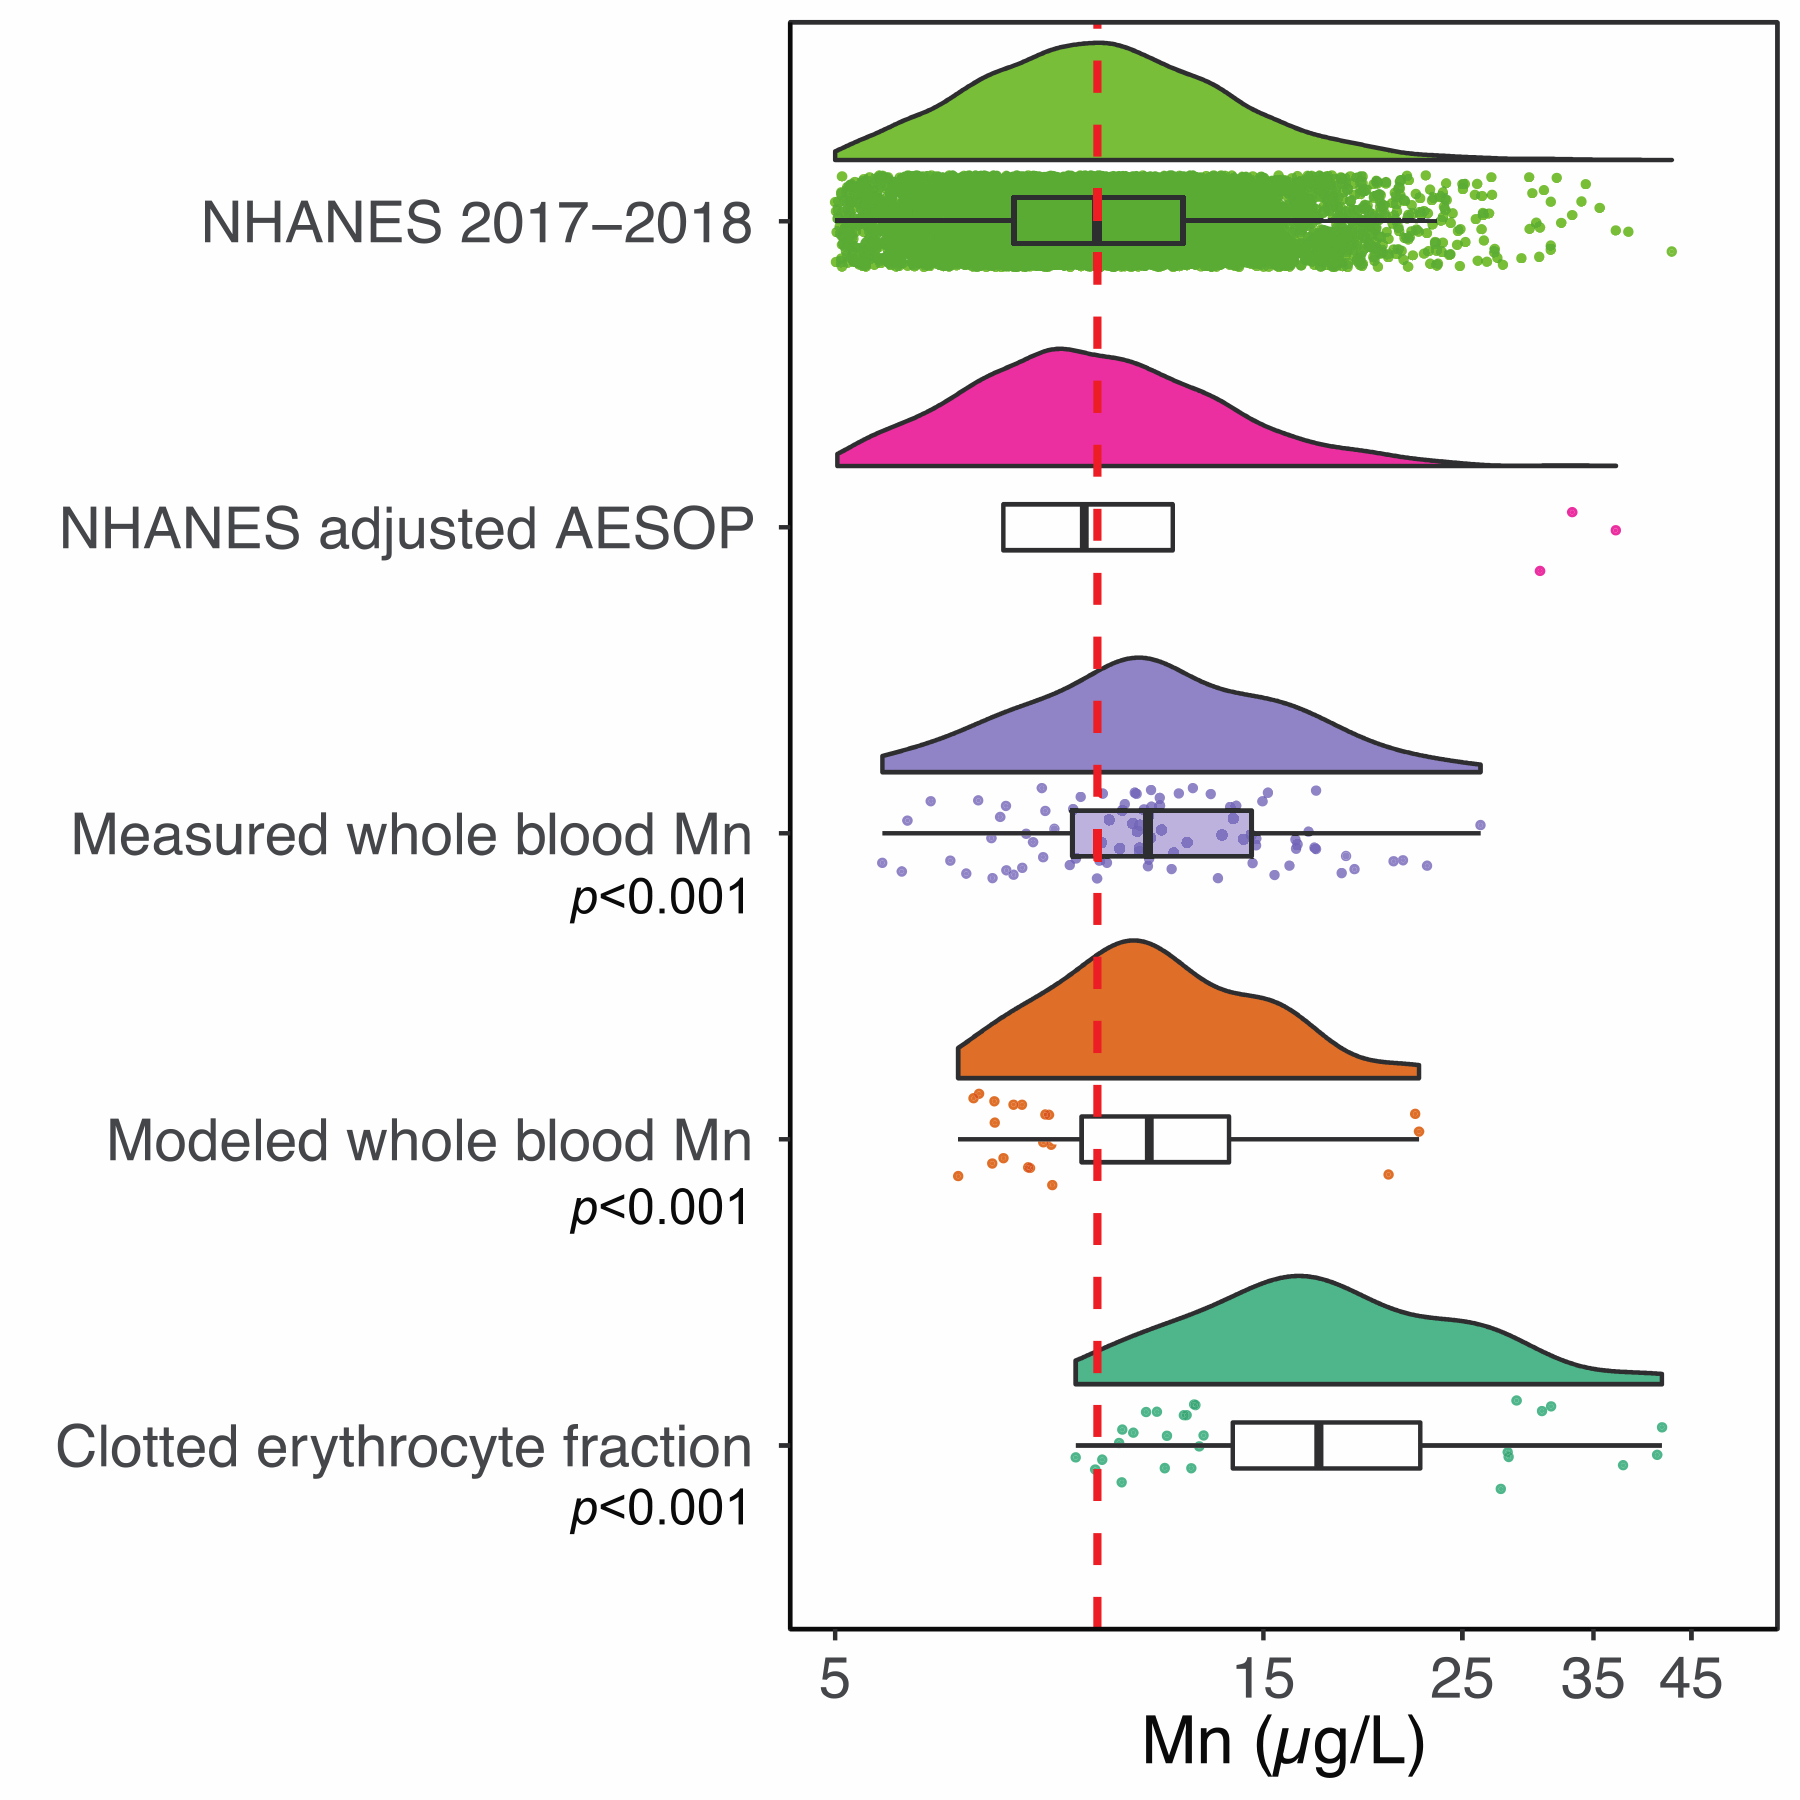
Raincloud plots displaying the distribution of blood manganese levels from NHANES dataset, as well as the AESOP dataset stratified by clotted erythrocyte fraction, measured and modeled whole blood. One sample t-test p-values comparing against the NHANES media and geometric mean value of 9.7 μg/L (red dashed line) are displayed.
Table 3.
Diagnostic sensitivity (D-SN) and specificity (D-SP) of blood Mn tested at a cutoff value of 9.7 μg/L corresponding to the median blood Mn value from the US population based on NHANES data from 2017 to 2018. Whole blood values modeled using clotted erythrocyte fraction were tested against measured whole blood Mn designated as the gold standard for comparison.
| Measured |
D-SN | D-SP | |||
|---|---|---|---|---|---|
| Test result | ≥ 9.7 μg/L | < 9.7 μg/L | |||
|
|
|||||
| Modeled | ≥ 9.7 μg/L | 53 | 7 | 88% | 71% |
| < 9.7 μg/L | 7 | 17 | |||
4. Discussion
The results presented in this paper provide a validated method, which allows one to use archived clotted erythrocyte fraction samples for retrospective and prospective assessment of As and Mn exposures in a similar manner to whole blood. A clear need for this type of assessment is evidenced by the recent environmental calamities of unmonitored exposures as seen recently in Paris, Flint, and East Chicago. These incidents highlight that environmental exposures to metals remain a major public health issue and having additional sample types for assessing exposures is appealing. This is the case in East Chicago where in 2016 it was discovered that a public housing development and an elementary school were built on the site of a former lead smelting operation (USS Lead Superfund Site)43. Previous work by our group has documented significantly elevated blood Pb levels using whole blood, and also identified previously unmonitored elevated Pb exposures in this cohort by retrospective assessments using archived clotted erythrocyte fraction samples31.
In addition to Pb, there are concerns in this largely disenfranchised community about exposures to other toxic metals such as As and Mn, both of which have a history of legacy and active sources in this urban area. For example, East Chicago was the site of a lead-arsenate pesticide synthesis and storage facility and the site of the largest active steel production facility in North America. Numerous studies have shown a strong association between ferroalloy production and elevated environmental exposures to Mn44, 45. Our group has documented extensive soil Pb contamination in this community and have determined a common chemical species in soils and dust is Pb bound to Mn oxide minerals46. Thus, assessing exposures to As and Mn, in addition to Pb, has significant public health ramifications for this community with special focus on children.
To assess the magnitude of As exposures in the AESOP Study, we compared the levels in our cohort to those of other epidemiology studies47–55 (Figure 7a). The studies in this comparison have overall cohort estimates that range from 0.69 to 10 μg/L. The higher exposure groups are from cohorts in Bangladesh consisting of subjects who are exposed to high levels of As through consumption of contaminated groundwater56. In this comparison, our AESOP cohort ranked lowest with levels similar to those observed from recent national scale surveys conducted in Canada53, Serbia54, and Mexico City52. Day et al. evaluated blood As levels from 120 healthy subjects from the US Midwest geographical region and established 2.7 μg/L based on the 95th percentile value as a reference value for identifying elevated levels57. All blood As levels for our AESOP Study cohort were below this reference value with our maximum being 1.7 μg/L. These findings suggest that residents of East Chicago are likely not overexposed to environmental As.
Figure 7.
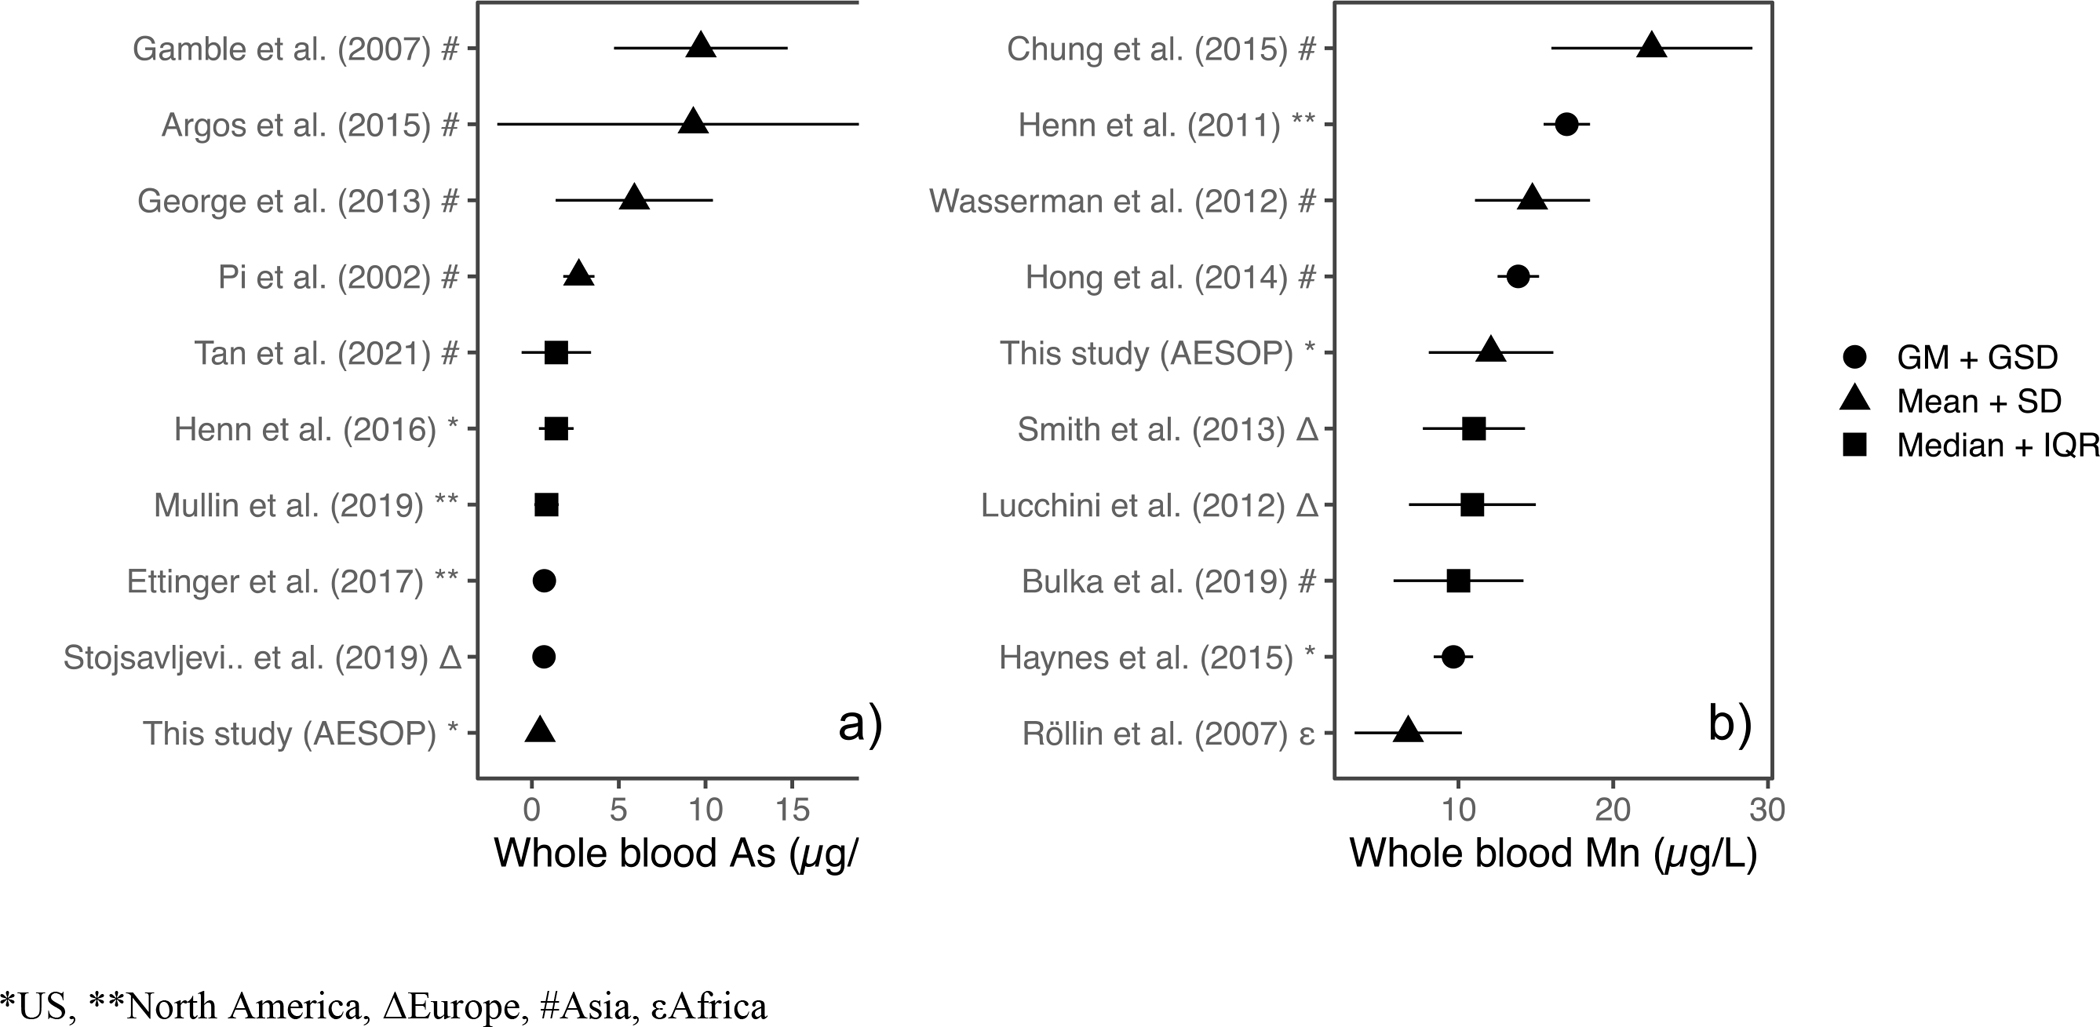
Modified Forest Plot displaying point estimates of geometric mean (GM), mean, median, and their corresponding margins of error as indicated for various studies in the literature for a) As and b) Mn. Studies are ranked based on magnitude of point estimate.
Similar comparisons were conducted for whole blood Mn using NHANES data as well as literature reviewed values. Raincloud plots displayed in Figure 6 show the distribution of Mn levels from NHANES dataset, NHANES adjusted by AESOP, AESOP dataset consisting of clotted erythrocyte fraction, measured and modeled whole blood concentrations. One sample t-tests were utilized to test for differences between AESOP measures of Mn and NHANES geometric mean and median concentration of 9.7 μg/L. In addition to the clotted erythrocyte fraction, both the measured and modeled whole blood Mn concentrations describing the AESOP cohort were found to be statistically elevated when compared to the NHANES GM value. A statistically significant difference was not observed between the entire NHANES dataset (n=7,513) and NHANES extracted by AESOP (n=1,261). This suggests that the elevated blood Mn levels in our East Chicago cohort are not a result of demographic characteristics such as age, and race but rather unique, regional environmental exposures.
In addition to NHANES data, a literature review of pertinent epidemiological studies (Figure 7b) on Mn exposures was conducted18, 58–65. The studies in this comparison have overall cohort estimates of whole blood Mn that range from 6.8 to 22.5 μg/L. The cohort studies with higher blood Mn such as those of Chung et al.58 and Henn et al.59 were focused on pregnant women while Wasserman et al.18 focused on subjects drinking groundwater with elevated levels of As and Mn. Overall estimates of blood Mn levels in our AESOP cohort were found to be elevated, falling in the upper half of the studies included in this comparison. Furthermore, we investigated the possibility of Mn exposures in this community resulting from the active steel production facility by assessing the relationship between whole blood Mn levels and distance from the resident’s home to the steel plant (Figure S5). A weak correlation was observed between blood Mn and distance from steel plant (r = −0.19). It was noted that the neighborhoods of Northside and Southside had a wide range of values whereas Indiana Harbor and Roxana were less variable.
Statistically significant (p<0.05) sex differences were observed using both measured and modeled whole blood Mn levels (Figure 8), highlighting the application of our clotted erythrocyte fraction model to population-based studies. The sex difference in blood Mn levels observed in our study have been previously reported66, 67. Studies cited above suggest higher blood Mn levels among females reflect sex-specific metabolic differences in regulating Mn homeostasis.
Figure 8.
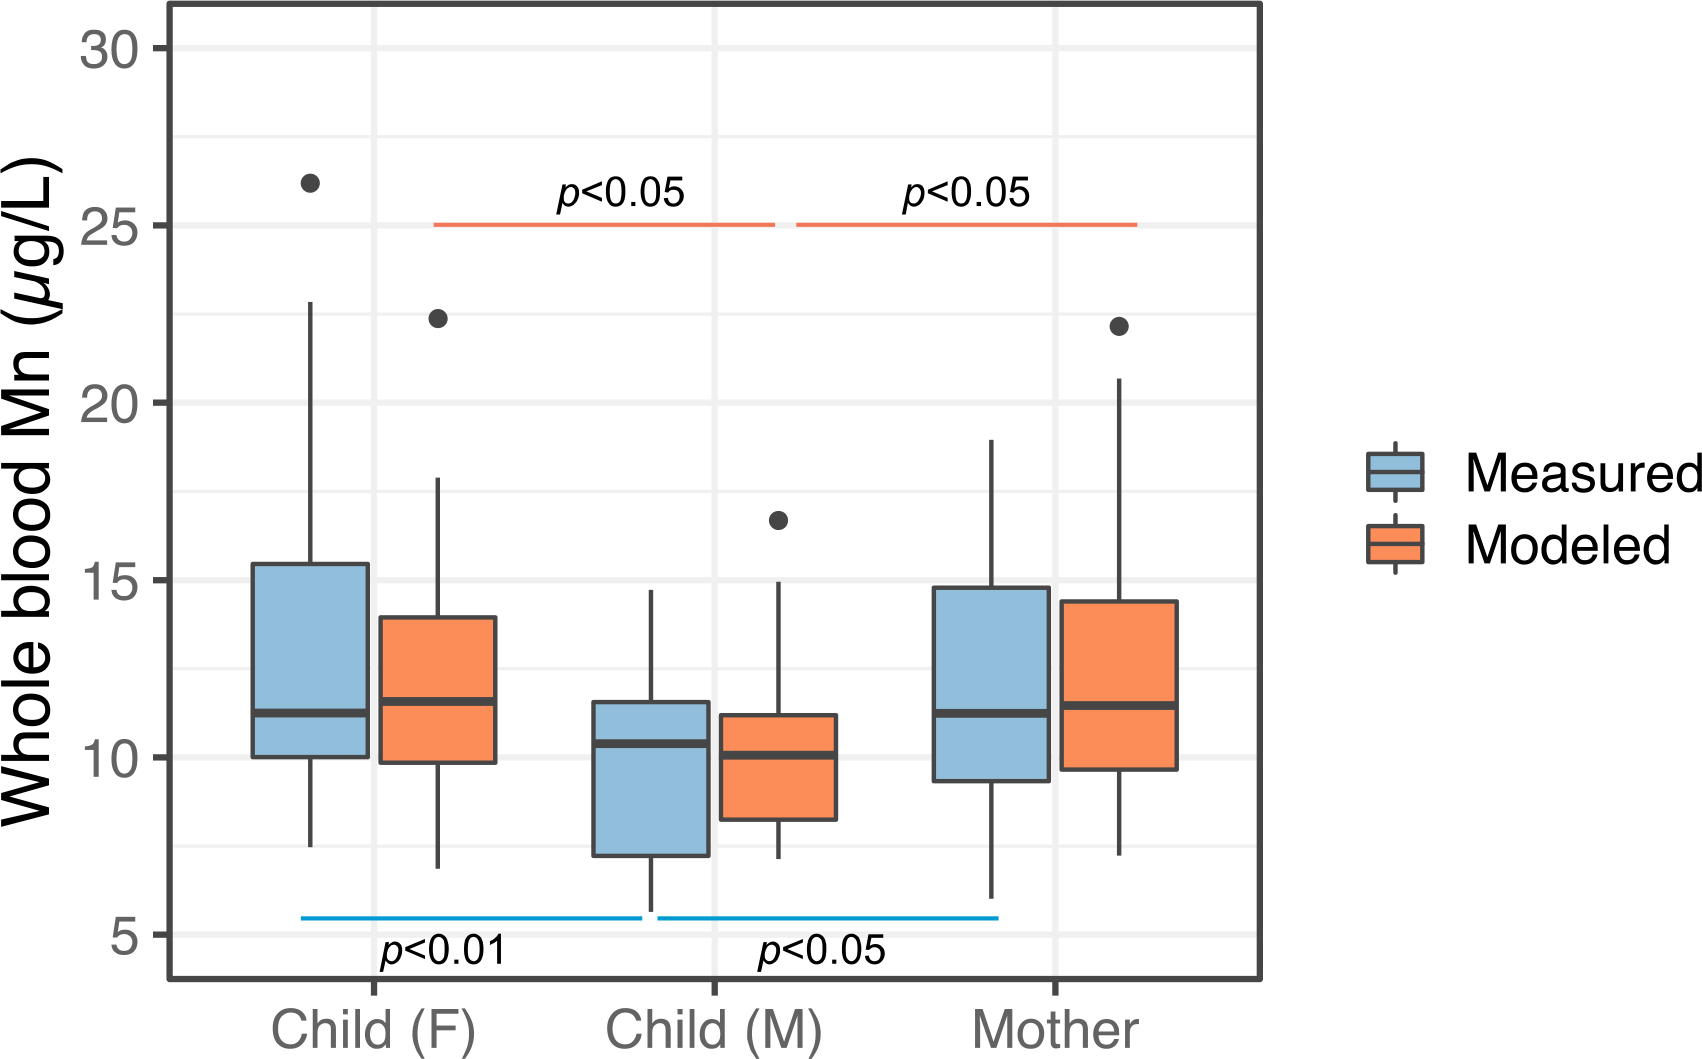
Boxplot comparisons of measured and modeled whole blood Mn concentrations classified by subject type, Child (Female), Child (Male), and Mothers. Statistically significant sex differences were observed with males overall having lower both whole blood and clotted erythrocyte fraction Mn concentrations.
Although the gold standard sample for As and Mn is debated, our work highlights the feasibility of utilizing clottefd erythrocyte fraction samples for assessing envrionmental exposures in a similar fashion to whole blood. Furthermore, the research question being pursued would determine the choice of sample to be used. For instance, if a future study is interested in evaluating very recent exposures occurring on the scale of days, then urine samples may be more suitable. For capturing longer windows of exposure, whole blood and thus clotted erythrocyte fraction samples would be a better choice as this reflects exposure time periods of around four months, the typical lifespan of erythrocytes68.
Since this method measures total As and Mn and is not aimed at measuring speciation or chemical structures, close attention and tight rigor do not have to be applied to the length of time the samples have been stored. Alkaline dilution ensures solubilization of metals in the sample.
There are several limitations to this study which suggest opportunities for further improvement. We did not measure hematocrit which is often used as an indicator to assess the fraction of a whole blood sample that is comprised of clotted erythrocyte fraction and serum. This is an important refinement as studies24 have reported relative variation of up to 15% resulting from seasonal variability and hydration. This variability in proportion of clotted erythrocyte fraction may help explain a portion of the scatter observed between whole blood and clotted erythrocyte measurements. As can be seen from the raincloud plots shown in Figure 6, the distribution of modeled whole blood, Mn is shifted to the right compared to the measured whole blood values. We attribute this result of log transformation of the data and the subsequent back transformation after applying the linear regression model which tends to stretch and squeeze values at the lower and upper ends69. However, this overestimation is not a major limitation as it is still protective of public health.
5. Conclusion
To our knowledge, this is the first study to demonstrate clotted erythrocyte measurement of As, and Mn as predictors of exposure comparable to whole blood. The results from this study highlight that clotted erythrocyte fraction samples can be utilized to predict As, and Mn exposure in a similar manner to whole blood. We attribute this to the high affinity of As, and Mn towards iron, primarily in the form of hemoglobin. Efforts are underway to apply this method to retrospectively assess unmonitored environmental exposure to As and Mn in East Chicago.
Supplementary Material
Highlights.
As and Mn were strongly correlated between whole blood and clotted erythrocyte fraction.
Whole blood As and Mn levels were predicted using clotted erythrocyte fraction.
Whole blood Mn levels among mother-child dyads in East Chicago were elevated compared to NHANES.
Whole blood As levels among mother-child dyads in East Chicago were similar to national levels.
Clotted erythrocyte fraction is a viable alternative for retrospective surveillance of toxic metals exposure.
Acknowledgements
We would like to acknowledge our field staff Barbara Mendenhall, and Nancy Morales for home visits and blood collection. We would also like to thank Dr. Brian Wels and Dr. Drew Latta for ICP-MS related technical assistance. Funding for the AESOP Study is from the Iowa Superfund Research Program, grant NIH P42ES013661. The metals analysis described in this report was funded by the Environmental Health Sciences Research Center, grant NIH P30ES005605.
Footnotes
Declaration of competing interest
The authors declare that they have no known competing financial interests.
References
- 1.Argos M; Ahsan H; Graziano JH, Arsenic and human health: epidemiologic progress and public health implications. Reviews on environmental health 2012, 27, (4), 191–195. [DOI] [PMC free article] [PubMed] [Google Scholar]
- 2.Smith AH; Steinmaus CM, Health effects of arsenic and chromium in drinking water: recent human findings. Annual review of public health 2009, 30, 107–122. [DOI] [PMC free article] [PubMed] [Google Scholar]
- 3.Naujokas MF; Anderson B; Ahsan H; Aposhian HV; Graziano JH; Thompson C; Suk WA, The broad scope of health effects from chronic arsenic exposure: update on a worldwide public health problem. Environmental health perspectives 2013, 121, (3), 295–302. [DOI] [PMC free article] [PubMed] [Google Scholar]
- 4.George CM; Sima L; Arias M; Mihalic J; Cabrera LZ; Danz D; Checkley W; Gilman RH, Arsenic exposure in drinking water: an unrecognized health threat in Peru. Bulletin of the World Health Organization 2014, 92, 565–572. [DOI] [PMC free article] [PubMed] [Google Scholar]
- 5.Davis MA; Signes-Pastor AJ; Argos M; Slaughter F; Pendergrast C; Punshon T; Gossai A; Ahsan H; Karagas MR, Assessment of human dietary exposure to arsenic through rice. Science of the Total Environment 2017, 586, 1237–1244. [DOI] [PMC free article] [PubMed] [Google Scholar]
- 6.Nachman KE; Ginsberg GL; Miller MD; Murray CJ; Nigra AE; Pendergrast CB, Mitigating dietary arsenic exposure: current status in the United States and recommendations for an improved path forward. Science of the Total Environment 2017, 581, 221–236. [DOI] [PMC free article] [PubMed] [Google Scholar]
- 7.Meharg AA; Rahman MM, Arsenic contamination of Bangladesh paddy field soils: implications for rice contribution to arsenic consumption. Environmental science & technology 2003, 37, (2), 229–234. [DOI] [PubMed] [Google Scholar]
- 8.Martin R; Dowling K; Pearce D; Sillitoe J; Florentine S, Health effects associated with inhalation of airborne arsenic arising from mining operations. Geosciences 2014, 4, (3), 128–175. [Google Scholar]
- 9.Lubin JH; Moore LE; Fraumeni JF Jr; Cantor KP, Respiratory cancer and inhaled inorganic arsenic in copper smelters workers: a linear relationship with cumulative exposure that increases with concentration. Environmental Health Perspectives 2008, 116, (12), 1661–1665. [DOI] [PMC free article] [PubMed] [Google Scholar]
- 10.Flynn MR; Susi P, Neurological risks associated with manganese exposure from welding operations–a literature review. International journal of hygiene and environmental health 2009, 212, (5), 459–469. [DOI] [PubMed] [Google Scholar]
- 11.Riojas-Rodríguez H; Solís-Vivanco R; Schilmann A; Montes S; Rodríguez S; Ríos C; Rodríguez-Agudelo Y, Intellectual function in Mexican children living in a mining area and environmentally exposed to manganese. Environmental health perspectives 2010, 118, (10), 1465–1470. [DOI] [PMC free article] [PubMed] [Google Scholar]
- 12.Jiang Y; Zheng W; Long L; Zhao W; Li X; Mo X; Lu J; Fu X; Li W; Liu S, Brain magnetic resonance imaging and manganese concentrations in red blood cells of smelting workers: search for biomarkers of manganese exposure. Neurotoxicology 2007, 28, (1), 126–135. [DOI] [PMC free article] [PubMed] [Google Scholar]
- 13.Boudia N; Halley R; Kennedy G; Lambert J; Gareau L; Zayed J, Manganese concentrations in the air of the Montreal (Canada) subway in relation to surface automobile traffic density. Science of the total environment 2006, 366, (1), 143–147. [DOI] [PubMed] [Google Scholar]
- 14.Calne D; Chu N; Huang C; Lu C; Olanow W, Manganism and idiopathic parkinsonism: similarities and differences. Neurology 1994, 44, (9), 1583–1586. [DOI] [PubMed] [Google Scholar]
- 15.Neal AP; Guilarte TR, Mechanisms of lead and manganese neurotoxicity. Toxicology research 2013, 2, (2), 99–114. [DOI] [PMC free article] [PubMed] [Google Scholar]
- 16.Wasserman GA; Liu X; Parvez F; Ahsan H; Levy D; Factor-Litvak P; Kline J; van Geen A; Slavkovich V; LoIacono NJ, Water manganese exposure and children’s intellectual function in Araihazar, Bangladesh. Environmental health perspectives 2006, 114, (1), 124–129. [DOI] [PMC free article] [PubMed] [Google Scholar]
- 17.Buschmann J; Berg M; Stengel C; Sampson ML, Arsenic and manganese contamination of drinking water resources in Cambodia: coincidence of risk areas with low relief topography. Environmental science & technology 2007, 41, (7), 2146–2152. [DOI] [PubMed] [Google Scholar]
- 18.Wasserman GA; Liu X; Parvez F; Factor-Litvak P; Ahsan H; Levy D; Kline J; van Geen A; Mey J; Slavkovich V, Arsenic and manganese exposure and children’s intellectual function. Neurotoxicology 2011, 32, (4), 450–457. [DOI] [PMC free article] [PubMed] [Google Scholar]
- 19.Wasserman GA; Liu X; Parvez F; Factor-Litvak P; Kline J; Siddique AB; Shahriar H; Uddin MN; van Geen A; Mey JL, Child intelligence and reductions in water arsenic and manganese: a two-year follow-up study in Bangladesh. Environmental health perspectives 2016, 124, (7), 1114–1120. [DOI] [PMC free article] [PubMed] [Google Scholar]
- 20.Wu M-M; Chiou H-Y; Wang T-W; Hsueh Y-M; Wang I-H; Chen C-J; Lee T-C, Association of blood arsenic levels with increased reactive oxidants and decreased antioxidant capacity in a human population of northeastern Taiwan. Environmental Health Perspectives 2001, 109, (10), 1011–1017. [DOI] [PMC free article] [PubMed] [Google Scholar]
- 21.Hall M; Chen Y; Ahsan H; Slavkovich V; Van Geen A; Parvez F; Graziano J, Blood arsenic as a biomarker of arsenic exposure: results from a prospective study. Toxicology 2006, 225, (2–3), 225–233. [DOI] [PubMed] [Google Scholar]
- 22.Ahsan H; Perrin M; Rahman A; Parvez F; Stute M; Zheng Y; Milton AH; Brandt-Rauf P; Van Geen A; Graziano J, Associations between drinking water and urinary arsenic levels and skin lesions in Bangladesh. Journal of Occupational and Environmental Medicine 2000, 42, (12), 1195–1201. [DOI] [PubMed] [Google Scholar]
- 23.Beane Freeman LE; Dennis LK; Lynch CF; Thorne PS; Just CL, Toenail arsenic content and cutaneous melanoma in Iowa. American Journal of Epidemiology 2004, 160, (7), 679–687. [DOI] [PubMed] [Google Scholar]
- 24.Marchiset-Ferlay N; Savanovitch C; Sauvant-Rochat M-P, What is the best biomarker to assess arsenic exposure via drinking water? Environment international 2012, 39, (1), 150–171. [DOI] [PubMed] [Google Scholar]
- 25.Dydak U; Jiang Y-M; Long L-L; Zhu H; Chen J; Li W-M; Edden RA; Hu S; Fu X; Long Z, In vivo measurement of brain GABA concentrations by magnetic resonance spectroscopy in smelters occupationally exposed to manganese. Environmental health perspectives 2011, 119, (2), 219–224. [DOI] [PMC free article] [PubMed] [Google Scholar]
- 26.Baker MG; Simpson CD; Sheppard L; Stover B; Morton J; Cocker J; Seixas N, Variance components of short-term biomarkers of manganese exposure in an inception cohort of welding trainees. Journal of Trace Elements in Medicine and Biology 2015, 29, 123–129. [DOI] [PMC free article] [PubMed] [Google Scholar]
- 27.Smith D; Gwiazda R; Bowler R; Roels H; Park R; Taicher C; Lucchini R, Biomarkers of Mn exposure in humans. American journal of industrial medicine 2007, 50, (11), 801–811. [DOI] [PubMed] [Google Scholar]
- 28.Zheng W; Fu SX; Dydak U; Cowan DM, Biomarkers of manganese intoxication. Neurotoxicology 2011, 32, (1), 1–8. [DOI] [PMC free article] [PubMed] [Google Scholar]
- 29.Chua A; Stonell LM; Savigni DL; Morgan EH, Mechanisms of manganese transport in rabbit erythroid cells. The Journal of physiology 1996, 493, (1), 99–112. [DOI] [PMC free article] [PubMed] [Google Scholar]
- 30.Savigni DL; Morgan EH, Transport mechanisms for iron and other transition metals in rat and rabbit erythroid cells. The Journal of physiology 1998, 508, (3), 837–850. [DOI] [PMC free article] [PubMed] [Google Scholar]
- 31.Haque E; Moran ME; Thorne PS, Retrospective blood lead assessment from archived clotted erythrocyte fraction in a cohort of lead-exposed mother-child dyads. Science of The Total Environment 2021, 754, 142166. [DOI] [PMC free article] [PubMed] [Google Scholar]
- 32.Lippi G; Targher G; Montagnana M; Salvagno GL; Zoppini G; Guidi GC, Relation between red blood cell distribution width and inflammatory biomarkers in a large cohort of unselected outpatients. Archives of pathology & laboratory medicine 2009, 133, (4), 628–632. [DOI] [PubMed] [Google Scholar]
- 33.Pandey KB; Rizvi SI, Biomarkers of oxidative stress in red blood cells. Biomedical Papers of the Medical Faculty of Palacky University in Olomouc 2011, 155, (2). [DOI] [PubMed] [Google Scholar]
- 34.Koma Y; Onishi A; Matsuoka H; Oda N; Yokota N; Matsumoto Y; Koyama M; Okada N; Nakashima N; Masuya D, Increased red blood cell distribution width associates with cancer stage and prognosis in patients with lung cancer. PloS one 2013, 8, (11), e80240. [DOI] [PMC free article] [PubMed] [Google Scholar]
- 35.Jones DR; Jarrett JM; Tevis DS; Franklin M; Mullinix NJ; Wallon KL; Quarles CD Jr; Caldwell KL; Jones RL, Analysis of whole human blood for Pb, Cd, Hg, Se, and Mn by ICP-DRC-MS for biomonitoring and acute exposures. Talanta 2017, 162, 114–122. [DOI] [PMC free article] [PubMed] [Google Scholar]
- 36.Caldwell KL; Cheng P-Y; Vance KA; Makhmudov A; Jarrett JM; Caudill SP; Ho D-P; Jones RL, LAMP: A CDC Program to Ensure the Quality of Blood-Lead Laboratory Measurements. Journal of Public Health Management and Practice 2019, 25, S23–S30. [DOI] [PubMed] [Google Scholar]
- 37.Fawcett T, An introduction to ROC analysis. Pattern recognition letters 2006, 27, (8), 861–874. [Google Scholar]
- 38.Allen M; Poggiali D; Whitaker K; Marshall TR; Kievit RA, Raincloud plots: a multi-platform tool for robust data visualization. Wellcome open research 2019, 4. [DOI] [PMC free article] [PubMed] [Google Scholar]
- 39.Council NR, Arsenic in drinking water. 1999.
- 40.Paulson JA; Brown MJ, The CDC blood lead reference value for children: Time for a change. Environmental Health 2019, 18, (1), 1–3. [DOI] [PMC free article] [PubMed] [Google Scholar]
- 41.Bewick V; Cheek L; Ball J, Statistics review 13: receiver operating characteristic curves. Critical care 2004, 8, (6), 1–5. [DOI] [PMC free article] [PubMed] [Google Scholar]
- 42.Zweig MH; Campbell G, Receiver-operating characteristic (ROC) plots: a fundamental evaluation tool in clinical medicine. Clinical chemistry 1993, 39, (4), 561–577. [PubMed] [Google Scholar]
- 43.Goodnough A, Their soil toxic, 1,100 Indiana residents scramble to find new homes. The New York Times 2016. [Google Scholar]
- 44.Pavilonis BT; Lioy PJ; Guazzetti S; Bostick BC; Donna F; Peli M; Zimmerman NJ; Bertrand P; Lucas E; Smith DR, Manganese concentrations in soil and settled dust in an area with historic ferroalloy production. Journal of exposure science & environmental epidemiology 2015, 25, (4), 443–450. [DOI] [PMC free article] [PubMed] [Google Scholar]
- 45.Rodrigues JL; Bandeira MJ; Araújo CF; Dos Santos NR; Anjos ALS; Koin NL; Pereira LC; Oliveira SS; Mergler D; Menezes-Filho JA, Manganese and lead levels in settled dust in elementary schools are correlated with biomarkers of exposure in school-aged children. Environmental pollution 2018, 236, 1004–1013. [DOI] [PubMed] [Google Scholar]
- 46.Haque E; Thorne PS; Nghiem AA; Yip CS; Bostick BC, Lead (Pb) concentrations and speciation in residential soils from an urban community impacted by multiple legacy sources. Journal of hazardous materials 2021, 416, 125886. [DOI] [PMC free article] [PubMed] [Google Scholar]
- 47.Gamble MV; Liu X; Slavkovich V; Pilsner JR; Ilievski V; Factor-Litvak P; Levy D; Alam S; Islam M; Parvez F, Folic acid supplementation lowers blood arsenic. The American journal of clinical nutrition 2007, 86, (4), 1202–1209. [DOI] [PMC free article] [PubMed] [Google Scholar]
- 48.George CM; Gamble M; Slavkovich V; Levy D; Ahmed A; Ahsan H; Graziano J, A cross-sectional study of the impact of blood selenium on blood and urinary arsenic concentrations in Bangladesh. Environmental Health 2013, 12, (1), 1–7. [DOI] [PMC free article] [PubMed] [Google Scholar]
- 49.Tan Q; Lv Y; Zhao F; Zhou J; Yang Y; Liu Y; Zhang M; Lu F; Wei Y; Chen X, Association of low blood arsenic exposure with level of malondialdehyde among Chinese adults aged 65 and older. Science of The Total Environment 2021, 758, 143638. [DOI] [PMC free article] [PubMed] [Google Scholar]
- 50.Argos M; Chen L; Jasmine F; Tong L; Pierce BL; Roy S; Paul-Brutus R; Gamble MV; Harper KN; Parvez F, Gene-specific differential DNA methylation and chronic arsenic exposure in an epigenome-wide association study of adults in Bangladesh. Environmental health perspectives 2015, 123, (1), 64–71. [DOI] [PMC free article] [PubMed] [Google Scholar]
- 51.Henn BC; Ettinger AS; Hopkins MR; Jim R; Amarasiriwardena C; Christiani DC; Coull BA; Bellinger DC; Wright RO, Prenatal arsenic exposure and birth outcomes among a population residing near a mining-related superfund site. Environmental health perspectives 2016, 124, (8), 1308–1315. [DOI] [PMC free article] [PubMed] [Google Scholar]
- 52.Mullin AM; Amarasiriwardena C; Cantoral-Preciado A; Henn BC; Hsu H-HL; Sanders AP; Svensson K; Tamayo-Ortiz M; Téllez-Rojo MM; Wright RO, Maternal blood arsenic levels and associations with birth weight-for-gestational age. Environmental research 2019, 177, 108603. [DOI] [PMC free article] [PubMed] [Google Scholar]
- 53.Ettinger AS; Arbuckle TE; Fisher M; Liang CL; Davis K; Cirtiu C-M; Bélanger P; LeBlanc A; Fraser WD; Group MS, Arsenic levels among pregnant women and newborns in Canada: Results from the Maternal-Infant Research on Environmental Chemicals (MIREC) cohort. Environmental research 2017, 153, 8–16. [DOI] [PubMed] [Google Scholar]
- 54.Stojsavljević A; Borković-Mitić S; Vujotić L; Grujičić D; Gavrović-Jankulović M; Manojlović D, The human biomonitoring study in Serbia: background levels for arsenic, cadmium, lead, thorium and uranium in the whole blood of adult Serbian population. Ecotoxicology and environmental safety 2019, 169, 402–409. [DOI] [PubMed] [Google Scholar]
- 55.Pi J; Yamauchi H; Kumagai Y; Sun G; Yoshida T; Aikawa H; Hopenhayn-Rich C; Shimojo N, Evidence for induction of oxidative stress caused by chronic exposure of Chinese residents to arsenic contained in drinking water. Environmental health perspectives 2002, 110, (4), 331–336. [DOI] [PMC free article] [PubMed] [Google Scholar]
- 56.Haque E; Mailloux BJ; de Wolff D; Gilioli S; Kelly C; Ahmed E; Small C; Ahmed KM; van Geen A; Bostick BC, Quantitative drinking water arsenic concentrations in field environments using mobile phone photometry of field kits. Science of the Total Environment 2018, 618, 579–585. [DOI] [PMC free article] [PubMed] [Google Scholar]
- 57.Day PL; Nelson EJ; Bluhm AM; Wood-Wentz CM; Jannetto PJ, Discovery of an arsenic and mercury co-elevation in the Midwest United States using reference laboratory data. Environmental Pollution 2019, 254, 113049. [DOI] [PubMed] [Google Scholar]
- 58.Chung SE; Cheong H-K; Ha E-H; Kim B-N; Ha M; Kim Y; Hong Y-C; Park H; Oh S-Y, Maternal blood manganese and early neurodevelopment: the mothers and children’s environmental health (MOCEH) study. Environmental health perspectives 2015, 123, (7), 717–722. [DOI] [PMC free article] [PubMed] [Google Scholar]
- 59.Henn BC; Kim J; Wessling-Resnick M; Téllez-Rojo MM; Jayawardene I; Ettinger AS; Hernández-Avila M; Schwartz J; Christiani DC; Hu H, Associations of iron metabolism genes with blood manganese levels: a population-based study with validation data from animal models. Environmental Health 2011, 10, (1), 1–11. [DOI] [PMC free article] [PubMed] [Google Scholar]
- 60.Röllin HB; Mathee A; Levin J; Theodorou P; Tassell H; Naik I, Examining the association between blood manganese and lead levels in schoolchildren in four selected regions of South Africa. Environmental research 2007, 103, (2), 160–167. [DOI] [PubMed] [Google Scholar]
- 61.Smith EA; Newland P; Bestwick KG; Ahmed N, Increased whole blood manganese concentrations observed in children with iron deficiency anaemia. Journal of Trace Elements in Medicine and Biology 2013, 27, (1), 65–69. [DOI] [PubMed] [Google Scholar]
- 62.Bulka CM; Bryan MS; Persky VW; Daviglus ML; Durazo-Arvizu RA; Parvez F; Slavkovich V; Graziano JH; Islam T; Baron JA, Changes in blood pressure associated with lead, manganese, and selenium in a Bangladeshi cohort. Environmental Pollution 2019, 248, 28–35. [DOI] [PMC free article] [PubMed] [Google Scholar]
- 63.Hong S-B; Kim J-W; Choi B-S; Hong Y-C; Park E-J; Shin M-S; Kim B-N; Yoo H-J; Cho I-H; Bhang S-Y, Blood manganese levels in relation to comorbid behavioral and emotional problems in children with attention-deficit/hyperactivity disorder. Psychiatry research 2014, 220, (1–2), 418–425. [DOI] [PubMed] [Google Scholar]
- 64.Lucchini RG; Zoni S; Guazzetti S; Bontempi E; Micheletti S; Broberg K; Parrinello G; Smith DR, Inverse association of intellectual function with very low blood lead but not with manganese exposure in Italian adolescents. Environmental research 2012, 118, 65–71. [DOI] [PMC free article] [PubMed] [Google Scholar]
- 65.Haynes EN; Sucharew H; Kuhnell P; Alden J; Barnas M; Wright RO; Parsons PJ; Aldous KM; Praamsma ML; Beidler C, Manganese exposure and neurocognitive outcomes in rural school-age children: the communities actively researching exposure study (Ohio, USA). Environmental health perspectives 2015, 123, (10), 1066–1071. [DOI] [PMC free article] [PubMed] [Google Scholar]
- 66.Chiu Y-HM; Henn BC; Hsu H-HL; Pendo MP; Coull BA; Austin C; Cagna G; Fedrighi C; Placidi D; Smith DR, Sex differences in sensitivity to prenatal and early childhood manganese exposure on neuromotor function in adolescents. Environmental research 2017, 159, 458–465. [DOI] [PMC free article] [PubMed] [Google Scholar]
- 67.Oulhote Y; Mergler D; Bouchard MF, Sex-and age-differences in blood manganese levels in the US general population: national health and nutrition examination survey 2011–2012. Environmental Health 2014, 13, (1), 1–10. [DOI] [PMC free article] [PubMed] [Google Scholar]
- 68.Zhang H-D; Ma Y-J; Liu Q-F; Ye T-Z; Meng F-Y; Zhou Y-W; Yu G-P; Yang J-P; Jiang H; Wang Q-S, Human erythrocyte lifespan measured by Levitt’s CO breath test with newly developed automatic instrument. Journal of breath research 2018, 12, (3), 036003. [DOI] [PubMed] [Google Scholar]
- 69.Stow CA; Reckhow KH; Qian SS, A Bayesian approach to retransformation bias in transformed regression. Ecology 2006, 87, (6), 1472–1477. [DOI] [PubMed] [Google Scholar]
Associated Data
This section collects any data citations, data availability statements, or supplementary materials included in this article.


