

ABSTRACT
Immunotherapies, in particular immune checkpoint blockade (ICB), have improved the clinical outcome of cancer patients, although many fail to mount a durable response. Several resistance mechanisms have been identified, but our understanding of the requirements for a robust ICB response is incomplete. We have engineered an MHC I/antigen: TCR-matched panel of human NSCLC cancer and T cells to identify tumor cell-intrinsic T cell resistance mechanisms. The top differentially expressed gene in resistant tumor cells was SERPINB9. This serine protease inhibitor of the effector T cell-derived molecule granzyme B prevents caspase-mediated tumor apoptosis. Concordantly, we show that genetic ablation of SERPINB9 reverts T cell resistance of NSCLC cell lines, whereas its overexpression reduces T cell sensitivity. SERPINB9 expression in NSCLC strongly correlates with a mesenchymal phenotype. We also find that SERPINB9 is commonly amplified in cancer, particularly melanoma in which it is indicative of poor prognosis. Single-cell RNA sequencing of ICB-treated melanomas revealed that SERPINB9 expression is elevated not only in cells from post- versus pre-treatment cancers, but also in ICB-refractory cancers. In NSCLC we commonly observed rare SERPINB9-positive cancer cells, possibly accounting for reservoirs of ICB-resistant cells. While underscoring SERPINB9 as a potential target to combat immunotherapy resistance, these results suggest its potential to serve as a prognostic and predictive biomarker.
KEYWORDS: Cancer, immunotherapy, SERPINB9, NSCLC, melanoma
Introduction
As one of the most important medical discoveries in recent years, immune checkpoint blockade (ICB) therapy has improved the clinical outcome of patients in an increasing number of cancer types. The use of anti-PD-1/L1 and other immuno-oncology agents has been approved for more than 20 cancer types. In addition, the combination of ICB with other treatments, like chemotherapy, has increased dramatically, with more than 1200 new combination trials only in the last 2 y.1 Lung cancer is the cancer type with the highest number of new ICB trials initiated per year.2 This is due not only to the initial success of ICB in lung cancer patients, but also because of the need to find a better combination therapy: still up to 60% of non-small cell lung cancer (NSCLC) patients fail to respond durably to ICB.3 This is due to resistance mechanisms that have only just begun to be understood.4,5
Therefore, in parallel with the increasing number of clinical trials, there has been a burst in research studies about resistance mechanisms to ICB. Especially in NSCLC, PD1/PDL-1 expression has been widely studied to predict response to ICB and used as an inclusion criteria for ICB therapy.6,7 However, the fact that about 50% of PD-L1 expressing tumors do not respond to anti-PD1/PD-L1 treatment suggests that there are also PD1/PD-L1-independent resistance mechanisms that need to be studied.8
Indeed, tumor mutational burden, the presence and variation of (neo)antigens, together with a functional antigen presentation pathway have been described to play crucial roles in an effective immunotherapy response.9 The absence of tumor recognition by T cells, lack of immune infiltration, immune-suppressive signals in the tumor microenvironment (TME) and the dysfunctional state of cytotoxic T cells all also contribute to poor immunotherapy responses.10,11,22 Thus, both the tumor and immune compartments need to fulfill several criteria to allow for an adequate anti-tumor immune response.
In this study, we focused on tumor cell-intrinsic T cell resistance mechanisms. We established a genetically defined co-culture system allowing for standardized communication between tumor cells and T cells12,13 and set out to uncover new tumor resistance mechanisms, comparing RNA expression profiles of a NSCLC cell line panel. We also investigated the clinical relevance of our findings.
Material and methods
Cell line panel generation and culture
Human NSCLC cell lines were obtained from the Peeper and Wilbert Zwart laboratory cell line stocks. They were lentivirally transduced with the HLA-A*02:01-MART1-mPlum plasmid to express the HLA-A*02:01 molecule, the MART1 epitope, mPlum, and a hygromycin resistance cassette. Infected cells were selected with 1:200 of 50 mg/ml hygromycin (10687010, Life Technologies) and FACs-sorted for a double positive mPlum+ and HLA-A*02:01+ population. Cells were maintained in RPMI medium (21875034, Thermofisher) containing 1:200 of 50 mg/ml hygromycin, 10% fetal bovine serum (3101120, Sigma) and 1:100 of 10000 U/ml Penicillin-Streptomycin (15140–122, Invitrogen). All cell lines were checked for mycoplasma by monthly PCR analyses.
T cells cytotoxicity assays
CD8 + T cells were isolated from PBMCs from buffy coats from healthy individuals, activated in a pre-coated plate with CD3 and CD28 antibodies (eBioscience, 5 mg per well in 24-well plates) for 48 h, and transduced with lentivirus encoding a MART-1-specific TCR.13 To determine T cell sensitivity, tumor cells were seeded into 12-well plates at 1.2 × 10⁵ cells/well. T cells were added at a 1:1 ratio and incubated for 16 hours. After the co-culture, T cells were washed with PBS and cell survival was determined by fixing and Crystal violet staining. For Incucyte® experiments, cells were seeded at 104 cells/well in 96-well plates. T cells were added at several ratios and Caspase3/7 apoptotic events were measured every 2 hours. For end point measurements, remaining surviving cells were fixed and stained with Crystal violet.
Cytokine cytotoxicity assays
Tumor cells were seeded at 5 × 10³ cells/well into 96-well plates and incubated with cytokines at 100ug/ml for 5 d. After that, medium was washed and viability was measured using the Cell Titer Blue Viability Assay (G8081, Promega) following manufacturer’s instructions. The following cytokines were used: rhPerforin-1 (230–00687-10, BioConnect), rhGranzyme B (230–00250-10, Ray-Biotech), rhIFN alfa 1b (11343594, ImmunoTools), rhIFN beta 1a (11343524, ImmunoTools), rhTRAIL (310–04, Peprotech).
RNA sequencing analysis
RNAseq data was aligned to hg38 with TopHat 2.1. Reads were counted with Icount, proprietary software based on HTSeq-count for uniquely mapped reads. Differential expression analysis on baseline samples was performed with DESeq2 (version 1.32.0), using default settings. Only genes that had a minimum of 10 reads across the 8 samples used in the comparison were retained for the analysis. The deseq() function was used with default settings. Raw and processed RNA sequencing data generated for this study is available through GEO (GSE214992). It is accessible in https://www.ncbi.nlm.nih.gov/geo/query/acc.cgi?acc=GSE214992
Flow cytometry
For flow cytometry analysis, cells were dissociated with trypsin, washed and stained with flow cytometry antibodies in 0.1% BSA in PBS on ice and in the dark for 30 min. After two washes, cells were analyzed by flow cytometry using LSRFortessa (BD). Cells were gated on FSC and SSC followed by single cell gating on FSC-HH/FSC and SSC-H/SSC. HLA-A*02:01-FITC antibody (551285, BD Biosciences) was used at a dilution of 1:100.
Western Blot
For protein analysis by western blotting, cells were lysed in RIPA lysis buffer, supplemented with HALT Protease and Phosphatase inhibitor cocktail (Thermo Fisher, 78444). Protein concentration was quantified using Bio-Rad protein assay (Bio-Rad, 500–0006). Samples were analyzed on NuPAGE Bis-Tris 4–12% gels (Thermo Fisher) and subsequently transferred onto nitrocellulose membranes using the iBlotTM Transfer System (Thermo Fisher). Membranes were blocked using 4% milk powder in 0.2% Tween-20 in PBS (PBST) for 1 h, after which primary antibodies were incubated overnight at 4C. The next day they were washed 3x for 10 min with PBST and incubated with a secondary antibody for 1 h at RT. They were washed again 3x for 10 min and developed using Super Signal West Dura Extended Duration Substrate (Thermo Fisher, 34075) and the ChemiDoc imaging system (Bio-Rad). The following antibodies were used: anti-SERPINB9 (PA5-101879, Thermo Fisher), HSP90 (4874S, CST) and anti-rabbit IgG (Thermo Fisher, G-21234).
Generation of knockout and overexpression cell lines by lentiviral transduction
Oligonucleotides for sgRNAs were annealed and cloned into LentiCRISPRv2 plasmids. The sgRNA containing plasmid was then co-transfected with the packaging plasmids pMD2.G (Addgene, #12259) and psPAX (Addgene, #12260) into subconfluent HEK293T cells using polyethylenimine. Cells were refreshed the following morning with 2% FCS Opti-MEM media and after a day lentivirus-containing supernatant was harvested and filtered. Tumor cells were then transduced with lentivirus for 24 h. After that, the supernatant was removed and cells were expanded under selection of 2 µg/ml puromycin for at least 7 d. Then, clones were established by serial dilution in 96-well plates. The following sgRNAs were used: sgRNA Ctrl: 5’-GGTTGCTGTGACGAACGGGG-3’, sgRNA SERPINB9: 5’-TGGGTCTCAAAAAAGACCGA-3’ and 5’-GGCACTGTCTTTAAACACAG-3’.
A SERPINB9 overexpression construct was obtained from the CCSB-Broad Lentiviral Expression Library (Thermo Fisher) and introduced into tumor cells following the same protocol as described for sgRNAs. Selection was performed with 10 µg/ml blasticidin.
Single-cell sequencing
Log2 normalized single-cell datasets were downloaded from cancerSEA. The epithelial and mesenchymal scores for each cell were calculated by taking the mean of the epithelial and mesenchymal genes from the pan-cancer EMT signature14 and subtracting the mesenchymal score from the epithelial score to obtain a log2 ratio. These ratios were correlated to the expression of SERPINB9 in each cell using a Spearman correlation test.
ICB-treated melanoma cohort was provided by Marine lab (Poźniak et al., manuscript in preparation) Transcript per Milion (TPM) normalized Jerby-Arnon et al. dataset was downloaded from the GEO portal (accession number GSE115978).
TCGA cohort
All cancer cohorts in TCGA were examined in cbioportal (http://www.cbioportal.org/) for SERPINB9 amplification, and top 15 cancer types were shown. For survival analysis, we selected all melanoma and lung cancer studies. The “Query by gene” input was SERPINB9 and only cases with copy number alterations data were selected.
Patients samples
We analyzed a patient cohort that was treated since March 2015 at the Netherlands Cancer Institute/Antoni van Leeuwenhoek (NKI-AVL), The Netherlands. All patients had pathologically confirmed stage IV NSCLC. Baseline formalin-fixed paraffin embedded (FFPE) tumor tissue samples were collected from all patients. Consent from patients to research usage of material for IHC was organized by the institutionally implemented opt-out procedure. The study was approved by the Institutional Research Board of NKI (CFMPB586).
Immunohistopathology
Immunohistochemistry of samples was performed on a BenchMark Ultra autostainer (Ventana Medical Systems). Briefly, paraffin sections were cut at 3 µm, heated at 75°C for 28 minutes and deparaffinized in the instrument with EZ prep solution (Ventana Medical Systems). Heat-induced antigen retrieval was carried out using Cell Conditioning 1 (CC1, Ventana Medical Systems) for 64 minutes at 95°C. PI-9 (SERPINB9) was detected using a polyclonal (1/1600 dilution, 1 hour at R.T, Abcam ab36624). Bound antibody was visualized using the OptiView DAB Detection Kit (Ventana Medical Systems). Slides were counterstained with Hematoxylin and Bluing Reagent (Ventana Medical Systems). The scoring was performed blinded with Slidescore®. Percentage of positivity (of any intensity) of the cancer cells or of the stroma (including lymphocytes, macrophages, fibroblasts, etc) was evaluated. Necrotic areas, luminal debris or other pigment areas (e.g., iron pigment or anthracosis) were not included. Samples with no tumor cells were excluded from the analysis.
Statistical analysis
Data was analyzed for normality using a Saphiro-Wilk test. Data that passed the normality test was analyzed with a student t-test for two comparisons or a one-way ANOVA when multiple comparisons were required. If data was not normally distributed, a non-parametric test was used. In the case of grouped comparison, a two-way ANOVA test was used. For each experiment, the statistical test used is indicated in figure legends. All statistical analyses were performed using Graphpad Prism or R.
Results
SERPINB9 is the major differentially expressed gene in T cell-resistant vs. -sensitive NSCLC cell lines
To better understand tumor cell-intrinsic T cell resistance in lung cancer, we established a panel of 16 NSCLC cell lines. To be able to compare their cell-intrinsic properties , we standardized their antigen presentation and recognition by T cells. We ectopically expressed the major histocompatibility complex (MHC) Class I antigen-presenting molecule HLA-A*02:01, as well as MART-1 antigen, in all NSCLC tumor cell lines. In parallel, we transduced CD8+ T cells from PBMCs derived from healthy donors with a MART-1-specific TCR. Then, matched tumor and T cells were co-cultured at a 1:1 ratio for 16 hours and tumor cell survival was determined by a crystal violet staining. We observed a range of sensitivities to T cell killing across the cell line panel (Figure 1a-b). It was therefore important to first determine whether HLA-A*02:01 expression could be a confounding factor in this model. However, HLA-A*02:01 protein expression was not correlated with sensitivity to T cell killing (Fig. S1A). We subsequently evaluated the sensitivity of tumor cells to individual T cell-derived cytotoxic molecules. We found that tumor cells displaying less sensitivity to T cells were also more resistant to Perforin and Granzyme B, IFNα, IFNβ, and TRAIL, but not to IFNγ and TNFα (Figure 1c).
Figure 1.
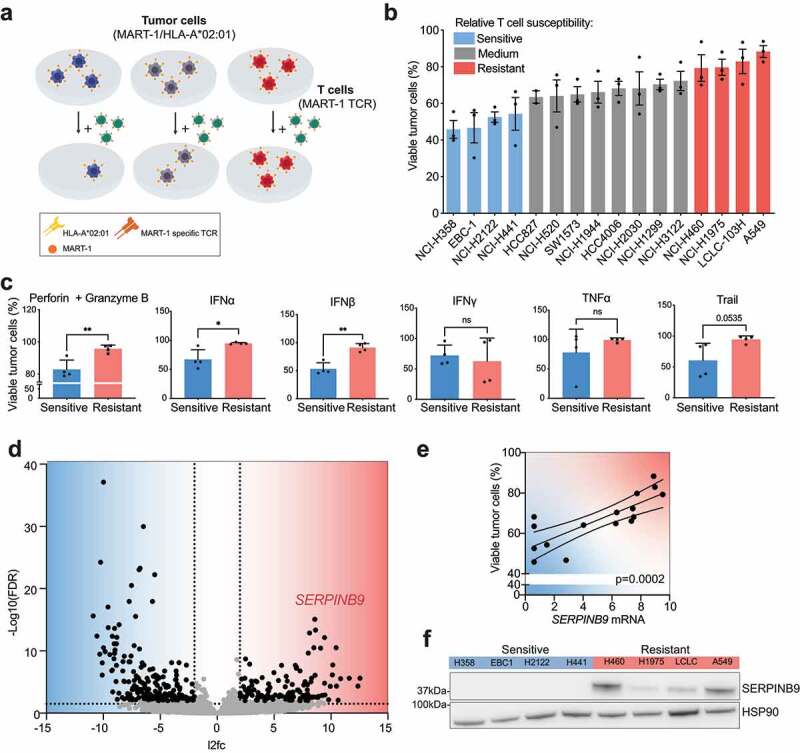
SERPINB9 is the major differentially expressed gene in T cell-resistant vs. sensitive NSCLC cell lines. a) Schematic representation of the NSCLC tumor cell line panel in co-culture with T cells. Tumor cells were transduced with vectors encoding HLA-A02 and MART-1, while T cells were transduced with a MART-1-specific TCR. b) Tumor cells and T cells were co-cultured at a ratio of 1:1 for 16 hours, fixed and stained with crystal violet. Each data point indicates an individual biological replicate. Mean with S.D. c) Cell viability measurement by Cell titer blue (CTB) of the four most resistant versus the four most sensitive NSCLC cell lines treated with the indicated cytokines (100μg/ml) for 5 days. Unpaired t test was used for statistical analysis. *p<0.05 **p<0.001 d) Volcano plot showing differential expression analysis comparing the four most resistant versus the four most sensitive cell lines. Dashed lines indicate significance thresholds (FDR < 0.01, log2 fold change < -2 or > 2). e) Correlation of SERPINB9 mRNA normalized expression with viability measured as described in A and B. Each data point indicates an individual cell line. A simple linear regression test was used for statistical analysis. p= 0.0002. f) SERPINB9 protein quantification by western blot in the four most resistant versus four most sensitive cell lines. HSP90 serves as a loading control.
Next, to uncover shared intrinsic differences between relatively T cell-resistant and T cell-sensitive cell lines, RNA sequencing was performed on the whole NSCLC cell panel at baseline. We then established an arbitrary cutoff and compared the four most sensitive and four most resistant cell lines. We identified 315 differentially expressed (DE) genes comparing sensitive and resistant cell lines (Table S1). Given our aim of identifying genes involved in T cell resistance, we focused on those that were higher expressed in resistant cells. The top significant DE gene in resistant cells was SERPINB9 (also called PI-9; Figure 1d). We confirmed that, besides being differentially expressed in four vs four cell lines, the mRNA expression of SERPINB9 across the entire cell line panel was also correlated with T cell sensitivity (Figure 1e and S1B). The correlation was not linear, possibly due to the co-existence of other resistance mechanisms. We also evaluated whether this correlation translated into protein levels. Indeed, SERPINB9 protein was expressed at higher levels in T cell-resistant than T cell-sensitive tumor cells (figure 1f and S1C). These results extend reports by others,15–19 highlighting SERPINB9 as a highly expressed gene in tumor cell lines that are relatively resistant to cytotoxic T cells.
Genetic ablation of SERPINB9 sensitizes tumor cells to T cell killing, whereas overexpression causes resistance
Next, we evaluated in this model system whether SERPINB9 is functionally involved in the T-cell resistance phenotype. We selected the two most resistant and two most sensitive cell lines from our panel (Figure 1b). In the first set expressing high SERPINB9 levels, we genetically ablated the gene; in the sensitive cells expressing no SERPINB9, we ectopically expressed it. We subsequently evaluated if these perturbations would alter the sensitivity of these lung cancer cell lines to T cells.
SERPINB9 knockout clones were generated by CRISPR-Cas9 in the two most resistant cell lines (LCLC-103 H and A549; Figure 2a) and used in a cytotoxicity assay with T cells. As expected, treatment of parental cell lines with matched T cells induced apoptosis. More importantly, upon deletion of SERPINB9, the lung cancer cells became much more apoptotic upon T cell challenge (Figure 2b, left panels). The experiment was repeated with four independent T cell donors (Figure 2b, right panels) and the effect was confirmed at different tumor: T cell ratios (Figure 2c) and independent sgRNAs (Fig. S2A, B). Thus, SERPINB9 ablation sensitizes resistant NSCLC cells to T cell killing.
Figure 2.
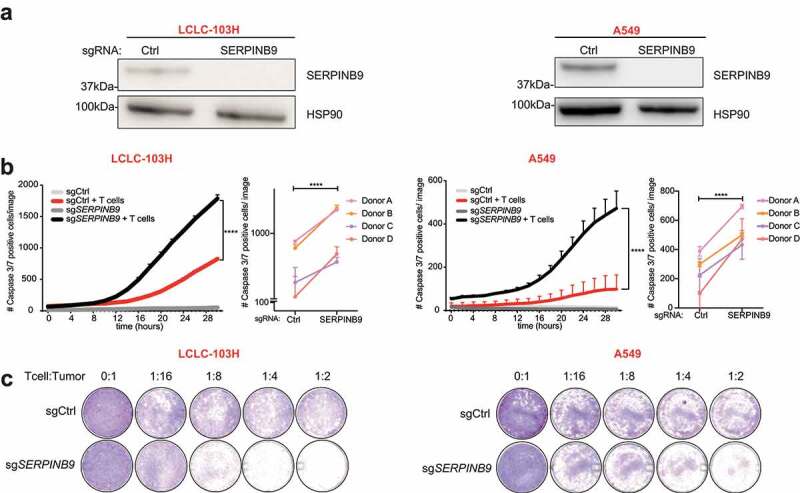
Genetic ablation of SERPINB9 sensitizes tumor cells to T cell killing. a) Western blot showing SERPINB9 protein expression in sgRNA control (Ctrl)- or sgSERPINB9-expressing LCLC-103H and A549 T cell-resistant cell lines. HSP90 serves as a loading control. b) Cell apoptosis measurement by a Caspase3/7 dye in a co-culture of sgCtrl- or sgSERPINB9-expressing tumor cells (LCLC-103H left, A549 right) with or without T cells, as indicated. Number of Caspase3/7-positive cells were imaged by an Incucyte system every 2 hours. Mean with S.D. 2-way ANOVA test was used for statistical analysis. ****p<0.0001. The small right-hand panels show the end point measurements of four independent biological experiments with different T cell donors. Unpaired t test was used for statistical analysis. ****p<0.0001. c) Cell viability measurement by crystal violet staining of endpoints in B) at different T cell: tumor cell ratios.
Conversely, when SERPINB9 was overexpressed in sensitive cell lines (EBC-1 and NCI-H358) (Figure 3a), we observed that the cancer cells became more resistant to T cell attack (Figure 3b, left panels). The results were again confirmed with four different T cell donors (Figure 3b, right panels) and seen for different tumor: T cell ratios (Figure 3c). Taken together, these data highlight SERPINB9 as a key mediator of the tumor cell-intrinsic susceptibility to T cells.
Figure 3.
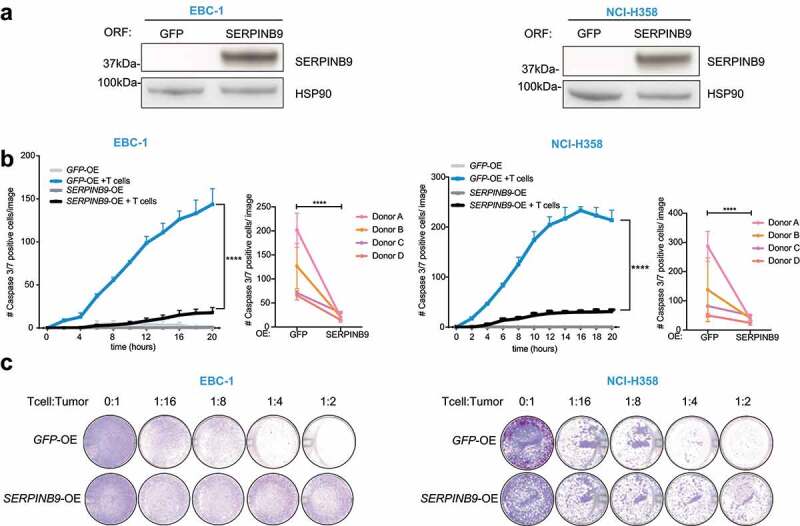
SERPINB9 overexpression causes resistance to T cell killing. a) Western blot showing SERPINB9 protein expression in cells overexpressing (ORF for Open Reading Frame) GFP or SERPINB9 in T cell-sensitive cell lines EBC-1 (left) and NCI-H358 (right). HSP90 serves as a loading control. b) Cell apoptosis measurement by a Caspase3/7 dye in a co-culture of GFP- or SERPINB9-expressing tumor cells (EBC-1 left, NCI-H358 right) with or without T cells, as indicated. Number of Caspase3/7 positive cells were measured by Incucyte analysis every 2 hours. Mean with S.D. 2-way ANOVA test was used for statistical analysis. ****p<0.0001. The small right-hand panels show the end point measurements of four independent biological experiments with different T cell donors. Unpaired t test was used for statistical analysis. ****p<0.0001. c) Cell viability measurement by Crystal violet staining of endpoints in E) at different T cell: tumor cell ratios.
SERPINB9 expression in vitro and cancer patients correlates with Epithelial-to-Mesenchymal transition
SERPINB9 is a serine protease inhibitor of the effector molecules granzyme B and caspase.6,8,15,20–23 Given the difference in baseline expression of SERPINB9 in the cell line panel we examined the differences in the transcriptomic landscape of SERPINB9high and SERPINB9low cells. We performed pathway enrichment analysis on the log2-fold changes from the DE genes identified above (Figure 1d) and found that, amongst several other pathways, the epithelial to mesenchymal transition (EMT) pathway was significantly enriched in SERPINB9high cells (Figure 4a). We evaluated the expression of an EMT pan-cancer signature previously established14 in the cell line panel. We observed that higher levels of SERPINB9 corresponded with higher expression of mesenchymal genes, whereas low levels of SERPINB9 correlated with higher expression of epithelial genes in the tumor cells (Figure 4b). We quantified this correlation by calculating an epithelial/mesenchymal score (EMT score) from the average normalized expression of epithelial genes divided by the average normalized expression of mesenchymal genes. The EMT score was inversely correlated with SERPINB9 expression across our cell panel (Figure 4c).
Figure 4.
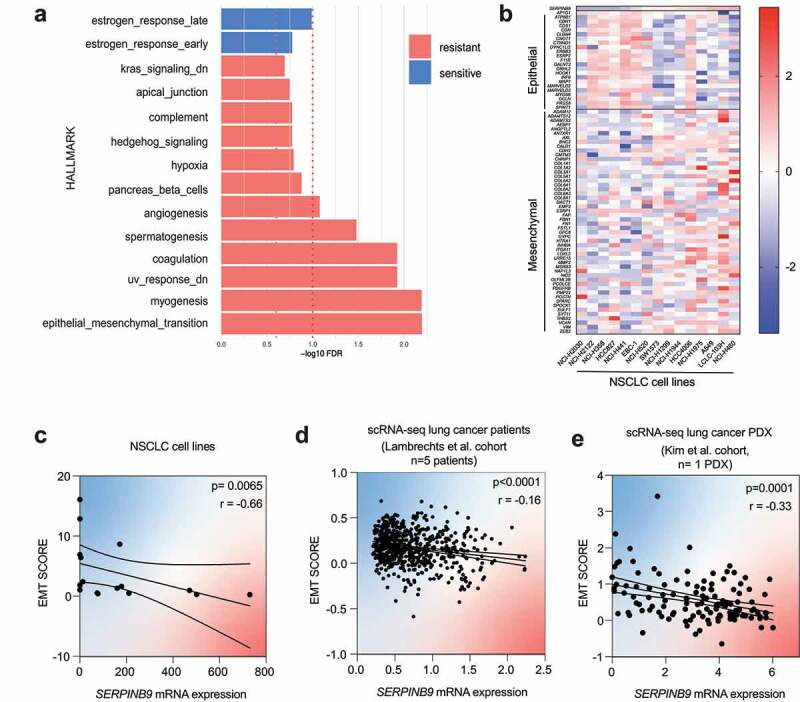
SERPINB9 expression in vitro and cancer patients correlates with Epithelial-to-Mesenchymal transition. a) Gene set enrichment analysis (GSEA) using the msigdb hallmark dataset on the log2-fold change results from the differential expression analysis in figure 1D. The dashed red line indicates the 1.0 significance threshold of the -log10FDR. b) Expression of the pan-cancer EMT signature14 in the NSCLC cell line panel, ranked by SERPINB9 mRNA expression (columns) and EMT genes (rows). c) Correlation of epithelial/mesenchymal (EMT) score with SERPINB9 mRNA expression in NSCLC cell panel. Each dot represents an individual cell line. Spearman test was used for statistical analysis. p and r values are indicated in top right. d) Correlation of epithelial/mesenchymal (EMT) score with SERPINB9 mRNA expression in cancer cells (single cell RNA sequencing) from lung cancer patients from Lambrechts et al. cohort (Lambrechts et al., 2018). Each dot represents an individual cancer cell from a patient. Spearman test was used for statistical analysis. p and r values are indicated in top right. e) Correlation of epithelial/mesenchymal (EMT) score with SERPINB9 mRNA expression in cancer cells (single cell RNA sequencing) from lung cancer patient-derivedxenografts (PDX) from Kim et al.25 cohort. Each dot represents an individual cancer cell from a PDX. Spearman test was used for statistical analysis. p and r value values are indicated in top right.
Next, we evaluated whether the correlation of SERPINB9 with EMT occurred also in cancer patients. A potentially confounding factor is that SERPINB9 is highly expressed also in immune cells, as well as in malignant tumor cells (Fig. S3A).16,26,27 To specifically investigate SERPINB9 in tumor cells, we made use of available single cell RNA (scRNA) sequencing data of NSCLC patient cohorts. Consistent with what we found in cell lines, SERPINB9 expression was inversely correlated with the EMT score in lung cancer patients24 and lung cancer patient-derived xenografts (PDXs)28 (Figure 4d, e).
SERPINB9 is commonly amplified and high expression correlates with poor prognosis and ICB response in melanoma
To investigate the translational potential of our findings, we examined any link of SERPINB9 with cancer patient prognosis. As mentioned above, it was important to evaluate SERPINB9 expression specifically in tumor cells to avoid potentially confounding effects of SERPINB9 expressed in T cells. For that reason, we decided to first analyze copy number variations (CNV) of SERPINB9 in a TCGA pan-cancer cohort. We observed that SERPINB9 is amplified in a variety of cancer types (Figure 5a). The group with the highest percentage of patients with amplification at the SERPINB9 locus was melanoma (8.82%), while in NSCLC the amplification incidence was considerably lower (1.87%). Melanoma is one of the cancer types with the best response rates to ICB treatment. Therefore, we next evaluated whether within melanoma patients SERPINB9 amplification would co-segregate with a worse response. Indeed, melanoma patients with SERPINB9 amplification had a decreased OS compared to patients with a diploid status (p = .016). The NSCLC cohort did not show a significant difference (Figure 5b; Fig. S4A and B).
Figure 5.
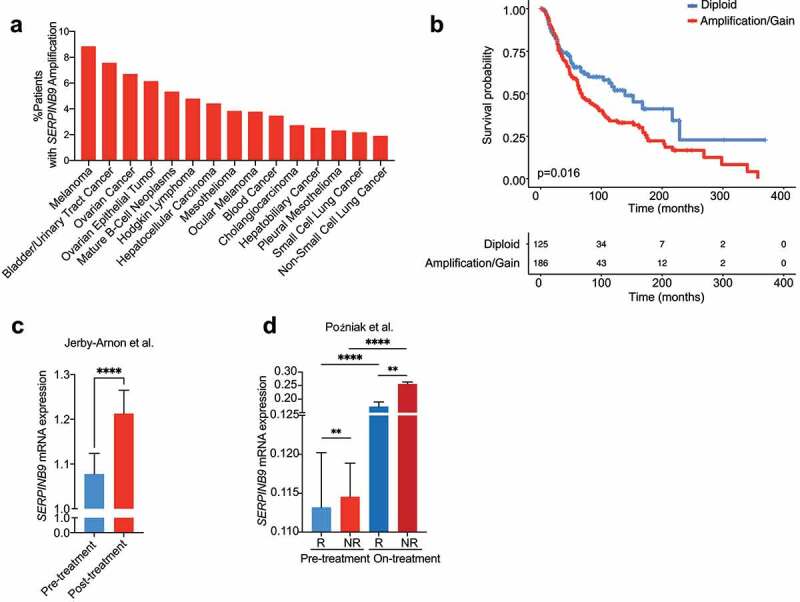
SERPINB9 is commonly amplified and high expression correlates with poor prognosis and poor ICB response. a) Percentage of patients per cancer type from TCGA showing SERPINB9 copy number amplification. All TCGA studies that included copy number information were included; top 15 are shown. b) Melanoma Kaplan-Meier survival curve of patients with or without SERPINB9 amplification/gain. Log-rank (Mantel-Cox) test was used for statistical analysis. p=0.016. c) SERPINB9 normalized mRNA expression on tumor cells in the Jerby-Arnon scRNAseq ICB-treated melanoma cohort (Jerby-Arnon et al., 2018), for pre- and posttreatment patients. Y axis indicate SERPINB9 mRNA normalized expression. Mean with SEM. Mann-Whitney test was used for statistical analysis. ****p<0.0001. d) SERPINB9 normalized mRNA expression on tumor cells in the Poźniak scRNA-seq ICB-treated melanoma cohort (Poźniak et al., manuscript in preparation), for pre- and on-treatment patients, both for responders and non-responders. Y-axis indicates SERPINB9 mRNA normalized expression. Mean with SEM. Mann-Whitney test was used for statistical analysis. **p<0.01, ****p<0.0001.
Continuing our approach to evaluate SERPINB9 specifically in tumor cells, we examined clinical correlations of SERPINB9 in scRNA sequencing datasets of ICB-treated cancer patients. To date, no NSCLC ICB-scRNA-seq datasets that include tumor cells are available, so based on our result above, we investigated this for melanoma for which datasets are available. We first evaluated the Jerby-Arnon melanoma cohort29 and found that SERPINB9 was expressed to higher levels in tumor cells from post-treatment than pre-treated patients (Figure 5c). We extended this finding with another melanoma scRNA-sequencing ICB-treated patient cohort, comprising both baseline patients and patients who are on ICB treatment for 2 or 3 weeks (VIB/KUL Grand challenge Pointillism cohort; Poźniak et al., manuscript in preparation). Confirming the first analysis, we observed that SERPINB9 was expressed to higher levels in cancer cells from patients on treatment compared to those prior to treatment (Figure 5d). Most importantly, SERPINB9 was expressed to higher levels in ICB non-responders compared to responders. This was seen in both pre- and on-treatment samples. These results suggest that SERPINB9 expression may serve also as an ICB-response predictive biomarker.
SERPINB9 is expressed in cancer cells prior to ICB treatment in NSCLC
In our analysis above we observed increased SERPINB9 expression in post- vs pre-ICB treatment samples. This could be caused either by expression induction or by cell enrichment. It has been described that SERPINB9 can be induced by T cell-derived cytokines.30 Therefore, we investigated whether there are preexisting SERPINB9-positive cancer cells prior to ICB. We collected samples from NSCLC patients in our hospital and performed SERPINB9 IHC staining. Of the 54 samples that were stained, the majority showed a low percentage of SERPINB9-positive cancer cells; 3.7% of samples showed more than 50% SERPINB9-positive cancer cells (Figure 6a-b). The low incidence of SERPINB9 protein expression observed here recapitulates the low incidence (1.87%) of SERPINB9 amplification in NSCLC described in Figure 4a and extends previous observations16 (S5A). Although we found few NSCLCs with a high percentage of SERPINB9-positive cells, most tumors harbored sporadic SERPINB9-positive cancer cells, possibly forming a reservoir of ICB-resistant cells.
Figure 6.
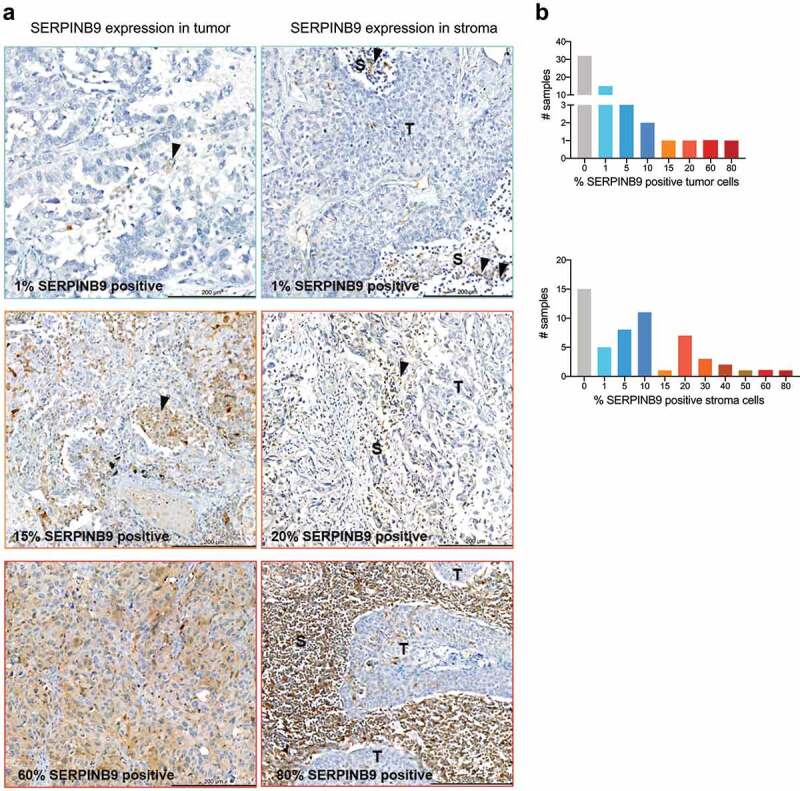
SERPINB9 protein expression in NSCLC identifies a subset of ICB-non responders. a) Examples of six samples from NSCLC patients, which were stained by IHC for SERPINB9 expression. Left column: SERPINB9 expression in tumor cells. Right column: SERPINB9 expression in stroma cells. Scale is indicated in the bar at the bottom right of each picture. Quantification in Fig. 5B. Colored border indicate which bar in Fig. 5B corresponds with each sample. T: indicates tumor, S: indicates stroma. Arrows indicate SERPINB9-positive cells. b) Number of samples and percentage of SERPINB9-positive cells from NSCLC patients. 54 samples in total.
Lastly, we observed SERPINB9 staining in non-cancerous cells (lymphocytes, macrophages, fibroblast, etc.), too, in which SERPINB9 is also known to play a key role21 (S5B). Together, these results highlight the value of spatial information combined with data obtained from the bulk tumor and show that SERPINB9 is expressed in both cancer cells and non-cancer cells prior to ICB treatment.
Discussion
We have established a matched tumor: T cell co-culture model allowing to investigate tumor cell-intrinsic determinants of susceptibility to T cell elimination. Standardization of TCR-mediated antigen recognition in this system revealed a range of relative sensitivities to T cell killing. Interrogation of the model by RNA profiling uncovered SERPINB9 as the top significant differentially expressed gene in resistant tumor cells. Interestingly, SERPINB9 was previously identified in a study correlating T cell dysfunction to ICB responses.17 However, because SERPINB9 is also highly expressed in immune cells, from this study by Jiang et al., it was unclear what the relative contribution in this setting was of SERPINB9 in tumor cells versus immune cells. Therefore, we investigated SERPINB9 copy number variations, single-cell RNA sequencing data and IHC staining from patients, which allowed us to determine any prognostic and/or predictive (to immunotherapy) role of SERPINB9 expressed specifically in tumor cells. We demonstrate that SERPINB9 is amplified across different cancer types and that this amplification is indicative of poor prognosis. Furthermore, we show that, indeed, SERPINB9 is expressed to higher levels in tumor cells from patients who fail to respond to ICB, supporting its predictive potential. Our results emphasize the tumor-intrinsic role that SERPINB9 plays, independent of antigen presentation, T cell fitness or immune infiltration.
SERPINB9 has recently been suggested as a potential therapeutic target,16 an idea that is supported by the results presented here. On the one hand, we demonstrate that genetic ablation of SERPINB9 breaks the tumor-intrinsic T cell resistance phenotype of NSCLC cells. On the other, we show that ectopic expression of SERPINB9 renders T cell-sensitive tumor cells resistant to T cells, extending previous studies of SERPINB9 in melanoma and lymphoma.16,31 In vivo, SERPINB9 genetic ablation has also been reported to promote tumor control in immunocompetent mice, which is in line with our in vitro experiments.16
By interrogating the transcriptomic differences between SERPINB9high and SERPINB9low lung cancer cells, we found SERPINB9 to be strongly correlated with an EMT gene signature. It was previously described that bone marrow and embryonic stem cells express high levels of SERPINB9 to protect themselves from immune attack.20 In line with this, we show here that also mesenchymal tumor cells, which are known to have a more de-differentiated (stem-like) phenotype, use SERPINB9 as a protective mechanism.
Some studies have shown that SERPINB9 correlates with poor prognosis in uveal melanoma, hepatocellular carcinoma, and colorectal cancer.32–34 In line with this, our TCGA pan-cancer evaluation revealed that SERPINB9 is amplified in a wide variety of cancers, and at least based on this analysis we suggest that SERPINB9 CNA may serve as a prognostic factor for melanoma. In addition, we demonstrate that SERPINB9 expression in tumor cells is predictive of ICB response in melanoma, as judged by scRNA-seq.
Lastly, we noted a relatively high expression of SERPINB9 in on- and post-ICB treatment clinical specimens compared to pre-treatment ones. Together with the presence of rare SERPINB9-expressing NSCLC cells as we demonstrate here, these results would support the idea that SERPINB9-high cancer cells form a reservoir of relatively T cell-resistant cells that may be selectively enriched on ICB treatment. As an alternative or parallel process, SERPINB9 could be induced by ICB treatment, as suggested previously.30 We also observed SERPINB9 staining in non-cancer cells (amongst them immune cells), consistent with its role in other cell types, too.21 Thus, depending on the cell type SERPINB9 is expressed in (cancer cells vs. immune cells), it may contribute differently to ICB outcome.
In conclusion, while our findings merit further exploration of SERPINB9 as a therapeutic target to improve ICB response, they also suggest that its expression levels may be used to predict ICB response, which should be independently validated for possible clinical exploration.
Supplementary Material
Acknowledgments
We would like to thank the Schumacher lab for sharing the MART-1 TCR system. We thank our colleagues in the lab and Division for valuable input and discussion. We thank our collaborators Sonal Harbaran and Evelyn Chung for valuable input on SERPINB9 KO experiments. We thank Nils Visser for technical support. We would also like to thank the NKI Genomics Core facility for its contribution. Data from the VIB/KUL Grand challenge Pointillism cohort was supported by the VIB Grand challenge program.
Funding Statement
This work was supported by Bristol Myers Squibb (grant #OT123-440, TM285 PA23).
Author contributions
S.I.M., A.V.V. and D.S.P. conceived the study and designed the experiments. S.I.M. and A.M.T. performed the experiments. A.V.V. and S.I.M. performed bioinformatics analysis. K.H. and K.M. collected and provided NSCLC clinical samples. J.S. score IHC stainings. I.H. performed IHC stainings. J.P., E.L., Y.V.H., O.B., and C.M. provided scRNA-seq data. T.K. designed the HLA-A*02:01-MART1-mPlum plasmid. W.Z. provided valuable input on patient analysis. S.I.M., A.V.V. and D.S.P. wrote the manuscript. All authors read and approved the manuscript. The project was supervised by D.S.P.
Disclosure statement
D.S.P. is co-founder, shareholder and advisor of Immagene, which is unrelated to this study. D.S.P. received laboratory funding from BMS for this project.
Data availability statement
Data available within the article or its supplementary materials. Raw and processed RNA sequencing data generated for this study is available through GEO at https://www.ncbi.nlm.nih.gov/geo/query/acc.cgi?acc=GSE214992
Supplementary material
Supplemental data for this article can be accessed online at https://doi.org/10.1080/2162402X.2022.2139074
References
- 1.Upadhaya S, Neftelino ST, Hodge JP, Oliva C, Campbell JR, Yu JX.. Combinations take centre stage in PD1/PDL1 inhibitor clinical trials. Nature Reviews Drug Discovery. 2021;20(3): 168–11. doi: 10.1038/d41573-020-00204-y. [DOI] [PubMed] [Google Scholar]
- 2.Tang J, Yu JX, Hubbard-Lucey VM, Neftelinov ST, Hodge JP, Lin Y. The clinical trial landscape for PD1/PDl1 immune checkpoint inhibitors. Nat Rev Drug Discov. 2018;17(12):854–855. doi: 10.1038/nrd.2018.210. [DOI] [PubMed] [Google Scholar]
- 3.Hellmann MD, Paz-Ares L, Bernabe Caro R, Zurawski B, Kim S-W, Carcereny Costa E, Park K, Alexandru A, Lupinacci L, de la Mora Jimenez E, et al. Nivolumab plus ipilimumab in advanced non–small-cell lung cancer. New England Journal of Medicine. 2019;381(21):2020–2031. doi: 10.1056/nejmoa1910231. [DOI] [PubMed] [Google Scholar]
- 4.Kalbasi A, Ribas A. Tumour-intrinsic resistance to immune checkpoint blockade. Nat Rev Immunol. 2020;20(1):25–39. doi: 10.1038/s41577-019-0218-4. [DOI] [PMC free article] [PubMed] [Google Scholar]
- 5.Sharma P, Hu-Lieskovan S, Wargo JA, Ribas A. Primary, adaptive, and acquired resistance to cancer immunotherapy. Cell. 2017;168(4):707–723. doi: 10.1016/j.cell.2017.01.017. [DOI] [PMC free article] [PubMed] [Google Scholar]
- 6.Aggarwal C, Abreu DR, Felip E, Carcereny E, Gottfried M, Wehler T, Ahn M-J, Dolled-Filhart M, Zhang J, Shentu Y, et al. Prevalence of PD-L1 expression in patients with non-small cell lung cancer screened for enrollment in KEYNOTE-001. Annals of Oncology. 2016:10–24. doi: 10.1093/annonc/mdw378.14.26489443 [DOI] [Google Scholar]
- 7.Brody R, Zhang Y, Ballas M, Siddiqui MK, Gupta P, Barker C, Midha A, Walker J. PD-L1 expression in advanced NSCLC: insights into risk stratification and treatment selection from a systematic literature review. Lung Cancer. 2017;112:200–215. doi: 10.1016/j.lungcan.2017.08.005. [DOI] [PubMed] [Google Scholar]
- 8.Garon EB, Rizvi NA, Hui R, Leighl N, Balmanoukian AS, Eder JP, Patnaik A, Aggarwal C, Gubens M, Horn L, et al. Pembrolizumab for the treatment of non–small-cell lung cancer. New England Journal of Medicine. 2015;372(21):2018–2028. doi: 10.1056/nejmoa1501824. [DOI] [PubMed] [Google Scholar]
- 9.Wang F, Wang S, Zhou Q. The resistance mechanisms of lung cancer immunotherapy. Front Oncol. 2020. doi: 10.3389/fonc.2020.568059. [DOI] [PMC free article] [PubMed] [Google Scholar]
- 10.Hanahan D. Hallmarks of cancer: new dimensions. Cancer Discovery Cancer Discovery. 2022;12(1):31–46. doi: 10.1158/2159-8290.CD-21-1059. [DOI] [PubMed] [Google Scholar]
- 11.Smyth MJ, Dunn GP, Schreiber RD. Cancer immunosurveillance and immunoediting: the roles of immunity in suppressing tumor development and shaping tumor immunogenicity. Adv Immunol. 2006. doi: 10.1016/S0065-2776(06)90001-7. [DOI] [PubMed] [Google Scholar]
- 12.Boshuizen J, Vredevoogd DW, Krijgsman O, Ligtenberg MA, Blankenstein S, de Bruijn B, Frederick DT, Kenski JCN, Parren M, Brüggemann M, et al. (2020). Reversal of pre-existing NGFR-driven tumor and immune therapy resistance. Nature Communications. 10.1038/s41467-020-17739-8 [DOI] [PMC free article] [PubMed]
- 13.Vredevoogd DW, Kuilman T, Ligtenberg MA, Boshuizen J, Stecker KE, de Bruijn B, Krijgsman O, Huang X, Kenski JCN, Lacroix R, et al. Augmenting immunotherapy impact by lowering tumor TNF cytotoxicity threshold. Cell. 2019;178(3):585–599.e15. doi: 10.1016/j.cell.2019.06.014. [DOI] [PubMed] [Google Scholar]
- 14.Mak MP, Tong P, Diao L, Cardnell RJ, Gibbons DL, William WN, Skoulidis F, Parra ER, Rodriguez-Canales J, Wistuba II, et al. A patient-derived, pan-cancer EMT signature identifies global molecular alterations and immune target enrichment following epithelial-to-mesenchymal transition. Clinical Cancer Research. 2016;22(3):609–620. doi: 10.1158/1078-0432.CCR-15-0876. [DOI] [PMC free article] [PubMed] [Google Scholar]
- 15.Bladergroen BA, Meijer CJLM, Ten Berge RL, Hack CE, Muris JJF, Dukers DF, Chott A, Kazama Y, Oudejans JJ, Van Berkum O, et al. Expression of the granzyme B inhibitor, protease inhibitor 9, by tumor cells in patients with non-Hodgkin and Hodgkin lymphoma: a novel protective mechanism for tumor cells to circumvent the immune system? Blood. 2002;99(1):232–237. doi: 10.1182/blood.V99.1.232. [DOI] [PubMed] [Google Scholar]
- 16.Jiang L, Wang Y-J, Zhao J, Uehara M, Hou Q, Kasinath V, Ichimura T, Banouni N, Dai L, Li X, et al. Direct tumor killing and immunotherapy through anti-serpinB9 therapy. Cell. 2020;183(5):1219–1233.e18. doi: 10.1016/j.cell.2020.10.045. [DOI] [PMC free article] [PubMed] [Google Scholar]
- 17.Jiang P, Gu S, Pan D, Fu J, Sahu A, Hu X, Li Z, Traugh N, Bu X, Li B, et al. Signatures of T cell dysfunction and exclusion predict cancer immunotherapy response. Nat Med. 2018;24(10):1550–1558. doi: 10.1038/s41591-018-0136-1. [DOI] [PMC free article] [PubMed] [Google Scholar]
- 18.Jiang X, Orr BA, Kranz DM, Shapiro DJ. Estrogen induction of the granzyme B inhibitor, proteinase inhibitor 9, protects cells against apoptosis mediated by cytotoxic T lymphocytes and natural killer cells. Endocrinology. 2006;147(3):1419–1426. doi: 10.1210/en.2005-0996. [DOI] [PubMed] [Google Scholar]
- 19.Jiang X, Patterson NM, Ling Y, Xie J, Helferich WG, Shapiro DJ. Low concentrations of the soy phytoestrogen genistein induce proteinase inhibitor 9 and block killing of breast cancer cells by immune cells. Endocrinology. 2008;149(11):5366–5373. doi: 10.1210/en.2008-0857. [DOI] [PMC free article] [PubMed] [Google Scholar]
- 20.Abdullah Z, Saric T, Kashkar H, Baschuk N, Yazdanpanah B, Fleischmann BK, Hescheler J, Krönke M, Utermöhlen O. Serpin-6 expression protects embryonic stem cells from lysis by antigen-specific CTL. The Journal of Immunology. 2007;178(6):3390–3399. doi: 10.4049/jimmunol.178.6.3390. [DOI] [PubMed] [Google Scholar]
- 21.Bird CH, Christensen ME, Mangan MSJ, Prakash MD, Sedelies KA, Smyth MJ, Harper I, Waterhouse NJ, Bird PI. The granzyme B-Serpinb9 axis controls the fate of lymphocytes after lysosomal stress. Cell Death Differ. 2014;21(6):876–887. doi: 10.1038/cdd.2014.7. [DOI] [PMC free article] [PubMed] [Google Scholar]
- 22.Genova C, Chiara Dellepiane PC, Carrega P, Sommariva S, Ferlazzo G, Pronzato P, Gangemi R, Filaci G, Coco S, Croce M. Therapeutic Implications of Tumor Microenvironment in Lung Cancer: focus on Immune Checkpoint Blockade. Front Immunol. 2021:12. doi: 10.3389/fimmu.2021.799455. [DOI] [PMC free article] [PubMed] [Google Scholar]
- 23.Gettins PGW. 2002. Serpin structure, mechanism, and function. Chemical Reviews [DOI] [PubMed] [Google Scholar]
- 24.Lambrechts D, Wauters E, Boeckx B, Aibar S, Nittner D, Burton O, Bassez A, Decaluwé H, Pircher A, Van den Eynde K, et al. Phenotype molding of stromal cells in the lung tumor microenvironment. Nat Med. 2018;24(8):1277–1289. doi: 10.1038/s41591-018-0096-5. [DOI] [PubMed] [Google Scholar]
- 25.Kim K-T, Lee HW, Lee H-O, Kim SC, Seo YJ, Chung W, Eum HH, Nam D-H, Kim J, Joo KM, et al. Single-cell mRNA sequencing identifies subclonal heterogeneity in anti-cancer drug responses of lung adenocarcinoma cells. Genome Biol. 2015;16(1). doi: 10.1186/s13059-015-0692-3. [DOI] [PMC free article] [PubMed] [Google Scholar]
- 26.Bladergroen BA, Strik M?, Wolbink AM, Wouters D, Broekhuizen R, Kummer J?, Hack C?. The granzyme B inhibitor proteinase inhibitor 9 (PI9) is expressed by human mast cells. Eur J Immunol. 2005;35(4):1175–1183. doi: 10.1002/eji.200425949. [DOI] [PubMed] [Google Scholar]
- 27.Mangan MS, Vega-Ramos J, Joeckel LT, Mitchell AJ, Rizzitelli A, Roediger B, Kaiserman D, Weninger WW, Villadangos JA, Bird PI. Serpinb9 is a marker of antigen cross-presenting dendritic cells. Mol Immunol. 2017;82:50–56. doi: 10.1016/j.molimm.2016.12.011. [DOI] [PubMed] [Google Scholar]
- 28.Kim N, Kim HK, Lee K, Hong Y, Cho JH, Choi JW, Lee J, Suh I, L Y, Ku BM, et al. Single-cell RNA sequencing demonstrates the molecular and cellular reprogramming of metastatic lung adenocarcinoma. Nat Commun. 2020. doi: 10.1038/s41467-020-16164-1. [DOI] [PMC free article] [PubMed] [Google Scholar]
- 29.Jerby-Arnon L, Shah P, Cuoco MS, Rodman C, Su M-J, Melms JC, Leeson R, Kanodia A, Mei S, Lin J-R, et al. A cancer cell program promotes t cell exclusion and resistance to checkpoint blockade. Cell. 2018;175(4):984–997.e24. doi: 10.1016/j.cell.2018.09.006. [DOI] [PMC free article] [PubMed] [Google Scholar]
- 30.Kummer JA, Micheau O, Schneider P, Bovenschen N, Broekhuizen R, Quadir R, Strik MCM, Hack CE, Tschopp J. Ectopic expression of the serine protease inhibitor PI9 modulates death receptor-mediated apoptosis. Cell Death Differ. 2007;14(8):1486–1496. doi: 10.1038/sj.cdd.4402152. [DOI] [PubMed] [Google Scholar]
- 31.Medema JP, De Jong J, Peltenburg LTC, Verdegaal EME, Gorter A, Bres SA, Franken KLMC, Hahne M, Albar JP, Melief CJM, et al. Blockade of the granzyme B/perforin pathway through overexpression of the serine protease inhibitor PI-9/SPI-6 constitutes a mechanism for immune escape by tumors. Proceedings of the National Academy of Sciences of the United States of America. 2001. 10.1073/pnas.201398198. [DOI] [PMC free article] [PubMed] [Google Scholar]
- 32.Luo H, Ma C, Haass NK. Identification of prognostic genes in uveal melanoma microenvironment. PLOS ONE PLoS ONE. 2020;15(11):e0242263. doi: 10.1371/journal.pone.0242263. [DOI] [PMC free article] [PubMed] [Google Scholar]
- 33.Vycital O, Pitule P, Hosek P, Kriz T, Treska V, Liska V. Expression of serpin B9 as a prognostic factor of colorectal cancer. Anticancer Research. 2019;39:6063–6066. doi: 10.21873/anticanres.13813. [DOI] [PubMed] [Google Scholar]
- 34.Zhou B, Chen E, Chen J, Zhang J, Zhang N, Chen Z. Overexpression of proteinase inhibitor 9 is associated with poor prognosis in human hepatocellular carcinoma and with proliferation and apoptosis in HepG2 cells in vitro. Int J Clin Exp Pathol. 2019;12:3719–3727. [PMC free article] [PubMed] [Google Scholar]
Associated Data
This section collects any data citations, data availability statements, or supplementary materials included in this article.
Supplementary Materials
Data Availability Statement
Data available within the article or its supplementary materials. Raw and processed RNA sequencing data generated for this study is available through GEO at https://www.ncbi.nlm.nih.gov/geo/query/acc.cgi?acc=GSE214992