

Abstract
Chronic fatigue is a debilitating disorder with widespread consequences, but effective treatment strategies are lacking. Novel genetic mouse models of fatigue may prove invaluable for studying its underlying physiological mechanisms and for testing treatments and interventions. In a screen of voluntary wheel-running behavior in N-ethyl-N-nitrosourea mutagenized C57BL/6J mice, we discovered two lines with low body weights and aberrant wheel-running patterns suggestive of a fatigue phenotype. Affected progeny from these lines had lower daily activity levels and exhibited low amplitude circadian rhythm alterations. Their aberrant behavior was characterized by frequent interruptions and periods of inactivity throughout the dark phase of the light-dark cycle and increased levels of activity during the rest or light phase. Expression of the behavioral phenotypes in offspring of strategic crosses was consistent with a recessive inheritance pattern. Mapping of phenotypic abnormalities showed linkage with a single locus on chromosome 1, and whole exome sequencing identified a single point mutation in the Slc2a4 gene encoding the GLUT4 insulin-responsive glucose transporter. The single nucleotide change (A to T, which we named “twiggy”) was in the distal end of exon 10 and resulted in a premature stop (Y440*). Additional metabolic phenotyping confirmed that these mice recapitulate phenotypes found in GLUT4 knockout mice. However, to our knowledge, this is the first time a mutation in this gene has been shown to result in extensive changes in general behavioral patterns. These findings suggest that GLUT4 may be involved in circadian behavioral abnormalities and could provide insights into fatigue in humans.
Keywords: mutagenesis screen, fatigue, GLUT4, mouse model, sleep, voluntary wheel-running activity
INTRODUCTION
Chronic fatigue syndrome (CFS) is a debilitating disorder characterized by intense fatigue that persists for 6 months or more, that does not improve with rest, and that may be exacerbated by physical activity or mental exertion1–5. CFS is associated with increased disability, impaired functioning, and increased mortality6–8. Its negative impact on overall quality of life advocates the need for adequate and effective treatments; therefore, the development of appropriate animal models to study the underlying mechanisms of fatigue is crucial9,10.
The mouse is an ideal model organism to investigate physiological and neurological pathways involved in fatigue10,11. Currently there are several mouse models of fatigue, including those based on forced activity (e.g., treadmill or swimming), neurodegenerative disorders (e.g., Parkinson’s or Huntington’s disease), cancer and its treatments, aging, or immune challenge12–18. Although the psychological and emotional aspects of fatigue may be difficult to study in mice, alterations in behavior, such as voluntary wheel running, allow for measurable outcomes that mimic the reduced voluntary physical activity exhibited by humans with fatigue10. Moreover, wheel running is a robust behavior in rodents and is amenable to quantitative analysis11,19,20. Some characteristics that may imply fatigue in mice include reduced daily amount of activity, changes in pattern or day-night distribution, a lack of consolidated running with an increase in the number of distinct bouts, or a delayed onset or shortened duration of the daily active phase10,14,17,18.
There is ample evidence of a genetic basis for the development and manifestation of CFS21–24. Polymorphisms in several genes (e.g., the adrenergic receptor a1 (ADRA1A), the serotonin transporter (SLC6A4) or receptor (HTR2A), tyrosine hydroxylase (TH), corticosteroid-binding globulin (CBG), corticotropin releasing hormone receptor 1 (CRHR1), the cytokine IL-1B, neuronal PAS domain protein 2 (NPAS2), the nuclear receptor subfamily 3; group C, member 1 glucocorticoid receptor (NR3C1), and the glutamate receptor - ionotropic kinase 2 (GRIK2) have all been linked to either the occurrence or the severity of fatigue symptomology in humans25–31. Furthermore, a recent study comparing CFS patients to healthy controls identified 442 additional candidate genes associated with CFS32. In addition, mice with mutations in several genes have shown phenotypes consistent with fatigue (e.g., corticosteroid-binding globulin (Cbg), recombinase activating gene 2 (Rag2), and interleukin-10 (Il10))33–35.
Random mutagenesis paired with forward genetic screening has been an indispensable tool for establishing and expanding our understanding of gene function in an unbiased manner36–45. In this study, we systematically screened randomly N-ethyl-N-nitrosourea (ENU) mutagenized mice on running wheels in search of lines exhibiting alterations in voluntary wheel-running activity consistent with fatigue as part of a larger phenotype-driven mouse mutagenesis project46. We describe the identification of two independent lines of mice stemming from a single mutagenized founder showing profound alterations in the amount, pattern, and distribution of daily wheel running as a result of a single point mutation (twiggy; MGI:5805978) in Slc2a4, the gene encoding the insulin-responsive glucose transporter, GLUT4. To our knowledge, this is the first description of impaired functioning of this gene resulting in extensive behavioral abnormalities, and this mouse may represent a novel model for studying human fatigue.
MATERIALS AND METHODS
Animals and Housing
All mice were group-housed in standard mouse cages under a 12:12 LD cycle (lights on at 6:00 AM) with water and regular mouse chow (2018 Teklad Global 18% Protein Rodent Diet, Envigo, Madison, WI, USA) available ad libitum, unless otherwise stated. Mice were produced in our colony from strategic crosses or were ordered from an in-house breeding core facility (Mouse Breeding Core, Wakeland lab, UT Southwestern Medical Center, Dallas, TX, USA), which orders its breeding mice from Jackson Labs (Bar Harbor, ME, USA). Some WT C57BL/6J mice were also directly ordered from Jackson Labs (Stock Number 000664). The generation of the original ENU mutagenized screening population and body weight screen was done at Northwestern University, and all behavioral and subsequent phenotypic characterizations were performed at the University of Texas Southwestern Medical Center. The Slc2a4twiggy line has been donated to Jackson Labs (C57BL/6J-Slc2a4twiggy/J, Stock Number 029699). The Institutional Animal Care and Use Committee (IACUC) of Northwestern University and the University of Texas Southwestern Medical Center approved all animal procedures.
ENU mutagenesis and Phenotypic Screening
The generation of N-Ethyl-N-nitrosourea (ENU; Sigma; catalog #N3385) mutagenized mice and their progeny for initial high-throughput screening was described previously46. Briefly, male C57BL/6J mice (~6 weeks of age) were injected with 250 mg/kg of ENU. Following a recovery period of ~6 weeks, these mice were crossed with WT C57BL/6J females to produce generation 1 (G1) males which were again crossed to WT C57BL/6J females to produce G2 females. These G2 females were backcrossed to their G1 fathers to produce G3 mice of both sexes used for phenotype screening.
More advanced generations of mice, further removed from the original G0 founders, were used for the more in depth behavioral phenotypic screening. Progeny of selected lines of mice that were at least 8 weeks old were individually housed in standard polycarbonate mouse cages (Fischer Scientific; catalog # 01-288-1B and 01-288-21) containing a 4.75” diameter stainless steel running wheel placed inside isolation cabinets containing 12 to 24 cages each, as described previously20. Temperature and humidity were monitored throughout, and the mice were initially recorded under a 12:12 LD cycle (green LEDs, ~100 lux at the level of the cage floor). Following the initial 3 weeks of testing under 12:12 LD, selected individual progeny from specific crosses were tested under constant darkness (DD) or constant light (LL) conditions. Wheel-running behavior was recorded using ClockLab Data Acquisition Software (Actimetrics Inc., Wilmette, IL, USA). Wheel-running data, specifically total daily amount, number of daily bouts (defined as a period during which the activity never falls below 10 wheel revolutions/minute for longer than 20 min), and percentage of activity occurring in the light during LD recording, as well as total daily amount of activity, free-running period, and amplitude of the rhythm recorded in DD, were quantified using ClockLab Analysis Software (Actimetrics Inc., Wilmette, IL, USA). For all data quantification, recording days 6–15 under LD and 31–40 under DD were used. All wheel-running cages, food and water bottles were changed every 21 days.
Behavioral Time-Lapsed Photography and Video Recording
I-x (N2F14 and N2F15) and C57BL/6J WT mice were housed in individual running-wheel cages as described above. Using a Sony Handycam DCR-HC62 camera with an LED IR light source, photographs were taken at 1 min intervals beginning at lights off (18:00) for 15h. The resulting pictures were scored from 1 to 9 for the behavioral state or cage location depicted in each. The scores used were: 1) drinking, 2) eating, 3) near the food hopper, 4) on the wheel running, 5) near the wheel awake, 6) end of the cage awake, 7) end of the cage resting, 8) near the wheel quiescent, and 9) end of the cage quiescent. These scores were plotted in ethograms according to the time at which each picture was taken.
Video recording of 3 I-x (N2F21) mice, and mice from two different test crosses (T-x (N3F2) n=2 and T-x (N11F3) n=3), was done under the same IR light source described above using the same Sony Handycam camera with Sony Premium Mini DV Cassettes (DVM60 ME LP:90) from 20:00 to 21:30 (i.e., 2h to 3.5h into the dark phase). Wheel running was recorded throughout this period as described above. The resulting video was scored for behavioral quiescence suggestive of sleep by two researchers blind to mouse identity. Periods of immobility with lowered posture lasting longer than 40 consecutive seconds were scored as behavioral quiescence47.
Body Weight, Fasting Blood Glucose, Health Assessment, and Tissue Collections
All mice produced in our colony were weighed at specific ages throughout development. At weaning, and at regular intervals thereafter, mice were visually inspected for general health and wellness. For the determination of blood glucose levels, mice were fasted for 4h during the middle of the light phase (a time when mice do not normally eat). Body weights were measured at the beginning and the end of the 4h fast, and blood glucose was determined from a small droplet of blood taken from the tip of the tail, using the Precision Xtra blood glucose meters and glucose test strips (Abbott Diabetes Care Inc., Almeda, CA, USA). At the end of experiments and phenotypic characterization, mice were euthanized with CO2 followed by cervical dislocation. In some cases, tissues (tails, spleens, and hearts) were collected for weighing or DNA extraction followed by genotyping.
Mapping
Affected mice from the I-x and B/Int-x lines were selected and crossed with WT C57BL/10J mice (Stock Number 000665, Jackson Labs, Bar Harbor, ME, USA) to produce mapping (M-x) F1 mice that were intercrossed to produce F2 progeny. Additional crosses of WT C57BL/6J and C57BL/10J were also set up to produce control (WTB6B10) F1 and F2 mice. All mice produced were individually housed in running-wheel cages after 8 weeks of age and their behavior was recorded in LD (for 3 weeks) and DD (for 3 weeks) as described above. Following behavioral testing, mice were euthanized and spleens were collected, frozen onto dry ice, and then stored at −80°C. Spleen DNA from 74 selected mice (half presumptive homozygous mutants and half presumptive WTs or heterozygotes) was extracted using phenol chloroform genomic DNA extraction method. The final DNA pellet was suspended in RNAse free H2O. Concentrations were determined with a NanoDrop spectrophotometer, and DNA was genotyped using Taqman probes on Fluidigm platform using the 96.96 chip according to manufacturer instructions as described previously48. QTL linkage analysis was performed using R/QTL as described previously48,49. Genotyping failed for one spleen sample, and these data were subsequently removed from further analyses.
Whole Exome Sequencing
Test crosses (T-x) of affected, presumably homozygous B/Int-x (N11F2) were set up to produce homozygous T-x (N11F3) progeny. Following phenotype recording on wheels, mice were euthanized and spleens were collected from 16 representative T-x (N11F3) individuals and 16 representative I-x (N2F20) mice. Spleens were quickly frozen on dry ice and were then stored at −80°C until DNA was extracted using the Gentra Puregene Mouse Tail/Tissue Kit (Catalog number 158906 - Cell Lysis Solution, 158918 - Puregene Proteinase K, 158922 - RNase A Solution, and 158910 - Protein Precipitation Solution; Qiagen, Germantown, MD, USA) according to manufacturer instructions. DNA was dissolved in sterile RNAse free H2O and concentrations were determined using a NanoDrop spectrophotometer (ND-2000, ThermoFisher Scientific, Waltham, MA, USA) and Qubit 2.0 fluorometric quantitation (Q32866, ThermoFisher Scientific, Waltham, MA, USA). DNA samples for the 16 individuals of each of the two lines were pooled into two samples that were used for whole exome sequencing.
Whole-exome capture, sequencing, and analysis were performed by the UT Southwestern McDermott Center Next-Generation Sequencing and Bioinformatics Core. After initial DNA quality assessment on a 1.8% agarose gel and concentration quantification using a Qubit 3.0 Fluorometer (Invitrogen, Carlsbad, CA USA), fragment libraries were prepared using SureSelectXT2 HSQ Reagent Kit (Agilent Technologies, Inc., Santa Clara, CA, USA). Samples were sheared on the Covaris S-2 sonicator (Covaris, Woburn, MA, USA) and end-repaired, after which the 3’ ends were adenylated and barcoded with pre-capture indexing adapters. Following amplification and purification, the sizes of the fragment libraries were assessed on the Agilent 2100 BioAnalyzer (Agilent Technologies, Inc., Santa Clara, CA, USA) and concentrations were once again determined by Qubit fluorometric quantitation. Samples were pooled in equimolar amounts and captured with the SureSelectXT2 Target Enrichment System for Mouse (Agilent Technologies, Inc., Santa Clara, CA, USA), followed by a final Qubit concentration quantification, and were run on the Illumina NextSeq 500 platform (Illumina Inc., San Diego, CA, USA) using 150PE SBS v2 chemistry. Sequence reads were mapped to the Genome Reference Consortium GRCm38 reference genomic sequence for C57BL/6J using BWA50. Both samples resulted in mean coverage greater than 120X. Variants were called using the Genome Analysis ToolKit (GATK)51, and annotated using snpEff52. Reads were visualized and plotted using the Broad Institute Integrative Genomics Viewer (IGV) to detect homozygous mutations present in both samples.
Genotyping
NaOH-extracted DNA from tail samples taken at weaning from progeny of selected crosses was genotyped for the presence of the twiggy mutation with real-time PCR to detect the SNP using the following primers: Slc2a4 Forward (ccagagaccacctacatggc) Slc2a4 WTReverse (GTCGGCATGGGTTTCCAGaAT) and Slc2a4 MutantReverse (GTCGGCATGGGTTTCCAGaAa). PCR reactions were done in a 10 μl volume using ~10 ng genomic DNA template with KAPA SYBR Fast ABI Prism 2X qPCR Master Mix (KK4617; KAPA Biosystems, Wilmington, MA, USA), on an ABI 7900HT Fast Real-Time PCR Machine (Applied Biosystem, Inc., Foster City, CA, USA) using MicroAmp 384-well Optical Reaction Plates (Applied Biosystems, Inc., Foster City, CA, USA) with the following thermo-cycling conditions: 95°C for 3 min followed by 40 cycles of 95°C for 3 sec and 62°C for 20 sec.
Glucose Tolerance Test
Progeny of select crosses were fasted for 4h during the middle of the light phase (a time when mice do not normally eat). Body weights were measured at the beginning and the end of the 4h fast, and initial blood glucose was determined from a small droplet of blood taken from the tip of the tail using the Precision Xtra blood glucose meters and glucose test strips (Abbott Diabetes Care Inc., Almeda, CA, USA). Mice were then given an I.P. injection of 10% sterile glucose solution (1 g/kg; Sigma-Aldrich, St. Louis, MO, USA), and blood glucose values were measured again at 15, 30, 45, 60, and 120 min post injection.
Endurance Treadmill Test
To test exercise endurance capacity, mice of both sexes from selected crosses were run on a progressive treadmill running protocol. The mice were acclimatized to the motorized treadmill (Animal Treadmill Exer-3/6, Columbus Instruments, Columbus, OH, USA) for two days prior to the endurance test. Day 1 of acclimatization lasted 20 min consisting of 5 min on the treadmill at rest (0 m/min), 5 min at 8 m/min, 5 min at 10 m/min, followed by 5 min of rest (0 m/min). Day 2 also lasted 20 min and consisted of 5 min on the treadmill at rest (0 m/min), 5 min at 10 m/min, 5 min at 12 m/min, followed by 5 min of rest (0 m/min). On day 3, mice performed the endurance test to exhaustion, defined as when the mouse spent more than 5 sec on the shock grid (0.1 mA x163 V and 1 Hz) without re-engaging with the treadmill, as described previously53. The mice ran at a speed of 10 m/min for the first 40 min, then the rate was increased at 1 m/min every 10 min until the speed reached 13 m/min, at which point the speed was increased at a rate of 1 m/min every 5 min until exhaustion. Mice were then removed from the treadmill and blood glucose and lactate were immediately measured from tail blood using hand-held analyzers for glucose (Bayer Contour Blood Glucose Meter, Ascensia Diabetes Care US, Inc., Parsippany, NJ, USA) and lactate (Nova Biomedical Lactate Plus Meter, Waltham, MA, USA). Mice were euthanized by decapitation, and muscles were rapidly dissected and frozen on dry ice. All tissues were stored at −80°C until used.
Western Blotting
Frozen gastrocnemius muscles collected from mice following the treadmill study were homogenized in ice-cold lysis buffer composed of T-PER® buffer (#78510, ThermoFisher Scientific, Waltham, MA, USA), 1% (v/v) of protease inhibitors cocktail (P8340–5ML, Sigma-Aldrich, St. Louis, MO, USA), and phosphatase inhibitors cocktail 2 and 3 (P5726–5ML and P0044–5ML, Sigma-Aldrich, St. Louis, MO, USA). Samples were homogenized using TissueLyser II homogenizer (Qiagen Inc., Valencia, CA, USA). Homogenates were then solubilized by constant rotation for 1h at 4°C, and 10 min × 1,000 g at 4°C. Protein concentration of the supernatant was determined via the Pierce BCA protein assay kit (#23225, ThermoFisher Scientific, Waltham, MA, USA). Samples were then stored at −80°C until further analysis. Equal amounts of total protein (20 μg) per sample were diluted with appropriate volume of Laemmle sample buffer (2X concentrated; 4% SDS, 10% 2-mercaptoethanol, 20% glycerol, 0.004% bromophenol blue and 0.125 M pH6.8 Tris-HCl), heated for 5 min at 95°C, separated via SDS-PAGE, and transferred to nitrocellulose (Trans-blot turbo, Bio-Rad, Hercules, CA, USA). Membranes were incubated with the appropriate primary (GLUT4 #2213 and β-Actin #3700, Cell Signaling Technologies, Danvers, MA, USA) and fluorescent secondary antibodies (IRDye 680 Goat anti-Mouse IgG, Li-Cor Bioscience, Lincoln, NE, USA). Protein band fluorescence was quantified via Li-Cor Odessy Image studio Version 4.0 (Li-Cor Bioscience, Lincoln, NE, USA). Individual values are relative to the mean of all sample values within the same membrane, and equal loading was confirmed and normalized to the immuno-reactivity of β-Actin.
Data Analysis and Statistics
All data analysis and data plots generated using Prism 6 (GraphPad Software, Inc., La Jolla, CA, USA). Statistical comparisons were made using student’s t-tests or ANOVA with post hoc analyses to compare groups. Tests with p < 0.05 were deemed statistically significant. Unless otherwise stated, all values plotted are presented as mean ± SD, with statistical results presented as * = p < 0.05, ** = p < 0.01, *** = p < 0.001 and **** = p < 0.0001.
RESULTS
Abnormal, low amplitude voluntary wheel-running activity patterns in an ENU-mutagenized mouse line (twiggy)
In a voluntary wheel-running screen designed to isolate mice with heritable abnormal patterns of behavior, we identified two lines of mice showing abnormal activity (Fig. 1 and Fig. S1). These two lines both stemmed from a single, third generation (G3) founder female previously identified as having low body weight (Fig. S1 a), which we named ‘twiggy’ and which was backcrossed to wild-type (WT) C57BL/6J to produce N2 progeny (Fig. S1 b–d). N2 progeny of the twiggy G3 founder female showed body weights within the normal range, but an intercross of N2 mice (N2F2) produced a subset (8 out of 57) that showed a low body weight phenotype (Fig. S1 b). A subsequent backcross of affected N2F2 mice to C57BL/6J mice produced male and female N3 progeny that were unaffected, indicating that the phenotype is expressed in a non-sex-linked, recessive inheritance pattern. Despite low body weights and overall smaller appearance, affected animals appeared otherwise healthy and there was no obvious effect on reproductive fitness.
Fig. 1: Mice from two ENU lines show abnormal, low amplitude voluntary wheel-running activity patterns.
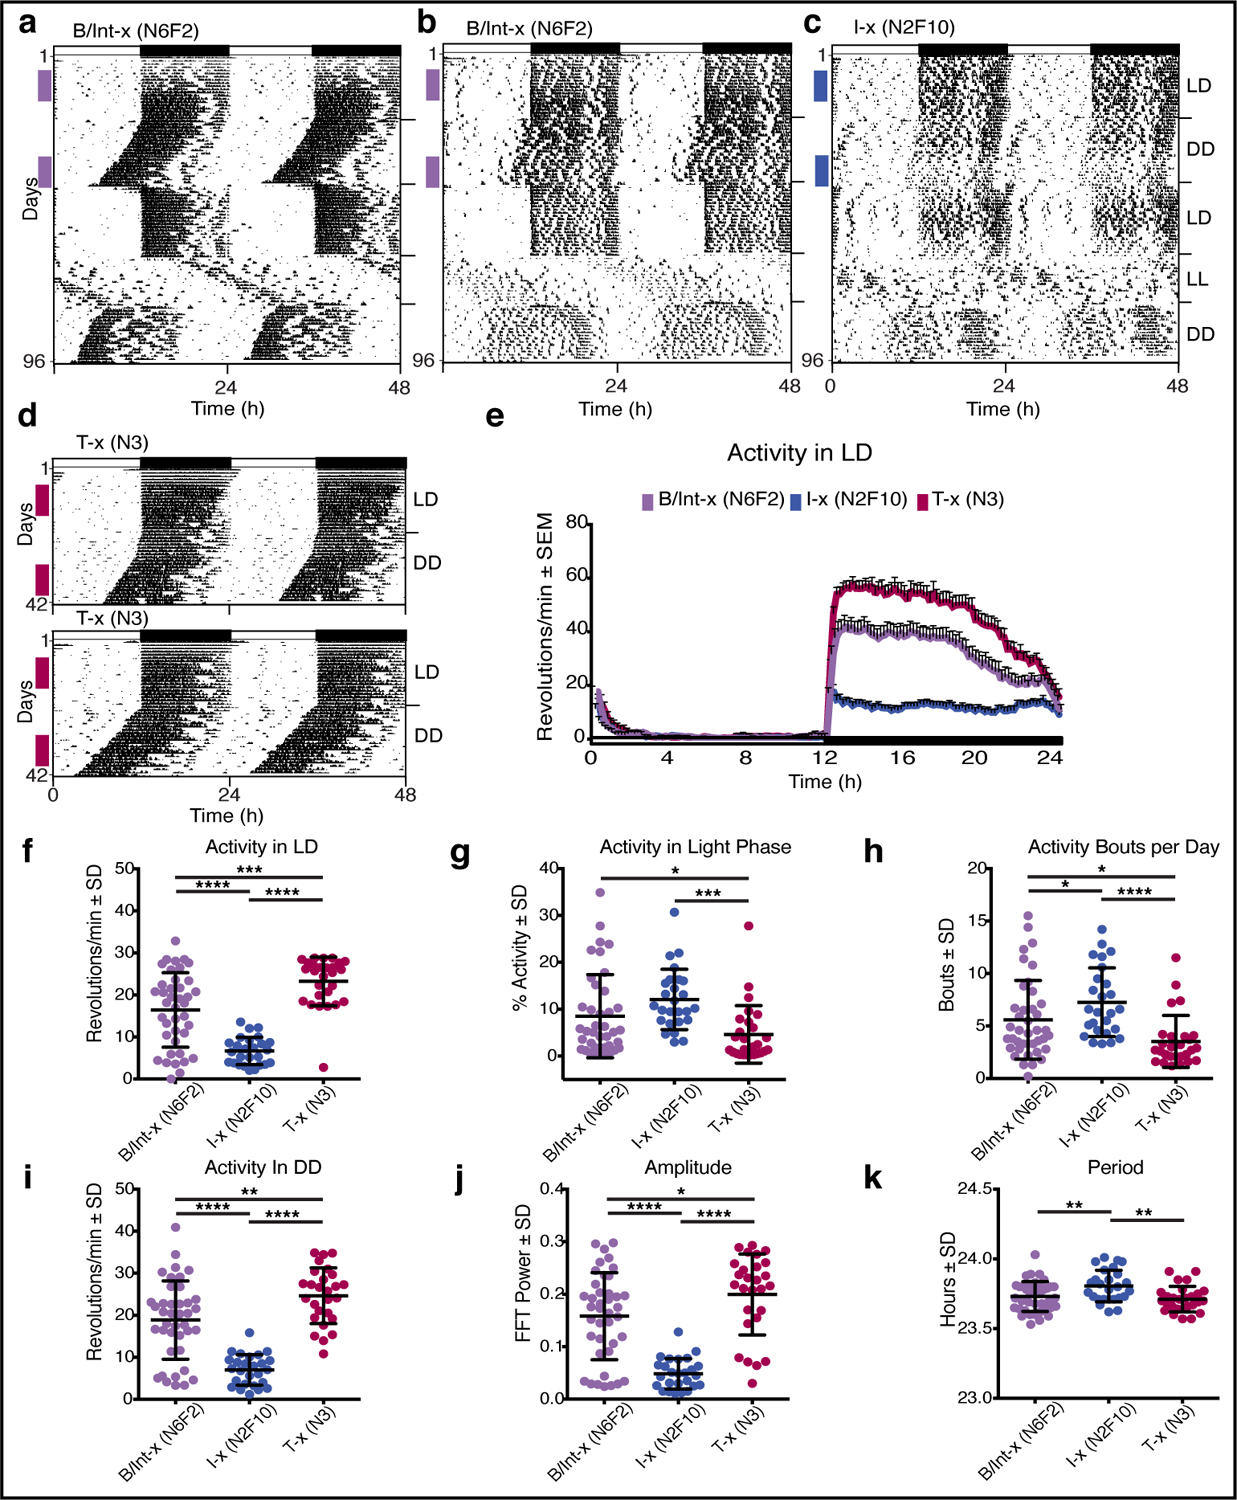
Circadian activity patterns are double plotted for ease of visualization, with each horizontal line representing 48h and successive days (1–96) plotted along the Y-axis. Wheel revolutions are depicted as black marks on the horizontal lines. Mice were initially recorded under a 12h light:12h dark (LD) cycle shown in the bar across the top of the graph (black = dark phase). After 3 weeks, mice were recorded in constant darkness (DD) for 3 weeks, in 12:12 LD for 3 weeks, in constant light (LL) for 2 weeks and a final 2 weeks in DD (indicated on right Y-axis). Colored vertical bars on the left side of each actogram indicate days used for quantification of wheel-running behavior. (a) Representative actogram of a B/Int-x (N6F2) mouse showing normal wheel running activity and a normal nocturnal pattern during recording under LD with high levels of activity concentrated in the dark phase and low activity during the light phase. In DD, the rhythm free-runs with a period of ~23.7h, re-entrains normally upon reintroduction of the LD cycle, and free-runs with a lengthened period under LL. (b) Representative actogram of a B/Int-x (N6F2) showing an abnormal circadian activity pattern. (c) Representative actogram of an I-x (N2F10) mouse showing an abnormal circadian activity pattern (d) Representative actograms of two T-x (N3) mice recorded for 3 weeks in LD followed by 3 weeks in DD. (e) Average waveforms for activity recorded in LD for mice in the B/IntX (N6F2; n=40), I-x (N2F10; n=26), and T-x (N3; n=27) groups. The LD cycle is shown in the bar across the bottom of the graph with lights off from 12 to 24 indicated in black. (f) Average number of wheel revolutions per min over 24h, (g) % of daily activity occurring in the light phase, and (h) number of discreet bouts of activity occurring each day during recording under LD for mice in the B/IntX (N6F2; n=40), I-x (N2F10; n=26), and T-x (N3; n=27) groups. (i) Average number of wheel revolutions per min over 24h, (j) amplitude, and (k) period of the wheel-running rhythms recorded in DD for these same mice. Means ± SD with individual data points are plotted with significant differences among groups indicated (* p < 0.05, ** p < 0.01, *** p < 0.001, **** p < 0.0001).
Mice were maintained in two distinct lines following initial heritability testing (Fig. S1 c, d; Table S1). The first was a backcross/intercross (B/Int-x) line generated and maintained by backcrossing affected (presumably homozygous) mice to C57BL/6J, and then intercrossing the resulting offspring, producing alternating generations of obligate heterozygous carrier “B/Int-x (N#)” mice, and “B/Int-x (N#F2)” mice of all 3 possible genotypes (+/+, +/m, and m/m; Fig. S1 c, d – left panels; Table S1; where N# denotes the number of backcross generations). The second was an in-cross (I-x) line generated and maintained by crossing affected siblings with each other over successive generations beginning with the first N2F2 progeny shown in Fig. S1 b, to produce homozygous lines (Fig. S1 c, d – right panels). The body weights of 8 sequential generations of each line are shown in Fig. S1 c (males) and d (females); and, while all 8 I-x generations show body weights lower than the screening mean, mice in the B/Int-x show a distinct generation-alternating pattern.
Because of the low body weights, we measured fasting blood glucose from individuals of both the B/Int-x and I-x lines. Although body weights following a 4h fast were lower for both males (t(42)=7.139, p<0.0001) and females (t(50)=4.241, p<0.0001) of the I-x line than those of the B/Int-x line (Fig. S1 e), there was no difference between the two lines in fasting blood glucose (Fig. S1 f). Values for all mice tested were within the normal blood glucose range for WT mice reported by Jackson Labs (Center for Genome Dynamics; CGDpheno1 glucose (plasma GLU, 4h fast); phenome.jax.org).
When mice stemming from these lines were housed in cages with free access to a running wheel, 9 out of 40 mice in the B/Int-x (N6F2) line showed a hypoactive and disrupted pattern of voluntary wheel-running activity. Representative activity plots (actograms) of two mice of the B/Int-x (N6F2) line are shown in Fig. 1, with one exhibiting normal levels and patterns of activity (Fig. 1 a) and one showing the abnormal phenotype (Fig. 1 b). In contrast, all of the mice in the I-x (N2F10) line showed the aberrant behavioral pattern (Fig. 1 c), consisting of low activity levels, increased bouts of activity during the light or rest phase, non-consolidated or disrupted nocturnal activity, and irregular onset of nocturnal activity bouts. When affected mice from the I-x (N2F10) line were backcrossed to C57BL/6J mice in a test cross (T-x (N3); Table S1), none of the progeny showed the phenotype, and circadian wheel-running behavior was indistinguishable from that of WT mice (Fig. 1 d). Average waveforms of 10 days of recording under a light-dark (LD) cycle clearly show that overall wheel-running activity was decreased in mice of the I-x (N2F10) line (Fig. 1 e).
Quantification of activity recorded during the LD cycle, revealed significant differences among progeny of the three types of crosses, with mice of the I-x (N2F10) line showing lower overall activity (Fig. 1 f; t(90)=5.681 vs. B/Int-x; t(90)=8.831 vs. T-x, both p<0.0001), higher levels of activity during the light phase (Fig. 1 g; t(90)=3.608 vs. T-x, p<0.001), and more activity bouts (Fig. 1 h; t(90)=2.025 vs. B/Int-x, p<0.05; t(90)=4.132 vs. T-x; p<0.0001). Differences in activity were maintained when mice were recorded in constant darkness (DD; Fig. 1 I t(90)=6.416 vs. B/Int-x; t(90)=8.753 vs. T-x, both p<0.0001), and the amplitude of the wheel running rhythm in affected mice was lower than in unaffected mice (Fig. 1 j; t(90)=6.209 vs. B/Int-x; t(90)=7.831 vs. T-x, both p<0.0001). The period of the free-running circadian rhythms recorded in DD was also longer for mice of the I-x (N2F10) line (Fig. 1 k; t(90)=2.848 vs. B/Int-x; t(90)=3.264 vs. T-x, both p<0.01), although these values fall within the normal range for WT mice19.
Frequent rest interrupts nocturnal wheel-running activity in twiggy mice
In order to further characterize the abnormal behavioral patterns exhibited by these mouse lines, we assessed their behavioral profiles during the dark phase using time-lapsed photography (Fig. 2). Images were captured once every min for 15h beginning at the start of the dark phase for male WT (n=2) C57BL/6J (Fig. S2) and I-X (N2F14; n=5) mice (Fig. S3) and were scored on a range of 9 behavioral states. The ethogram of scored behaviors for a representative WT mouse shows extended periods of wheel running (as indicated by sequential images showing running behavior) with short interruptions for drinking, eating, and general cage activity (Fig. 2 a). This mouse only adopted a body posture consistent with sleep during the end of the end of the dark phase (i.e., after 3:00 h). The amount of time spent in the various behaviors for the first 6h of the dark phase (18:00 – 0:00 h) are represented in a pie chart for this individual mouse (Fig. 2 c) and averaged for 2 WT mice (Fig. 2 d). The pattern of behaviors shown by the representative I-x (N2F14) mouse (Fig. 2 b) did not resemble those recorded for WT mice. Consolidated, extended periods of wheel running were absent, and running was frequently interrupted with periods of time when the mouse was near the wheel, but inactive and in low, crouched posture suggestive of sleep. Although there were no other signs of distress in these mice, we could not rule out the possibility of other altered behavioral states (such as coma, seizure, or cataplexy), therefore; we categorized these states as “behavioral quiescence”. The distribution of behaviors for the first 6h of the dark phase (18:00 – 0:00 h) is shown for this mouse (Fig. 2 e), and for all 5 I-x (N2F14/15) mice (Fig. 2 f). Most notably, running was decreased for these mice compared to WT (Fig. 2 g, top; t(5)=8.906, p<0.001). Even more surprising, all 5 I-X (N2F14/15) mice showed quiescent postures during the first 6h, whereas WT mice were never observed to do this (Fig. 2 g, bottom; t(5)=4.084, p<0.01).
Fig. 2: Nocturnal wheel-running activity is interrupted by frequent periods of rest in affected mice.
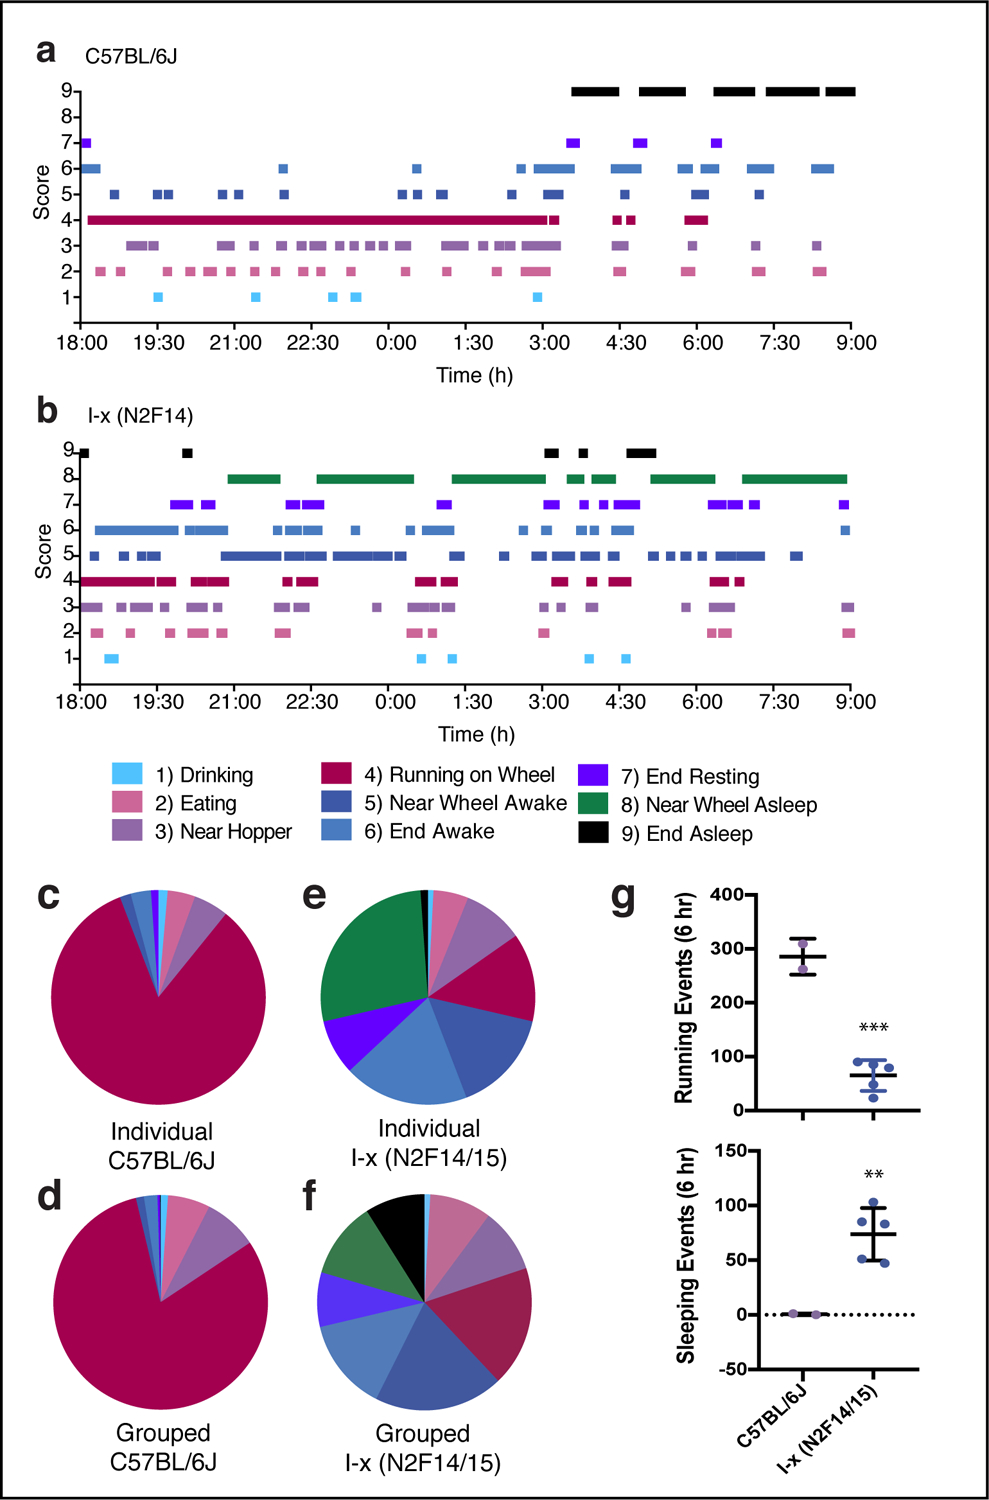
Ethogram depicting behaviors, states or locations observed in images captured once every min for 15h beginning at lights off for (a) a WT C57BL/6J and (b) an I-x (N2F14) mouse, with time plotted along the X-axis. Each photograph was scored on a 9 item scale using the following designations: 1) drinking, 2) eating, 3) near hopper, 4) running on wheel, 5) near wheel awake, 6) end awake, 7) end resting, 8) near wheel quiescent, and 9) end quiescent, where ‘end’ refers to the end of the cage furthest away from the wheel, and the color code for each score is shown in the legend. (c-f) Pie charts showing the amount of time spent in each of the 9 behavioral states for the first 6h of recording. (c) Summary data for the individual plotted in (a). (d) Averaged data for WT C57BL/6J mice (n=2). (e) Summary data for the individual plotted in (b). (f) Averaged data for I-x (N2F14/15) mice (n=5). (g) Average number of running (top) and quiescent (bottom) events for C57BL/6J and N2F14/15 mice in the first 6h of recording (** p < 0.01, *** p < 0.001). The number of quiescent events were determined by taking the sum of #s 8,9. See also data for individual mice plotted in Figs. S2 and S3.
To confirm this phenotype, affected mice of the I-x (N2F21) and T-x (N11F3) generations, along with unaffected mice from the T-x (N3F2) generation were also video recorded during the first few hours of the dark phase. Mice of both affected groups showed extremely low wheel-running levels compared to T-x (N3F2) unaffected mice (Fig. S4 a, b – upper panels). The T-x (N3F2) mice never showed behavioral quiescence during this time of the day, whereas all individuals of the other two lines did (Fig. S4 a, b – lower panels).
Abnormal behavioral phenotypes in twiggy mice map to a single locus on chromosome 11
To map the mutation in these lines, we crossed affected mice from both the I-x and the B/Int-x lines to C57BL/10J mice, and then intercrossed the resulting M-x (F1) progeny (n=92) to produce M-x (F2) mice (Table S1). In total, 207 M-x (F2) mice from 9 independent matings were produced and were tested on running wheels under LD and DD conditions for the presence of the behavioral phenotype. All data were compared to F1 and F2 mice generated from crosses of WT C57BL/6J and C57BL/10J mice (designated as WTB6B10F1 (n=63) and WTB6B10F2 (n=112), respectively). Using a genome-wide SNP panel of 96 markers designed to differentiate C57BL/6J from C57BL/10J (Table S2), the genotypes of 74 selected affected and unaffected M-x (F2) mice were determined and were assessed for linkage to the various phenotypic measurements. Significant log odds ratio (LOD) peaks with linkage to a single locus on chromosome 11 were found for the amount of activity recorded in LD (Fig. 3 a) and DD (Fig. 3 b), and amplitude of the rhythm in DD (Fig. 3 c). Mice homozygous for the C57BL/6J allele (designated as “B6/B6”) had lower activity in both LD (Fig. 3 d; F(2,70)=10.06; p<0.0001) and DD (Fig. 3 e; F(2,70)=12.62, p<0.0001) with a lower amplitude circadian rhythm (Fig. 3 f; F(2,70)=14.33, p<0.0001). No significant linkage was found for the percentage of activity occurring during the light phase (Fig. S5 a, d), the number of activity bouts occurring per day (Fig. S5 b, e), or the free-running period in DD (Fig. S5 c, f).
Fig. 3: Abnormal phenotypes map to locus on chromosome 11.
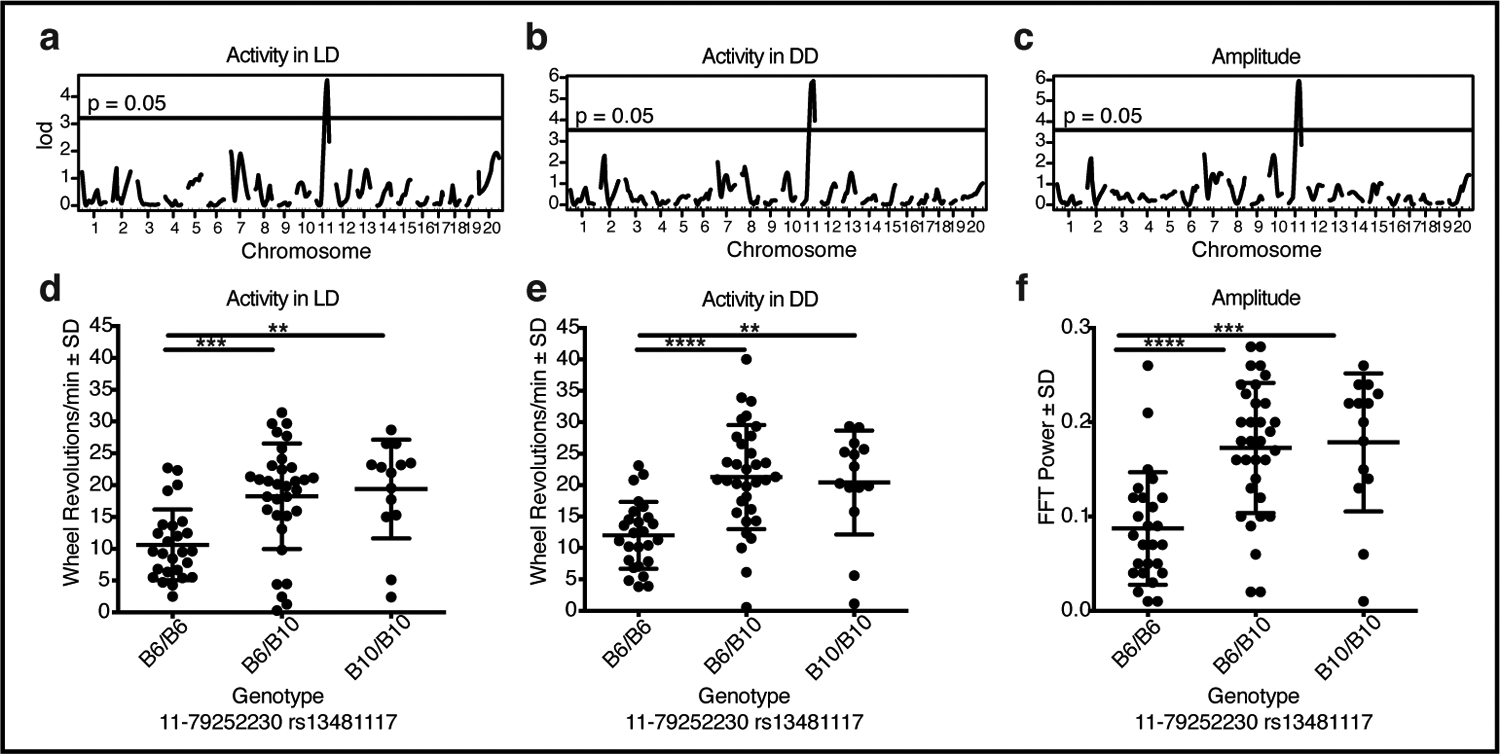
Genome-wide linkage plots for average number of wheel revolutions per min recorded in (a) LD or (b) DD, and (c) amplitude of the free-running rhythm in DD all show linkage to a locus on chromosome 11, with chromosomal location plotted along the X-axis. Average number of wheel revolutions per min recorded in (d) LD or (e) DD, and (f) amplitude of the free-running rhythm in DD for mice with B6/B6 (n=26), B6/B10 (n=33), or B10/B10 (n=14) genotypes at a SNP marker (rs13481117) located on chromosome 11 at position 79252230. Means ± SD and individual data points are plotted and significant differences among groups are indicated (** p < 0.01, *** p < 0.001, **** p < 0.0001). See Fig. S5 for related data.
A point mutation in Slc2a4 encoding GLUT4 is identified in twiggy mice
In order to identify the gene responsible for the abnormal phenotypes described, we performed whole-exome sequencing (WES) of pooled DNA collected from mice of the I-x (N2F20) generation, and those from a test cross stemming from affected B/Int-x (N11F2) mice (T-x (N11F3); N=16 for each line). Representative activity records of mice in the various generations used for this experiment are shown in Fig. S6 a–f. Body-weight data collected at 8 weeks of age for both male and female mice in the I-x (N2F20) and T-x (N11F3) generations, as well as for those of the B/Int-x (N11) and B/Int-x (N1F2) used to produce the T-x (N11F3) mice, revealed that mice of both lines chosen for WES had significantly lower body weights (Fig. S6 g; Males: F(3,100)=23.47, Females: F(3,115)= 19.46; both p<0.0001). In addition, mice of both presumptive homozygous lines (I-x (N2F20) and T-x (N11F3)) showed significantly lower levels of activity in LD compared to mice from the B/Int-x (F1) and B/Int-x (F2) generations (Fig. S6 H; F(3, 218)=64.29, p<0.0001). Importantly, activity levels and wheel running patterns did not differ between these two presumptive homozygous lines, indicating that both were, in fact, homozygous for the same genetic mutation.
WES results revealed a single point mutation in the Slc2a4 gene encoding GLUT4, the insulin-responsive glucose transporter (Fig. 4). No other gene within the linked region of chromosome 11 had polymorphisms represented in both of the samples analyzed. Remarkably, all reads covering this region of the genome for both of the pooled samples showed this same SNP (Fig. 4 a). A single nucleotide substitution (A to T) within the distal end of exon 10 of the gene resulted in a premature stop (Y440*; Fig. 4 b). Genotyping for this SNP revealed that all mice in the 2 test cross lines were homozygous for the mutant allele of this gene (which we named “twiggy”), whereas mice in the B/Int-x lines showed the expected Mendelian ratio of genotypes at this mutant locus. Surprisingly, western blot analysis showed that homozygous mice (twgy/twgy) had higher levels of protein in the gastrocnemius muscle than heterozygotes (+/twgy) and WT littermates when those groups were combined (Fig. 4 c; t(28)=6.006, p<0.0001), indicating that the mutation appears to result in protein accumulation or increased expression. To confirm that the twiggy mutation was recessive, we again housed mice of the B/Int-x (N12F2) line with access to a running wheel and found that only those mice with the homozygous twgy/twgy genotype showed the behavioral pattern identified in the original two lines (Fig. S7 b; F(5,125)=99.18, p<0.0001; Fig. S7 c; F(5,125)=12.33, p<0.0001). Thus, this pattern that is indicative of an overall excessive fatigability and disruption of behavior, shows a clear recessive mode of inheritance.
Fig. 4: Affected mice harbor a single point mutation in Slc2a4 encoding the GLUT4 insulin-responsive glucose transporter.
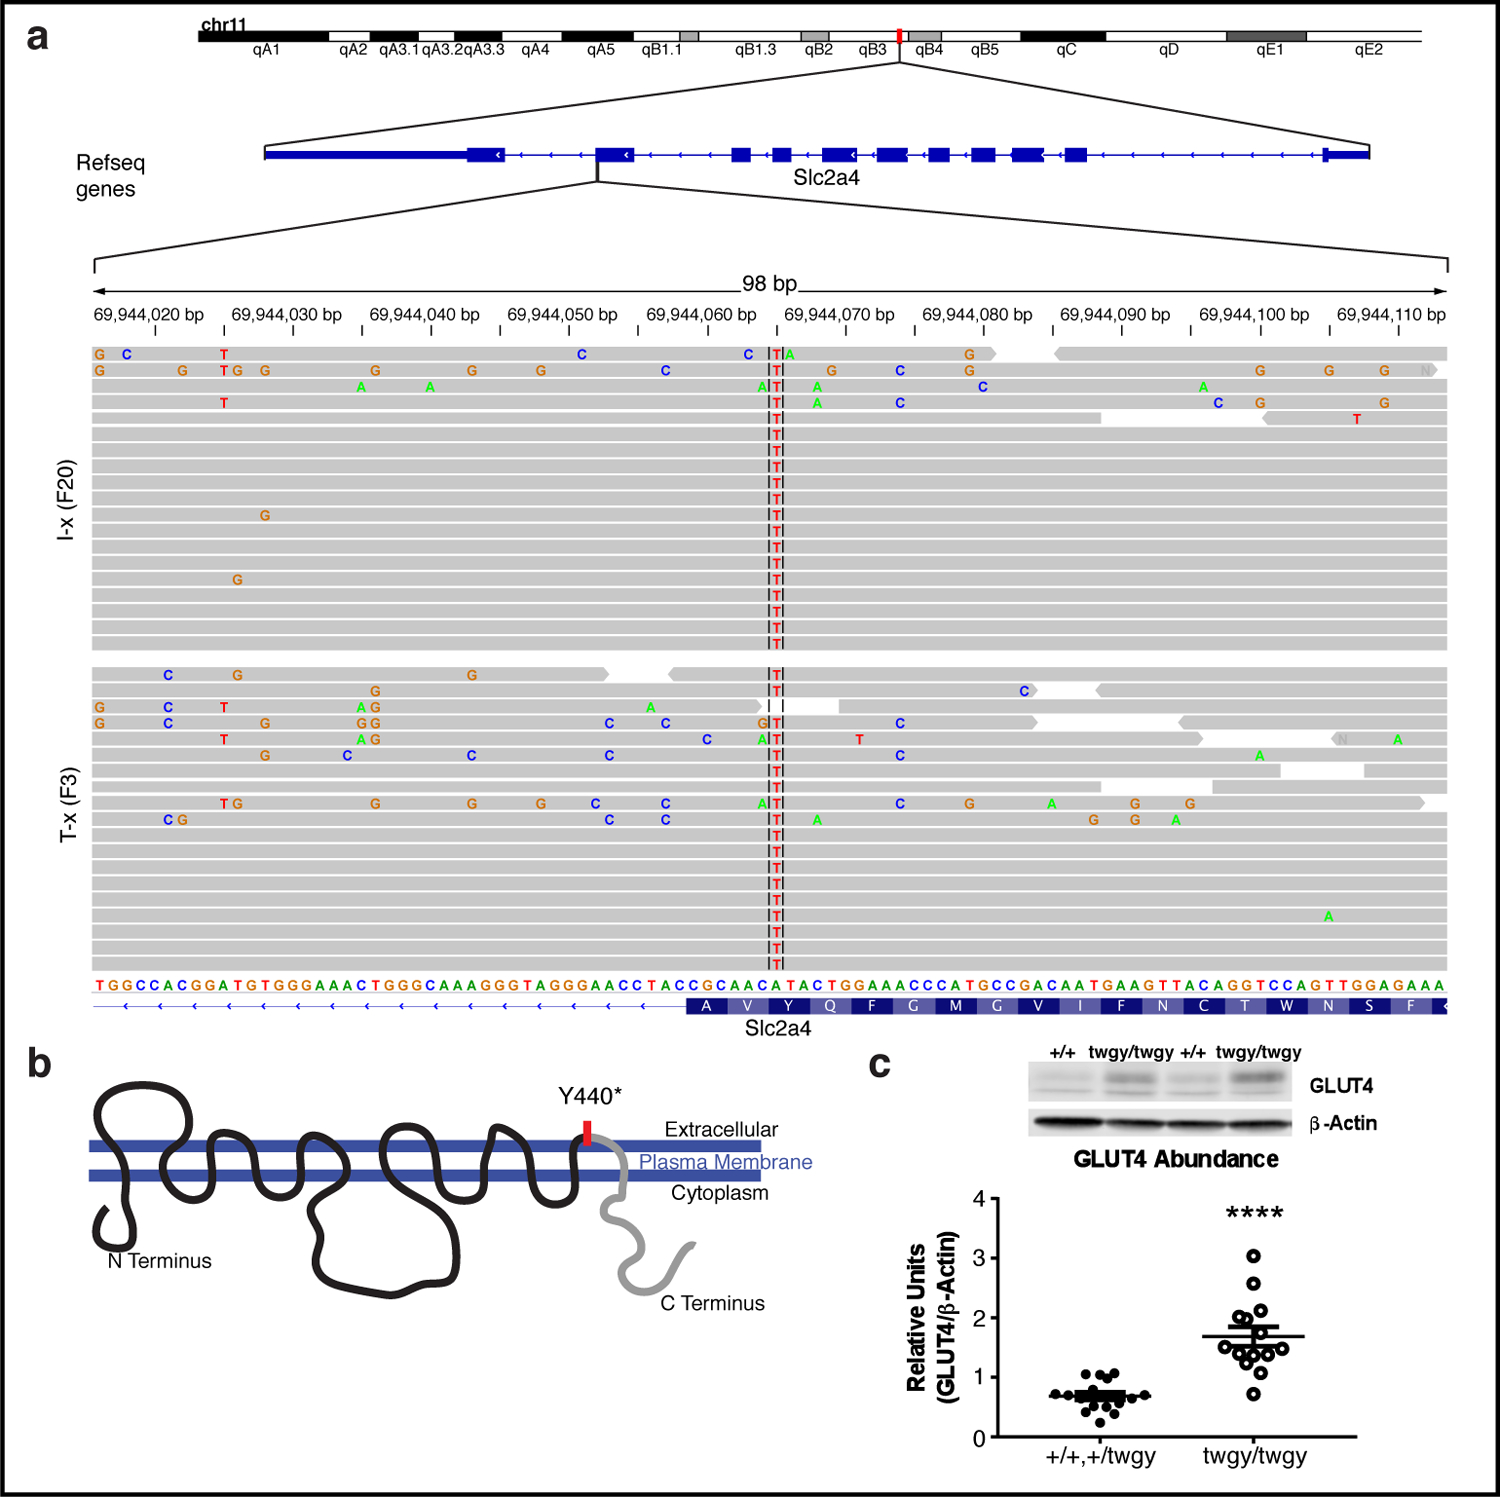
(a) Results of whole-exome sequencing of spleen genomic DNA reveal a single amino acid change (A to T) at position 69944065 within the Slc2a4 gene on chromosome 11. All reads at this locus for the I-x (N2F20) and the T-x (N11F3) samples (n=16 per group, pooled) showed this single nucleotide alteration (indicated by red line), and 19 representative reads from each sample are shown at higher magnification at the bottom of the plot. (b) A cartoon of the GLUT4 insulin-responsive glucose transporter with its 12 trans-membrane domains with the A to T SNP location and resulting premature stop (Y440*) in exon 10 indicated with a red line. The mutation falls within the last extracellular loop and likely leads to a truncation of the cytoplasmic C-Terminus domain (indicated in grey). (c) Protein abundance of GLUT4 in the gastrocnemius muscle of representative WT (+/+) and homozygous mutant (twgy/twgy) mice. Means ± SD and individual data points of +/+ or +/twgy (n=16) and twgy/twgy (n=14) are plotted (**** p < 0.0001).
Twiggy mice have metabolic phenotypes similar to Glut4 knockout mice
Despite higher levels of accumulated GLUT4 protein, twgy/twgy mice show phenotypes similar to GLUT4 knockout mice54–58. While fasting glucose levels were normal (Fig. 5 b and also Fig. S1 f), twgy/twgy mice had impaired glucose clearance with elevated blood glucose levels 15, 30 and 45 min after glucose injection (Fig. 5 a; interaction of time and genotype, F(15, 588)=1.60, p<0.05; main effect of time, F(5, 588)=72.06, p <0.0001; main effect of genotype, F(3, 588)=27.15, p<0.0001; Tukey’s multiple comparisons: 15 min, p < 0.01; 30 min, p < 0.0001; 45 min, p <0.01). Both +/twgy and twgy/twgy male mice had decreased body weights (F(7, 125)=28.29, p < 0.0001), although female body weights did not differ significantly among genotypes (Fig. 5 c). Like GLUT4 knockout mice54, twgy/twgy of both sexes had enlarged hearts (Fig. 5 d; F(7,126)=34.61, p < 0.0001). The twiggy mutation also resulted in impaired exercise tolerance, with twgy/twgy mice showing shorter times (Fig. 5 e; males: t(13)=4.698, p < 0.001, females: t(14)=3.177, p < 0.01) and distance (Fig. 5 f; males: t(13)=4.772, p < 0.001, females: t(14)=3.088, p < 0.01) to exhaustion upon treadmill endurance testing, as well as elevated blood glucose (Fig. 5 g; males: t(13)=2.941, p < 0.05, females: t(14)=7.629, p < 0.0001) and decreased lactate (Fig. 5 h; males: t(13)=4.832, p < 0.001, females: t(14)=2.624, p < 0.05) levels upon completion of the endurance test.
Fig. 5: The twiggy mutation of Slc2a4 results in impaired glucose tolerance, increased heart weight, low body weight, and decreased exercise tolerance.
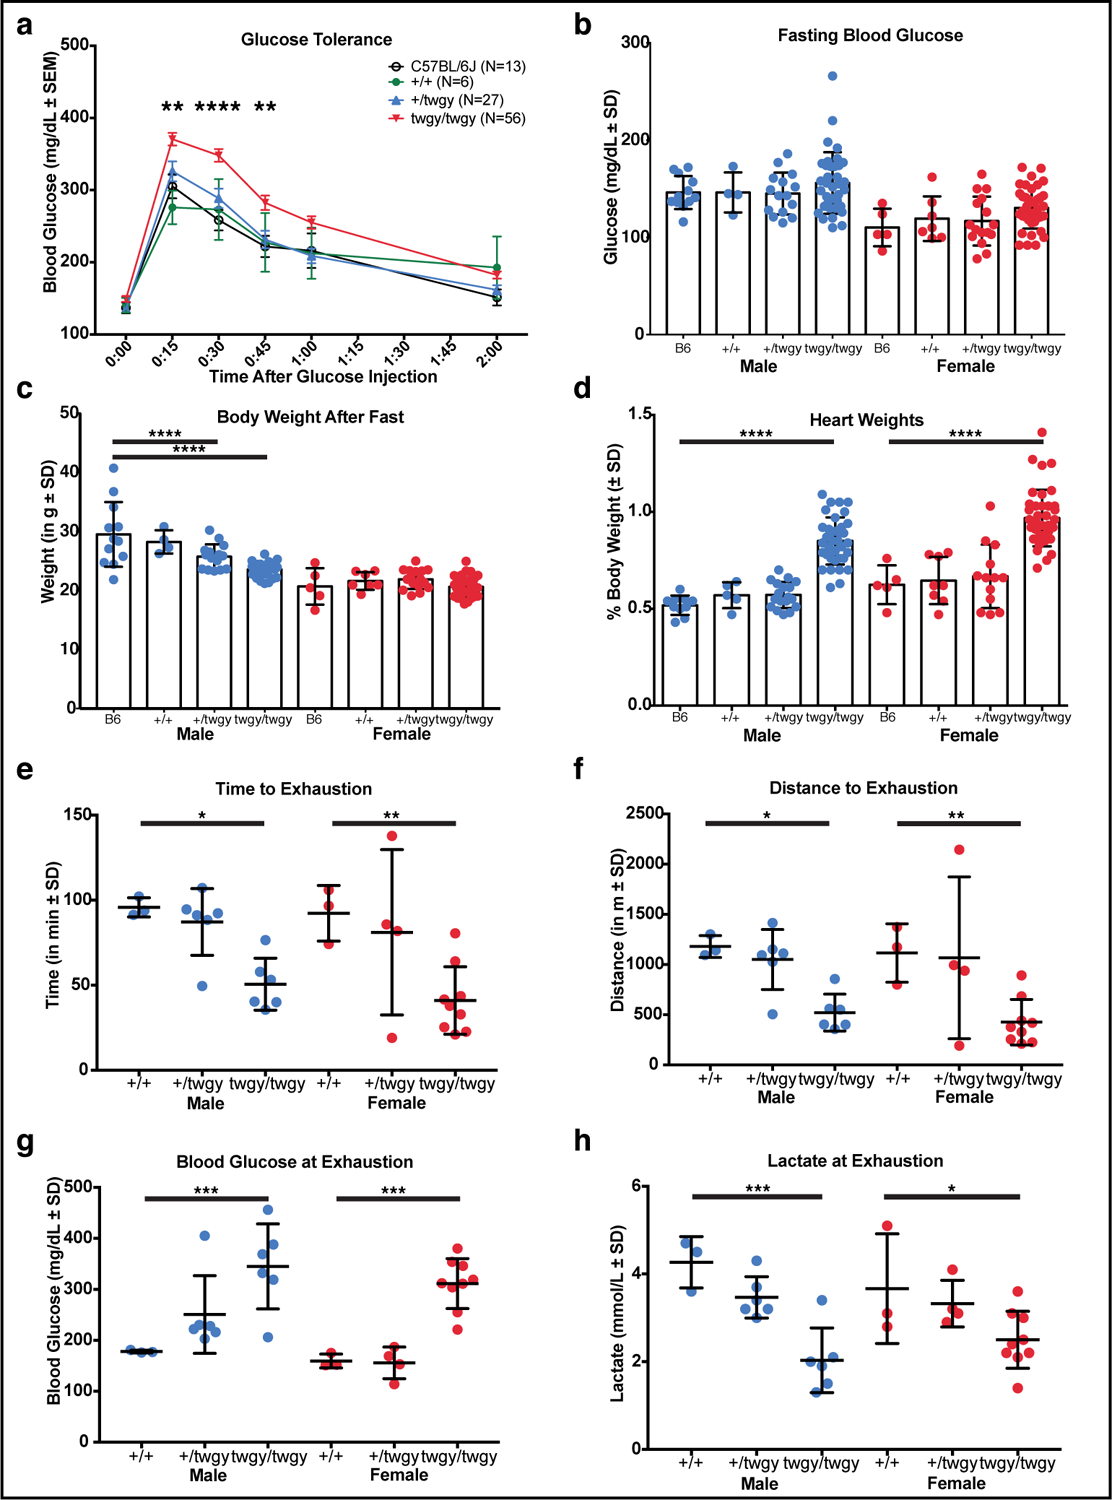
(a) Glucose tolerance response for C57BL/6J (n=13), WT (+/+; n=6), heterozygous (+/twgy; n=27) and homozygous (twgy/twgy; n=56) mice. Blood glucose (mg/dL ± SEM) is plotted on the Y-axis with time since I.P. injection of glucose plotted along the X-axis. Significant differences between twgy/twgy and C57BL/6J at 15, 30 and 45 min are indicated. +/+ and +/twgy did not differ from C57BL/6J at any time point. (b) Blood glucose (mg/dL ± SD) following a 4h fast in the middle of the light phase for male (blue, left) and female (red, right) C57BL/6J (B6; n=12 M & n=5 F), +/+ (n=4 M & n=7 F), +/twgy (n=15 M & n=16 F) and twgy/twgy (n=36 M & n=3 8F) is plotted. (c) Body weights of the same mice shown in (b) taken after a 4h fast. Heart weights (as a percentage of total body weight) of male (blue, left) and female (red, right) C57BL/6J (B6; n=10 M & n=5 F), +/+ (n=5 M & n=8 F), +/twgy (n=18 M & n=13 F) and twgy/twgy (n=36 M & n=39 F) mice are shown in (d). A treadmill exercise test run on +/+ (n=3 M & n=3 F), +/twgy (n=16 M & n=4 F) and twgy/twgy (n=6 M & n=9 F) mice showed impaired responses in homozygous twgy/twgy mice in time (in min; e), distance (in m; f), blood glucose (g) and lactate (h) at exhaustion. Means ± SD and individual data points are plotted with significant differences indicated (* p < 0.05, ** p < 0.01, *** p < 0.001, **** p < 0.0001).
DISCUSSION
Excessive fatigue affects subsections of the population and results in diminished daily functioning and quality of life2,4,5. Fatigue can be a symptom or side effect of various diseases and disorders (or their treatments) but can also manifest independently from other comorbidities59–61. In order for new treatments of fatigue to be identified and developed, informative animal models of human fatigue are crucial. In this study, we carried out a forward genetic screen to identify mouse lines showing the behavioral characteristics of fatigue. We found a novel, recessive mutation (twiggy) in the Slc2a4 gene, encoding the insulin-responsive glucose transporter (GLUT4), that results in an altered daily voluntary wheel-running pattern consisting of low levels of non-consolidated wheel-running activity and increased short bursts of activity interrupting the rest phase. These behavioral abnormalities are consistent with altered behaviors seen in humans with fatigue, such as decreased energy and weakness and poor sleep quality. While the current study did not investigate other manifestations of fatigue in humans, such as anxiety and depressive-like behaviors or deficits in attention or social interactions, these would be interesting to assess in this mouse model10. Taken together, our results suggest that impaired GLUT4 functioning (or other genes involved in glucose homeostasis) may play a role in the underlying pathophysiology of fatigue in some patients.
The additional phenotypic characteristics (including low body weights, impaired glucose tolerance with a normal baseline fasting blood glucose level, increased heart mass consistent with cardiac hypertrophy, decreased exercise tolerance, and increased fatiguing response with abnormal blood glucose and lactate levels following exercise) we observed in homozygous (twgy/twgy) mice are consistent with a non-functioning GLUT4 transporter54. Surprisingly, although these phenotypic characteristics largely match those described for the Glut4 null mouse54–57,62–64, GLUT4 protein levels in twgy/twgy mice were elevated, suggestive of protein accumulation due to impairments in turnover or degradation, compensatory upregulation, or aberrant trafficking. The premature stop introduced into exon 10 of the gene would likely result in the truncation of the protein and absence of the carboxy terminus. There are several important regulatory elements located in this region of the protein that play a role in its subcellular localization and transmission to the plasma membrane in response to circulating insulin, dietary components and metabolites, or exercise-related signaling pathways65–70. Thus, although it remains to be determined, it is likely that the phenotypes resulting from the presumably truncated form of Slc2a4 are the result of impairments in its cellular localization.
The constellation of phenotypes described for twgy/twgy mice showed a clear recessive inheritance pattern. For virtually all phenotypes measured, heterozygous (+/twgy) mice were indistinguishable from their WT littermates and/or WT C57BL/6J controls. This is in sharp contrast to the Glut4 knockout heterozygous mice that exhibit phenotypes consistent with diabetes71–74. It has been suggested that this diabetic phenotype, which is manifest in only a subpopulation of the heterozygotes and appears to vary with age, could be an artifact of genetic background; however, this remains an open issue72. In addition, GLUT4 protein levels are diminished in heterozygous Glut4 knockout mice71–74. In contrast, protein levels of GLUT4 were unchanged in the muscle of +/twgy mice. This finding reinforces the idea that this mutation, resulting in a premature stop, is not simply a complete loss-of-function of GLUT4, but rather is likely to be a hypomorphic allele, and therefore it represents a novel model that can be used to further characterize GLUT4 functioning.
The GLUT4 glucose transporter was historically considered a peripheral-acting glucose channel, with its expression thought to be limited to muscle, adipose tissues, and heart75–77. Recent studies have shown that it is, in fact, expressed more widely and can also be found in distinct neuronal populations in mice78. This more varied anatomical localization suggests that GLUT4 functions are more complex than simply a glucose transporter in peripheral tissues75. For example, a very recent study shows that GLUT4 maintains neuronal, and specifically synaptic, energy requirements and is essential for promoting continued synaptic transmission79. The use of conditional genetic tools has also shed more light on the diverse functions of GLUT4. Interfering with insulin signaling in tissues expressing GLUT4 results in a diabetic phenotype that is due, at least in part, to impaired insulin signaling in GLUT4-expressing neuronal populations80. It is interesting to note that these mice have decreased body weight, but do not show any alterations in activity amounts or patterns80. Mice with selective neuronal GLUT4 depletion have also revealed that GLUT4 is critical for assessing and reacting to changes in blood glucose levels81; however, it is possible that some of these effects are related to the Nestin-Cre driver used in those studies82. Work to identify the function of distinct subgroups of GLUT4 neurons using methods to isolate and/or selectively ablate those expressing this gene has revealed that ablation of hypothalamic neurons expressing GLUT4 results in metabolic changes consistent with impaired energy utilization and homeostatic processes, without locomotor deficits83,84. Clearly, continued use of genetic tools to conditionally manipulate the expression of GLUT4 in anatomically and temporally controlled ways will be critical to allow us to fully characterize its function.
It seems logical that impaired glucose processing and homeostasis, with a concomitant altered tolerance of exercise, would cause aberrant patterns of voluntary wheel-running activity. Voluntary wheel running is increased in mice overexpressing Glut4 in muscle85, but GLUT4 expression does not differ between active and inactive mouse strains86. It is likely, however, that impaired glucose transport and cellular utilization would have some effect on voluntary sustained activity. Switching from predominantly glucose to fatty acid fuel utilization in muscle, either by transgenic or pharmacologic manipulation of the peroxisome proliferator-activated receptor delta (PPAR∂) pathway, increases exercise endurance in mice87–89. Whether or not this increase in exercise capacity translates into an increase in voluntary activity remains to be fully elucidated. For instance, mice deficient in both cryptochrome 1 and 2 (Cry1/2 dKO) run faster and for longer distances than WT or single knockout controls on a treadmill task; however, these mice have decreased daily voluntary wheel-running behavior90. It also remains to be determined whether treatment of twgy/twgy mice with exercise mimetics would normalize some of the behavioral abnormalities in wheel running that we observed91. These types of studies may prove informative to how pharmacological treatments may help patients with CFS, for whom voluntary exercise programs have been unsuccessful.
While twgy/twgy mice had normal fasting glucose, fatigue and alterations in activity are well-described side effects and symptoms of both type I and type II diabetes92–94. Like fatigue in other patient populations, fatigue in diabetes is associated with physiological, psychological and lifestyle variables, but may be exacerbated by fluctuations in blood glucose levels and homeostasis. There is also some evidence suggestive of aberrant metabolic responses in CFS patients, with abnormalities in energy and sugar metabolism identified in some patients95. However, these studies are not conclusive and there are other potential causes of CFS, including autoimmune disease96. Nonetheless, the identification of additional abnormalities in metabolic pathways in CFS, both as candidates for treatment options and as potential biological markers for differential diagnoses, have recently received renewed scientific interest and our data suggest they may be a fruitful path for CFS therapies97,98. While a formal assessment of glucose tolerance in patients for whom fatigue remains an unexplained symptom may be warranted, we are by no means suggesting that mutations in GLUT4, or impaired glucose transport underlie all manifestations of fatigue. Rather, it is possible that for some patients, fatigue may be due to a persistent altered homeostatic state in response to a variety of triggers and physiological adaptations97.
In summary, using an unbiased, forward genetic ENU mutagenesis screen for a mouse model of fatigue, we identified mice with a mutated form of the GLUT4 transporter. We anticipate that additional screening of mutagenized mouse lines for abnormalities in the expression of voluntary wheel-running behavior will yield additional candidate genes and pathways that are implemented in this complex disorder. Moreover, we hope our mouse studies will help to clarify to clarify genetic candidates from human GWAS studies in CFS patient cohorts. In the meantime, studies to determine the effectiveness of treatment strategies geared towards normalizing glucose processing and transport in the twgy/twgy mice may hold promise for the treatment of patients with fatigue.
Supplementary Material
Fig. S7: Slc2a4twgy/twgy mice show abnormal, low-amplitude circadian patterns of voluntary wheel-running behavior interrupted with frequent rest bouts, confirming recessive inheritance of mutation. (a) Representative actograms of B/Int-x (N12F2) mice of all three genotypes (+/+ - top, +/twgy - middle, twgy/twgy - bottom) recorded for 3 weeks under a full 12:12 LD cycle (shown in bar across the top). Plotting conventions are like those for Fig 1A. Colored vertical bars on the left side of the actograms indicate days used for quantification of wheel-running behavior. (b) Average number of wheel revolutions per min over 24h and (c) % of daily activity occurring in the light phase for mice in the +/+ (n=4 M & n=5 F), +/twgy (n=19 M & n=16 F), and twgy/twgy (n=41 M & n=45 F) groups. Means ± SD and individual data points are plotted with significant differences indicated (** = p < 0.01, *** = p < 0.001, **** = p < 0.0001).
Fig. S5: Not all abnormal phenotypes map to locus on chromosome 11. Genome-wide linkage plots for percentage of (a) activity in the light phase, (b) number of activity bouts per day, and (c) period of the free-running rhythm in DD do not show linkage to any locus (chromosomal location plotted along the X-axis). (d) Percentage of activity in the light phase, (e) number of activity bouts per day, and (f) period of the free-running rhythm in DD for mice with B6/B6 (n=26), B6/B10 (n=33), or B10/B10 (n=14) genotypes at a SNP marker (rs13481117) located on chromosome 11 at position 79252230. Means ± SD and individual data points are plotted and significant differences among groups are indicated (* p < 0.05, ** p < 0.01).
Fig. S6: Generation and phenotyping of two independent homozygous populations of mice for whole exome sequencing. B/Int-x (N11) mice were intercrossed to produce (B/Int-x (N11F2) mice and affected progeny from this cross were in-crossed to produce homozygous T-x (N11F3) mice. In addition, affected I-x (N2F19) mice were in-crossed to produce I-x (N2F20) mice. Representative actograms of (a) an unaffected B/Int-x (N11) mouse, (b) an affected I-x (N2F19) mouse, (c) an unaffected B/Int-x (N11F2) mouse, (d) an affected B/Int-x (N11F2) mouse, and (e & f) two affected T-x (N11F3) mice, which were recorded for 3 weeks in LD followed by 3 weeks in DD. Plotting conventions are as those described for Fig. 1a. (g) Body weights at ~8 weeks for male (blue) and female (red) mice of 4 generations (solid red or blue lines = mean, dashed line = ±2SD of original G3 screening population). Almost all of the mice in the two presumptive homozygous lines (T-x (N11F3) and I-x (N2F20)) show the low body-weight phenotype. (h) Quantification of the average amount of wheel-running activity per min each day for mice in the B/Int-x (N11) (n=19), (B/Int-x (N11F2) (n=128), T-x (N11F3) (n=19), and I-x (N2F20) (n=56) groups show that mice in both of the presumptive homozygous lines (T-x (N11F3) and I-x (N2F20)) have significantly lower levels of activity. Means ± SD and individual data points are plotted and significant differences among groups are indicated (**** p < 0.0001).
Fig. S3: Nocturnal voluntary wheel-running activity is interrupted by frequent periods of rest in affected mice. (a-e) Ethograms depicting behaviors, states or locations observed in images captured once every min for 15h beginning at lights off for 5 individual I-x (N2F14 or N2F15) mice for the first night of recording, with time plotted along the X-axis. Each photograph was scored on a 9 item scale using the following designations: 1) drinking, 2) eating, 3) near hopper, 4) running on wheel, 5) near wheel awake, 6) end awake, 7) end resting, 8) near wheel quiescent, and 9) end quiescent, where ‘end’ refers to the end of the cage furthest away from the wheel. Color code for each score is shown along the top. Pie charts to the right of the ethograms show the amount of time spent in each of the 9 behavioral states for the first 6h (left) and all 12h (right) of recording during the dark phase for each individual.
Fig. S4: Video recording shows behavioral quiescence during active phase in affected mice. Total number of wheel revolutions recorded for 2h to 3.5h after lights off for (a) one T-x (N3F2) mouse and 3 individual I-x (N2F21) mice, and (b) a different T-x (N3F2) and 3 individual T-x (N11F3) mice are plotted, with periods of prolonged immobility (behavioral quiescence) indicated in colored bars along the X-axis below. Periods > 40s of total immobility with low posture were scored as quiescent.
Fig. S2: Nocturnal voluntary wheel-running activity is largely consolidated in WT C57BL/6J mice. (a-b) Ethograms depicting behaviors, states or locations observed in images captured once every min for 15h beginning at lights off for 2 individual WT C57BL/6J mice, with time plotted along the X-axis. Each photograph was scored on a 9 item scale using the following designations: 1) drinking, 2) eating, 3) near hopper, 4) running on wheel, 5) near wheel awake, 6) end awake, 7) end resting, 8) near wheel quiescent, and 9) end quiescent, where ‘end’ refers to the end of the cage furthest away from the wheel. Color code for each score is shown along the top. Pie charts to the right of the ethograms show the amount of time spent in each of the 9 behavioral states for the first 6h (left) and all 12h (right) of recording during the dark phase for each individual.
Fig. S1: Identification of a low body-weight line showing a recessive inheritance pattern. Mice were screened for aberrant body-weight regulation in a large recessive forward genetics ENU screen. (a) Generation 3 (G3) mice were weighed at ~8 weeks of age (females - 17.44 ± 1.58g - n=4038; males – 21.71 ± 2.41g - n=4965). A female mouse was identified with a low body weight (large black arrow) with no overt health issues. (b) The distribution of weights for the G3 pedigree containing the identified female (n=24 F (red), n=29 M (blue)). All of the G3 males and most of the females in this pedigree show normal body weights compared to the screening population (solid red or blue lines = mean, dashed line = ±2SD of whole screening population), but only one female was > 2SD below the mean (13.03 g; indicated in black circle). This mouse was backcrossed to a WT C57BL/6J to produce N2 progeny (n=11 F & n=9 M). The N2 progeny were intercrossed to produce N2F2s (n=25 F & n=31 M). None of the N2 mice showed the low body-weight phenotype, but at least 5 of the 56 N2F2 progeny of both sexes were affected (BW > 2SD below screening mean). N3 progeny produced by crossing affected N2F2 mice back to WT C57BL/6J had body weights that fell within ± 2SD of the screening mean (n=10 F & n=7 M). The low body-weight phenotype was maintained in two separate lines (c- males & d – females - solid lines = mean, dashed lines = ±2SD of the whole screening population). The B/Int-x line (c & d – left side) consisted of alternating generations of backcrosses of affected mice to C57BL/6J and intercrosses of the resulting progeny. The I-x line (c & d – right side) consisted of consecutive generations of in-crosses of affected siblings. (e) Body weights following a 4h fast occurring in the middle of the day for male (blue) and female (red) mice of the B/Int-x (N11F2; n=26 M & n=35 F) and I-x (N2F20; n=18 M & n=17 F) lines. (f) Blood glucose (mg/dL) following a 4h fast in the middle of the day for the same mice as in (e). Means ± SD with individual data points are plotted in b-f with significant differences among groups indicated (**** p < 0.0001).
ACKNOWLEDGMENTS
Research was supported by the NIH (U01 MH 61915) and the Howard Hughes Medical Institute (JST). Additional funding was received by CMC from the NIDDK (F32DK104659). We would like to thank Delali Bassowou, Kelly Bruckmann, Kelly Foster, Kyung-Inn Kim, Izabela Kornblum, Sammie McMurray, Chris Olker, and Dawn Olson for technical assistance. We thank Sandy Siepka and Martha Vitaterna for production of the ENU mutagenized mice and design of the initial phenotypic screen. JST is an Investigator, and MHMdG was a Research Specialist, in the Howard Hughes Medical Institute.
REFERENCES
- 1.Unger ER, Lin JS, Brimmer DJ, et al. CDC Grand Rounds: Chronic Fatigue Syndrome - Advancing Research and Clinical Education. MMWR Morb Mortal Wkly Rep. 2016;65(50–51):1434–1438. [DOI] [PubMed] [Google Scholar]
- 2.Jason LA, Evans M, Brown M, Porter N. What is fatigue? Pathological and nonpathological fatigue. PM R. 2010;2(5):327–331. [DOI] [PubMed] [Google Scholar]
- 3.Fukuda K, Straus SE, Hickie I, et al. The chronic fatigue syndrome: A comprehensive approach to its defintion and study. Ann Intern Med. 1994;121:953–959. [DOI] [PubMed] [Google Scholar]
- 4.Wessely S. The epidemiology of chronic fatigue syndrome. Epidemiol Psichiatr Soc. 1998;7(1):10–24. [DOI] [PubMed] [Google Scholar]
- 5.Ranjith G. Epidemiology of chronic fatigue syndrome. Occup Med (Lond). 2005;55(1):13–19. [DOI] [PubMed] [Google Scholar]
- 6.Hardy SE, Studenski SA. Fatigue predicts mortality in older adults. J Am Geriatr Soc. 2008;56(10):1910–1914. [DOI] [PMC free article] [PubMed] [Google Scholar]
- 7.Hardy SE, Studenski SA. Fatigue and function over three years among older adults. J Gerontol A Biol Sci Med Sci. 2008;63(12):1389–1392. [DOI] [PMC free article] [PubMed] [Google Scholar]
- 8.Moreh E, Jacobs JM, Stessman J. Fatigue, function, and mortality in older adults. J Gerontol A Biol Sci Med Sci. 2010;65(8):887–895. [DOI] [PubMed] [Google Scholar]
- 9.Maes M, Twisk FNM. Chronic fatigue syndrome: Harvey and Wessely’s (bio)psychosocial model versus a bio(psychosocial) model based on inflammatory and oxidative and nitrosative stress pathways. BMC Medicine. 2010;8(35):1–13. [DOI] [PMC free article] [PubMed] [Google Scholar]
- 10.Harrington ME. Neurobiological studies of fatigue. Prog Neurobiol. 2012;99(2):93–105. [DOI] [PMC free article] [PubMed] [Google Scholar]
- 11.Lightfoot JT. Current understanding of the genetic basis for physical activity. J Nutr. 2011;141(3):526–530. [DOI] [PMC free article] [PubMed] [Google Scholar]
- 12.Anisman H, Gibb J, Hayley S. Influence of continuous infusion of interleukin-1beta on depression-related processes in mice: corticosterone, circulating cytokines, brain monoamines, and cytokine mRNA expression. Psychopharmacology (Berl). 2008;199(2):231–244. [DOI] [PubMed] [Google Scholar]
- 13.Kudo T, Loh DH, Truong D, Wu Y, Colwell CS. Circadian dysfunction in a mouse model of Parkinson’s disease. Exp Neurol. 2011;232(1):66–75. [DOI] [PubMed] [Google Scholar]
- 14.Kudo T, Schroeder A, Loh DH, et al. Dysfunctions in circadian behavior and physiology in mouse models of Huntington’s disease. Exp Neurol. 2011;228(1):80–90. [DOI] [PMC free article] [PubMed] [Google Scholar]
- 15.Nakamura TJ, Nakamura W, Yamazaki S, et al. Age-related decline in circadian output. J Neurosci. 2011;31(28):10201–10205. [DOI] [PMC free article] [PubMed] [Google Scholar]
- 16.Ottenweller JE, Natelson BH, Gause WC, et al. Mouse Running Activity Is Lowered by Brucella abortus Treatment: A Potential Model to Study Chronic Fatigue. Physiol Behav. 1998;63(5):795–801. [DOI] [PubMed] [Google Scholar]
- 17.Ray MA, Trammell RA, Verhulst S, Ran S, Toth LA. Development of a Mouse Model for Assessing Fatigue during Chemotherapy. Comp Medicine. 2011;61(2):119–130. [PMC free article] [PubMed] [Google Scholar]
- 18.Bonsall DR, Kim H, Tocci C, et al. Suppression of Locomotor Activity in Female C57Bl/6J Mice Treated with Interleukin-1beta: Investigating a Method for the Study of Fatigue in Laboratory Animals. PLoS One. 2015;10(10):e0140678. [DOI] [PMC free article] [PubMed] [Google Scholar]
- 19.Shimomura K, Low-Zeddies SS, King DP, et al. Genome-wide epistatic interaction analysis reveals complex genetic determinants of circadian behavior in mice. Genome Res. 2001;11(6):959–980. [DOI] [PubMed] [Google Scholar]
- 20.Siepka SM, Takahashi JS. Methods to record circadian rhythm wheel running activity in mice. Methods Enzymol. 2005;393:230–239. [DOI] [PMC free article] [PubMed] [Google Scholar]
- 21.Schur E, Afari N, Goldberg J, Buchwald D, Sullivan PF. Twin analyses of fatigue. Twin Res Hum Genet. 2007;10(5):729–733. [DOI] [PMC free article] [PubMed] [Google Scholar]
- 22.Landmark-Hoyvik H, Reinertsen KV, Loge JH, et al. The genetics and epigenetics of fatigue. PM R. 2010;2(5):456–465. [DOI] [PubMed] [Google Scholar]
- 23.Sprangers MA, Thong MS, Bartels M, et al. Biological pathways, candidate genes, and molecular markers associated with quality-of-life domains: an update. Qual Life Res. 2014;23(7):1997–2013. [DOI] [PMC free article] [PubMed] [Google Scholar]
- 24.Wang T, Yin J, Miller AH, Xiao C. A systematic review of the association between fatigue and genetic polymorphisms. Brain Behav Immun. 2017;62:230–244. [DOI] [PMC free article] [PubMed] [Google Scholar]
- 25.Narita M, Nishigami N, Narita N, et al. Association between serotonin transporter gene polymorphism and chronic fatigue syndrome. Biochem Biophys Res Commun. 2003;311(2):264–266. [DOI] [PubMed] [Google Scholar]
- 26.Torpy DJ, Ho JT. Corticosteroid-binding globulin gene polymorphisms: clinical implications and links to idiopathic chronic fatigue disorders. Clin Endocrinol (Oxf). 2007;67(2):161–167. [DOI] [PubMed] [Google Scholar]
- 27.Collado-Hidalgo A, Bower JE, Ganz PA, Irwin MR, Cole SW. Cytokine gene polymorphisms and fatigue in breast cancer survivors: early findings. Brain Behav Immun. 2008;22(8):1197–1200. [DOI] [PMC free article] [PubMed] [Google Scholar]
- 28.Lin E, Huang LC. Identification of significant genes in genomics using Bayesian variable selection methods. Adv Appl Bioinform Chem. 2008;1:13–18. [DOI] [PMC free article] [PubMed] [Google Scholar]
- 29.Smith AK, Dimulescu I, Falkenberg VR, et al. Genetic evaluation of the serotonergic system in chronic fatigue syndrome. Psychoneuroendocrinology. 2008;33(2):188–197. [DOI] [PubMed] [Google Scholar]
- 30.Smith AK, Fang H, Whistler T, Unger ER, Rajeevan MS. Convergent genomic studies identify association of GRIK2 and NPAS2 with chronic fatigue syndrome. Neuropsychobiology. 2011;64(4):183–194. [DOI] [PMC free article] [PubMed] [Google Scholar]
- 31.Johnston S, Staines D, Klein A, Marshall-Gradisnik S. A targeted genome association study examining transient receptor potential ion channels, acetylcholine receptors, and adrenergic receptors in Chronic Fatigue Syndrome/Myalgic Encephalomyelitis. BMC Med Genet. 2016;17(1):79. [DOI] [PMC free article] [PubMed] [Google Scholar]
- 32.Schlauch KA, Khaiboullina SF, De Meirleir KL, et al. Genome-wide association analysis identifies genetic variations in subjects with myalgic encephalomyelitis/chronic fatigue syndrome. Transl Psychiatry. 2016;6:e730. [DOI] [PMC free article] [PubMed] [Google Scholar]
- 33.Petersen HH, Andreassen TK, Breiderhoff T, et al. Hyporesponsiveness to glucocorticoids in mice genetically deficient for the corticosteroid binding globulin. Mol Cell Biol. 2006;26(19):7236–7245. [DOI] [PMC free article] [PubMed] [Google Scholar]
- 34.Golumbek PT, Keeling RM, Connolly AM. RAG2 gene knockout in mice causes fatigue. Muscle Nerve. 2007;36(4):471–476. [DOI] [PubMed] [Google Scholar]
- 35.Krzyszton CP, Sparkman NL, Grant RW, et al. Exacerbated fatigue and motor deficits in interleukin-10-deficient mice after peripheral immune stimulation. Am J Physiol Regul Integr Comp Physiol. 2008;295(4):R1109–1114. [DOI] [PMC free article] [PubMed] [Google Scholar]
- 36.Justice MJ, Noveroske JK, Weber JS, Zheng B, Bradley A. Mouse ENU Mutagenesis. Human Mol Genetics. 1999;8(10):1955–1963. [DOI] [PubMed] [Google Scholar]
- 37.Soewarto D, Fella C, Teubner A, et al. The large-scale Munich ENU-mouse-mutagenesis screen. Mamm Genome. 2000;11(7):507–510. [DOI] [PubMed] [Google Scholar]
- 38.Keays DA, Nolan PM. N-ethyl-N-nitrosourea mouse mutants in the dissection of behavioural and psychiatric disorders. European Journal of Pharmacology. 2003;480(1–3):205–217. [DOI] [PubMed] [Google Scholar]
- 39.Clark AT, Goldowitz D, Takahashi JS, et al. Implementing large-scale ENU mutagenesis screens in North America. Genetica. 2004;122(1):51–64. [DOI] [PMC free article] [PubMed] [Google Scholar]
- 40.Goldowitz D, Frankel WN, Takahashi JS, et al. Large-scale mutagenesis of the mouse to understand the genetic bases of nervous system structure and function. Brain Res Mol Brain Res. 2004;132(2):105–115. [DOI] [PMC free article] [PubMed] [Google Scholar]
- 41.Cordes SP. N-ethyl-N-nitrosourea mutagenesis: boarding the mouse mutant express. Microbiol Mol Biol Rev. 2005;69(3):426–439. [DOI] [PMC free article] [PubMed] [Google Scholar]
- 42.Vitaterna MH, Pinto LH, Takahashi JS. Large-scale mutagenesis and phenotypic screens for the nervous system and behavior in mice. Trends Neurosci. 2006;29(4):233–240. [DOI] [PMC free article] [PubMed] [Google Scholar]
- 43.Kumar V, Kim K, Joseph C, Thomas LC, Hong H, Takahashi JS. Second-generation high-throughput forward genetic screen in mice to isolate subtle behavioral mutants. Proc Natl Acad Sci U S A. 2011;108(3):15557–15564. [DOI] [PMC free article] [PubMed] [Google Scholar]
- 44.Moresco EM, Li X, Beutler B. Going forward with genetics: recent technological advances and forward genetics in mice. Am J Pathol. 2013;182(5):1462–1473. [DOI] [PMC free article] [PubMed] [Google Scholar]
- 45.Takahashi JS, Shimomura K, Kumar V. Searching for genes underlying behavior: lessons from circadian rhythms. Science. 2008;322(5903):909–912. [DOI] [PMC free article] [PubMed] [Google Scholar]
- 46.Siepka SM, Takahashi JS. Forward genetic screens to identify circadian rhythm mutants in mice. Methods Enzymol. 2005;393:219–229. [DOI] [PMC free article] [PubMed] [Google Scholar]
- 47.Pack AI, Galante RJ, Maislin G, et al. Novel method for high-throughput phenotyping of sleep in mice. Physiol Genomics. 2007;28(2):232–238. [DOI] [PubMed] [Google Scholar]
- 48.Kumar V, Kim K, Joseph C, et al. C57BL/6N mutation in cytoplasmic FMRP interacting protein 2 regulates cocaine response. Science. 2013;342(6165):1508–1512. [DOI] [PMC free article] [PubMed] [Google Scholar]
- 49.Broman KW, Wu H, Sen S, Churchill GA. R/qtl: QTL mapping in experimental crosses. Bioinformatics. 2003;19(7):889–890. [DOI] [PubMed] [Google Scholar]
- 50.Li H, Durbin R. Fast and accurate short read alignment with Burrows-Wheeler transform. Bioinformatics. 2009;25(14):1754–1760. [DOI] [PMC free article] [PubMed] [Google Scholar]
- 51.McKenna A, Hanna M, Banks E, et al. The Genome Analysis Toolkit: a MapReduce framework for analyzing next-generation DNA sequencing data. Genome Res. 2010;20(9):1297–1303. [DOI] [PMC free article] [PubMed] [Google Scholar]
- 52.Cingolani P, Platts A, Wang le L, et al. A program for annotating and predicting the effects of single nucleotide polymorphisms, SnpEff: SNPs in the genome of Drosophila melanogaster strain w1118; iso-2; iso-3. Fly (Austin). 2012;6(2):80–92. [DOI] [PMC free article] [PubMed] [Google Scholar]
- 53.Fujikawa T, Castorena CM, Pearson M, et al. SF-1 expression in the hypothalamus is required for beneficial metabolic effects of exercise. Elife. 2016;5. [DOI] [PMC free article] [PubMed] [Google Scholar]
- 54.Katz EB, Stenbit AE, Hatton K, DePinho R, Charron MJ. Cardiac and adipose tissue abnormalities but not diabetes in mice deficient in GLUT4. Nature. 1995;377(6545):151–155. [DOI] [PubMed] [Google Scholar]
- 55.Gorselink M, Drost MR, de Brouwer KF, et al. Increased muscle fatigability in GLUT-4-deficient mice. Am J Physiol Endocrinol Metab. 2002;282(2):E348–354. [DOI] [PubMed] [Google Scholar]
- 56.Simoes MV, Egert S, Ziegler S, et al. Delayed response of insulin-stimulated fluorine-18 deoxyglucose uptake in glucose transporter-4-null mice hearts. J Am Coll Cardiol. 2004;43(9):1690–1697. [DOI] [PubMed] [Google Scholar]
- 57.Fueger PT, Li CY, Ayala JE, et al. Glucose kinetics and exercise tolerance in mice lacking the GLUT4 glucose transporter. J Physiol. 2007;582(Pt 2):801–812. [DOI] [PMC free article] [PubMed] [Google Scholar]
- 58.Fam BC, Rose LJ, Sgambellone R, Ruan Z, Proietto J, Andrikopoulos S. Normal muscle glucose uptake in mice deficient in muscle GLUT4. J Endocrinol. 2012;214(3):313–327. [DOI] [PubMed] [Google Scholar]
- 59.Morris G, Berk M, Walder K, Maes M. The Putative Role of Viruses, Bacteria, and Chronic Fungal Biotoxin Exposure in the Genesis of Intractable Fatigue Accompanied by Cognitive and Physical Disability. Mol Neurobiol. 2015;53(4):2550–2571. [DOI] [PubMed] [Google Scholar]
- 60.Saligan LN, Olson K, Filler K, et al. The biology of cancer-related fatigue: a review of the literature. Support Care Cancer. 2015;23(8):2461–2478. [DOI] [PMC free article] [PubMed] [Google Scholar]
- 61.Skoie IM, Ternowitz T, Jonsson G, Norheim K, Omdal R. Fatigue in psoriasis: a phenomenon to be explored. Br J Dermatol. 2015;172(5):1196–1203. [DOI] [PubMed] [Google Scholar]
- 62.Tsao TS, Stenbit AE, Li J, et al. Muscle-specific transgenic complementation of GLUT4-deficient mice. Effects on glucose but not lipid metabolism. J Clin Invest. 1997;100(3):671–677. [DOI] [PMC free article] [PubMed] [Google Scholar]
- 63.Stenbit AE, Katz EB, Chatham JC, et al. Preservation of glucose metabolism in hypertrophic GLUT4-null hearts. Am J Physiol Heart Circ Physiol. 2000;279(1):H313–318. [DOI] [PubMed] [Google Scholar]
- 64.Jiang H, Li J, Katz EB, Charron MJ. GLUT4 ablation in mice results in redistribution of IRAP to the plasma membrane. Biochem Biophys Res Commun. 2001;284(2):519–525. [DOI] [PubMed] [Google Scholar]
- 65.Huang S, Czech MP. The GLUT4 glucose transporter. Cell Metab. 2007;5(4):237–252. [DOI] [PubMed] [Google Scholar]
- 66.Sadler JB, Bryant NJ, Gould GW, Welburn CR. Posttranslational modifications of GLUT4 affect its subcellular localization and translocation. Int J Mol Sci. 2013;14(5):9963–9978. [DOI] [PMC free article] [PubMed] [Google Scholar]
- 67.Govers R. Cellular regulation of glucose uptake by glucose transporter GLUT4. Adv Clin Chem. 2014;66:173–240. [DOI] [PubMed] [Google Scholar]
- 68.Alvim RO, Cheuhen MR, Machado SR, Sousa AG, Santos PC. General aspects of muscle glucose uptake. An Acad Bras Cienc. 2015;87(1):351–368. [DOI] [PubMed] [Google Scholar]
- 69.Gannon NP, Conn CA, Vaughan RA. Dietary stimulators of GLUT4 expression and translocation in skeletal muscle: a mini-review. Mol Nutr Food Res. 2015;59(1):48–64. [DOI] [PubMed] [Google Scholar]
- 70.Sylow L, Kleinert M, Richter EA, Jensen TE. Exercise-stimulated glucose uptake - regulation and implications for glycaemic control. Nat Rev Endocrinol. 2017;13(3):133–148. [DOI] [PubMed] [Google Scholar]
- 71.Rossetti L, Stenbit AE, Chen W, et al. Peripheral but not hepatic insulin resistance in mice with one disrupted allele of the glucose transporter type 4 (GLUT4) gene. J Clin Invest. 1997;100(7):1831–1839. [DOI] [PMC free article] [PubMed] [Google Scholar]
- 72.Stenbit AE, Tsao TS, Li J, et al. GLUT4 heterozygous knockout mice develop muscle insulin resistance and diabetes. Nat Med. 1997;3(10):1096–1101. [DOI] [PubMed] [Google Scholar]
- 73.Tsao TS, Stenbit AE, Factor SM, Chen W, Rossetti L, Charron MJ. Prevention of insulin resistance and diabetes in mice heterozygous for GLUT4 ablation by transgenic complementation of GLUT4 in skeletal muscle. Diabetes. 1999;48(4):775–782. [DOI] [PubMed] [Google Scholar]
- 74.Li J, Houseknecht KL, Stenbit AE, Katz EB, Charron MJ. Reduced glucose uptake precedes insulin signaling defects in adipocytes from heterozygous GLUT4 knockout mice. FASEB J. 2000;14(9):1117–1125. [DOI] [PubMed] [Google Scholar]
- 75.Richter EA, Hargreaves M. Exercise, GLUT4, and skeletal muscle glucose uptake. Physiol Rev. 2013;93(3):993–1017. [DOI] [PubMed] [Google Scholar]
- 76.Charron MJ, Brosius FC, Alper SL, Lodish HF. A glucose transport protein expressed predominately in insulin-responsive tissues. Proc Natl Acad Sci USA. 1989;86:2535–2539. [DOI] [PMC free article] [PubMed] [Google Scholar]
- 77.Liu ML, Olson AL, Moye-Rowley WS, Buse JB, Bell GI, Pessin JE. Expression and regulation of the human GLUT4/muscle-fat facilitative glucose transporter gene in transgenic mice. J Biol Chem. 1992;267(17):11673–11676. [PubMed] [Google Scholar]
- 78.Choeiri C, Staines W, Messier C. Immunohistochemical localization and quantification of glucose transporters in the mouse brain. Neuroscience. 2002;111(1):19–34. [DOI] [PubMed] [Google Scholar]
- 79.Ashrafi G, Wu Z, Farrell RJ, Ryan TA. GLUT4 Mobilization Supports Energetic Demands of Active Synapses. Neuron. 2017;93(3):606–615 e603. [DOI] [PMC free article] [PubMed] [Google Scholar]
- 80.Lin HV, Ren H, Samuel VT, et al. Diabetes in mice with selective impairment of insulin action in Glut4-expressing tissues. Diabetes. 2011;60(3):700–709. [DOI] [PMC free article] [PubMed] [Google Scholar]
- 81.Reno CM, Puente EC, Sheng Z, et al. Brain GLUT4 Knockout Mice Have Impaired Glucose Tolerance, Decreased Insulin Sensitivity, and Impaired Hypoglycemic Counterregulation. Diabetes. 2017;66(3):587–597. [DOI] [PMC free article] [PubMed] [Google Scholar]
- 82.Harno E, Cottrell EC, White A. Metabolic pitfalls of CNS Cre-based technology. Cell Metab. 2013;18(1):21–28. [DOI] [PubMed] [Google Scholar]
- 83.Ren H, Yan S, Zhang B, Lu TY, Arancio O, Accili D. Glut4 expression defines an insulin-sensitive hypothalamic neuronal population. Mol Metab. 2014;3(4):452–459. [DOI] [PMC free article] [PubMed] [Google Scholar]
- 84.Ren H, Lu TY, McGraw TE, Accili D. Anorexia and Impaired Glucose Metabolism in Mice With Hypothalamic Ablation of Glut4 Neurons. Diabetes. 2015;64:405–417. [DOI] [PMC free article] [PubMed] [Google Scholar]
- 85.Tsao TS, Li J, Chang KS, et al. Metabolic adaptations in skeletal muscle overexpressing GLUT4: effects on muscle and physical activity. FASEB J. 2001;15(6):958–969. [DOI] [PubMed] [Google Scholar]
- 86.Dawes M, Moore-Harrison T, Hamilton AT, et al. Differential gene expression in high- and low-active inbred mice. BioMed research international. 2014;2014:361048. [DOI] [PMC free article] [PubMed] [Google Scholar]
- 87.Wang YX, Zhang CL, Yu RT, et al. Regulation of muscle fiber type and running endurance by PPARdelta. PLoS Biol. 2004;2(10):e294. [DOI] [PMC free article] [PubMed] [Google Scholar]
- 88.Narkar VA, Downes M, Yu RT, et al. AMPK and PPARdelta agonists are exercise mimetics. Cell. 2008;134(3):405–415. [DOI] [PMC free article] [PubMed] [Google Scholar]
- 89.Fan W, Waizenegger W, Lin CS, et al. PPARdelta Promotes Running Endurance by Preserving Glucose. Cell Metab. 2017;25(5):1186–1193 e1184. [DOI] [PMC free article] [PubMed] [Google Scholar]
- 90.Jordan SD, Kriebs A, Vaughan M, et al. CRY1/2 Selectively Repress PPARdelta and Limit Exercise Capacity. Cell Metab. 2017;26(1):243–255 e246. [DOI] [PMC free article] [PubMed] [Google Scholar]
- 91.Fan W, Evans RM. Exercise Mimetics: Impact on Health and Performance. Cell Metab. 2017;25(2):242–247. [DOI] [PMC free article] [PubMed] [Google Scholar]
- 92.Fritschi C, Quinn L. Fatigue in patients with diabetes: a review. J Psychosom Res. 2010;69(1):33–41. [DOI] [PMC free article] [PubMed] [Google Scholar]
- 93.Lasselin J, Laye S, Barreau JB, et al. Fatigue and cognitive symptoms in patients with diabetes: relationship with disease phenotype and insulin treatment. Psychoneuroendocrinology. 2012;37(9):1468–1478. [DOI] [PubMed] [Google Scholar]
- 94.Moulton CD, Pickup JC, Ismail K. The link between depression and diabetes: the search for shared mechanisms. Lancet Diabetes Endocrinol. 2015;3(6):461–471. [DOI] [PubMed] [Google Scholar]
- 95.Germain A, Ruppert D, Levine SM, Hanson MR. Metabolic profiling of a myalgic encephalomyelitis/chronic fatigue syndrome discovery cohort reveals disturbances in fatty acid and lipid metabolism. Mol Biosyst. 2017;13(2):371–379. [DOI] [PMC free article] [PubMed] [Google Scholar]
- 96.Sotzny F, Blanco J, Capelli E, et al. Myalgic Encephalomyelitis/Chronic Fatigue Syndrome - Evidence for an autoimmune disease. Autoimmun Rev. 2018;17(6):601–609. [DOI] [PubMed] [Google Scholar]
- 97.Klimas NG, Broderick G, Fletcher MA. Biomarkers for chronic fatigue. Brain Behav Immun. 2012;26(8):1202–1210. [DOI] [PMC free article] [PubMed] [Google Scholar]
- 98.Maxmen A. Biological underpinnings of chronic fatigue syndrome begin to emerge. Nature. 2017;543(7647):602. [DOI] [PubMed] [Google Scholar]
Associated Data
This section collects any data citations, data availability statements, or supplementary materials included in this article.
Supplementary Materials
Fig. S7: Slc2a4twgy/twgy mice show abnormal, low-amplitude circadian patterns of voluntary wheel-running behavior interrupted with frequent rest bouts, confirming recessive inheritance of mutation. (a) Representative actograms of B/Int-x (N12F2) mice of all three genotypes (+/+ - top, +/twgy - middle, twgy/twgy - bottom) recorded for 3 weeks under a full 12:12 LD cycle (shown in bar across the top). Plotting conventions are like those for Fig 1A. Colored vertical bars on the left side of the actograms indicate days used for quantification of wheel-running behavior. (b) Average number of wheel revolutions per min over 24h and (c) % of daily activity occurring in the light phase for mice in the +/+ (n=4 M & n=5 F), +/twgy (n=19 M & n=16 F), and twgy/twgy (n=41 M & n=45 F) groups. Means ± SD and individual data points are plotted with significant differences indicated (** = p < 0.01, *** = p < 0.001, **** = p < 0.0001).
Fig. S5: Not all abnormal phenotypes map to locus on chromosome 11. Genome-wide linkage plots for percentage of (a) activity in the light phase, (b) number of activity bouts per day, and (c) period of the free-running rhythm in DD do not show linkage to any locus (chromosomal location plotted along the X-axis). (d) Percentage of activity in the light phase, (e) number of activity bouts per day, and (f) period of the free-running rhythm in DD for mice with B6/B6 (n=26), B6/B10 (n=33), or B10/B10 (n=14) genotypes at a SNP marker (rs13481117) located on chromosome 11 at position 79252230. Means ± SD and individual data points are plotted and significant differences among groups are indicated (* p < 0.05, ** p < 0.01).
Fig. S6: Generation and phenotyping of two independent homozygous populations of mice for whole exome sequencing. B/Int-x (N11) mice were intercrossed to produce (B/Int-x (N11F2) mice and affected progeny from this cross were in-crossed to produce homozygous T-x (N11F3) mice. In addition, affected I-x (N2F19) mice were in-crossed to produce I-x (N2F20) mice. Representative actograms of (a) an unaffected B/Int-x (N11) mouse, (b) an affected I-x (N2F19) mouse, (c) an unaffected B/Int-x (N11F2) mouse, (d) an affected B/Int-x (N11F2) mouse, and (e & f) two affected T-x (N11F3) mice, which were recorded for 3 weeks in LD followed by 3 weeks in DD. Plotting conventions are as those described for Fig. 1a. (g) Body weights at ~8 weeks for male (blue) and female (red) mice of 4 generations (solid red or blue lines = mean, dashed line = ±2SD of original G3 screening population). Almost all of the mice in the two presumptive homozygous lines (T-x (N11F3) and I-x (N2F20)) show the low body-weight phenotype. (h) Quantification of the average amount of wheel-running activity per min each day for mice in the B/Int-x (N11) (n=19), (B/Int-x (N11F2) (n=128), T-x (N11F3) (n=19), and I-x (N2F20) (n=56) groups show that mice in both of the presumptive homozygous lines (T-x (N11F3) and I-x (N2F20)) have significantly lower levels of activity. Means ± SD and individual data points are plotted and significant differences among groups are indicated (**** p < 0.0001).
Fig. S3: Nocturnal voluntary wheel-running activity is interrupted by frequent periods of rest in affected mice. (a-e) Ethograms depicting behaviors, states or locations observed in images captured once every min for 15h beginning at lights off for 5 individual I-x (N2F14 or N2F15) mice for the first night of recording, with time plotted along the X-axis. Each photograph was scored on a 9 item scale using the following designations: 1) drinking, 2) eating, 3) near hopper, 4) running on wheel, 5) near wheel awake, 6) end awake, 7) end resting, 8) near wheel quiescent, and 9) end quiescent, where ‘end’ refers to the end of the cage furthest away from the wheel. Color code for each score is shown along the top. Pie charts to the right of the ethograms show the amount of time spent in each of the 9 behavioral states for the first 6h (left) and all 12h (right) of recording during the dark phase for each individual.
Fig. S4: Video recording shows behavioral quiescence during active phase in affected mice. Total number of wheel revolutions recorded for 2h to 3.5h after lights off for (a) one T-x (N3F2) mouse and 3 individual I-x (N2F21) mice, and (b) a different T-x (N3F2) and 3 individual T-x (N11F3) mice are plotted, with periods of prolonged immobility (behavioral quiescence) indicated in colored bars along the X-axis below. Periods > 40s of total immobility with low posture were scored as quiescent.
Fig. S2: Nocturnal voluntary wheel-running activity is largely consolidated in WT C57BL/6J mice. (a-b) Ethograms depicting behaviors, states or locations observed in images captured once every min for 15h beginning at lights off for 2 individual WT C57BL/6J mice, with time plotted along the X-axis. Each photograph was scored on a 9 item scale using the following designations: 1) drinking, 2) eating, 3) near hopper, 4) running on wheel, 5) near wheel awake, 6) end awake, 7) end resting, 8) near wheel quiescent, and 9) end quiescent, where ‘end’ refers to the end of the cage furthest away from the wheel. Color code for each score is shown along the top. Pie charts to the right of the ethograms show the amount of time spent in each of the 9 behavioral states for the first 6h (left) and all 12h (right) of recording during the dark phase for each individual.
Fig. S1: Identification of a low body-weight line showing a recessive inheritance pattern. Mice were screened for aberrant body-weight regulation in a large recessive forward genetics ENU screen. (a) Generation 3 (G3) mice were weighed at ~8 weeks of age (females - 17.44 ± 1.58g - n=4038; males – 21.71 ± 2.41g - n=4965). A female mouse was identified with a low body weight (large black arrow) with no overt health issues. (b) The distribution of weights for the G3 pedigree containing the identified female (n=24 F (red), n=29 M (blue)). All of the G3 males and most of the females in this pedigree show normal body weights compared to the screening population (solid red or blue lines = mean, dashed line = ±2SD of whole screening population), but only one female was > 2SD below the mean (13.03 g; indicated in black circle). This mouse was backcrossed to a WT C57BL/6J to produce N2 progeny (n=11 F & n=9 M). The N2 progeny were intercrossed to produce N2F2s (n=25 F & n=31 M). None of the N2 mice showed the low body-weight phenotype, but at least 5 of the 56 N2F2 progeny of both sexes were affected (BW > 2SD below screening mean). N3 progeny produced by crossing affected N2F2 mice back to WT C57BL/6J had body weights that fell within ± 2SD of the screening mean (n=10 F & n=7 M). The low body-weight phenotype was maintained in two separate lines (c- males & d – females - solid lines = mean, dashed lines = ±2SD of the whole screening population). The B/Int-x line (c & d – left side) consisted of alternating generations of backcrosses of affected mice to C57BL/6J and intercrosses of the resulting progeny. The I-x line (c & d – right side) consisted of consecutive generations of in-crosses of affected siblings. (e) Body weights following a 4h fast occurring in the middle of the day for male (blue) and female (red) mice of the B/Int-x (N11F2; n=26 M & n=35 F) and I-x (N2F20; n=18 M & n=17 F) lines. (f) Blood glucose (mg/dL) following a 4h fast in the middle of the day for the same mice as in (e). Means ± SD with individual data points are plotted in b-f with significant differences among groups indicated (**** p < 0.0001).