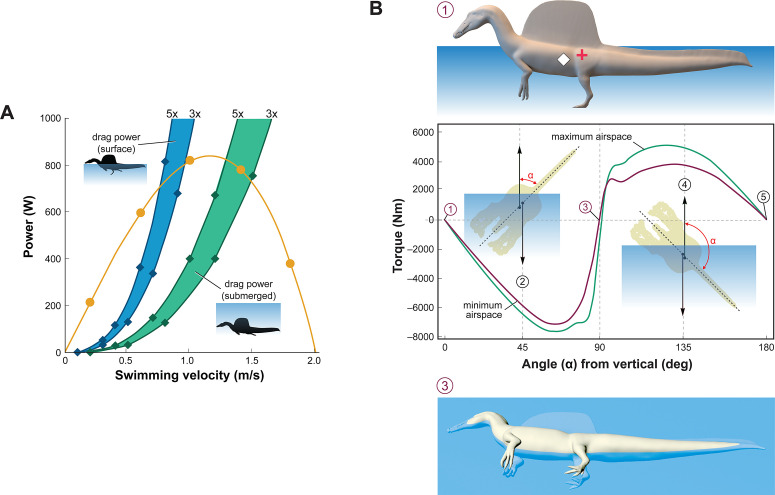
Figure 3. Biomechanical evaluation of Spinosaurus aegyptiacus in water.
(A) Tail thrust (yellow curve) and opposing drag forces as a function of swimming velocity at the surface (blue) and submerged (green), with drag during undulation estimated at three and five times stationary drag. (B) Stability curve for the flesh model of S. aegyptiacus in water showing torque between the centers of mass (red cross) and buoyancy (white diamond), unstable equilibria when upright or upside down (positions 1, 5), and a stable equilibrium on its side (position 3) irrespective of the volume of internal air space. Curves are shown for flesh models with minimum (magenta) and maximum (green) air spaces with a dashed line showing the vertical body axis and vector arrows for buoyancy (up) and center of mass (down).

