

Abstract
Background:
18F-florbetaben (FBB) and 18F-flutemetamol (FMM) amyloid PET have been developed and approved for clinical use. It is important to understand the distinct features of these ligands to compare and correctly interpret the results of different amyloid PET studies.
Objective:
We performed a head-to-head comparison of FBB and FMM to compare with regard to imaging characteristics, including dynamic range of retention, and differences in quantitative measurements between the two ligands in cortical, striatal, and white matter (WM) regions.
Methods:
Paired FBB and FMM PET images were acquired in 107 participants. Correlations of FBB and FMM amyloid deposition in the cortex, striatum, and WM were investigated and compared in different reference regions (cerebellar gray matter (CG), whole cerebellum (WC), WC with brainstem (WC + B), and pons).
Results:
The cortical SUVR (R2 = 0.97) and striatal SUVR (R2 = 0.95) demonstrated an excellent linear correlation between FBB and FMM using a WC as reference region. There was no difference in the cortical SUVR ratio between the two ligands (p = 0.90), but the striatal SUVR ratio was higher in FMM than in FBB (p < 0.001). Also, the effect size of differences in striatal SUVR seemed to be higher with FMM (2.61) than with FBB (2.34). These trends were similarly observed according to four different reference regions (CG, WC, WC + B, and pons).
Conclusion:
Our findings suggest that FMM might be better than FBB to detect amyloid burden in the striatum, although both ligands are comparable for imaging AD pathology in vivo.
Keywords: Alzheimer’s disease, amyloid imaging, 18F-florbetaben, 18F-flutemetamol, head to head
INTRODUCTION
11C-Pittsburgh Compound-B (PiB), the first and most widely used positron emission tomography (PET) ligand for detecting amyloid-β (Aβ) [1], has played an important role in Alzheimer’s disease (AD) research. However, due to limited accessibility caused by the short radioactive decay half-life of 11C (20 min), 18F (half-life, 110 min) labeled PET ligands such as 18F-florbetapir (FBP) [2],18F-florbetaben (FBB) [3], and 18F-flutemetamol (FMM) [4] have been developed and approved for clinical use. Development of these various ligands has raised questions of whether there are differences in imaging characteristics and quantitative measurement of amyloid burden among ligands. It is important to understand the distinct features of these ligands to compare and correctly interpret the results of different amyloid PET studies.
Retention and clearance rates in a particular brain region vary among amyloid PET ligands due to their unique physical and chemical characteristics [5, 6]. Increased uptake of Aβ PET ligands might represent different types of Aβ aggregates according to location. Specifically, previous imaging-pathological correlation studies have shown that increased Aβ tracer uptake in the cortex was dominated by neuritic plaques [7]. Recently, several studies have suggested that in vivo Aβ imaging enables staging of Aβ burden according to striatal involvement, which predicts worse clinical outcomes [8, 9]. Considering that diffuse plaques are commonly observed in the striatum, increased striatal Aβ uptake might be related to diffuse plaques. However, increased uptake of Aβ tracers in the white matter (WM) region is considered secondary to nonspecific binding to WM, possibly due to trapping in β-sheet structures of myelin proteins or high solubility in the myelin-associated lipid bilayer [10]. Given that FBB is derived from Congo red [11] while FMM is based on the chemical structure of thioflavin T [12], it is possible that these two ligands show different dynamic ranges or uptake in the cortex, striatum, and WM.
The standardized uptake value (SUV) ratio (SUVR), a relative measurement defined as the ratio of SUV in the target region to SUV in the reference region, is the most commonly used quantification method in brain Aβ PET images. It is difficult to compare and interpret results from research performed with different ligands and imaging techniques because the calculated SUVRs of studies differ [13]. Furthermore, the reference region with the largest stability of SUVR can be tracer specific, which precludes generalization of findings from one Aβ ligand to other ligands [14]. Therefore, studies directly comparing different radiotracers in the same subjects are needed across several reference regions.
This study comprised head-to-head comparisons of Aβ PET imaging using FBB and FMM in younger controls (YC), older controls (OC), and cognitively impaired patients from various causes. Imaging characteristics, including a dynamic range of retention, and differences in quantitative measurement were compared for the two ligands in cortical, striatum, and WM regions. We also determined whether there were differences between the two ligands in the appropriateness of reference regions.
MATERIALS AND METHODS
Participants
A total of 20 YC, 27 OC, 27 subjects with mild cognitive impairment (MCI), 29 subjects with AD, and 4 subjects with subcortical vascular dementia (SVaD) were enrolled. All participants underwent Aβ PET with both FBB and FMM, as well as magnetic resonance imaging (MRI). Healthy YC under 40 years and OCs over 65 years had 1) no history of neurologic or psychiatric disorders and 2) normal cognitive function. OCs’ cognitive function was determined using neuropsychological tests. For diagnosis of MCI, participants met Petersen’s criteria [15]: cognitive complaints reported by patients or their caregiver; scores lower than −1.0 SD of age-, sex-, and education-adjusted norms for at least one of the main cognitive domains; generally intact activities of daily living; and absence of dementia. AD was diagnosed based on the National Institute on Aging-Alzheimer’s Association (NIA-AA) research criteria for probable AD [16]. SVaD was further diagnosed when patients had subcortical vascular features defined by focal neurological symptoms [17] and significant ischemia on MRI. Significant ischemia was defined as white matter hyperintensities (WMHs) on T2-weighted or fluid-attenuated inversion recovery (FLAIR) images [18].
All participants were evaluated by clinical interview and neurologic and neuropsychologic examinations [19]. All participants underwent laboratory tests including complete blood count, blood chemistry, vitamin B12/folate, syphilis serology, and thyroid function tests. Brain MRI confirmed the absence of structural lesions including territorial cerebral infarctions, brain tumors, hippocampal sclerosis, and vascular malformations.
This study protocol was approved by the Institutional Review Board of Samsung Medical Center. Written consent was obtained from each participant, and all methods were carried out in accordance with approved guidelines.
MRI data acquisition
Standardized three-dimensional T1 turbo field echo images were acquired from all participants at Samsung Medical Center using the same 3.0-T MRI scanner (Philips Achieva; Philips Healthcare, Andover, MA, USA) with the following parameters: sagittal slice thickness, 1.0 mm, over contiguous slices with 50% overlap; no gap; repetition time (TR) of 9.9 ms; echo time (TE) of 4.6 ms; flip angle of 8°, and matrix size of 240 × 240 pixels, reconstructed to 480 × 480 over a field of view of 240 mm.
Aβ PET data acquisition
Participants underwent FBB PET and FMM PET at Samsung Medical Center using a Discovery STe PET/CT scanner (GE Medical Systems, Milwaukee, WI, USA) in three-dimensional scanning mode that examined 47 slices of 3.3 mm thickness spanning the entire brain [20, 21]. Paired FBB and FMM PET images were acquired on two separate days; there were no differences in mean interval times (4.0 ± 2.5 months across all groups) among the three groups (p = 0.89). FBB PET was performed first in approximately half of the participants (total 46; 7 AD, 10 MCI, 16 OC, 9 YC, and 4 SVaD) and FMM PET was performed first in the other half (total 61; 22 AD, 17 MCI, 11 OC, and 11 YC). CT images were acquired using a 16-slice helical CT (140 KeV, 80 mA; 3.75 mm section width) for attenuation correction. According to protocols proposed by the ligand manufacturers, a 20 min emission PET scan with dynamic mode (consisting of 4 × 5 min frames) was performed 90 min after injection of a mean dose of 311.5 MBq FBB and 185 MBq FMM, respectively. Three-dimensional (3D) PET images were reconstructed in a 128 × 128 × 48 matrix with 2 × 2 × 3.27 mm voxel size using the ordered-subsets expectation maximization (OSEM) algorithm (FBB iterations = 4 and subset = 20; FMM iterations = 4 and subset = 20).
Aβ PET imaging analysis
PET images were co-registered to individual MRI normalized to a T1-weighted MNI-152 template using SPM8 through Matlab 2014b (Mathworks, Natick, MA, USA). After standard space registration, the brain was divided into 116 grey matter regions using the Automated Anatomical Labeling (AAL) atlas, as well as white matter [22]. Four reference regions (whole cerebellum (WC), whole cerebellum and brainstem (WC + B), cerebellar cortex (CG), pons) were used, as described in the previous study [23]. The region of interest to reference uptake ratio (identical to SUVR) was used to quantify FBB and FMM retention. The global cerebral cortex, striatum, and cerebral WM SUVRs were measured by dividing SUVs of each reference region. Global cerebral cortex amyloid retention ratios were assessed from the volume-weighted average SUVR of 28 bilateral cerebral cortical volumes-of-interest (VOIs) [20, 24].
Cerebral cortical VOIs chosen for this study consisted of the following areas: bilateral frontal (superior and middle frontal gyri, medial part of superior frontal gyrus, opercular part of inferior frontal gyrus, triangular part of inferior frontal gyrus, supplementary motor area, orbital part of superior, middle, and inferior orbital frontal gyri, rectus and olfactory cortex), posterior cingulate gyri, parietal (superior and inferior parietal, supramarginal and angular gyri, and precuneus), lateral temporal (superior, middle and inferior temporal gyri, and heschl gyri), and occipital (superior, middle, and inferior occipital gyri, cuneus, calcarine fissure, and lingual and fusiform gyri). Striatum VOIs were defined by a combination of caudate and putamen. The cut-off value of Aβ positivity was calculated using iterative outlier methods. As a result, the cortical SUVR cutoff value was 1.1 for FBB and 1.03 for FMM when WC was used as a reference region.
Statistical analyses
To compare demographic characteristics, analysis of variance (ANOVA) was performed for continuous variables and chi-square tests were performed for categorical variables.
Linear regression was performed to assess correlations between cortical retention values for each pair of tracers. A paired t-test was used to compare the global cortex, striatum, and WM amyloid SUVR/SUVR ratios between FBB and FMM. Additionally, the effect size between Aβ (+) AD and YC was investigated in different reference regions to identify the most appropriate reference regions for cortical and striatal amyloid deposition between FBB and FMM PET. The effect size was calculated with the following equation:
where:
μp and μn are the average SUVR in the AD and YC groups.
and are the variances of the AD and YC groups.
Np and Nn are the numbers of participants in the AD and YC groups.
R v3.4.1 (Institute for Statistics and Mathematics, Vienna, Austria; www.R-project.org) was used for the chi-square test, ANOVA, and linear regression.
RESULTS
Participant demographics
Table 1 shows the demographic information of participants. There were no differences in age between OC, MCI, AD, and SVaD or in sex proportions among all groups (p = 0.44). The frequency of APOE ε4 carriers was 20% in YC, 37% in OC, 37% in MCI, 65% in AD, and 25% in SVaD. Frequency of FBB/FMM positivity was 0/0% in YC, 29.6/29.6% in OC, 55/51.9% in MCI, 93.1/89.7% in AD, and 50/50% in SVaD.
Table 1.
Participant demographics and clinical findings
| YC | OC | MCI | AD | SVaD | |
|---|---|---|---|---|---|
| Number of participants | 20 | 27 | 27 | 29 | 4 |
| Sex (M/F) | 11/9 | 11/16 | 12/15 | 10/19 | 3/1 |
| Age (mean±SD) | 32.0±3.9 | 73.7±4.4 | 70.7±8.4 | 70.7±9.2 | 76.5±6.5 |
| MMSE (mean±SD) | 29.9±0.4 | 28.0±2.0 | 26.7±3.4 | 20.4±6.5a | 18.0±4.6a |
| Amyloid SUVR positivity (N (%)) (FBB/FMM) | 0/0 (0/0) | 8/8 (29.6/29.6) | 15/14 (55.6/51.9) | 27/26 (93.1/89.7) | 2/2 (50/50) |
| APOE ε4 (0/1/2), carrier (%) | 16/4/0 20 | 17/9/1 37.0 | 17/5/5 37.0 | 10/14/5 65.5 | 3/1/0 25 |
Statistical analyses were performed with chi-square tests for sex and APOE ε4. Analysis of variance (ANOVA) was used for age and MMSE. YC, young control; OC, old control; MCI, mild cognitive impairment; AD, Alzheimer’s disease; SVaD, subcortical vascular dementia; M/F, male/female; SD, standard deviation; MMSE, Mini-Mental State Examination; APOE ε4, apolipoprotein E ε4 allele.
p < 0.05 between AD or SVaD and OC or YC.
Correlation between FMM and FBB SUVRs in cortex, striatum, and white matter
The global cortical SUVR (R2 = 0.97) and striatal SUVR (R2 = 0.95) demonstrated an excellent linear correlation between FBB and FMM when using WC as a reference region (Fig. 1A, E). However, the WM SUVR showed a lower correlation (R2 = 0.74) between FBB and FMM (Fig. 1I). Slope range for FBB–FMM was 0.95 in global cortical SUVR, 1.09 in striatal SUVR, and 0.97 in WM SUVR.
Fig. 1.
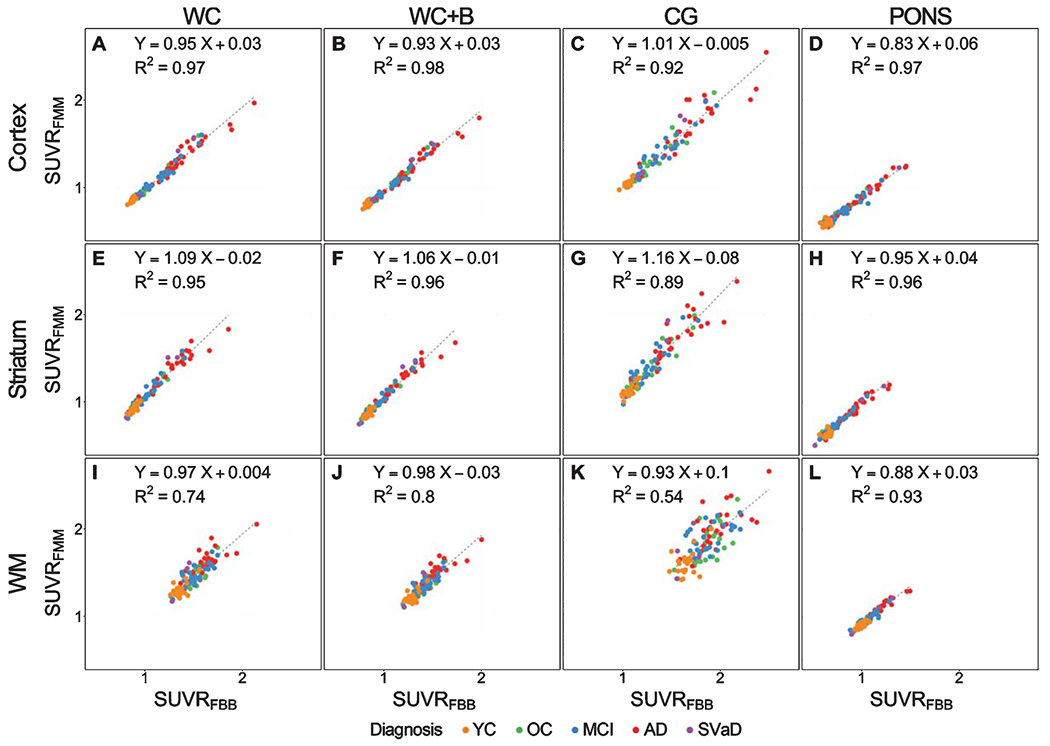
Plots showing a relationship between 18F-FMM SUVR and 18F-FBB SUVR. Cortical, striatal, and white matter SUVR correlation between FBB and FMM SUVR with reference of (A, E, I) whole cerebellum (WC), (B, F, J) whole cerebellum + brainstem (WC + B), (C, G, K) cerebellar gray matter (CG), and (D, H, L) pons. Regression equations are shown for each scatterplot. FBB, 18F-florbetaben; FMM, 18F-flutemetamol; YC, young control; OC, old control; MCI, mild cognitive impairment; AD, Alzheimer’s disease; SVaD, subcortical vascular dementia; SUVR, standardized uptake value ratio.
When using other regions as the reference region, the cortical SUVR between FBB and FMM demonstrated excellent linear correlation with WC + B (R2 = 0.98), CG (R2 = 0.92), and pons (R2 = 0.97) (Fig. 1B–D). Slope ranges for FBB–FMM global SUVR associations were also similar across all reference regions: WC + B (0.93), CG (1.01), and pons (0.83). The striatal SUVR between FBB and FMM was also highly correlated in WC + B (R2 = 0.96), CG (R2 = 0.89), and pons (R2 = 0.96) (Fig. 1F–H). The slope range for FBB–FMM striatal SUVR was also similar across all reference regions: WC + B (1.06), CG (1.16), and pons (0.95). The white matter SUVR between FBB and FMM was highly correlated when using the pons (R2 = 0.93) as a reference region, but other reference regions showed lower correlation: WC + B (R2 = 0.80), CG (R2 = 0.54) (Fig. 1J–L). However, the slope ranges for FBB–FMM WM SUVR were similar across all reference regions: WC + B (0.98), CG (0.93), and pons (0.88).
Comparison between FMM and FBB SUVRs in cortex, striatum, and white matter
The global cortical, striatal, and WM SUVRs were compared between FMM and FBB using paired t-tests (Fig. 2). For Aβ deposition in the cortex and WM, FBB SUVR was significantly higher than FMM SUVR (p < 0.001) when using WC as the reference region. However, for Aβ deposition in the striatum, FMM SUVR was significantly higher than FBB SUVR (p < 0.001) (Fig. 2A). Because WM is considered off-target, the global cortex and striatal SUVR was compared against that of WM (SUVRregion/(SUVRregion+SUVRWM)) between FBB and FMM by paired t-test (Fig. 3). There was no difference in the global SUVR ratio between FBB and FMM (p = 0.90). However, the striatal SUVR ratio was higher in FMM than in FBB (p < 0.001) when using WC as the reference region (Fig. 3A).
Fig. 2.

Comparison of amyloid-β deposition in the global cortex, striatum, and white matter (WM) between FBB and FMM. Cortical, striatal, and white matter SUVR were compared between FMM and FBB by paired t-test with (A) whole cerebellum (WC), (B) whole cerebellum + brainstem (WC + B), (C) cerebellar gray matter (CG), and (D) pons as reference regions. FBB, 18F-florbetaben; FMM, 18F-flutemetamol; SUVR, standardized uptake value ratio.
Fig. 3.
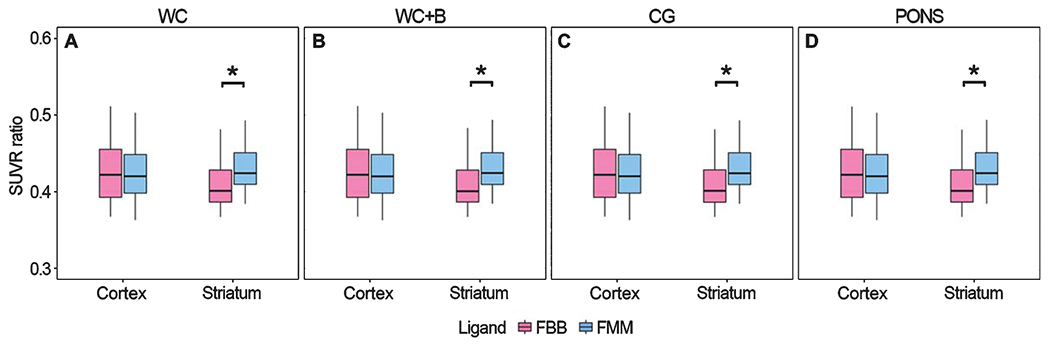
Comparison of cortical and striatal SUVR ratio between FBB and FMM. Cortical and striatal SUVR ratio against WM (SUVRregion/(SUVRregion + SUVRWM)) between FBB and FMM were compared by paired t-test with (A) whole cerebellum (WC), (B) whole cerebellum + brainstem (WC + B), (C) cerebellar gray matter (CG), and (D) pons as reference regions. FBB, 18F-florbetaben; FMM, 18F-flutemetamol; SUVR, standardized uptake value ratio.
When using other regions as a reference region for Aβ deposition in the cortex and WM, FBB SUVR was significantly higher than FMM SUVR with WC + B (p < 0.001) and pons (p < 0.001) but not with CG as a reference region (p = 0.67 for cortex, p = 0.75 for WM) (Fig. 2B–D). However, for Aβ deposition in the striatum, FMM SUVR was significantly higher than FBB SUVR when WC + B and CG (p < 0.001) were used as reference regions, but not pons (p = 0.86). The FBB SUVR ratio of the global cortex was higher than that of FMM, but it was not significantly different in WC + B (p = 0.91), CG (p = 0.90), and pons (p = 0.91). However, the FMM SUVR ratio of the striatum was significantly higher in all reference regions (p < 0.001) (Fig. 3B–D).
Effect size between Aβ (+) AD group and YC group in global cortex and striatum
The differences of SUVR between Aβ (+) AD and YC are represented as effect sizes (Table 2). When cortical SUVR was analyzed with WC as a reference region, the effect size of cortical SUVR with FMM (3.01) was similar to that of FBB (2.92). However, the effect size of striatal SUVR was higher in FMM (2.61) than in FBB (2.34).
Table 2.
Summary statistics of cortical and striatal SUVR
| FBB |
FMM |
|||||||||
|---|---|---|---|---|---|---|---|---|---|---|
| WC | WC+B | CG | PONS | WC | WC+B | CG | PONS | |||
| Cortical SUVR | AD | Mean | 1.43 | 1.34 | 1.73 | 1.02 | 1.37 | 1.27 | 1.74 | 0.91 |
| SD | 0.25 | 0.24 | 0.30 | 0.20 | 0.23 | 0.21 | 0.30 | 0.17 | ||
| YC | Mean | 0.87 | 0.83 | 1.05 | 0.64 | 0.85 | 0.80 | 1.05 | 0.59 | |
| SD | 0.02 | 0.02 | 0.03 | 0.03 | 0.02 | 0.02 | 0.04 | 0.03 | ||
| Effect Size | 2.92 | 2.87 | 3.04 | 2.51 | 3.01 | 2.94 | 3.05 | 2.44 | ||
| Striatal SUVR | AD | Mean | 1.29 | 1.21 | 1.56 | 0.92 | 1.37 | 1.27 | 1.74 | 0.90 |
| SD | 0.22 | 0.21 | 0.27 | 0.17 | 0.22 | 0.21 | 0.30 | 0.16 | ||
| YC | Mean | 0.89 | 0.84 | 1.07 | 0.65 | 0.92 | 0.86 | 1.13 | 0.64 | |
| SD | 0.03 | 0.03 | 0.05 | 0.03 | 0.05 | 0.04 | 0.07 | 0.04 | ||
| Effect Size | 2.34 | 2.31 | 2.44 | 2.09 | 2.61 | 2.56 | 2.59 | 2.21 | ||
FBB, 18F-florbetaben, FMM, 18F-flutemetamol; WC, whole cerebellum; WC + B, whole cerebellum + brainstem; CG, cerebellar gray matter; AD, Alzheimer’s disease; YC, young control; SUVR, standardized uptake value ratio; SD, standard deviation.
When using other regions as a reference region, the highest effect size of differences in cortical SUVR between Aβ (+) AD and YC was generated using CG as a reference region in both FBB (3.04) and FMM (3.05). The effect size of striatal SUVR was highest when CG was used as a reference region in FBB (2.44) and was highest when WC was used as a reference region in FMM (2.61).
DISCUSSION
In this study, FBB and FMM were compared in the same subjects to evaluate measured quantitative Aβ deposits in the cortex, striatum, and WM. FMM and FBB were highly correlated with each other in the global cortex, striatum, and WM. However, when comparing the striatal SUVR ratio against WM, the striatal SUVR ratio was higher in FMM than in FBB. These trends were similarly observed according to four different reference regions (CG, WC, WC + B, and pons). Our findings suggest that FMM might be better than FBB to detect amyloid burden in the striatum, although both ligands are comparable for imaging AD pathology in vivo. Our findings provide a better understanding of the distinct features of each ligand, which will facilitate widespread and large-scale multicenter research of AD.
Previously, uptake of FBB and FMM ligands was shown to be highly correlated with that of PiB. However, the degrees of slopes for PiB were lower than one, suggesting that their dynamic ranges in the cortex might be lower than that of PiB [25, 26]. Also, F-ligands have higher uptake in the WM than PiB ligand. To our knowledge, the uptake of F-ligands has not been extensively compared in the cortex, striatum, and WM. In the present study, FBB and FMM were highly correlated with each other in these regions. Considering that these ligands are highly correlated with PiB ligand in the cortex, our findings were generally consistent with those of previous studies.
FMM is slightly superior to FBB for assessing the Aβ burden in the striatum, as supported by our observations. First, FMM showed a wider dynamic range in the striatum than FBB. Second, FMM showed higher SUVR in the striatum than FBB. After controlling for the ‘off-target’ effects of WM SUVR, the differences in striatal SUVR ratio for the ligands were prominent. Finally, the effect size of striatal SUVR differences between Aβ (+) AD and YC was higher in FMM than in FBB. A comparison of F ligands with amyloid deposition in the striatum has not been conducted yet. Our findings have some clinical implications. According to pathologic Aβ Thal staging [27], deposition of Aβ plaques starts in the neocortex (phase 1) and limbic area (phase 2) and then extends down into the subcortical structures (striatum and amygdala, phase 3), brainstem (phase 4), and cerebellum (phase 5). In pathologic studies, the presence of amyloid plaques in the striatum predicts higher Braak neurofibrillary tangle stage [28] and a greater prevalence of dementia and clinicopathologic AD [29, 30]. Indeed, several previous studies using amyloid PET have shown that striatal amyloid deposition is related to worse cognitive function and more rapid decline in cognitive function and made PET staging of amyloidosis using striatum in FBP and PiB [8, 9, 31]. A recent study by FMM PET described that Aβ Thal staging by thresholds of cortical and striatal amyloid SUVRs estimates that can be easily translated into neuropathological phases of Aβ deposition [32]. Another study, using FBB PET, showed that in vivo amyloid staging by assessment of cortical and striatal tracer uptake by machine learning-based algorithm [33]. The in vivo amyloid stage in FBB was also associated with cognitive function and cerebral atrophy. However, the studies so far have not compared the cortical and striatal SUVR by ligands using a head to head method. Therefore, given that striatal amyloid deposition is related to worse cognitive function, we should consider these distinct features when selecting F-ligands for the detection of amyloid burden.
It remains unclear why FMM shows better retention in the striatum than FBB. However, recent studies demonstrated that FMM PET has reasonable accuracy for the detection of histologically-proven striatal Aβ deposits [34, 35]. This might be related to the mosaic feature of Aβ deposition in the striatum. Aβ PET generally quantifies fibrillar brain Aβ aggregates, especially neuritic plaques. In fact, binding of Aβ ligands is proportional to the fibrillar content of Aβ lesions [36]. Despite its lower fibrillarity, Aβ ligands might detect diffuse plaques when there is a high density of diffuse plaques [37]. Considering that diffuse plaques predominantly exist in the striatum [38], our findings suggest that FMM might be more sensitive for detecting lower fibrillarity of diffuse plaques in the striatum than FBB. Alternatively, it is possible that other physical or chemical properties of FMM, including lipophilicity and metabolites, are more likely to be involved in this phenomenon.
We also found that the cortical uptake of FMM was comparable to that of FBB. In contrast with the striatum, FBB showed a wider dynamic range and higher uptake in the cortex than FMM. However, FBB also showed a wider dynamic range and higher uptake in WM, which is considered an off-target region. Thus, when comparing the cortical SUVR ratio against WM, there was no difference in the cortical SUVR ratio between the two ligands. In fact, differences in the effect size between the two ligands were smaller in the cortex than in the striatum.
In the present study, these trends were similarly observed across four different reference regions (CG, WC, WC + B, and pons), although the dynamic range and tracer retention of FBB and FMM varied depending on reference regions and target regions. Specifically, all reference regions consistently showed no difference in cortical SUVR ratio between the two ligands, but the striatal SUVR ratio was higher with FMM than with FBB. Also, the effect size of striatal SUVR difference between Aβ (+) AD and YC was higher with FMM than with FBB regardless of the reference region. Identification of the appropriate reference region is of great importance in clinical trials that demand accurate measurement of Aβ accumulation as a biomarker of AD. The currently used quantification method, SUVR, can be affected by the selected reference region. Thus, our findings suggest that regardless of the reference region, FMM is better than FBB to detect amyloid burden in the striatum.
The strength of our study is its direct comparison of two different amyloid tracers in the same subjects with standardized protocols and the same PET scanners. However, this study has several limitations. First, the lack of pathologic verification is a weakness of this study. Further studies are needed to validate our study using pathologic Aβ burden, especially diffuse plaques in the striatum, as the gold standard. Second, Centiloid scores were not determined for comparison. It needs a generation of a parametric Centiloid image for sampling smaller regions of interest such as the striatum. Further research is needed between FBB and FMM. Third, a comparison with PIB and FBP has not been carried out. Fourth, we did not evaluate a test-retest variation. Finally, the generalization of our results might be difficult due to differences between PET scanners, acquisition protocols, and reconstruction methods at other sites. Nevertheless, our findings provide a better understanding of distinct features of FBB and FMM ligands, which will propel standardized clinical and research use of Aβ imaging.
In conclusion, a head-to-head comparison of FBB and FMM PET was performed. FBB and FMM PET had highly correlated and similar cortical retention with little variance according to the reference region, indicating that these PET ligands are comparable for imaging amyloid pathology in vivo. However, FMM had higher tracer retention with larger effect sizes in the striatum than FBB. Thus, our findings suggest that FMM is slightly superior to FBB in assessing amyloid positivity in the striatum.
ACKNOWLEDGMENTS
This research was supported by a National Research Foundation of Korea Grant funded by the Korean government (MSIP) (No. NRF-2017R1A2B2005081), Research of Korea Centers for Disease Control and Prevention (No. 2018-ER6203-01), grant of the Korean Health Technology R&D Project, Ministry of Health & Welfare, Republic of Korea (HI19C1132) and Chonnam National University Hospital Biomedical Research Institute (BCRI20012).
Authors’ disclosures available online (https://www.j-alz.com/manuscript-disclosures/20-0079r1).
REFERENCES
- [1].Klunk WE, Engler H, Nordberg A, Wang Y, Blomqvist G, Holt DP, Bergstrom M, Savitcheva I, Huang GF, Estrada S, Ausen B, Debnath ML, Barletta J, Price JC, Sandell J, Lopresti BJ, Wall A, Koivisto P, Antoni G, Mathis CA, Langstrom B (2004) Imaging brain amyloid in Alzheimer’s disease with Pittsburgh Compound-B. Ann Neurol 55, 306–319. [DOI] [PubMed] [Google Scholar]
- [2].Wong DF, Rosenberg PB, Zhou Y, Kumar A, Raymont V, Ravert HT, Dannals RF, Nandi A, Brasic JR, Ye W, Hilton J, Lyketsos C, Kung HF, Joshi AD, Skovronsky DM, Pontecorvo MJ (2010) In vivo imaging of amyloid deposition in Alzheimer disease using the radioligand 18F-AV-45 (florbetapir [corrected] F 18). J Nucl Med 51, 913–920. [DOI] [PMC free article] [PubMed] [Google Scholar]
- [3].Rowe CC, Ackerman U, Browne W, Mulligan R, Pike KL, O’Keefe G, Tochon-Danguy H, Chan G, Berlangieri SU, Jones G, Dickinson-Rowe KL, Kung HP, Zhang W, Kung MP, Skovronsky D, Dyrks T, Holl G, Krause S, Friebe M, Lehman L, Lindemann S, Dinkelborg LM, Masters CL, Villemagne VL (2008) Imaging of amyloid beta in Alzheimer’s disease with 18F-BAY94-9172, a novel PET tracer: Proof of mechanism. Lancet Neurol 7, 129–135. [DOI] [PubMed] [Google Scholar]
- [4].Vandenberghe R, Van Laere K, Ivanoiu A, Salmon E, Bastin C, Triau E, Hasselbalch S, Law I, Andersen A, Korner A, Minthon L, Garraux G, Nelissen N, Bormans G, Buckley C, Owenius R, Thurfjell L, Farrar G, Brooks DJ (2010) 18F-flutemetamol amyloid imaging in Alzheimer disease and mild cognitive impairment: A phase 2 trial. Ann Neurol 68, 319–329. [DOI] [PubMed] [Google Scholar]
- [5].Schmidt ME, Chiao P, Klein G, Matthews D, Thurfjell L, Cole PE, Margolin R, Landau S, Foster NL, Mason NS, De Santi S, Suhy J, Koeppe RA, Jagust W, Alzheimer’s Disease Neuroimaging Initiative (2015) The influence of biological and technical factors on quantitative analysis of amyloid PET: Points to consider and recommendations for controlling variability in longitudinal data. Alzheimers Dement 11, 1050–1068. [DOI] [PubMed] [Google Scholar]
- [6].Landau SM, Breault C, Joshi AD, Pontecorvo M, Mathis CA, Jagust WJ, Mintun MA, Alzheimer’s Disease Neuroimaging Initiative (2013) Amyloid-beta imaging with Pittsburgh compound B and florbetapir: Comparing radiotracers and quantification methods. J Nucl Med 54, 70–77. [DOI] [PMC free article] [PubMed] [Google Scholar]
- [7].Seo SW, Ayakta N, Grinberg LT, Villeneuve S, Lehmann M, Reed B, DeCarli C, Miller BL, Rosen HJ, Boxer AL, O’Neil JP, Jin LW, Seeley WW, Jagust WJ, Rabinovici GD (2017) Regional correlations between [(11)C]PIB PET and post-mortem burden of amyloid-beta pathology in a diverse neuropathological cohort. Neuroimage Clin 13, 130–137. [DOI] [PMC free article] [PubMed] [Google Scholar]
- [8].Cho SH, Shin JH, Jang H, Park S, Kim HJ, Kim SE, Kim SJ, Kim Y, Lee JS, Na DL, Lockhart SN, Rabinovici GD, Seong JK, Seo SW, Alzheimer’s Disease Neuroimaging Initiative (2018) Amyloid involvement in subcortical regions predicts cognitive decline. Eur J Nucl Med Mol Imaging 45, 2368–2376. [DOI] [PMC free article] [PubMed] [Google Scholar]
- [9].Hanseeuw BJ, Betensky RA, Mormino EC, Schultz AP, Sepulcre J, Becker JA, Jacobs HIL, Buckley RF, LaPoint MR, Vannini P, Donovan NJ, Chhatwal JP, Marshall GA, Papp KV, Amariglio RE, Rentz DM, Sperling RA, Johnson KA, Alzheimer’s Disease Neuroimaging Initiative, Harvard Aging Brain Study (2018) PET staging of amyloidosis using striatum. Alzheimers Dement 14, 1281–1292. [DOI] [PMC free article] [PubMed] [Google Scholar]
- [10].Mathis CA, Mason NS, Lopresti BJ, Klunk WE (2012) Development of positron emission tomography beta-amyloid plaque imaging agents. Semin Nucl Med 42, 423–432. [DOI] [PMC free article] [PubMed] [Google Scholar]
- [11].Barthel H, Gertz HJ, Dresel S, Peters O, Bartenstein P, Buerger K, Hiemeyer F, Wittemer-Rump SM, Seibyl J, Reininger C, Sabri O, Florbetaben Study Group (2011) Cerebral amyloid-beta PET with florbetaben (18F) in patients with Alzheimer’s disease and healthy controls: A multicentre phase 2 diagnostic study. Lancet Neurol 10, 424–435. [DOI] [PubMed] [Google Scholar]
- [12].Nelissen N, Van Laere K, Thurfjell L, Owenius R, Vandenbulcke M, Koole M, Bormans G, Brooks DJ, Vandenberghe R (2009) Phase 1 study of the Pittsburgh compound B derivative 18F-flutemetamol in healthy volunteers and patients with probable Alzheimer disease. J Nucl Med 50, 1251–1259. [DOI] [PubMed] [Google Scholar]
- [13].Su Y, Blazey TM, Owen CJ, Christensen JJ, Friedrichsen K, Joseph-Mathurin N, Wang Q, Hornbeck RC, Ances BM, Snyder AZ, Cash LA, Koeppe RA, Klunk WE, Galasko D, Brickman AM, McDade E, Ringman JM, Thompson PM, Saykin AJ, Ghetti B, Sperling RA, Johnson KA, Salloway SP, Schofield PR, Masters CL, Villemagne VL, Fox NC, Forster S, Chen K, Reiman EM, Xiong C, Marcus DS, Weiner MW, Morris JC, Bateman RJ, Benzinger TL, Dominantly Inherited Alzheimer Network (2016) Quantitative amyloid imaging in autosomal dominant Alzheimer’s disease: Results from the DIAN Study Group. PLoS One 11, e0152082. [DOI] [PMC free article] [PubMed] [Google Scholar]
- [14].De Santi S, Catafau A, Seibyl J, Bullich S (2016) Robustness of 18F-Florbetaben SUVR cutoff quantification across reference regions and standards of truth. J Nucl Med 57, 458. [Google Scholar]
- [15].Petersen RC, Smith GE, Waring SC, Ivnik RJ, Tangalos EG, Kokmen E (1999) Mild cognitive impairment: Clinical characterization and outcome. Arch Neurol 56, 303–308. [DOI] [PubMed] [Google Scholar]
- [16].McKhann GM, Knopman DS, Chertkow H, Hyman BT, Jack CR Jr., Kawas CH, Klunk WE, Koroshetz WJ, Manly JJ, Mayeux R, Mohs RC, Morris JC, Rossor MN, Scheltens P, Carrillo MC, Thies B, Weintraub S, Phelps CH (2011) The diagnosis of dementia due to Alzheimer’s disease: Recommendations from the National Institute on Aging-Alzheimer’s Association workgroups on diagnostic guidelines for Alzheimer’s disease. Alzheimers Dement 7, 263–269. [DOI] [PMC free article] [PubMed] [Google Scholar]
- [17].Kim SH, Seo SW, Go SM, Chin J, Lee BH, Lee JH, Han SH, Na DL (2011) Pyramidal and extrapyramidal scale (PEPS): A new scale for the assessment of motor impairment in vascular cognitive impairment associated with small vessel disease. Clin Neurol Neurosurg 113, 181–187. [DOI] [PubMed] [Google Scholar]
- [18].Kim HJ, Yang JJ, Kwon H, Kim C, Lee JM, Chun P, Kim YJ, Jung NY, Chin J, Kim S, Woo SY, Choe YS, Lee KH, Kim ST, Kim JS, Lee JH, Weiner MW, Na DL, Seo SW (2016) Relative impact of amyloid-beta, lacunes, and downstream imaging markers on cognitive trajectories. Brain 139, 2516–2527. [DOI] [PubMed] [Google Scholar]
- [19].Kang SH, Park YH, Lee D, Kim JP, Chin J, Ahn Y, Park SB, Kim HJ, Jang H, Jung YH, Kim J, Lee J, Kim J-S, Cheon BK, Hahn A, Lee H, Na DL, Kim YJ, Seo SW (2019) The cortical neuroanatomy related to specific neuropsychological deficits in Alzheimer’s continuum. Dement Neurocogn Disord 18, 77–95. [DOI] [PMC free article] [PubMed] [Google Scholar]
- [20].Jang H, Jang YK, Kim HJ, Werring DJ, Lee JS, Choe YS, Park S, Lee J, Kim KW, Kim Y, Cho SH, Kim SE, Kim SJ, Charidimou A, Na DL, Seo SW (2019) Clinical significance of amyloid beta positivity in patients with probable cerebral amyloid angiopathy markers. Eur J Nucl Med Mol Imaging 46, 1287–1298. [DOI] [PubMed] [Google Scholar]
- [21].Kim SE, Woo S, Kim SW, Chin J, Kim HJ, Lee BI, Park J, Park KW, Kang DY, Noh Y, Ye BS, Yoo HS, Lee JS, Kim Y, Kim SJ, Cho SH, Na DL, Lockhart SN, Jang H, Seo SW (2018) A nomogram for predicting amyloid PET positivity in amnestic mild cognitive impairment. J Alzheimers Dis 66, 681–691. [DOI] [PubMed] [Google Scholar]
- [22].Tzourio-Mazoyer N, Landeau B, Papathanassiou D, Crivello F, Etard O, Delcroix N, Mazoyer B, Joliot M (2002) Automated anatomical labeling of activations in SPM using a macroscopic anatomical parcellation of the MNI MRI single-subject brain. Neuroimage 15, 273–289. [DOI] [PubMed] [Google Scholar]
- [23].Klunk WE, Koeppe RA, Price JC, Benzinger TL, Devous MD Sr., Jagust WJ, Johnson KA, Mathis CA, Minhas D, Pontecorvo MJ, Rowe CC, Skovronsky DM, Mintun MA (2015) The Centiloid Project: Standardizing quantitative amyloid plaque estimation by PET. Alzheimers Dement 11, 1-15.e11-14. [DOI] [PMC free article] [PubMed] [Google Scholar]
- [24].Park JH, Seo SW, Kim C, Kim SH, Kim GH, Kim ST, Jeon S, Lee JM, Oh SJ, Kim JS, Choe YS, Lee KH, Shin JS, Kim CH, Noh Y, Cho H, Yoon CW, Kim HJ, Ye BS, Ewers M, Weiner MW, Lee JH, Werring DJ, Na DL (2014) Effects of cerebrovascular disease and amyloid beta burden on cognition in subjects with subcortical vascular cognitive impairment. Neurobiol Aging 35, 254–260. [DOI] [PMC free article] [PubMed] [Google Scholar]
- [25].Mountz JM, Laymon CM, Cohen AD, Zhang Z, Price JC, Boudhar S, McDade E, Aizenstein HJ, Klunk WE, Mathis CA (2015) Comparison of qualitative and quantitative imaging characteristics of [11C]PiB and [18F]flutemetamol in normal control and Alzheimer’s subjects. Neuroimage Clin 9, 592–598. [DOI] [PMC free article] [PubMed] [Google Scholar]
- [26].Villemagne VL, Mulligan RS, Pejoska S, Ong K, Jones G, O’Keefe G, Chan JG, Young K, Tochon-Danguy H, Masters CL, Rowe CC (2012) Comparison of 11C-PiB and 18F-florbetaben for Abeta imaging in ageing and Alzheimer’s disease. Eur J Nucl Med Mol Imaging 39, 983–989. [DOI] [PubMed] [Google Scholar]
- [27].Thal DR, Rub U, Orantes M, Braak H (2002) Phases of A beta-deposition in the human brain and its relevance for the development of AD. Neurology 58, 1791–1800. [DOI] [PubMed] [Google Scholar]
- [28].Braak H, Braak E(1990) Alzheimer’s disease: Striatal amyloid deposits and neurofibrillary changes. J Neuropathol Exp Neurol 49, 215–224. [PubMed] [Google Scholar]
- [29].Beach TG, Sue LI, Walker DG, Sabbagh MN, Serrano G, Dugger BN, Mariner M, Yantos K, Henry-Watson J, Chiarolanza G, Hidalgo JA, Souders L (2012) Striatal amyloid plaque density predicts Braak neurofibrillary stage and clinicopathological Alzheimer’s disease: Implications for amyloid imaging. J Alzheimers Dis 28, 869–876. [DOI] [PMC free article] [PubMed] [Google Scholar]
- [30].Thal DR, Beach TG, Zanette M, Heurling K, Chakrabarty A, Ismail A, Smith AP, Buckley C (2015) [(18)F]flutemetamol amyloid positron emission tomography in preclinical and symptomatic Alzheimer’s disease: Specific detection of advanced phases of amyloid-beta pathology. Alzheimers Dement 11, 975–985. [DOI] [PubMed] [Google Scholar]
- [31].Grothe MJ, Barthel H, Sepulcre J, Dyrba M, Sabri O, Teipel SJ (2017) In vivo staging of regional amyloid deposition. Neurology 89, 2031–2038. [DOI] [PMC free article] [PubMed] [Google Scholar]
- [32].Thal DR, Beach TG, Zanette M, Lilja J, Heurling K, Chakrabarty A, Ismail A, Farrar G, Buckley C, Smith APL (2018) Estimation of amyloid distribution by [(18)F]flutemetamol PET predicts the neuropathological phase of amyloid β-protein deposition. Acta Neuropathol 136, 557–567. [DOI] [PMC free article] [PubMed] [Google Scholar]
- [33].Kim JP, Kim J, Kim Y, Moon SH, Park YH, Yoo S, Jang H, Kim HJ, Na DL, Seo SW, Seong JK (2019) Staging and quantification of florbetaben PET images using machine learning: Impact of predicted regional cortical tracer uptake and amyloid stage on clinical outcomes. Eur J Nucl Med Mol Imaging, doi: 10.1007/s00259-019-04663-3. [DOI] [PMC free article] [PubMed] [Google Scholar]
- [34].Beach TG, Thal DR, Zanette M, Smith A, Buckley C (2016) Detection of striatal amyloid plaques with [18F]flutemetamol: Validation with postmortem histopathology. J Alzheimers Dis 52, 863–873. [DOI] [PubMed] [Google Scholar]
- [35].Ikonomovic MD, Fantoni ER, Farrar G, Salloway S (2018) Infrequent false positive [(18)F]flutemetamol PET signal is resolved by combined histological assessment of neuritic and diffuse plaques. Alzheimers Res Ther 10, 60. [DOI] [PMC free article] [PubMed] [Google Scholar]
- [36].Klunk WE, Wang Y, Huang GF, Debnath ML, Holt DP, Shao L, Hamilton RL, Ikonomovic MD, DeKosky ST, Mathis CA (2003) The binding of 2-(4’-methylaminophenyl)benzothiazole to postmortem brain homogenates is dominated by the amyloid component. J Neurosci 23, 2086–2092. [DOI] [PMC free article] [PubMed] [Google Scholar]
- [37].Kantarci K, Yang C, Schneider JA, Senjem ML, Reyes DA, Lowe VJ, Barnes LL, Aggarwal NT, Bennett DA, Smith GE, Petersen RC, Jack CR Jr., Boeve BF (2012) Antemortem amyloid imaging and beta-amyloid pathology in a case with dementia with Lewy bodies. Neurobiol Aging 33, 878–885. [DOI] [PMC free article] [PubMed] [Google Scholar]
- [38].Gearing M, Levey AI, Mirra SS (1997) Diffuse plaques in the striatum in Alzheimer disease (AD): Relationship to the striatal mosaic and selected neuropeptide markers. J Neuropathol Exp Neurol 56, 1363–1370. [DOI] [PubMed] [Google Scholar]