

Abstract
Background
Studies have shown high early mortality after initiation of highly active antiretroviral therapy (HAART). We examined change in three-year survival and predictors of mortality of patients initiating HAART in Ethiopia since 2007 to 2019.
Methods
A retrospective cohort study was conducted in 47 health facilities (HFs) using records of 11,013 adult patients initiating HAART from 2007 to 2019. Study subjects were stratified as four different cohorts based on their calendar year of HAART initiation: 2007-2010, 2011-2013, 2014-2016, and 2017-2019. HFs were selected using probability proportional to size of patients. Survival rate and predictors of mortality were estimated by the calendar year using the Kaplan-Meier and Cox proportional hazard, respectively. We generated a pooled estimate of survival rate and predicators of mortality.
Results
Data from 1881, 3868, 3004, and 2260 patients were retrieved from each of the cohorts. Overall mortality for all cohorts at all times was 10.3%. A gradual decline of mortality was observed in the first three years of follow-up since 2007-2016 which were 21.37%, 10.03%, and 4.34% among patients who initiated HAART in 2007, 2011, and 2014 respectively. A mortality jump of 9.25% was observed among patents initiating HAART in 2017, which coincided with political instability happened in the country. Of the 21,638 person-years of follow-up among 11,013 adults, mortality was 5.23/100 person-years, while disaggregated by the cohorts, it was 14.77, 5.06, 2.12, and 4.17 per 100 person-years, respectively. Among all the cohorts, patients with CD4 count of ≤200 cells/mm3, unsuppressed viral load, poor adherence, and drug resistance in all cohorts, respectively, have overall 2.0 (95%CI = 1.35 − 2.69), 4.66 (95%CI = 2.53 − 6.72), 6.78 (95%CI = 3.4 − 10.3), and 10.02 (95%CI = 6.91 − 13.82) times of mortality risk than those without. Patients with bedridden for cohort initiating HAART during 2007 and 2011 were 2.0 (95%CI = 1.35 − 2.69) times of mortality risk than those without.
Conclusion
Patients initiating HAART from 2007 to 2016 have continuously improved their survival during three-year cohort follow-up in Ethiopia. The significant decline of survival among those who initiate HAART as of 2017 calls for program intervention. Low CD4 counts, unsuppressed viral load, poor adherence, and drug resistance could be used as predictors for increased mortality to monitor the quality of HAART and improve clinical management of HIV/AIDS patients.
1. Background
Human immunodeficiency virus (HIV) is a global public health challenge and main cause for morbidity and mortality in sub-Saharan African countries since the first case was reported in the 1980s [1]. Expanded access to highly active antiretroviral therapy (HAART) significantly reduced morbidity and mortality due to HIV infection [2]. The aim of HAART is to significantly reduce viral load to undetectable levels (up to 50 copies/ml) resulting to slow disease progression by increasing CD4 cell count [3]. As one of the benefits of HAART, there was a 26% decline in AIDS-related deaths globally since 2010. Low survival and high mortality at initial HAART stage is a critical challenge to the local public health programs in the high HIV/AIDS-burden countries [4].
HIV/AIDS-related mortality of patients may depend on multiple general features including host factors, the patterns of diseases present, access to health care, diagnostic routines, and therapeutic interventions at the local level [5–7]. Specific risk factors related to mortality include higher viral load, low CD4 count, regimen intolerance, previous exposure to ARV drugs, malnutrition, medication adherence, missed clinic appointment, TB-HIV coinfection, delayed ART initiation, and age group [3, 8–10].
In Ethiopia with an estimated national prevalence of 0.96% and a total of 622,326 people living with HIV (PLHIV) in 2020 [11], free ART service was launched in hospitals by 2005 and primary healthcare centers in 2006 as a part of the service scaling-up [12]. Since 2015, Ethiopia adopted the global recommendation of test and treat strategy [13]. Despite the few studies that addressed survival among people taking HAART in Ethiopia, there has been inconsistency with the reports. These studies indicated survival among PLHIV taking HAART in Ethiopia ranging from 4.2% to 43% during the 36 to 72 months of follow-up, in different settings [3, 10, 14–19]. It has been also revealed that mortality rates of HIV patients were high within the first year of ART treatment in Ethiopia, and around 20,000 PLHIV died each year [20–23].
Robust evidence on survival rate and predictors of mortality at early stage of HAART initiation is, therefore, the crucial information needed for evidence-based decision-making in order to improve the patients' clinical management. In this regard, previous studies in Ethiopia were inconclusive. Therefore, this study was undertaken with objectives to estimate survival rate and identify predictors of mortality among PLHIV during the first three years of HAART between the years 2007 and 2019.
2. Methods
2.1. Study Design and Setting
A retrospective cohort study was conducted from December 2019 to March 2020. During this time of data collection, we retrieved data from 11,013 study participants attending 47 health facilities (HFs) who were initiated for HAART as of 2007. There were 9 regional and 2 city administrations and 1,047 HFs providing ART service for 578,739 PLHIV by 2019 in Ethiopia [24].
2.2. Study Population and Eligibility
All HIV-infected adults (age ≥ 15 years old) who were enrolled for ART care and support from December 2007 to November 2019 in the 47 selected HFs were considered as a study population.
2.3. Sample Size Determination and Sampling Procedures
We used a two-stage, stratified cluster sampling for this study. First, we include HFs which was providing ART service on or before 2007 (N = 311). For feasibility reason, we selected 47 (15%) HFs using probability proportional to population size (PPPS) of HAART patients in the HFs. In the second stage, we stratified the study participants in the selected HFs in a different cohort groups 2007-2009, 2010-2013, 2014-2016, and 2017-2019 based on the calendar year of HAART initiation. The list of ART patients with their unique ART number was retrieved from the ART clinic of the HFs, and a sample of ART patients was selected from each of the selected HFs using systematic random sampling according to the existing list of ART patients.
The sample size was determined for each of the cohorts by using EPI Info version 7.2.1 [25]. For estimating the sample size, We assum type I error to be 5% with 80% power using two population proportions on exposure status. Two populations were categorized by CD4 count as the main exposure variable for HIV/AIDS-related deaths during the follow-up period. The assumed proportions of probability of survival of adults whose CD4 count ≤ 200 cells/mm3 were 35.5% during 2007-2009 [17], 59% during 2010-2013 [26], and 66.4% during 2010-2019 [27].
With a design effect of 1.5, the sample sizes for each of the cohorts (2007-2009, 2010-2013, 2014-2016, and 2017-2019) were 1730, 3558, 2114, and 2114, respectively. Hence, the minimum sample size required for this study was calculated to be 10,131. Assuming exclusion of records of lost to follow-up (LTFU), transfer-in, and transfer-out, patients initiated for HAART before 2007 and children under the age of 15 to be 23% the final sample size required were 12,462.
2.4. Study Variables
2.4.1. Independent Variables
The independent variables are baseline demographic characteristics (age, gender, marital status, educational status, and occupation) and clinical characteristics (World Health Organization (WHO) clinical stage, CD4 count (cells/mm3), hemoglobin (mg/dl), ART regimens, adherence, and baseline functional status (ambulatory or bedridden)).
2.4.2. Dependent Variable
Functional status at 3 years of follow-up (alive or death) were considered as outcome variable.
Baseline functional status was categorized into two groups: normal activity and bedridden (>50% of the day during the past month) [28] as recorded by the ART site physician. The WHO clinical stage was categorized into four groups (stage I, stage II, stage III, and stage IV) [29]. CD4 count was categorized as ≤200 cells/mm3 and >200 cells/mm3 as defined by WHO consolidated guideline [30]. Medication adherence was measured using self-report measure consisted of a single item querying the number of prescribed doses the participant had missed in a specified time period (n = 30 days) [31]. Hence, classification was defined as poor if the percentage of the missed dose was <85% (>6 of the 30 doses or >9 of the 60 doses) as documented by ART physician, fair adherence was defined if the percentage of the missed dose was between 85% and 94% (3-5 of the 30 doses or 3-9 of the 60 doses), and good adherence was defined if the percentage of missed dose is above >95% (<2 of the 30 doses or <3 of the 60 doses). Hemoglobin reference range were defined as ≤12.5 mg/dl or >12.5 mg/dl as defined by the reference range for the normal adult population in Ethiopia [32].
Date of death was recorded either electronically or from the medical register of HIV-infected patients who died during the follow-up period from all causes. Patients missing their follow-up visits according to their appointment schedule for more than 3 months were recorded as loss to follow-up for whom the date of the last registered follow-up visit was recorded to define as loss to follow-up.
2.5. Measurement of Plasma Viral Load and CD4 Count
Plasma viral load (PVL) test was performed at the regional testing laboratories in Ethiopia, using two different approaches: (1) COBAS® AmpliPrep/COBAS TaqMan® HIV-1 version 2.0 (v2.0), based on in vitro amplification of HIV-1 RNA from plasma with detection thresholds ranging from 20 (lower) to 10,000,000 (upper) RNA copies/ml designed specifically for HIV-1 groups M and O, and (2) Abbott Real-Time HIV-1 test Ref 2G3190, based on in vitro amplification by RT-PCR for the quantification of HIV-1 in plasma. Both rounds of VL tests were performed as per manufacturers' instructions. Second viral load tests were done at six-month follow-up for patients with initial viral load ≥ 1,000 copies/ml using similar techniques.
CD4 cells were enumerated using whole blood samples prior to extraction of the plasma samples using FACScount® automated cell counter (Becton-Dickinson, Franklin Lakes, New Jersey, USA) at the health facilities.
2.6. RT-PCR and Nested PCR
In-house assay protocols developed and validated by the Chinese Center for Disease Prevention and Control (CCDC) were used for PCR amplification and sequencing [33]. Briefly, one-step RT-PCR was performed using 50 ml reaction, which consisted of 10 ml of RNA extracts, 0.16 mM each of primers PRTMF1 and RT-R1, and 0.5 ml SuperScript™ III One-Step RT/Platinum Taq HiFi Enzyme Mix and 1x reaction buffer mixture containing Mg2+ and deoxyribonucleotide triphosphates (dNTPs) (Invitrogen, Carlsbad, CA). RT-PCR condition was an initial cycle RT step at 50°C for 45 min and 94°C for 2 minutes and followed by 40 cycles of PCR at 94°C for 15 sec, 50°C for 20 sec, and 72°C for 2 minutes and an extension at 72°C for 10 min. For nested PCR, 2 ml of RT-PCR product was added to a 50 ml reaction containing 0.12 mM of the inner primers PRT-F2 and RTR2, 1x GeneAmp Gold Buffer II, 2 mM MgCl2, 400 mM each dNTP with 2.5 U of AmpliTaq Gold LD DNA polymerase (Applied Biosystems, Foster City, CA). After initial denaturation at 94°C for 4 min, 40 cycles of PCR were performed in GeneAmp 9700 thermocycler with the PCR conditions as 94°C for 15 sec, 55°C for twenty seconds, and 72 for 2 min and following an extension at 72°C for 10 min. A 1% agarose gel electrophoresis with a product size of 1,084 base pairs was used to confirm nested PCR product. The confirmed PCR products were purified using Qiagen PCR purification kits and used for cycle sequencing reaction with BigDye terminator cycle sequencing kit 3.1 (Applied Biosystems, CA).
2.7. Data Collection and Processing
Data were collected from standard medical record registers and electronic records at ART sites adopted by the Ministry of Health of Ethiopia. There were three available registers: the first register was the Pre-ART register where all confirmed HIV-positive patients who visit ART site were registered. Then, all the patients who started ART regimen were transferred to ART register at the date of treatment initiation. The third register was patient's follow-up form. For each patient, the initial follow-up visit was scheduled for every two weeks after treatment initiation, and then on a monthly basis and as required based on adherence of the patient, medical records were updated for every patient during each follow-up visit. There was electronic medical record which comprises all history of HIV-positive clients since identified positive.
The data elements retrieved include clinical characteristics and laboratory results and WHO clinical stage, CD4 counts, hemoglobin, ART regimens, medications, and functional status (alive or dead). Moreover, data of demographic characteristics (age, gender, marriage status, educational status, and occupation) and individual factors (medication adherence) were also retrieved. Data of LTFU was separately retrieved and analyzed from the recorded report.
Data management training was given for data collectors and supervisors who were health professionals working at the selected health facilities. The procedure was controlled by the investigator of the study. Completed data collection tools examined their completeness and consistency. Data from the records were entered in to a preestablished data entry template (i.e., CSPRO) using tablet computers.
2.8. Statistical Analysis
The patients' characteristics were described in terms of frequency, mean/median value for continuous data, and percentages for categorical data. Continuous variables were also compared using t tests or rank sum tests after testing the normality of the distribution using the Shapiro-Wilk test. HAART initiation date and the date of outcome (alive or death) were used as the start as well as end point of follow-up time, respectively. Patients who were alive and in care were censored as of the date of their last clinic visit.
Data analysis was done for each of the cohorts according to their calendar year. Follow-up time (in year) was calculated from the date of ART initiation to the date of death or censoring. The Kaplan-Meier analysis was done to estimate the survival rate of the study participants. The Cox proportional hazard regression was calculated to determine significant factors related to survival rate. We used both crude and adjusted hazard ratios (HRs) at 95% confidence intervals, and candidate variables with P < 0.2 were considered to the multivariable Cox regression model. Independent variables with values of <0.05 within the multivariable Cox regression model were considered statistically significant predictors of mortality. The proportional hazard assumption was checked by both graphical and statistical tests of the goodness-of-fit test (Schoenfeld's method). All data analysis was done using STATA version 16.0 for each of the cohorts.
We finally conducted a meta-analysis for the survival rate of the different cohorts to get a pooled point estimate. Moreover, we conducted a meta-analysis for the predictors of mortality also to generate the pooled estimate of hazard ratio for the duration of 2007-2019.
3. Result
3.1. Characteristics of the Study Participants
A total of 11,013 HIV patients attending 47 selected HFs were included in this study. Briefly, a data of 1881, 3868, 3004, and 2260 patients were retrieved from the cohorts.
Of the total patients, 7152 (64.94%) were female and 10,089 (91.61%) were from the urban setting. The mean age of the cohorts was 40 years, ranging from 15 to 90 years old. More than half of the study participants were from Amhara, Oromia, Tigray, and SNNPR areas, which accounted 1555 (14.1%), 1542 (14%), 1504 (13.6%), and 1392 (12.6%), respectively. More than two-thirds of study participants were either with primary school education (42.9%) or no formal education (25%). About half of the study participants 5381 (48.9%) were married while 2261 (20.5%) of them were divorced, and equal number of them were widowed 2087 (19%). Predominant population of the study was government employees, house wives, and merchant which accounted 2087 (19%), 1840 (16.7), and 1767 (16%), respectively (Table 1).
Table 1.
Demographic characteristics of people taking HAART in Ethiopia (2007-2019) enrolled to the study (N = 11,013).
| Variable | Frequency | Proportion (%) | |
|---|---|---|---|
| Region | Tigray | 1504 | 13.66 |
| Afar | 623 | 5.66 | |
| Amhara | 1555 | 14.12 | |
| Oromia | 1542 | 14 | |
| Somalia | 448 | 4.07 | |
| Benishangul | 487 | 4.42 | |
| SNNP | 1391 | 12.63 | |
| Gambella | 678 | 6.16 | |
| Harari | 610 | 5.54 | |
| Dire Dawa | 452 | 4.1 | |
| Addis Ababa | 1723 | 15.65 | |
|
| |||
| Gender | Female | 7152 | 64.94 |
| Male | 3861 | 35.06 | |
|
| |||
| Residency | Urban | 10089 | 91.61 |
| Rural | 924 | 8.39 | |
|
| |||
| Educational status | No formal education | 2764 | 25.1 |
| Primary school education | 4720 | 42.86 | |
| Secondary/high school education | 2174 | 19.74 | |
| College or university | 1355 | 12.3 | |
|
| |||
| Marital status | Single | 1306 | 11.86 |
| Married | 5381 | 48.86 | |
| Divorced | 2261 | 20.53 | |
| Widowed | 2065 | 18.75 | |
|
| |||
| Occupation | Government employees | 2087 | 18.95 |
| Merchant | 1767 | 16.04 | |
| Driver | 335 | 3.04 | |
| Housewives | 1840 | 16.71 | |
| Student | 386 | 3.5 | |
| Unemployed | 1435 | 13.03 | |
| Other | 3163 | 28.72 | |
|
| |||
| Age (year) | 15-24 | 5 | 0.05 |
| 25-34 | 436 | 3.96 | |
| 35-44 | 2870 | 26.06 | |
| 45-54 | 4314 | 39.17 | |
| 55-64 | 2244 | 20.38 | |
| 65-74 | 877 | 7.96 | |
| 75-84 | 235 | 2.13 | |
| ≥85 | 32 | 0.29 | |
|
| |||
| Total | 11,013 | ||
3.2. Mortality among People Initiating HAART in Ethiopia
Of the 21,638 person-years of follow-up among 11,013 study participants, mortality was 5.23/100 person-years, while disaggregated by the cohorts, it was 14.77, 5.06, 2.12, and 4.17 per 100 person-years, respectively. Mortality among people initiating HAART in Ethiopia during the year 2007 to 2019 at the first three years of follow-up was 10.3%. For all the cohorts, overall mortality was 21.37%, 10.03%, 4.34%, and 9.25%, respectively (Figure 1 and Table 2). Patients in the cohort initiating HAART by 2007 had the highest mortality accounting 20.32% at the first year followed by 22.54% and 25.47% during the second and third year of follow-up, respectively. For cohort initiating HAART by 2010, mortality was 6.65%, 9.18% and 14.54% during the first, second and third year of the follow-up period, respectively. Moreover, mortality for cohort initiating HAART by 2014 was 5.14%, 4.04%, and 4.20% during the first, second, and third year follow-up periods, respectively. However, there were a relatively higher mortality during the cohorts of initiating HAART by 2017 compared to 2014 which accounted 18.76%, 8.2%, and 5.51% during the first, second, and third year of follow-up, respectively (Figure 2).
Figure 1.

Overall survival among people initiating HAART in Ethiopia. (a) Survival among cohort 2007-2010. (b) Survival among cohort 2011-2013. (c) Survival among cohort 2014-2016. (d) Survival among cohorts 2017-2019.
Table 2.
Mortality among PLHIV initiating HAART in Ethiopia disaggregated by different characteristics and calendar years of HAART initiation (2007-2019).
| Characteristics | 2007-2010 | 2011-2013 | 2014-2016 | 2017-2019 | |
|---|---|---|---|---|---|
| Region | Tigray | 66/307 (21.50) | 53/567 (9.35) | 16/374 (4.28) | 30/256 (11.72) |
| Afar | 11/58 (18.97) | 19/220 (8.64) | 10/187 (5.35) | 11/158 (6.96) | |
| Amhara | 69/282 (24.47) | 56/554 (10.11) | 27/414 (6.52) | 22/305 (7.21) | |
| Oromia | 46/210 (21.90) | 48/538 (8.92) | 19/454 (4.19) | 31/340 (9.12) | |
| Somalia | 10/49 (20.41) | 14/136 (10.29) | 11/144 (7.64) | 16/119 (13.45) | |
| Benishangul | 23/120 (19.17) | 17/155 (10.97) | 4/126 (3.17) | 5/86 (5.81) | |
| SNNP | 29/191 (15.18) | 57/542 (10.52) | 12/391 (3.07) | 22/267 (8.24) | |
| Gambella | 19/76 (25.00) | 13/208 (6.25) | 7/192 (3.65) | 10/202 (4.95) | |
| Harari | 23/113 (20.35) | 18/182 (9.89) | 5/172 (2.91) | 21/143 (14.69) | |
| Dire Dawa | 9/51 (17.65) | 21/165 (12.73) | 4/154 (2.60) | 12/82 (14.63) | |
| Addis Ababa | 97/424 (22.88) | 72/601 (11.98) | 18/396 (4.55) | 29/302 (9.60) | |
|
| |||||
| Age (year) | 15-24 | 5/37 (13.51) | 5/98 (5.10) | 2/130 (1.54) | 15/171 (8.77) |
| 25-34 | 45/254 (17.72) | 89/849 (10.48) | 39/931 (4.19) | 66/835 (7.90) | |
| 35-44 | 165/783 (21.07) | 150/1578 (9.51) | 56/1175 (4.77) | 82/779 (10.53) | |
| 45-54 | 122/523 (23.33) | 92/887 (10.37) | 22/534 (4.12) | 25/300 (8.33) | |
| 55-64 | 44/208 (21.15) | 43/351 (12.25) | 10/183 (5.46) | 16/135 (11.85) | |
| ≥65 | 21/76 (27.63) | 9/105 (8.57) | 4/51 (7.84) | 5/40 (12.50) | |
|
| |||||
| Gender | Female | 244/1168 (20.89) | 251/2490 (10.08) | 80/1987 (4.03) | 131/1507 (8.69) |
| Male | 158/713 (22.16) | 137/1378 (9.94) | 53/1017 (5.21) | 78/753 (10.36) | |
|
| |||||
| Residency | Urban | 383/1797 (21.31) | 350/3575 (9.79) | 118/2683 (4.40) | 188/2034 (9.24) |
| Rural | 19/84 (22.62) | 38/293 (12.97) | 15/321 (4.67) | 21/226 (9.29) | |
|
| |||||
| Educational status | No formal education | 78/378 (20.63) | 81/958 (8.46) | 45/786 (5.73) | 60/642 (9.35) |
| Primary school education | 159/778 (20.44) | 183/1660 (11.02) | 51/1323 (3.85) | 72/959 (7.51) | |
| Secondary school | 105/448 (23.44) | 70/746 (9.38) | 25/575 (4.35) | 44/405 (10.86) | |
| College or university | 60/277 (21.66) | 54/504 (10.71) | 12/320 (3.75) | 33/254 (12.99) | |
|
| |||||
| Marital status | Single | 35/181 (19.34) | 44/411 (10.71) | 17/369 (4.61) | 37/345 (10.72) |
| Married | 186/886 (20.99) | 180/1920 (9.38) | 67/1469 (4.56) | 103/1106 (9.31) | |
| Divorced | 88/381 (23.10) | 76/740 (10.27) | 28/665 (4.21) | 43/475 (9.05) | |
| Widowed | 93/433 (21.48) | 88/797 (11.04) | 21/501 (4.19) | 26/334 (7.78) | |
|
| |||||
| Occupation | Government employee | 88/405 (21.73) | 88/805 (10.93) | 18/526 (3.42) | 35/351 (9.97) |
| Merchant | 65/289 (22.49) | 63/632 (9.97) | 25/489 (5.11) | 37/357 (10.36) | |
| Driver | 23/77 (29.87) | 12/108 (11.11) | 7/91 (7.69) | 7/59 (11.86) | |
| Housewife | 67/295 (22.71) | 66/648 (10.19) | 18/479 (3.76) | 38/418 (9.09) | |
| Student | 9/57 (15.79) | 14/122 (11.48) | 1/116 (0.86) | 12/91 (13.19) | |
| Unemployed | 39/223 (17.49) | 50/489 (10.22) | 21/424 (4.95) | 23/299 (7.69) | |
| Other | 111/535 (20.75) | 95/1064 (8.93) | 43/879 (4.89) | 57/685 (8.32) | |
|
| |||||
| Type of HAART | ABC, 3TC, EFV | 1/6 (16.67) | 1/11 (9.09) | 0/6 (0.00) | 0/4 (0.00) |
| AZT, 3TC, EFV | 41/192 (21.35) | 51/417 (12.23) | 10/225 (4.44) | 14/80 (17.50) | |
| ABC, 3TC, NVP | 97/438 (22.15) | 109/1035 (10.53) | 17/448 (3.79) | 9/102 (8.82) | |
| AZT, 3TC, NVP | 1/2 (50.00) | 0/4 (0.00) | 3/79 (3.80) | 118/1278 (9.23) | |
| TDF, 3TC, EFV | 133/608 (21.88) | 110/1040 (10.58) | 55/1184 (4.65) | 141/1464 (9.63) | |
|
| |||||
| Functional status-baseline | Ambulatory | 372/1690 (15.71) | 368/3649 (10.08) | 127/2937 (4.32) | 11/73 (15.07) |
| Bedridden | 30/191 (22.01) | 20/219 (9.13) | 6/67 (8.96) | 209/2260 (9.25) | |
|
| |||||
| WHO clinical stage | Clinical stage I | 14/73 (19.18) | 32/423 (7.57) | 23/653 (3.52) | 42/559 (7.51) |
| Clinical stage II | 68/330 (20.61) | 65/813 (8.00) | 36/774 (4.65) | 89/747 (11.91) | |
| Clinical stage III | 238/1149 (20.71) | 246/2161 (11.38) | 60/1341 (4.47) | 17/147 (11.56) | |
| Clinical stage IV | 82/329 (24.92) | 45/471 (9.55) | 14/236 (5.93) | 209/2260 (9.25) | |
|
| |||||
| ∗∗Adherence | Good | 370/1842 (20.09) | 366/3829 (9.56) | 128/2983 (4.29) | 0/14 (0.00) |
| Fair | 12/17 (70.59) | 6/20 (30.00) | 0/11 (0.00) | 4/17 (719.25) | |
| Poor | 20/22 (90.91) | 16/19 (84.21) | 5/10 (50.00) | 209/2260 (64.01) | |
|
| |||||
| CD4 count (cells/mm3) | ≤200 | 334/1298 (25.73) | 317/2526 (12.55) | 95/1680 (5.65) | 175/1600 (18.65) |
| >201 | 49/514 (9.53) | 57/1237 (4.61) | 27/1265 (5.65) | 125/821 (15.23) | |
|
| |||||
| Hemoglobin (mg/dl) | ≤12.5 | 182/892 (20.40) | 162/1333 (12.15) | 33/744 (4.45) | 392/1961 (19.98) |
| >12.5 | 217/984 (22.05) | 226/2525 (8.95) | 100/2252 (4.45) | 31/299 (10.37) | |
|
| |||||
| Viral suppression | Yes | 334/1298 (25.73) | 317/2526 (12.55) | 95/1680 (5.65) | 175/1600 (18.65) |
| No | 49/514 (9.53) | 57/1237 (4.61) | 27/1265 (5.65) | 125/821 (15.23) | |
|
| |||||
| ∗HIV-DR | Yes | 544/699 (77.8) | |||
| No | 155/699 (22.2) | ||||
|
| |||||
| Total | 402/1881 (21.37) | 388/3868 (10.03) | 133/3004 (4.43) | 209/2260 (9.25) | |
|
| |||||
| Lost to follow-up (LTFU) | 500/2283 (25.26) | 708/4479 (16.90) | 204/3196 (6.63) | 504/2685 (19.72) | |
Figure 2.
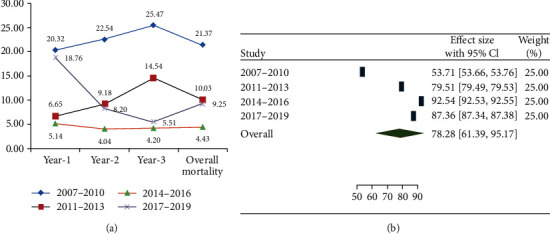
(a) Proportion of mortality among people initiating HAART in Ethiopia by different calendar year of HAART initiation (A, B, C, and D). (b) Pooled estimate for overall survival among people initiating HAART in Ethiopia (2007-2019).
While mortality was disaggregated by the different demographic and clinical characteristics, the highest mortality for the cohort were among patients initiating HAART by 2007 were from Gambella and Amhara regions which was 25% and 24.47%, respectively. For the cohort initiating HAART in 2010, the high mortality was from Dire Dawa and Addis Ababa which accounted 12.73% and 11.98%. Considering cohort initiating HAART by 2010, there were no difference in mortality among the different regions in the country while the high mortality of cohort initiating HAART by 2017 was from Harari and Dire Dawa which accounted 14.69% and 14.63%, respectively. There were no differences among the cohorts with regard to the different age bands, gender, residency, and educational status. However, the high mortality was among divorced and widowed during the cohorts initiating HAART by 2007 which accounted 23.10% and 21.48%, respectively. Drivers were at higher mortality compared to other occupations across all the cohorts since 2007 to 2019 which accounted 29.87% during cohorts initiating HAART by 2007 to 11.86% by cohorts initiating HAART by 2017 (Table 2).
The highest mortality during the cohort's initiating HAART in 2007 was among people taking AZT, 3TC, and NVP which accounted 50%; then after, there were similarities in mortality among the different regimens by cohorts initiating HAART by 2010 and 2014 cohorts while AZT, 3TC, and EFV accounted the highest mortality by the cohorts initiating HAART by 2017 which accounted 17.50%. The high mortality was among bedridden patients by the cohorts of initiating HAART by 2007 which accounted 22.01%, and there were relative similarities among the different cohorts thereafter. Mortality among patients with poor adherence was high across all the cohorts which accounted 90.91%, 84.21%, 50.00%, and 64.01%, respectively. There was high mortality among patients with CD4 count ≤ 200 cells/mm3 across all the different segments of the cohorts which accounted 25.73%, 12.55%, 5.65%, and 18.65% during all the cohorts, respectively (Table 2).
3.3. Survival among People Initiating HAAR T in Ethiopia
Overall survival rate among PLHIV initiating HAART in Ethiopia from 2007 to 2019 within three years of follow-up was 78.8% (95%CI = 61.39 − 95.17) (Figure 1). Survival among all the cohorts was found to be 53.71% (95%CI = 53.66 − 53.76), 79.51% (95%CI = 79.49 − 79.53), 92.54% (95%CI = 92.53 − 92.55), and 87.36% (95%CI = 87.34 − 87.38), respectively (Figure 1). The mean survival time among all the cohorts was 2.59 (95%CI = 2.55, 2.63), 2.90 (95%CI = 2.89, 2.92), 2.95 (95%CI = 2.94, 2.96), and 2.88 (95%CI = 2.87, 2.90), respectively (Figure 1).
3.4. Predictors of Mortality among People Taking HAART in Ethiopia
Adherence, CD4 count, and functional status were found to be predictors of mortality among people taking HAART in Ethiopia. Briefly, patients with poor adherence were at 4.65 (95%CI = 2.90, 7.48), 12.29 (95%CI = 7.06, 21.40), 8.54 (95%CI = 2.71, 26.94), and 7.07 (95%CI = 3.74, 13.38) times of mortality risk for all cohorts, respectively, compared to those with good adherence. CD4 count of ≤200 cells/mm3 was at 2.71 (95%CI = 2.01, 3.66), 2.57 (95%CI = 1.93, 3.42), 2.46 (95%CI = 1.60, 3.77), and 2.70 (95%CI = 2, 3.64) times of mortality risk for all the cohorts, respectively, compared to those with CD4 count > 200 cells/mm3. Being bedridden were at 1.92 (95%CI = 1.28, 2.89) and 2.30 (95%CI = 1.40, 3.78) times risk of mortality among the cohorts of initiating HAART by 2007 and 2010, respectively (Table 3).
Table 3.
Predictors of mortality within the first three of HAART initiation among PLHIV in Ethiopia (2007-2019).
| Characteristics | 2007-2010 (CHR) | 2007-2010 (aHR) | 2011-2013(CHR) | 2011-2013 (aHR) | 2014-2016(CHR) | 2014-2016 (aHR) | 2017-2019 (CHR) | 2017-2019 (aHR) pooled aHR | ||||
|---|---|---|---|---|---|---|---|---|---|---|---|---|
| CHR | (95.0% CI), sig. | aHR (95% CI),sig. | CHR | (95.0% CI), sig. | aHR (95.0% CI0, sig. | CHR | (95.0% CI), sig. | aHR (95% CI),sig. | CHR | (95.0% CI), sig. | aHR (95.0% CI) sig. aHR (95.0% CI) | |
| Region | ||||||||||||
| Tigray (ref.) | 1 | |||||||||||
| Afar | 0.9 | (0.64, 1.25) 0.52 | 0.81 | (0.56, 1.17) 0.26 | 0.9 | (0.45, 1.79) 0.75 | 1.28 | (0.75, 2.17) 0.36 | 1.69 (0.99, 2.89) 0.05 | |||
| Amhara | 1.21 | (0.64, 2.31) 0.56 | 0.81 | (0.48, 1.37) 0.44 | 1.13 | (0.51, 2.51) 0.76 | 0.82 | (0.40, 1.68) 0.58 | 0.99 (0.47, 2.09) 0.98 | |||
| Oromia | 1.24 | (0.90, 1.71) 0.19 | 0.83 | (0.58, 1.19) 0.30 | 1.43 | (0.77, 2.65) 0.26 | 0.73 | (0.41, 1.30) 0.29 | 0.94 (0.53, 1.68) 0.84 | |||
| Somalia | 1.14 | (0.79, 1.64) 0.48 | 0.74 | (0.51, 1.07) 0.11 | 0.92 | (0.48, 1.77) 0.80 | 0.96 | (0.57, 1.60) 0.86 | 1.3 (0.76, 2.23) 0.34 | |||
| Benishangul | 0.97 | (0.50, 1.87) 0.92 | 0.85 | (0.48, 1.52) 0.58 | 1.57 | (0.73, 3.36) 0.25 | 1.55 | (0.83, 2.90) 0.17 | 1.66 (0.89, 3.12) 0.11 | |||
| SNNP | 0.94 | (0.58, 1.51) 0.80 | 0.8 | (0.46, 1.38) 0.42 | 0.79 | (0.26, 2.36) 0.67 | 0.58 | (0.22, 1.51) 0.26 | 0.64 (0.24, 1.69) 0.37 | |||
| Gambella | 0.78 | (0.51, 1.20) 0.26 | 0.97 | (0.68, 1.38) 0.85 | 0.66 | (0.31, 1.40) 0.28 | 0.96 | (0.54, 1.69) 0.88 | 1.31 (0.72, 2.41) 0.38 | |||
| Harari | 1.28 | (0.78, 2.12) 0.33 | 0.58 | (0.32, 1.05) 0.07 | 0.84 | (0.34, 2.05) 0.70 | 0.57 | (0.28, 1.20) 0.14 | 0.86 (0.41, 1.8) 0.69 | |||
| Dire Dawa | 1.05 | (0.66, 1.66) 0.85 | 0.71 | (0.42, 1.20) 0.20 | 0.66 | (0.24, 1.80) 0.42 | 1.59 | (0.90, 2.81) 0.11 | 2.01 (1.1, 3.66) 0.02 | |||
| Addis Ababa | 1.1 | (0.55, 2.20) 0.78 | 0.96 | (0.59, 1.58) 0.88 | 0.59 | (0.20, 1.75) 0.34 | 1.65 | (0.84, 3.28) 0.15 | 1.94 (0.95, 3.96) 0.07 | |||
| Education | ||||||||||||
| No education | 1.15 | (0.81, 1.62) 0.44 | 0.86 | (0.59, 1.25) 0.43 | 0.91 (0.63, 1.32) 0.63 | 1.02 | (0.49, 2.16) 0.95 | 0.81 | (0.50 ,1.33) 0.41 | 0.83 (0.52, 1.35) 0.46 | ||
| Primary school | 1.16 | (0.78, 1.74) 0.46 | 0.79 | (0.53, 1.20) 0.27 | 0.82 (0.58, 1.18) 0.29 | 1.37 | (0.64, 2.92) 0.41 | 0.73 | (0.44, 1.24) 0.24 | 0.81 (0.52, 1.26) 0.35 | ||
| Secondary school | 1.08 | (0.77, 1.52) 0.66 | 1.08 | (0.76, 1.52) 0.68 | 1.07 (0.78, 1.47) 0.66 | 0.94 | (0.46, 1.91) 0.87 | 0.54 | (0.34, 0.87) 0.01 | 0.58 (0.38, 0.9) 0.01 | ||
| College (ref.) | 1 | |||||||||||
| Functional status | ||||||||||||
| Ambulatory (ref.) | 1 | |||||||||||
| Bedridden | 1.69 | (1.05 ,2.75) 0.03 | 1.92 (1.28, 2.89) 0.00 | 2.06 | (1.15, 3.68) 0.01 | 2.30(1.40, 3.78) 0.00 | 1.1 | (0.31, 2.61) 0.95 | 0.96 | (0.44, 2.13) 0.93 | ∞2.0 (1.35-2.69) | |
| Adherence | ||||||||||||
| Good (ref.) | 1 | |||||||||||
| Fair | 0.18 | (0.10, 0.35) 0.00 | 3.77 (1.95, 7.32) 0.00 | 0.07 | (0.03, 0.14) 0.00 | 3.10 (1.37, 7.05) 0.01 | 0.14 | (0.02, 1.05) 0.06 | 0.00 (0.00, 0.001) 0.95 | 0.14 | (0.06, 0.30) 0.00 | 0 (0, 0.001) 0.94 |
| Poor | 7.90 | (2.26, 12.37) 0.01 | 4.65 (2.90, 7.48) 0.00 | 12.25 | (10.07, 15.93) 0.04 | 12.29 (7.06, 21.40)0.00 | 6.46 | (2.00, 11.03) 0.02 | 8.54 (2.71, 26.94) 0.00 | 5.42 | (4.00, 9.01) 0.03 | 7.07 (3.74, 13.38) 0.01 ∞6.78 (3.4-10.3) |
| CD4 count (cells/mm 3) | ||||||||||||
| ≤200 | 2.67 | (1.83, 3.90) 0.00 | 2.71 (2.01, 3.66) 0.00 | 2.38 | (1.69, 3.36) 0.00 | 2.57 (1.93, 3.42) 0.00 | 2.68 | (1.57, 4.59) 0.00 | 2.46 (1.60, 3.77) 0.00 | 2.74 | (1.87, 4.00) 0.00 | 2.7 (2.0, 3.64) 0.01 ∞2.6 (2.2-3.0) |
| >201 (ref.) | 1 | |||||||||||
| HIVDR | ||||||||||||
| Yes | 10.2 | (4.31, 18.4) 0.03 | 9.42 (12.52, 6.64) 0.021 | 9.21 | (4.31, 14.62) 0.01 | 8.29 (5.81, 12.42) 0.002 | 9.67 | (5.44, 13.01) 0.00 | 11.01 (7.22, 15.81) 0.002 | 10.62 | (7.51, 13.74) 0.01 | 10.31 (7.41, 13.92) 0.001 ∞10.02 (6.91, 13.82) |
| No (ref.) | 1 | |||||||||||
| Viral suppression | ||||||||||||
| Suppressed (ref.) | 1 | |||||||||||
| Not suppressed | 4.21 | (2.37, 6.41) 0.00 | 3.92 (1.90, 5.63) 0.00 | 4.62 | (2.51, 6.32) 0.00 | 5.32 (2.61, 8.22) 0.01 | 3.22 | (1.37, 5.68) 0.00 | 5.26 (2.54, 7.62) 0.02 | 4.41 | (2.36, 6.72) | 3.81 (1.76, 5.51), 0.00 ∞4.66 (2.53,6.72) |
Key: variables with P value > 0.2 for CHR during either of the cohorts were excluded from the table. ∗Ref.: reference categories were selected as the least risk groups according to the different literatures [8, 9, 36, 49, 50, 53]. ∞Pooled estimate of aHR (i.e., for the cohorts initiating HAART by 2007 and 2010 for bedridden. We considered all cohorts for CD4 count ≤ 200 cells/mm3 and poor adherence.
From our pooled estimate result, patients with poor adherence were at 6.78 (95%CI = 3.4 − 10.3) times risk of death compared to those who had good adherence. Patients with CD4 count of ≤200 cells/mm3 were at 2.6 (95%CI = 2.2 − 3.0) times risk of death compared to those with CD4 count greater than 200 cells/mm3. Bedridden patients were at 2.0 (95%CI = 1.35 − 2.69) times risk of death compared to ambulatory patients. Being drug resistant for HIV was found to be a 10-fold risk of mortality compared to those who were susceptible 10.02 (95% CI: 6.91, 13.82). Moreover, patients who were not virally suppressed at baseline were at 4.66 times risk of death (95%CI = 2.53, 6.72) (Table 3).
4. Discussion
Mortality among people initiating HAART in Ethiopia during the year 2007 to 2019 in the first 3 years since ART initiation was 10.3%. Mortality significantly varied by the follow-up year 2007-2009, 2010-2013, 2014-2016, and 2017-2019 which was 21.37%, 10.03%, 4.34%, and 9.25%, respectively. The cohort initiating HAART by 2017, who was the first group to initiate HAART during 2007-2009, accounted for the highest rate of mortality of 21.37%. This was not consistent with other study conducted in Ethiopia during the year 2006-2010 that reported 7% mortality at 36 months of follow-up [34]. Other study conducted in Gonder, Ethiopia, in the year 2010-2014 reported mortality at 60 months of follow-up to be 13.67% [8] which is relatively similar to our second HAART cohort, initiating HAART during 2010-2013, that revealed a 10.03% mortality. Despite the study group were children, a study conducted in Gamo Gofa Zone, Ethiopia, conducted from 2009 to 2016 reported mortality in the 60 months of follow-up to be 26.1% which was not in line with our report that showed 4.34% mortality in the year 2014-2016 [16]. There was limited evidence on survival among people initiating HAART in Ethiopia as of 2017. Our study revealed mortality in the year 2017-2019 to be 9.25% which was similar with a study conducted in Nepal that reported 6.3% mortality during the 36 months of follow-up [35]. The different reports in mortality may be explained by the studies that were specific to limited number of health facilities while mortality is heterogeneous across the different health facilities and by duration on HAART.
Despite previous studies [17, 34, 36–38] revealed that mortality was the highest in the first year of follow-up, our study showed that mortality was increasing overtime during the 2007-2009 and 2010-2013 cohorts. This might be explained by the challenges of adherence to medication, patients' retention in care, and the limited access to HAART in Ethiopia during the year 2007-2013 [12, 21, 39, 40]. The year 2014-2016 was the time with the minimum mortality in the first year of follow-up (5.14%) across all the cohorts, and mortality was steadily declining until 2016 (i.e. 4.04% and 4.43%) which may explain the revised national program on the test and treat strategy as of 2014 and the overtime increased access to HAART [41]. However, there were high rates of mortality in the first year of follow-up during the year 2017 to 2019 (18.76%) which might be explained by the political instability in the country with negative impacts on the health service from 2017 to 2018. This negative impact could be proofed by the greatly reduced rate of 1.35% for good and fair adherence to HAART in cohort initiating HAART by 2017, compared to that of 98.8% to 99.7% in rest of the cohorts. Our study also revealed variations in mortality among the different regional administrations in Ethiopia which could be explained by the different sociocultural factors and access to health service. Moreover, the heterogeneity of HIV prevalence among the regions could contribute to the variation of early mortality.
Between 2007 and 2016, survival of people living with HIV in the first 3 years since ART initiation improved substantially. However, there was a decline in survival as of 2017 to 2019. Overall survival among PLHIV initiating HAART in Ethiopia from 2007 to 2019 within three years of follow-up was 78.8% (95%CI = 61.39 − 95.17). This study was consistent with a study conducted in Debre Berhan Hospital, Ethiopia, which reported 81.7% survival during 2017 [18]. Survival among the cohorts of 2007-2009, 2010-2013, 2014-2016, and 2017-2019 was heterogeneous, i.e., 53.71%, 79.51%, 92.54%, and 87.36%, respectively. Briefly, the lowest survival during 2007-2009 may explain the limited access to HAART by the time and also issues of LTFU and adherence during these cohorts [42–44]. The steady improvement of survival during the 2010-2013 and 2014-2016 might be explained by the different program implementations in the country overtime, specifically the test and treat strategy and rapid expansion of ART sites [41]. However, survival among people initiating HAART as of 2017 is declining which might be explained by the challenges related to instability and supply sustainability in the country.
The high mortality among bedridden patients (22.01%) during the year 2007-2010 may be explained by the late diagnosis of PLHIV as a result of the limited access to HIV testing, high rate stigma, and the limited access to HAART by the time [45, 46]. Bedridden patients were at 2.0 (95%CI = 1.35 − 2.69) times risk of death compared to ambulatory patients. Being bedridden was also predictor of mortality during the 2007-2010 and 2011-2013 follow-ups that accounted 1.92 (95%CI = 1.28, 2.89) and 2.30 (95%CI = 1.40, 3.78) times risk of mortality, respectively. This was consistent with a study in Nepal which reported 2 twofold risk of death among bedridden compared to ambulatory patients [35]. Other study conducted in Debre Berhan Hospital, Ethiopia, also revealed a 3-fold risk of death among bedridden [18]. Other study conducted in Ethiopia also revealed being bedridden as 17.4 times risk of death compared to ambulatory patients [34]. A study conducted in Gonder, Ethiopia, also revealed a 9.57 times risk of death among bedridden [8]. Our study was consistent with other previous studies and may highlight the importance of early HIV testing and treatment to ensure better survival of PLHIV.
Mortality among patients with poor adherence was as high as 90.91%, 84.21%, and 50.00% for cohorts initiating HAART by 2007, 2010, and 2014, respectively, but not as high as 9.2% for cohort initiating HAART by 2017. Moreover, patients with poor adherence in all cohorts were at 6.78 (95%CI = 3.4 − 10.3) times risk of death compared to those who had good adherence. Patients with poor adherence were at 4.65 (95%CI = 2.90, 7.48), 12.29 (95%CI = 7.06, 21.40), 8.54 (95%CI = 2.71, 26.94), and 7.07 (95%CI = 3.74, 13.38) times risk of mortality for all the cohorts, respectively, compared to those with good adherence. Former studies are also consistent with our report which was conducted in Gamo Gofa Zone, Ethiopia, that reported a 2.17 times risk of death compared to those with good adherence [16]. The current study highlights the importance of improving adherence among people initiating HAART which could be a critical challenge at the early stage of HAART initiation. Adherence to ART in HIV-infected individuals is reported to be strong determinant of disease outcome [47]. Interventions which improve adherence are associated with successful viral suppression, reduced risk of opportunistic infections, and prevention of drug resistance [5]. Although adherence levels as low as 80% have been associated with treatment success, adherence of around 95% is widely considered desirable for viral suppression and prevention of ART resistance [48].
There was high mortality among patients with CD4 count ≤ 200 cells/mm3 across all the different segments of the cohorts which accounted 25.73%, 12.55%, 5.65%, and 18.65% during the 2007-2010, 2011-2013, 2014-2016, and 2017-2019, respectively. Patients with CD4 count of ≤200 cells/mm3 were at 2.6 (95%CI = 2.2 − 3.0) times risk of death compared to those with CD4 count greater than 200 cells/mm3. While disaggregated by the different cohorts, patients with CD4 count of ≤200 cells/mm3 were at 2.71 (95%CI = 2.01, 3.66), 2.57 (95%CI = 1.93, 3.42), 2.46 (95%CI = 1.60, 3.77), and 2.70 (95%CI = 2.0, 3.64) during 2007-2010, 2011-2013, 2014-2016, and 2017-2019, respectively, compared to those with CD4 count > 200 cells/mm3. Studies showed that CD4 count is one of the predictors of mortality in the sense that higher CD4 counts are related to longer survival time [8, 16, 26, 34, 38, 49, 50]. A study conducted in Jimma University teaching hospital, Ethiopia, indicated that patients who were on ART with CD4 < 200 cells/mm3 were 1.3 times more likely to die in comparison to those whose CD4 was ≥200 cells/mm3. The reduction of CD4 count decreases the immunity of patients, exposing them to opportunistic infections and at high risk of developing serious illnesses leading to death [9, 18, 27, 51].
In our analysis, patients who were not virally suppressed at baseline were at 4.66 times risk of death and hence underscore the importance of viral load measurement as the primary marker of treatment efficacy and suggest the importance of switching ART regimens when there is evidence of virologic failure. Previous study conducted in China also demonstrated an association between HIVDR and mortality, consistent with previous studies. In addition, patients who developed HIVDR during treatment were nearly twofold more likely to die than those who developed HIVDR later [47]. Our study also revealed that HIV drug resistance was found to be a 10-fold risk of mortality compared to those who were susceptible.
The highest LTFU during 2007-2010 in our study (25.26%) was consistent with previous study conducted in 2010 which was 23.21% [52]. Moreover, the high rate of LTFU by the year 2017-2019 which accounted 19.72% may be explained by the political instability during this period which impacted on health service in the country. High rate of LTFU could lead towards HIV drug resistance and also high rate of community HIV transmission ultimately affects the prevention and control strategy.
5. Limitation
There might be death among those groups of LTFU population which may underestimate the rate of mortality in this study.
6. Conclusion
Even in the late HAART era, survival during the first 3 years of HAART continues to improve until 2016. However, it was significantly declining as of 2017. This calls for close follow-up and monitoring of PLHIV taking HAART. Poor adherence, low baseline CD4 count, and bedridden were predictors of mortality which calls for attention during clinical management of this group of population. Moreover, clinicians should consider viral load suppression at baseline since it is impacting survival. The high rate of loss to follow-up in recent years requires program attention.
Acknowledgments
The authors are grateful to Chinese Center for Disease Prevention and Control, Zhejiang University, School of Medicine, and the Ethiopian Public Health Institute. The authors would like to express their special thanks to all data collectors. This study has been financially supported by the World Health Organization.
Abbreviations
- AIDS:
Acquired immune deficiency syndrome
- ART:
Antiretroviral therapy
- CI:
Confidence interval
- EPHI:
Ethiopian Public Health Institute
- HAART:
Highly active antiretroviral therapy
- HGB:
Hemoglobin
- HIV:
Human immunodeficiency virus
- HIVDR:
HIV drug resistance
- HR:
Hazard ratio
- Mg/dl:
Milligram per deciliter
- ZJU:
Zhejiang University.
Data Availability
The raw data can be obtained from the corresponding author upon reasonable formal request.
Ethical Approval
The ethical approval was obtained from the Ethiopian Public Health Institute Scientific and Ethical Review Office (SERO) with approval number EPHI-IRB-191-2019. As the study was conducted through a review of medical records and uses archived secondary data, patients were not subject to any harm. To preserve the confidentiality, data were collected by ART trained nurses/data clerks working in ART clinics of each health center. During data extraction, no personal identification methods were used on data collection formats. Considering there will be no harm for the study participants and since the data were collected confidentially and given the study will benefit the HIV program in the country, informed consent was waived by the Scientific and Ethical Review Office of the Ethiopian Public Health Institute. The study was conducted in accordance with the Declaration of Helsinki. Authors and responsible authorities were informed and agreed for this publication.
Conflicts of Interest
The authors declare that they have no competing interests.
Authors' Contributions
YG contributed since the inception of the project concept to the end of finalizing the manuscript. QH, RA, DK, and LK contributed during supervisory of the data collection and editing the data and commented on the draft manuscript. FY and LL oversee the project during the data collection and commented on the design and implementation of the study. YS oversee the overall project, provided research suggestions, explained the results, and revised and finalized the manuscript. All authors made a significant contribution to the work reported, whether that is in the conception, study design, execution, acquisition of data, analysis, and interpretation, or in all these areas; took part in drafting, revising, or critically reviewing the article; gave final approval of the version to be published; have agreed on the journal to which the article has been submitted; and agree to be accountable for all aspects of the work.
References
- 1.Unaids. FACT SHEET 2021 Global HIV statistics. AIDS Epidemic . 2021;1–3 [Google Scholar]
- 2.GBD 2017 HIV collaborators. Global, regional, and national incidence, prevalence, and mortality of HIV, 1980-2017, and forecasts to 2030, for 195 countries and territories: a systematic analysis for the global burden of diseases, injuries, and risk factors study 2017. Lancet HIV . 2019;6(12):e831–e859. doi: 10.1016/S2352-3018(19)30196-1. [DOI] [PMC free article] [PubMed] [Google Scholar]
- 3.Arage G., Assefa M., Worku T., Semahegn A. Survival rate of HIV-infected children after initiation of the antiretroviral therapy and its predictors in Ethiopia: a facility-based retrospective cohort. SAGE Open Medicine . 2019;7, article 205031211983895 doi: 10.1177/2050312119838957. [DOI] [PMC free article] [PubMed] [Google Scholar]
- 4.Joint United Nations Program for HIV/AIDS. Global AIDS Update 2016. 2016. http://www.unaids.org/sites/default/files/media_asset/UNAIDS_Gap_report_en.pdf .
- 5.Adejumo O. A., Malee K. M., Ryscavage P., Hunter S. J., Taiwo B. O. Review article Contemporary issues on the epidemiology and antiretroviral adherence of HIV-infected adolescents in sub-Saharan Africa: a narrative review. Journal of the International AIDS Society . 2015;18(1, article 20049) doi: 10.7448/IAS.18.1.20049. [DOI] [PMC free article] [PubMed] [Google Scholar]
- 6.Parruti G., Polilli E., De Socio G. V., et al. Efficacy of 1998 vs 2006 first-line antiretroviral regimens for HIV infection: an ordinary clinics retrospective investigation. Journal of Antivirals and Antiretrovirals . 2012;4(2):32–37. doi: 10.4172/jaa.1000043. [DOI] [Google Scholar]
- 7.Langford S. E., Ananworanich J., Cooper D. A. Predictors of disease progression in HIV infection: a review. AIDS Research and Therapy . 2007;4, article 11 doi: 10.1186/1742-6405-4-11. [DOI] [PMC free article] [PubMed] [Google Scholar]
- 8.Deres G., Nigussie Z. M., Chanie M. G., Worku N. Survival time and associated factors among adults living with HIV after initiation of HAART in South Gondar, Northwest Ethiopia: a retrospective cohort. Journal of Multidisciplinary Healthcare . 2021;14:1463–1474. doi: 10.2147/JMDH.S314004. [DOI] [PMC free article] [PubMed] [Google Scholar]
- 9.Mulugeta A., Henok A., Tewelde T., Dube L. Determinants of survival among HIV positive research article open access children on antiretroviral therapy in public hospitals, Addis Ababa, Ethiopia. Quality in Primary Care . 2017;25:235–241. [Google Scholar]
- 10.Assefa T., Wencheko E. Survival analysis of patients under chronic HIV-care and antiretroviral treatment at Tikur Anbessa Specialized Hospital, Addis Ababa, Ethiopia. Ethiopian Journal of Health Development . 2012;26(1):22–29. [Google Scholar]
- 11.Federal HIV/AIDS Prevention and Control Office. Addis Ababa: 2021. HIV Epidemic Estimates 2017 - 2021, Ethiopia. http://www.hapco.gov.et . [Google Scholar]
- 12.Assefa Y., Alebachew A., Lera M., Lynen L., Wouters E., van Damme W. Scaling up antiretroviral treatment and improving patient retention in care: lessons from Ethiopia, 2005-2013. Globalization and Health . 2014;10(1):p. 43. doi: 10.1186/1744-8603-10-43. [DOI] [PMC free article] [PubMed] [Google Scholar]
- 13.Unaids. Global Hiv statistics. AIDS Epidemic . 2015;1–3 [Google Scholar]
- 14.Reepalu A., Balcha T. T., Skogmar S., Güner N., Stureg E. Factors associated with early mortality in HIV-positive men and women investigated for tuberculosis at Ethiopian health centers. PLoS One . 2016;11(6) doi: 10.1371/journal.pone.0156602. [DOI] [PMC free article] [PubMed] [Google Scholar]
- 15.Poorolajal J., Hooshmand E., Mahjub H., Esmailnasab N., Jenabi E. Survival rate of AIDS disease and mortality in HIV-infected patients: a meta- analysis. Public Health . 2016;139:3–12. doi: 10.1016/j.puhe.2016.05.004. [DOI] [PubMed] [Google Scholar]
- 16.Sidamo N. B., Hebo S. H. Survival time and its predictors among HIV-infected children after antiretroviral therapy in public health facilities of Arba Minch town, Gamo Gofa zone, Southern Ethiopia. Ethiopian Journal of Health Development . 2018;32:88–96. [Google Scholar]
- 17.Abebe N., Alemu K., Asfaw T., Abajobir A. A. Survival status of HIV positive adults on antiretroviral treatment in Debre Markos Referral Hospital, Northwest Ethiopia: retrospective cohort study. The Pan African Medical Journal . 2014;17:1–13. doi: 10.11604/pamj.2014.17.88.3262. [DOI] [PMC free article] [PubMed] [Google Scholar]
- 18.Nigussie F., Alamer A., Mengistu Z., Tachbele E. Survival and predictors of mortality among adult HIV/AIDS patients initiating highly active antiretroviral therapy in Debre-Berhan referral hospital, Amhara, Ethiopia: a retrospective study. HIV/AIDS - Research and Palliative Care . 2020;Volume 12:757–768. doi: 10.2147/HIV.S274747. [DOI] [PMC free article] [PubMed] [Google Scholar]
- 19.Kebebew K., Wencheko E. Survival analysis of HIV-infected patients under antiretroviral treatment at the armed forces general teaching hospital, Addis Ababa, Ethiopia. Ethiopian Journal of Health Development . 2012;26:186–192. [Google Scholar]
- 20.Isaakidis P., Raguenaud M. E., te V., et al. High survival and treatment success sustained after two and three years of first-line ART for children in Cambodia. Journal of the International AIDS Society . 2010;13(1):p. 11. doi: 10.1186/1758-2652-13-11. [DOI] [PMC free article] [PubMed] [Google Scholar]
- 21.Wilhelmson S., Reepalu A., Balcha T. T., Jarso G., Björkman P. Retention in care among HIV-positive patients initiating second-line antiretroviral therapy: a retrospective study from an Ethiopian public hospital clinic. Global Health Action . 2016;9(1, article 29943) doi: 10.3402/gha.v9.29943. [DOI] [PMC free article] [PubMed] [Google Scholar]
- 22.Hall H. I., Halverson J., Wilson D. P., et al. Late diagnosis and entry to care after diagnosis of human immunodeficiency virus infection: a country comparison. PLoS One . 2013;8(11):p. e77763. doi: 10.1371/journal.pone.0077763. [DOI] [PMC free article] [PubMed] [Google Scholar]
- 23.Sabin C. A., Smith C. J., Gumley H., et al. Late presenters in the era of highly active antiretroviral therapy: uptake of and responses to antiretroviral therapy. AIDS . 2004;18(16):2145–2151. doi: 10.1097/00002030-200411050-00006. [DOI] [PubMed] [Google Scholar]
- 24.Ethiopian Health and Nutrition Research Institute. HIV related estimates and projections for Ethiopia- 2012 . Ethiopian Health and Nutrition Research Institute, Federal Ministry of Health; 2017. [Google Scholar]
- 25.Cdc. Epi Info 7 - User Guide . CDC; 2016. [Google Scholar]
- 26.Abebe T., Chaka T., Misgana G., Adlo A. Determinants of survival among adults on antiretroviral therapy in Adama Hospital Medical College, Oromia Regional state, Ethiopia. Journal of HIV/AIDS . 2016;2 [Google Scholar]
- 27.Mengesha S., Belayihun B., Kumie A. Predictors of survival in HIV-infected patient after initiation of HAART in Zewditu Memorial Hospital, Addis Ababa, Ethiopia. International Scholarly Research Notices . 2014;2014:6. doi: 10.1155/2014/250913.250913 [DOI] [PMC free article] [PubMed] [Google Scholar]
- 28.FMOH Ethiopia. National consolidated guidelines for comprehensive HIV prevention, care and treatment . FMOH; 2018. [Google Scholar]
- 29.Who. Consolidated guidelines on the use of antiretroviral drugs for treating and preventing HIV infection: recommendations for a public health approach . WHO; 2016. 4 clinical guidelines: antiretroviral therapy; p. p. 129. [PubMed] [Google Scholar]
- 30.World Health Organisation. World Health Organization; 2018. Updated recommendations on first-line and second-line antiretroviral regimens and post-exposure prophylaxis and recommendations on early infant diagnosis of HIV: interim guidelines: supplement to the 2016 consolidated guidelines on the use of antiretroviral drugs for treating and preventing HIV infection. [Google Scholar]
- 31.Simoni J. M., Kurth A. E., Pearson C. R., Pantalone D. W., Merrill J. O., Frick P. A. Self-report measures of antiretroviral therapy adherence: a review with recommendations for HIV research and clinical management. AIDS and Behavior . 2006;10(3):227–245. doi: 10.1007/s10461-006-9078-6. [DOI] [PMC free article] [PubMed] [Google Scholar]
- 32.Yalew A., Terefe B., Alem M., Enawgaw B. Hematological reference intervals determination in adults at Gondar university hospital Northwest Ethiopia. BMC Research Notes . 2016;9:1–9. doi: 10.1186/s13104-016-2288-8. [DOI] [PMC free article] [PubMed] [Google Scholar]
- 33.Zhou Z., Wagar N., DeVos J. R., et al. Optimization of a low cost and broadly sensitive genotyping assay for HIV-1 drug resistance surveillance and monitoring in resource-limited settings. PLoS One . 2011;6(11):1–10. doi: 10.1371/journal.pone.0028184. [DOI] [PMC free article] [PubMed] [Google Scholar]
- 34.Kebede A., Tessema F., Bekele G., Kura Z., Merga H. Epidemiology of survival pattern and its predictors among HIV positive patients on highly active antiretroviral therapy in southern Ethiopia public health facilities: a retrospective cohort study. AIDS Research and Therapy . 2020;17(1):1–8. doi: 10.1186/s12981-020-00307-x. [DOI] [PMC free article] [PubMed] [Google Scholar]
- 35.Bhatta L., Klouman E., Deuba K., et al. Survival on antiretroviral treatment among adult HIV-infected patients in Nepal: a retrospective cohort study in far-western region, 2006-2011. BMC Infectious Diseases . 2013;13(1) doi: 10.1186/1471-2334-13-604. [DOI] [PMC free article] [PubMed] [Google Scholar]
- 36.Trickey A., May M. T., Vehreschild J. J., et al. Survival of HIV-positive patients starting antiretroviral therapy between 1996 and 2013: a collaborative analysis of cohort studies. Lancet HIV . 2017;4(8):e349–e356. doi: 10.1016/S2352-3018(17)30066-8. [DOI] [PMC free article] [PubMed] [Google Scholar]
- 37.Wolmer S., de Melo L., Lacerda H. R., Campelo E., Moraes E., de Alencar Ximenes R. A. Survival of AIDS patients and characteristics of those who died over eight years of highly active antiretroviral therapy, at a referral center in Northeast Brazil. The Journal of Infectious Diseases . 2008;12:269–277. doi: 10.1590/S1413-86702008000400003. [DOI] [PubMed] [Google Scholar]
- 38.Manosuthi W., Charoenpong L., Santiwarangkana C. A retrospective study of survival and risk factors for mortality among people living with HIV who received antiretroviral treatment in a resource-limited setting. AIDS Research and Therapy . 2021;18(1):1–10. doi: 10.1186/s12981-021-00397-1. [DOI] [PMC free article] [PubMed] [Google Scholar]
- 39.Assefa Y., Gilks C. F., Dean J., et al. Towards achieving the fast-track targets and ending the epidemic of HIV/AIDS in Ethiopia: successes and challenges. International Journal of Infectious Diseases . 2019;78:57–64. doi: 10.1016/j.ijid.2018.10.022. [DOI] [PubMed] [Google Scholar]
- 40.Fox M. P., Rosen S. Patient retention in antiretroviral therapy programs up to three years on treatment in sub-Saharan Africa, 2007-2009: systematic review. Tropical Medicine & International Health . 2018;15(Suppl 1):1–15. doi: 10.1111/j.1365-3156.2010.02508.x. [DOI] [PMC free article] [PubMed] [Google Scholar]
- 41.Federal Democratic Republic of Ethiopia HIV Prevention and Control office. Country progress report on the HIV response . Addis Ababa: Federal Democratic Republic of Ethiopia; 2014. [Google Scholar]
- 42.CSA M. Ethiopia mini demographic and health survey 2014 . Ethiopia: Addis Ababa; 2014. [Google Scholar]
- 43.Jordan M. R., Bennett D. E., Wainberg M. A., et al. Update on World Health Organization HIV drug resistance prevention and assessment Strategy: 2004 – 2011. Clinical Infectious Diseases . 2012;54:245–249. doi: 10.1093/cid/cis206. [DOI] [PMC free article] [PubMed] [Google Scholar]
- 44.Assefa D., Getaneh Y., Adugna F., et al. HIV drug resistance early warning indicators survey in Ethiopia . Ethiopian Public Health Institute, Addis Ababa, E; 2013. https://www.ephi.gov.et/images/pictures/HIV%20Drug%20Resistance%20Early%20warning%20indicators%20survey.pdf . [DOI] [PubMed] [Google Scholar]
- 45.Addis Ababa: Ethiopian Public Health Institute; 2012. HIV Drug resistance (HIVDR) early warning indicators (EWIs) survey in Ethiopia. https://www.ephi.gov.et/images/pdf/EWI-%20hivdr_%20final_report%20(2).pdf . [Google Scholar]
- 46.Dube N. M., Tint K. S., Summers R. S. Early warning indicators for HIV drug resistance in adults in South Africa at 2 pilot sites, 2008-2010. Clinical Infectious Diseases . 2014;58(11):1607–1614. doi: 10.1093/cid/ciu109. [DOI] [PubMed] [Google Scholar]
- 47.Liao L., Xing H., Su B., et al. Impact of HIV drug resistance on virologic and immunologic failure and mortality in a cohort of patients on antiretroviral therapy in China. AIDS . 2013;27(11):1815–1824. doi: 10.1097/QAD.0b013e3283611931. [DOI] [PMC free article] [PubMed] [Google Scholar]
- 48.Who. On The Use of Antiretroviral Drugs for Treating and Preventing HIV Infection . WHO; 2014. [Google Scholar]
- 49.Misgina K. H., Weldu M. G., Gebremariam T. H., et al. Predictors of mortality among adult people living with HIV/AIDS on antiretroviral therapy at Suhul Hospital, Tigrai, northern Ethiopia: a retrospective follow-up study. Journal of Health, Population and Nutrition . 2019;38(1):1–10. doi: 10.1186/s41043-019-0194-0. [DOI] [PMC free article] [PubMed] [Google Scholar]
- 50.Singogo E., Keegan T. J., Diggle P. J., et al. Differences in survival among adults with HIV-associated Kaposi’s sarcoma during routine HIV treatment initiation in Zomba district, Malawi: a retrospective cohort analysis. International Health . 2017;9(5):281–287. doi: 10.1093/inthealth/ihx027. [DOI] [PubMed] [Google Scholar]
- 51.Hogg R. S., Heath K. V., Yip B., et al. Improved survival among HIV-infected individuals following initiation of antiretroviral therapy. Journal of the American Medical Association . 1998;279(6):450–454. doi: 10.1001/jama.279.6.450. [DOI] [PubMed] [Google Scholar]
- 52.World Health Organization. Implementation and sustainability of HIV drug resistance surveillance in Africa Addis Ababa, Ethiopia . World Health Organization; 2014. [Google Scholar]
- 53.Getaneh Y., Egziabhier A. G., Zealiyas K., et al. HIV-1 treatment failure among population taking antiretroviral therapy in Ethiopia. Journal of AIDS and HIV Treatment . 2019;1:46–57. [Google Scholar]
- 54.Getaneh Y., He Q., Rashid A., et al. Evaluation of HIV-1 drug resistance among patients failing first-line antiretroviral therapy in Ethiopia. Journal of Global Antimicrobial Resistance . 2022;30:418–427. doi: 10.1016/J.JGAR.2022.07.019. [DOI] [PubMed] [Google Scholar]
Associated Data
This section collects any data citations, data availability statements, or supplementary materials included in this article.
Data Availability Statement
The raw data can be obtained from the corresponding author upon reasonable formal request.