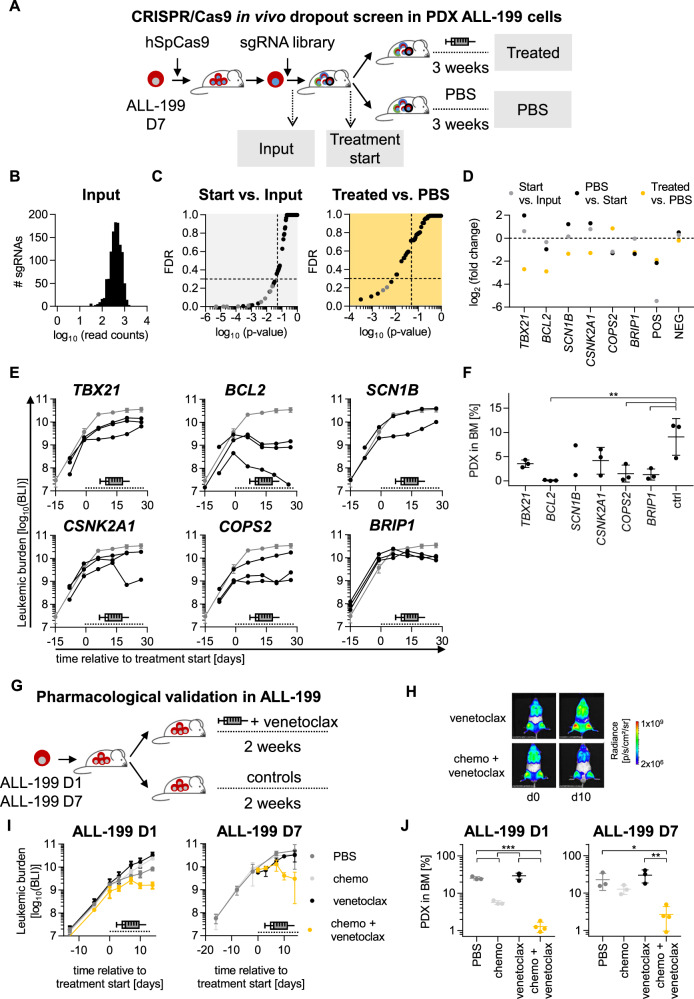
Fig. 4. CRISPR/Cas9 induced knockout of BCL2 or treatment with venetoclax re-sensitize resistant PDX models to treatment.
CRISPR/Cas9 in vivo dropout screen in ALL-199 PDX cells reveals candidates relevant for acquired resistance A Resistant D7 cells were lentivirally transduced to express hSpCas9 followed by transduction with the sgRNA library (Table S11); after 3 days of in vitro cultivation and magnetic cell enrichment, the input sample was collected, and remaining cells transplanted into mice (n = 9). After 4 weeks of in vivo growth, control mice were sacrificed (treatment start, n = 2) and remaining mice were treated for 3 weeks with the combination chemotherapy (treated, n = 4, VCR 0.15 mg/kg, Cyclo 70 mg/kg) as in Fig. 1A–F or PBS (n = 3). PDX cells were re-isolated from murine BM of all mice, genomic DNA isolated, sgRNA library amplified, and sequenced by NGS, followed by data analysis using the MAGeCK algorithm. B sgRNA distribution of the input sample. C MAGeCK results comparing start vs. input (left panel) or treated vs. PBS (right panel); one dot represents one gene (pooled analysis of 5 sgRNAs per gene); grey dots indicate positive controls with p < 0.05; dashed lines indicate cut-off of p = 0.05 and false discovery rate (FDR) = 0.3. D Top dropouts from the screen plus controls as defined by either p < 0.05 and FDR < 0.3 in screen on D7 (TBX21, BCL2, SCN1B, CSNK2A1, and BRIP1) or by consistent depletion in the two screens on D7 and D5 (COPS2). Single validation of targets identified by CRISPR/Cas9 screen. E Experiments were performed identically as described for Fig. 4A, except that a single sgRNA was transduced per sample and mouse, targeting one of the six candidates depicted in Fig. 4D or non-targeting controls (19 different sgRNAs in total, i.e., 3 sgRNAs per target gene and 1 non-targeting control sgRNA). Cells were transplanted into 21 mice (n = 1 per target sgRNA, n = 3 per target gene or control). At high leukemic burden, all mice were treated with combination therapy used in Fig. 1A–F (0.15 mg/kg VCR, 70 mg/kg Cyclo) for 3 weeks and treatment response was monitored by repetitive imaging; each black line represents a single mouse, the grey line shows mean+/− SD of the 3 mice harboring non-targeting control sgRNA; the dashed line indicates the treatment period. F At the end of the experiment, PDX ALL-199 cells were isolated from the murine BM and leukemic burden quantified using flow cytometry and proportion of PDX was calculated. Mean+/− SD for each group is shown. One dot represents one mouse. **p < 0.01 by one-way ANOVA followed by Tukey’s multiple comparisons test. G-J Venetoclax re-sensitized resistant ALL-199 PDX derivatives to treatment. G Experimental design: ALL-199 D1 or D7 cells were engrafted into groups of NSG mice. At high leukemic burden, mice were treated for 2 weeks with PBS alone (n = 3) or venetoclax alone (n = 4, 100 mg/kg p.o. days 1–5) or the combination chemotherapy plus PBS (n = 3) or the combination chemotherapy plus venetoclax (n = 4, venetoclax 100 mg/kg p.o. days 1–5, 0.15 mg/kg VCR i.v. day 3 and 70 mg/kg Cyclo i.p. day 5). H Treatment response was monitored by imaging; One representative mouse per group is shown at d0 and d10 of treatment, respectively. I Quantification of imaging signals from all mice analyzed; mean+/− SD per group is shown; dashed line indicates treatment period; for D7, data of PBS and treated group was derived from previous experiment for comparison (Fig. S8E). J At the end of the experiment, PDX ALL-199 cells were isolated from the murine BM and quantified using flow cytometry and proportion of PDX was calculated. Mean+/− SD for each group is shown. One dot represents one mouse (n = 3 for PBS and treated, n = 4 for venetoclax and treated + venetoclax). *p < 0.05, **p < 0.01, ***p < 0.001 by one-way ANOVA followed by Tukey´s multiple comparisons test.

