

Abstract
Previous proton magnetic resonance spectroscopy (1H-MRS) studies suggest a perturbation in glutamate and/or GABA in Major Depressive Disorder (MDD). However, no studies examine the ratio of glutamate and glutamine (Glx) to GABA (Glx/GABA) as it relates to depressive symptoms, which may be more sensitive than either single metabolite. Using a within-subject design, we hypothesized that reduction in depressive symptoms correlates with reduction in Glx/GABA in the anterior cingulate cortex (ACC). The present trial is a randomized clinical trial that utilized 1H-MRS to examine Glx/GABA before and after 8 weeks of escitalopram or placebo. Participants completed the 17-item Hamilton Depression Rating Scale (HDRS17) and underwent magnetic resonance spectroscopy before and after treatment. Two GABA-edited MEGA-PRESS acquisitions were interleaved with a water unsuppressed reference scan. GABA and Glx were quantified from the average difference spectrum, with preprocessing using Gannet and spectral fitting using TARQUIN. Linear mixed models were utilized to evaluate relationships between change in HDRS17 and change in Glx/GABA using a univariate linear regression model, multiple linear regression incorporating treatment type as a covariate, and Bayes Factor (BF) hypothesis testing to examine strength of evidence. No significant relationship was detected between percent change in Glx, GABA, or Glx/GABA and percent change in HDRS17, regardless of treatment type. Further, MDD severity before/after treatment did not correlate with ACC Glx/GABA. In light of variable findings in the literature and lack of association in our investigation, future directions should include evaluating glutamate and glutamine individually to shed light on the underpinnings of MDD severity.
Introduction:
Major depressive disorder (MDD) is the most prevalent psychiatric disorder and the leading cause of disability worldwide, yet the neurobiological mechanisms of symptomatology and treatment response remain poorly understood 1. There are likely numerous neurochemical and metabolic disturbances involved in the pathophysiology of MDD, but there has recently been increased interest in the role of the primary excitatory neurotransmitter, glutamate (Glu), and the primary inhibitory neurotransmitter, γ-aminobutyric acid (GABA), in MDD and treatment response 2 3 4–11.
Both preclinical and clinical studies suggest glutamate and GABA are disrupted in MDD. When administered to rodents, GABA antagonists induce depressive states, while GABA agonists alleviate them 12 . Early studies have shown MDD patients to have lower plasma and cerebrospinal fluid (CSF) levels of GABA, and postmortem brain tissue samples of MDD patients show reduced amounts of GABA-producing enzymes, GABAA receptor mRNA, and GABAergic interneurons 13–15 5, 16, 17. In humans, brexanolone, a positive allosteric modulator of GABAA receptors, reduces symptoms of postpartum depression 18 and shows promise for treatment of MDD 14. Selective Serotonin Reuptake Inhibitors (SSRIs), which are currently first-line in treatment of MDD, are also thought to work in part by increasing GABA 19, 20.
Decreased GABA may result in disinhibition of glutamatergic activity, which is supported by findings that MDD patients have elevated CSF levels of glutamine, a precursor of glutamate 21. Previous work also shows elevated plasma and serum levels of glutamate in MDD patients, with a positive correlation between glutamate level and severity of depression 22. These elevated plasma and serum glutamate levels have been found to decrease with treatment of depression 23. Animal studies show that antidepressant drugs including SSRIs (i.e. citalopram and fluoxetine), serotonin-norepinephrine reuptake inhibitors (SNRIs), tricyclic antidepressants (TCAs, i.e. imipramine and desipramine), monoamine oxidase inhibitors (MAOIs), and N-methyl-D-aspartate (NMDA) receptor antagonists attenuate glutamatergic signaling 10, 24.
Despite the consistency of the above studies, proton magnetic resonance spectroscopy (1H-MRS) studies comparing Glx (a composite peak formed by glutamate and glutamine using 1H-MRS) and GABA in depressed patients vs. healthy controls have yielded contradictory findings, as shown in Supplementary Materials (Tables S1 and S2). Most studies have found GABA to be lower in depressed patients compared with healthy controls 4, 7, 12, 25, though some studies have found no significant differences 3, 26, 27. Meanwhile, some 1H-MRS studies have found that MDD patients have higher Glx 4, 28–30, while others show they have lower Glx than healthy controls 11, 22, 31–33 and some studies show no significant differences 3, 8, 26.
One explanation for the equivocal findings in previous literature is inter-individual differences in GABA and/or Glx levels. One way to potentially reduce this variance is to longitudinally examine within-subject changes in Glx and GABA before and after treatment. Yet, even studies that have done this have found inconsistent results (see Supplementary Material Table S2). Three studies found increased levels of GABA after treatment with an SSRI or ECT, and one found that an early increase in GABA is associated with later clinical response to SSRI treatment 3, 19, 20, 34. Another study found no changes in Glx or Glu in anterior brain regions after short-term treatment with escitalopram but did not measure levels beyond one week of treatment 35. Other studies found that CBT responders had a decrease in Glx but no change in GABA 36, 37. Increased levels of GABA and Glx in responders to treatment have also been reported 4, 16, 20, however some studies found that an increase in GABA and Glx after SSRI treatment does not correlate with clinical response 17, 20. Bhagwagar et al. (2004) found that a single dose of intravenous (IV) citalopram increases GABA even in healthy subjects, suggesting that increased GABA is an effect of the SSRI that might not necessarily be correlated with depressive improvements 19. The inconsistent results in these studies could be due to variable designs and outcomes, small sample sizes, heterogeneity in treatment modalities, examination of different brain regions, and variation in outcome measures 3, 5, 11, 26, 31. Other confounders in studies to date include high participant attrition rates, open-label study designs, and inadequate medication washout periods 3, 33.
Taking into account that Glu, glutamine (Gln), and GABA cycle through a shared synthetic pathway 4, a different outcome measure, the Glx (Glu+Gln) to GABA ratio (Glx/GABA) may provide greater resolution, i.e. the magnitude of change in this ratio could be greater than the change in either neurotransmitter alone. Further, the ratio better reflects the biology, as these two neurotransmitters work in concert to regulate excitatory-inhibitory balance in the brain 15. This is supported by a recent exploratory analysis of veterans with affective chronic pain, which found a positive association between Glx/GABA and depressive symptoms 38.
Based on the above, a well-powered study using 1H-MRS to examine Glx/GABA ratio in unmedicated patients with unipolar MDD, before and after treatment, will lend to a better understanding of the neurochemical profile of MDD and treatment response 2, 5 3. Our study is the first double-blind, placebo-controlled trial to use Glx/GABA as a primary outcome measure in a sample size of over 75 participants with unipolar MDD, randomized to receive either SSRI (escitalopram) or placebo for 8 weeks. The use of a placebo drug could help determine whether observed differences are treatment specific.
We focus on the anterior cingulate cortex (ACC) as a key region that regulates mood, motivation, and emotion processing. Depressed patients often show both functional and structural abnormalities in the ACC, which have been linked with symptoms of anhedonia, amotivation, apathy, rumination, and negative self-referential thinking 39–41. We used the well-validated 17-item Hamilton Depression Rating Scale (HDRS17) to measure severity of depressive symptoms 42. Based on previous literature supporting increased Glx and decreased GABA in MDD, we hypothesize a positive correlation between the change in depression severity (HDRS17) and change in Glx/GABA from pre- to post-intervention, regardless of treatment modality (escitalopram or placebo).
Methods:
Clinical Measures & Study Procedures
Adults meeting DSM-IV criteria for MDD were recruited by radio, print, and internet advertising starting in March 2015, with the last participant completing the trial in March 2020. Participant demographics are shown in Table 1. Subjects were screened for eligibility by a study clinician and trained rater using the Structured Clinical Interview for Diagnosis (SCID-IV) 43 and Montgomery-Åsberg Depression Rating Scale (MADRS) 44. Study approval was obtained from Stony Brook University’s Institutional Review Board. Inclusion criteria included the ability to provide informed consent, current diagnosis of MDD, and MADRS ≥ 22 44. During the study, the HDRS1742 was used to assess depression severity in order to prevent any inflation of the screening MADRS from skewing results45, 46.
Table 1.
Demographics and clinical characteristics of participants (n=81) used in the correlation analysis between HDRS17 and Glx (mM).
| Variable | nmissing | All Participants (n=81) | Escitalopram group (n=39) | Placebo group (n=42) | p-value* | |
|---|---|---|---|---|---|---|
| Age, in years | Mean (SD) | 0 | 30.38 (13.99) | 31.73 (15.22) | 29.13 (12.80) | 0.4103 |
| Sex at birth | Female, n (%) | 0 | 53 (65.43%) | 25 (47.17%) | 28 (52.83%) | 0.8084 |
| Male, n (%) | 0 | 28 (34.57%) | 14 (50.00%) | 14 (50.00%) | ||
| Race | Caucasian, n (%) | 0 | 51 (62.96%) | 25 (49.02%) | 26 (50.98%) | 0.8378 |
| Other, n (%) | 0 | 30 (37.04%) | 14 (46.67%) | 16 (53.33%) | ||
| Medication naïve | Yes, n (%) | 0 | 38 (46.91%) | 21 (55.26%) | 17 (44.74%) | 0.2283 |
| No, n (%) | 0 | 43 (53.09%) | 18 (41.86%) | 25 (58.14%) | ||
| Age of MDD onset (years) | Mean (SD) | 5 | 18.11 (10.99) | 19.16 (11.93) | 17.10 (10.07) | 0.4200 |
| Current MDE (months) | 17 | 14.89 (24.18) | 16.73 (26.18) | 13.37 (22.66) | 0.5892 | |
| Screening MADRS | 3 | 27.69 (6.30) | 28.50 (6.80) | 26.93 (5.77) | 0.2749 | |
| Week 1 HDRS17 | 0 | 17.86 (4.65) | 18.97 (5.19) | 16.83 (3.88) | 0.0402* | |
| Week 8 HDRS17 | 6 | 10.57 (6.33) | 11.11 (6.72) | 10.08 (6.00) | 0.4855 |
p < 0.05 indicates statistical significance;
MDD, Major Depressive Disorder; MDE, Major Depressive Episode; MADRS, Montgomery Åsberg Depression Rating Scale; HDRS17, 17-item Hamilton Depression Rating Scale
Exclusion criteria included current efficacious antidepressant treatment, previous failure or contraindications to escitalopram, ECT within the past 6 months, history of psychosis or bipolar disorder, active suicidality, high potential for substance use during the study, active physical illness, significant neurological deficits, or contraindications to Magnetic Resonance Imaging (MRI) (e.g., metal implants, current pregnancy, or breastfeeding).
At the start and end of the 8-week study period, all participants completed the HDRS17 before undergoing fully simultaneous Positron Emission Tomography (PET) and (MRI) using the BioGraph mMR scanner. The PET data from this cohort has previously been reported by Hill et al (2021).47 1H-MRS spectra showing Glx and GABA peaks were acquired from the anterior cingulate cortex (ACC), as shown in Figure 1.
Figure 1.
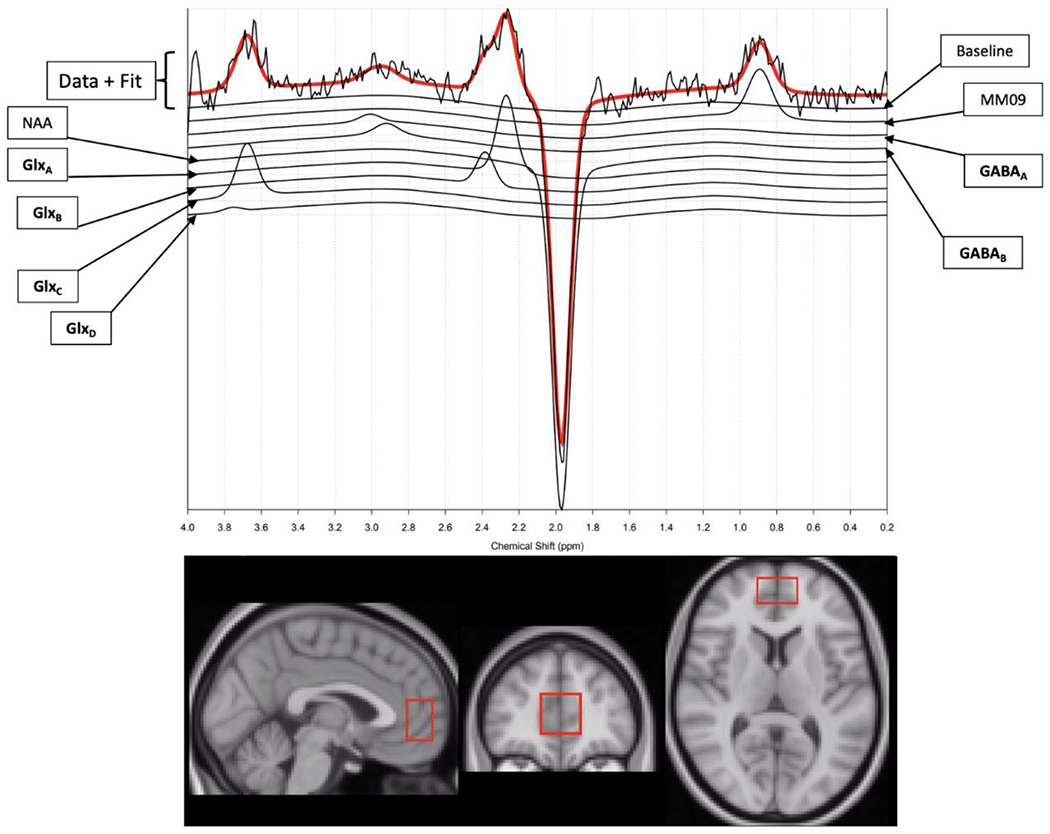
A sample 1H-MRS spectra (top) showing Glx and GABA (including macromolecules) peaks, acquired from the anterior cingulate cortex (ACC), with voxel size and location shown in the bottom panel in sagittal (left), coronal (middle), and axial (right) views. N-acetylaspartate (NAA) and macromolecule (MM09) peaks are also shown. Each subscript (GlxA, GlxB, GlxC, etc.) corresponds to the different resonance frequencies for Glx or GABA.
As shown in Figure S1, 613 people signed informed consent and were screened by telephone, 488 did not meet study criteria and 40 chose not to enroll, so 85 participants were randomized and underwent imaging. Of the 85 participants, 77 received post-treatment imaging. Of the 162 total images obtained, there were 20 that were discarded due to poor quality (in two additional scans, GABA could not be quantified). Acceptable quality was determined by rigorous visual inspection, which expert consensus agrees is the optimal method of quality control when evaluating 1H-MRS spectra 48–50. The rate of scan exclusion (22/162, or 13.6%) is comparable with that of other 1H-MRS studies3. When pre- and post-treatment imaging were both required, 60 total participants were used. However, there was one outlier who had a relative change of 540% in Glx/GABA, so results are reported both with and without this outlier.
Participants were either medication-naïve (n=43) or previously on medication (n=38). Only those on ineffective medication at the time of enrollment (n=18) underwent a 3-week washout periods followed by at least 3 weeks medication-free (4 weeks for fluoxetine). The medications taken prior to the washout period were mixed amphetamine salts (n=4), lisdexamfetamine dimesylate (n=1), duloxetine (n=3), bupropion (n=3), desvenlafaxine (n=1), trazodone (n=1), fluoxetine (n=1), sertraline (n=4), diphenhydramine (n=1), 5-hydroxytryptophan (n=1), aripiprazole (n=1), topiramate (n=1), lamotrigine (n=1), methadone (n=1), and zolpidem (n=1).
Participants were randomized in a 1:1 ratio using a parallel, double-blind design, to receive treatment with either escitalopram or placebo. To ensure blinding of participants, study clinicians, raters, study coordinators, and data analysts, the study pharmacist generated a pseudo-random allocation scheme using Research Randomizer® , then labeled and distributed medication bottles to participants. Escitalopram and placebo were identical capsules with no labeling. The escitalopram capsules contained 10 mg of active drug along with filler, while placebo capsules contained just filler. Participants were given 1 capsule (10 mg escitalopram or filler) during week 1, 2 capsules (20 mg or filled) during weeks 2 and 3, and 3 capsules (30 mg or filler) from weeks 4-8. If the participant experienced adverse effects, the titration schedule was adjusted as needed. All participants in the escitalopram cohort remaining in the study at 8 weeks tolerated a dose of 30 mg.
After 8 weeks, imaging and HDRS17 were repeated. The percent decrease between pre-treatment and post-treatment HDRS17 was used as a primary outcome measure. After completion of the post-treatment imaging and administration of post-treatment HDRS17, treatment groups were revealed, and open treatment was offered to all participants.
Imaging Acquisition
Imaging was performed on a 3T Siemens Biograph mMR scanner with a 12-channel head coil (Siemens, Erlangen, Germany). Anatomical T1-weighted 3D magnetization prepared rapid gradient echo (MPRAGE) images were acquired with the following parameters: repetition time/echo time/inversion time (TR/TE/TI) = 2300/3.24/900 ms, flip angle = 9°, matrix size = 256×256×224, 0.87 mm isotropic resolution, bandwidth = 220 Hz/pixel, and parallel imaging factor = 2. The 1H-MRS voxel was localized to the ACC using the MPRAGE images. 1H-MRS data (Figure 1) was acquired using the GABA-edited MEGA-PRESS sequence 51 with the following parameters: voxel size = 20×30×30 mm3, TR/TE = 1500/80 ms, acquisition bandwidth = 1200 Hz, pulse placement edit-on/edit-off = 1.9/7.5 ppm, and number of excitations edit-on/edit-off = 96/96. Two GABA-edited MEGA-PRESS acquisitions were collected and interleaved with a water unsuppressed reference scan. The reference scan was acquired with the same parameters except water suppression pulses were not applied and number of excitations = 16. Due to co-edited macromolecule (MM) contamination, GABA+ (i.e. GABA with MM) was assessed.
1H-MRS Data Processing and Quantification
The raw 1H-MRS data files were exported from the MRI console and used for analysis. In line with best practices, visual inspection of all spectra was used as quality control 48–50, as support for quantitative cutoffs such as the Crámer Rao Lower Bound (CRLB) as a basis for exclusion is equivocal and widely used thresholds may cause bias in estimated mean concentrations.49, 50 Scans were excluded for excessive noise in the spectra or failure in model fitting for the GABA or Glx peaks. These exclusions were due to field inhomogeneity within the 1H-MRS voxel as a result of either poor shimming or participant motion, with the latter causing subtraction errors that result in model-fitting failure. Inclusion of scans with motion artifact results in degraded spectral quality and can have further implications such as a reduced signal to noise ratio, lipid contamination, baseline fluctuation, insufficient water suppression, and incorrect quantification 52. Correction for CSF was not performed because partial volume correction does not substantially alter the variance in the metabolite concentrations, and CSF correction tends to undercorrect53. Uncorrected and corrected concentrations are almost perfectly correlated (r≈0.93)—and several assumptions are made that could instead negatively impact the concentration 54. All images were evaluated by an analyst blinded to treatment status.
1H-MRS processing was conducted in MATLAB (MathWorks Inc., Natick, MA) using Gannet 55. Processing steps consisted of: 1. coil combination based and prephasing based on the reference scan; 2. zero-filling of data to obtain nominal spectral resolution of 0.061 Hz/point; 3. eddy current correction 56; 4. line broadening of 3 Hz; 5. frequency and phase correction using the spectral registration method 57 with correction parameters estimated from the edit-off data; 6. Difference spectrum estimation by pairwise subtraction of the edit-off data from the edit-on data. The two GABA-edited MEGA-PRESS acquisitions were processed independently and then averaged for a resulting difference spectrum generated from 192 edit-on and 192 edit-off excitations. The GABA (with MM) and Glx concentrations were quantified from average difference spectrum using TARQUIN 58 with the average processed water unsuppressed reference scan used to estimate concentrations relative to water.
Statistical analysis
Linear mixed models were used to examine the relationships between HDRS17 and GABA or Glx, covarying for treatment type. Percent differences (PD) in 1H-MRS (Glx, GABA, Glx/GABA) and HDRS17 were defined as:
Spearman rank correlation coefficients and univariate linear regression models were used to measure the relationships between HDRS17 PD and Glx PD, GABA PD or Glx/GABA PD. Relationships for the Glx/GABA PD were fitted with (n=60) and without (n=59) one outlier that existed for the Glx/GABA PD. Multiple linear regression models were further used to evaluate the relationships after adding treatment type as a covariate.
Because all p-values were greater than 0.05, Bayes Factor (BF) hypothesis testing was implemented to determine the strength of evidence for the null hypothesis (H0). A BF ≤ 1/10 indicates strong evidence for H0 (no relationship between HDRS17 PD and Glx/GABA PD), while a BF ≥ 10 indicates strong evidence for H1 (relationship exists between HDRS17 PD and Glx/GABA PD). 1/10 < BF ≤ 1/3 indicates moderate evidence for H0 while 3 ≤ BF < 10 indicates moderate evidence for H1. 1/3 < BF < 3 indicates absence of evidence to support H0 or H1 59. BF hypothesis testing was performed using R 3.6.1. The rest of the statistical analyses were performed using SAS 9.4, with a significance level set at p < 0.05 (SAS Institute Inc., Cary, NC).
Results:
The average CRLB for GABA was 16.63%, with a Standard Deviation (SD) of 8.68%. The average CRLB for Glx was 17.57% (SD 14.36%). The average FWHM was 14.36 Hz (SD 4.48 Hz). The average SNR was 21.37 (SD 9.32). As shown in Table 1, there were no significant demographic differences between placebo and escitalopram groups, nor were there significant differences in pre- or post-treatment GABA or Glx, percent change in depression severity, or percent change in Glx/GABA from pre- to post-intervention. When analyzing all participants included in the correlation analysis (n=81), there was a 2-point difference in pre-treatment HDRS17 between placebo and escitalopram cohorts, which is not clinically meaningful. The mean pre-treatment value for Glx was 9.36 mM (SD 1.83 mM) for the placebo group (n=42) and 9.17 mM (SD 2.16 mM) for the escitalopram group (n=39, p=0.68). The mean pre-treatment value for GABA was 1.46 mM (SD 0.65 mM) for the placebo group (n=41) and 1.31 mM (SD 0.58 mM) for the escitalopram group (n=39, p = 0.28). The mean post-treatment value for Glx was 9.65 mM (SD 1.66 mM) for the placebo group (n=31) and 9.33 mM (SD 1.65 mM) for the escitalopram group (n=30, p = 0.45). The mean post-treatment value for GABA was 1.38 mM (SD 0.59 mM) for the placebo group (n=30) and 1.57 mM (SD 0.63) for the escitalopram group (n=30, p = 0.25).
The relationship between metabolite levels and depression severity can be used to determine whether Glx and/or GABA levels change with depression severity. As shown in Figure 2, there was no significant relationship between depression severity (HDRS17) and Glx (p=0.67, estimated coefficient (95% CI) = −0.09 (−0.50, 0.32)) or GABA (p = 0.50, estimated coefficient (95% CI) = −0.43 (−1.71, 0.84)) in the ACC. Figure 3 shows there were no significant relationships between HDRS17 PD and GABA PD or Glx PD within either treatment type. There was no significant linear relationship between HDRS17 PD and Glx PD (p = 0.58, estimated coefficient (95% CI) = −0.06 (−0.29, 0.17)), including adjustment for treatment type: p = 0.59, estimated coefficient (95% CI) = −0.06 (−0.30, 0.17)). There was no significant relationship between HDRS17 PD and GABA PD (p = 0.85, estimated coefficient (95% CI) = −0.01 (−0.11, 0.09), including adjusting for treatment type: p=0.8501, estimated coefficient (95% CI) = −0.01 (−0.11, 0.09)). Figure 4 shows there was no significant linear relationship between percent change in HDRS17 and Glx/GABA PD, either with or without the outlier of Glx/GABA (p = 0.91, 95% CI = −0.01 (−0.13, 0.12), including adjusting for treatment type: p = 0.92, 95% CI = −0.01 (−0.13, 0.12)). BF hypothesis testing showed moderate evidence for H0 , i.e., absence of a relationship between the change in HDRS17 and change in Glx/GABA from pre- to post-intervention, both with (BF = 0.1014) and without (BF = 0.2655) treatment type as a covariate.
Figure 2.
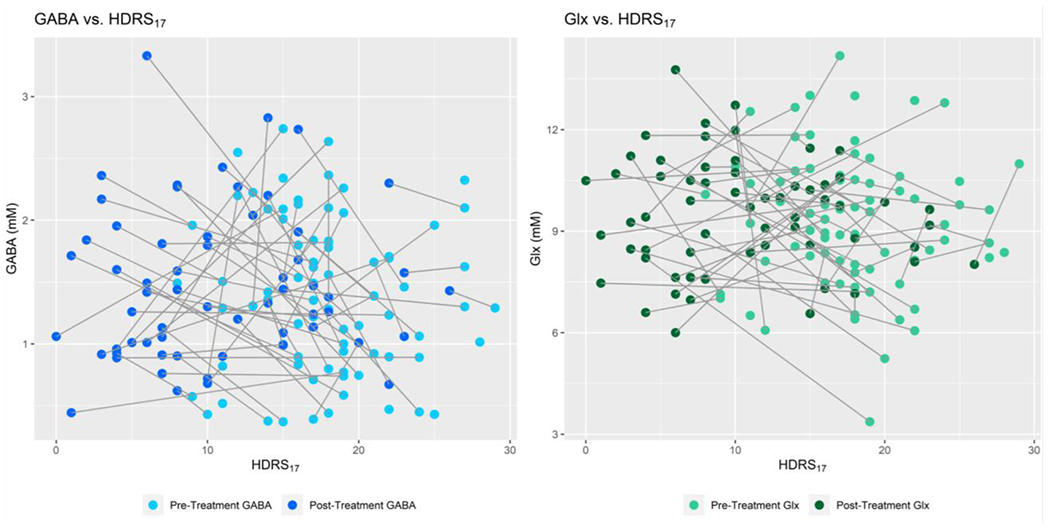
Concentrations (mM) of GABA (left) and Glx (right) as a function of depression (HDRS17) in the ACC.
Left: pre-treatment (n=80, light blue) and post-treatment (n=60, dark blue) GABA values as a function of pre- and post-treatment HDRS17 scores, with lines connecting each participant’s pre- and post-treatment values.
Right: pre-treatment (n=81, light green) and post-treatment (n=61, dark green) Glx values as a function of pre- and post-treatment HDRS17 scores, with lines connecting each participant’s pre- and post-treatment values. No significant correlation between depression severity and neurotransmitter concentration was found, before or after covarying for treatment type.
Figure 3.
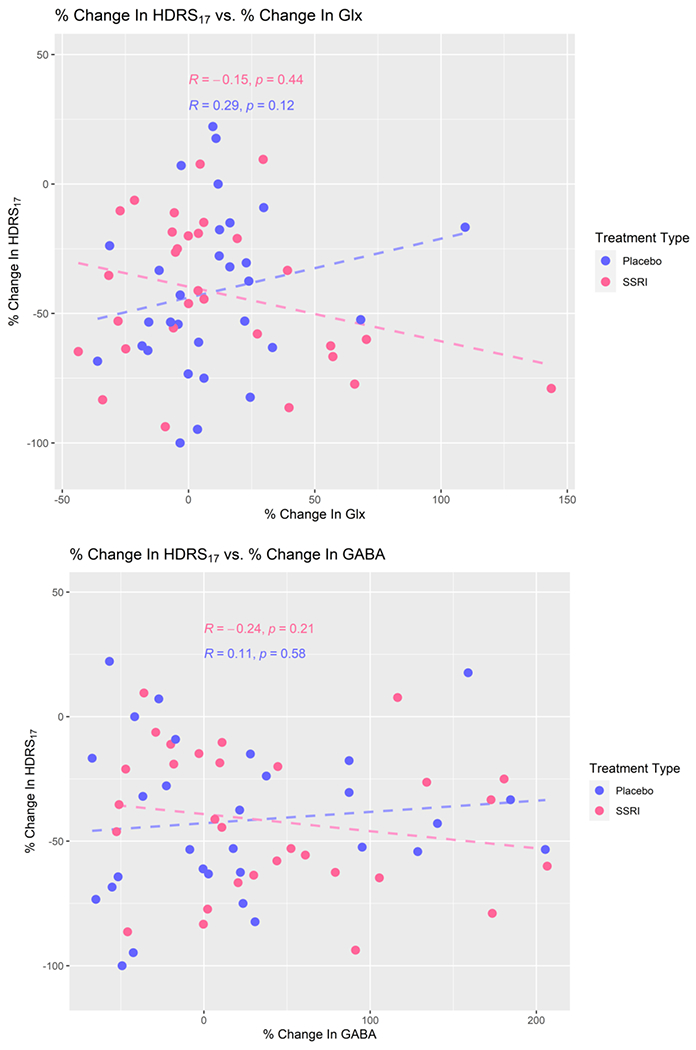
Percent change in HDRS17 as a function of % change in Glx (top) and GABA (bottom), n=60 (placebo: n=30, escitalopram: n=30). Negative values for change in HDRS17 indicate a reduction in depressive symptom severity with treatment. Best fit lines (dashed) from the linear regression are included, though no significant relationship was found.
Figure 4.
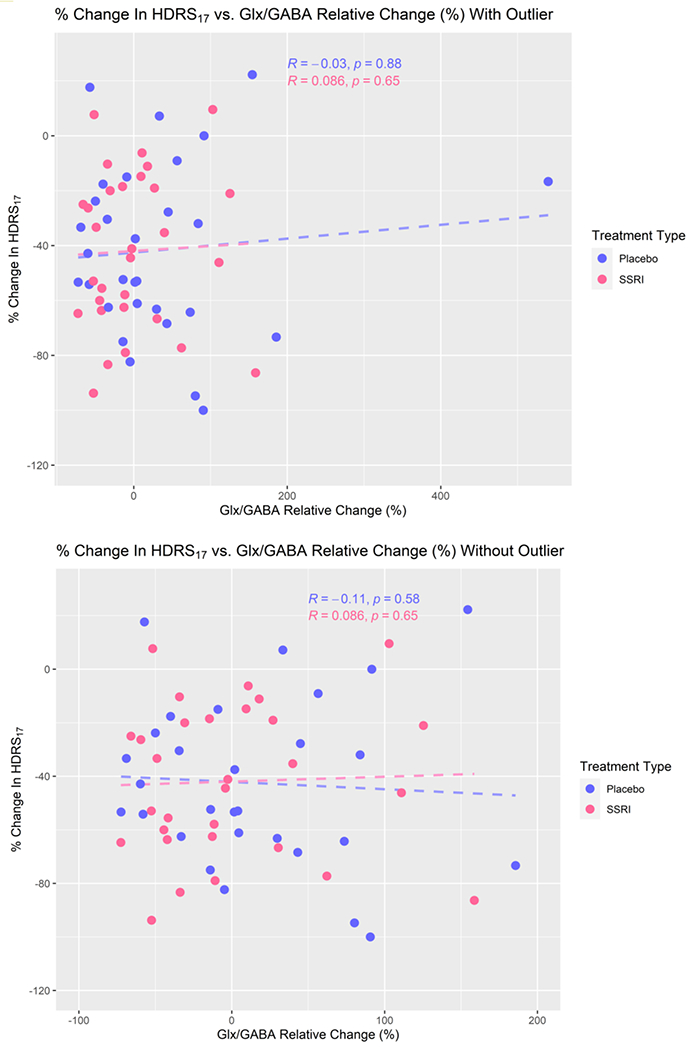
Percent difference in HDRS17 as a function of % change in Glx/GABA, with outlier (top, n=60; placebo n=30, escitalopram n=30) and without outlier (bottom, n=59; placebo n=29, escitalopram n=30). Best fit lines (dashed) from the linear regression are included, though no significant relationship was found.
Discussion:
Given the variability in previous literature, which largely addresses GABA and Glx independently, our results address the dynamics of both neurotransmitters in the ACC in depression. We found no significant relationship between percent difference in depression severity and percent difference in ACC Glx, GABA, or Glx/GABA, regardless of treatment type. Further, our study shows moderate evidence of absence of a relationship between percent difference in MDD severity and percent difference in Glx/GABA in the ACC with treatment.
Since our study focuses on changes in Glx and/or GABA that are representative of depression severity, rather than changes brought about by a specific antidepressant, we analyzed the placebo and escitalopram groups together, looking for a relationship between depression severity and Glx, GABA, or Glx/GABA. No such relationships existed, which remained true even after adding treatment type as a covariate. We predicted that neurochemical and affective changes would be similar between SSRI and placebo groups based on previous double-blind clinical trials of patients with mild to moderate depression that found similar rates of response to antidepressant drugs and placebo 35, 60, consistent with our findings47. According to systematic reviews and meta-analyses, only about 40% of remission from MDD can be attributed to active treatment, with the remainder attributable to placebo effects and spontaneous improvement 61. There is no unequivocal evidence of differences in treatment-induced neurobiological changes in patients treated with antidepressants versus placebo drugs1, also consistent with our study results. Both escitalopram and placebo groups in our study experienced reductions in depression, and there were no significant differences in brain Glx, GABA, or response that separated active drug from placebo group. Although, by chance, there was a slight difference in pretreatment depression severity between the active drug and placebo group, the difference was small (~2 points on the HDRS17) and unlikely to have a meaningful effect on outcomes. Previous research suggests altered glutamatergic signaling may only be seen in more severe depression 35, 40. We investigated this possibility in our sample and found no correlation between depression severity and Glx or GABA (Figure 2).
When examining change in metabolites, our study used a within-subject design, which eliminates potential variation due to age, sex, or baseline differences in absolute Glx or GABA. Our results suggest that an excitatory/inhibitory imbalance in the ACC is insufficient to explain depression severity or treatment response in MDD. These results fall in line with the inconclusive previous literature and provide the additional insight that the balance between Glx and GABA does not correlate with reduction of depressive symptoms. There are numerous potential reasons for these findings including the heterogeneity of MDD, limitations of 1H-MRS, restriction to a single brain region and/or potential invariance of GABA and glutamate levels with affective state.
MDD is a highly heterogenous disease; there are close to 1500 combinations of symptoms that can result in a diagnosis of MDD 62. Recognizing this variation, the DSM-5 has added specifiers to MDD, such as “with anxious distress” or “with mixed features,” but all these presentations fall under the umbrella term of MDD, which fails to capture the impact of life events, developmental factors, cultural factors, or individual traits such as resilience. It is likely that only some patients with MDD have an underlying imbalance in Glx/GABA; furthermore, these imbalances may differ by brain region and time course of the illness 63, 64.
Another consideration is that 1H-MRS does not distinguish between intracellular and extracellular glutamate. Excessive extra-synaptic glutamate is associated with neurotoxicity and loss of microglia 24. Extra-synaptic glutamatergic signaling pathways are thought to be disturbed in MDD, particularly in treatment-resistant depression 24. Glutamate may accumulate in MDD due to irregularities in glutamine-glutamate cycling, deficient glutamic acid decarboxylase, reduced glutamate transporters, malfunctioning glial cells (causing abnormal uptake or release of glutamate), or glutamate receptor alterations 28, 65. Differences in enzyme expression or activity could also result in decreased conversion of glutamate to glutamine or GABA 5. The resultant accumulation of extra-synaptic glutamate could result in excitotoxicity and loss of microglia, which has been observed in post-mortem brain tissue of subjects with MDD 64. Considering that glutamate is cleared primarily by glial cells, this loss of microglia could lead to further glutamate accumulation and neurotoxicity 66. In this way, measurements of extra-synaptic glutamate alone may provide a closer association with mood.
The use of the combined measure, Glx, rather than separately measuring Glu and Gln, could contribute to the lack of observed difference in Glx/GABA ratio, as the measurement of Glx does not account for fluctuations in Gln and Glu individually 65, 67. Constant flux through the glutamate-glutamine cycle and recycling of glutamate and glutamine between neurons and glial cells may hinder detection of any appreciable change in the composite signal, Glx 40. However, separating Glx into glutamate (Glu) and glutamine (Gln) has also yielded inconclusive findings. There is some evidence that there is increased Glu but normal levels of Gln in acute depression 67. However, there is also evidence that MDD patients have elevated CSF Gln 21 and higher Gln/Glu ratios in the ACC 65 compared with controls. In contrast, some studies show no significant differences in Gln, Glu, or Gln/Glu ratios before and after treatment 3, 35. Further studies distinguishing between Gln and Glu are needed. Future studies could also examine whether changes in Gln, Glu, or GABA are specific to certain dimensions of MDD (e.g. anhedonia, anergia, anorexia, or apathy)7.
Technical limitations must be considered, as GABA is challenging to quantify using 1H-MRS, which can lead to a reduction in useable images as seen in this study. The greatest technical challenge for robust GABA quantification using J-edited 1H-MRS is the temporal instability of the 1H-MRS signal, which leads to unstable subtraction artifacts. Signal variation from physiological sources is typically small and can be corrected during post-processing (e.g., frequency drift is corrected for by spectral registration)57. Participant stability is a greater concern as excessive head motion will shift spectral voxel location and result in data loss. Another key technical aspect of GABA 1H-MRS is the B0 homogeneity within voxel location. The Siemens Advanced Shimming methods may not achieve optimal results in some participants if susceptibility artifacts from neighboring orbits and sinuses cannot be adequately mitigated. This is because each voxel has unique alterations in B0 homogeneity and F0, resulting in altered spectral quality, water suppression and apparent metabolite concentrations52. It is for these reasons that rigorous quality control was performed in this study.
Since we limited our study to one voxel, targeting the ACC, the spectroscopy result is not representative of neurotransmitter dynamics of regions outside this voxel. The pathophysiology of MDD is likely linked to multiple brain regions, and previous work suggests alterations in functional connectivity between corticolimbic structures64. Therefore, measurement of neurochemical imbalances in the ACC alone may not be adequate to gain a comprehensive understanding of the neurobiology underlying MDD. It is also possible that Glx and GABA concentrations are trait-dependent, rather than state-dependent 67. If Glx and GABA alterations represent a biological predisposition to MDD, no change would be observed with severity of depressive symptoms.
We note that any MRS study using Glx and Glu as outcomes in MDD will be affected by the above considerations. Within such constraints, we sought to design a rigorous and repeatable study in order to unify a disparate field. Our sample of 81 participants were screened by trained raters using the SCID-IV and MADRS and met criteria for MDD by both measures. The HDRS17 is a clinician-administered tool that has been regarded as the gold standard in measuring depressive severity for over 50 years 68. Our participants had pretreatment HDRS17 scores comparable to the those of participants in similar studies 35. The MADRS was used for screening participants for the study, but the HDRS17 was used to measure depression severity over the course of the intervention. This was done in order to prevent any artificial inflation in the screening MADRS from affecting measured improvements over the 8-week study 45. Furthermore, to prevent confounding effects of psychoactive substances, all participants were medication-free for at least three weeks prior to pretreatment imaging.
We utilized validated methods and statistics such as Bayes Factor hypothesis testing to establish compelling evidence for the true absence of a relationship between depression severity and Glx/GABA. While positive findings are often backed by “p < 0.05”, a Bayes Factor of < 1/3 provides support for our negative findings. Bayes factor hypothesis testing showed moderate evidence to support the null hypothesis (no relationship between HDRS17 and Glx/GABA in the ACC). The concurrence between our frequentist and Bayesian statistics provides convincing evidence that neither Glx, GABA, or Glx/GABA is meaningfully correlated with depression severity or changes in depression severity after treatment.
The lack of uniform directionality of changes in Glx, GABA, or Glx/GABA in this rigorous, well-powered study may explain the divergent findings of previous studies. It further suggests that such MRS measures are unlikely to correlate with MDD severity or improvement in treatment, allowing resources to be diverted to other avenues. Future studies should incorporate additional measures, such as separating Gln and Glu to target the precise locations of these neurotransmitters. This information could be more valuable in combination with multimodal imaging techniques to examine activity within and between relevant brain regions. Dissemination of these negative findings is important as it can minimize waste 69 and provide direction for future researchers investigating the neurobiological underpinnings of MDD and treatment response.
Supplementary Material
Acknowledgements:
We would like to thank the Biostatistical Consulting Core at the Stony Brook University Renaissance School of Medicine, and the clinical team who coordinated participant screening and symptom scale rating: Greg Perlman, Juhayer Alam, Kate Bartolotta, Dr. Yashar Yousefzadeh-Fard, Michala Godstrey, Qurat-ul-ain Gulamhussein, Nichole Hoehn, Dan Holzmacher, Dr. Sridhar Kadiyala, Colleen Oliva, Nehal Vadhan, Jennifer Rubinstein, Dr. Laura Kunkel, and Dr. Lucian Manu.
Funding Sources:
• NIMH (National Institute of Mental Health) R01MH104512
• Brain & Behavior Foundation
• The Dana Foundation
• NYS Faculty Development Grant
Figure Legend
- pgACC
pregenual Anterior Cingulate Cortex
- OCC
Occipital Cortex
- ACC
Anterior Cingulate Cortex
- MCC
Midcingulate Cortex
- DLPFC
Dorsolateral Prefrontal Cortex
- mPFC
Ventromedial Prefrontal Cortex
- HDRS17
17-item Hamilton Depression Rating Scale
- MADRS
Montgomery-Åsberg Depression Rating Scale
- MDD
Major Depressive Disorder
- MDE
Major Depressive Episode
- rTMS
repetitive Transcranial Magnetic Stimulation
- CBT
Cognitive Behavioral Therapy
- ECT
Electroconvulsive Therapy
Footnotes
IRB Approval:
• This study (ID # 570152) was approved by the IRB (3/20/2015 – 12/21/2021)
Disclosures / Conflicts of Interest:
G.A.N. has no financial disclosures or conflicts of interest to declare
K.R.H. has no financial disclosures or conflicts of interest to declare
X.H. has no financial disclosures or conflicts of interest to declare
K.W. has no financial disclosures or conflicts of interest to declare
J.Y. has no financial disclosures or conflicts of interest to declare
J.W. has no financial disclosures or conflicts of interest to declare
R.V.P. has no financial disclosures or conflicts of interest to declare
C.D. has no financial disclosures or conflicts of interest to declare
Clinical Trials Registration: Advancing Personalized Antidepressant Treatment Using PET/MRI, ClinicalTrials.gov, NCT02623205
References
- 1.Brown V, Pecina M. Neuroimaging Studies of Antidepressant Placebo Effects: Challenges and Opportunities. Frontiers in Psychiatry 2019; 10(69): 1–8. [DOI] [PMC free article] [PubMed] [Google Scholar]
- 2.Lener MS, Niciu MJ, Ballard ED, Park M, Park LT, Nugent AC & Zarate CA Glutamate and GABA systems in the Pathophysiology of Major Depression and Antidepressant Response to Ketamine. Biol Psychiatry 2017; 81(10): 886–897. [DOI] [PMC free article] [PubMed] [Google Scholar]
- 3.Brennan B, Admon R, Perriello C, LaFlamme E, Athey A, Pizzagalli D et al. Acute change in anterior cingulate cortex GABA, but not glutamine/glutamate, mediates antidepressant response to citalopram. Psychiatry Res Neuroimaging 2017; 269: 9–16. [DOI] [PMC free article] [PubMed] [Google Scholar]
- 4.Sanacora G, Gueorguieva R, Epperson C, Wu Y, Appel M, Rothman D et al. Subtype-specific alterations in gamma-aminobutyric acid and glutamate in patients with major depression. Arch Gen Psychiatry 2004; 61(7): 705–713. [DOI] [PubMed] [Google Scholar]
- 5.Hashimoto K The role of glutamate on the action of antidepressants. Progress in Neuropsychopharmacology & Biological Psychiatry 2011; 35: 1558–1568. [DOI] [PubMed] [Google Scholar]
- 6.Bhagwagar Z, Wylezinska M, Jezzard P, Evans J, Boorman E, Matthews PM et al. Low GABA concentrations in occipital cortex and anterior cingulate cortex in medication-free, recovered depressed patients. Int J Neuropsychopharm 2008; 15: 39–47. [DOI] [PubMed] [Google Scholar]
- 7.Gabbay V, Mao X, Klein RG, Ely BA, Babb JS, Panzner AM, Alonso CM & Shungu DC. Anterior Cingulate Cortex γ-Aminobutyric Acid in Depressed Adolescents: Relationship to Anhedonia. Arch Gen Psychiatry 2012; 69(2): 139–149. [DOI] [PMC free article] [PubMed] [Google Scholar]
- 8.Price RB, Shungu DC, Mao X, Nestadt P, Kelly C, Collins KA, Murrough JW, Charney DS & Mathew SJ . Amino Acid Neurotransmitters Assessed by 1H MRS: Relationship to Treatment Resistance in Major Depressive Disorder. Biological Psychiatry 2009; 65(9): 792–800. [DOI] [PMC free article] [PubMed] [Google Scholar]
- 9.Abdallah C, Jackowski A, Sato JR, Mao X, Kang G, Cheema R et al. Prefrontal cortical GABA abnormalities are associated with reduced hippocampal volume in major depressive disorder. Eur Neuropsychopharmacol 2015; 25(8): 1082–1090. [DOI] [PMC free article] [PubMed] [Google Scholar]
- 10.Sanacora G, Treccani G, Popoli M. Towards a glutamate hypothesis of depression: an emerging frontier of neuropsychopharmacology for mood disorders. Neuropharmacology 2012; 62: 63–77. [DOI] [PMC free article] [PubMed] [Google Scholar]
- 11.Luykx J, Laban K, van den Heuvel M, Boks M, Mandl R, Kahn R et al. Region and state specific glutamate downregulation in major depressive disorder: a meta-analysis of (1)H-MRS findings. Neurosci Biobehav Rev 2012; 36: 198–205. [DOI] [PubMed] [Google Scholar]
- 12.Sanacora G, Mason G, Rothman D, Behar K, Hyder F, Petroff O et al. Reduced cortical gamma-aminobutyric acid levels in depressed patients determined by proton magnetic resonance spectroscopy. Arch Gen Psychiatry 1999; 56(11). [DOI] [PubMed] [Google Scholar]
- 13.Yildiz-Yesiloglu AA DP Review of 1H magnetic resonance spectroscopy findings in major depressive disorder: A meta-analysis. Psychiatry Res Neuroimaging 2006; 147: 1–28. [DOI] [PubMed] [Google Scholar]
- 14.Gunduz-Bruce H, Silber C, Kaul I, Rothschild A, Riesenberg R, Sankoh A et al. Trial of SAGE-217 in Patients with Major Depressive Disorder. New England Journal of Medicine 2019; 381: 903–911. [DOI] [PubMed] [Google Scholar]
- 15.Godfrey KE, Gardner AC, Kwon S, Chea W & Muthukumaraswamy SD Differences in excitatory and inhibitory neurotransmitter levels between depressed patients and healthy controls: a systematic review and meta-analysis. J Psychiatr Res 2018; 105: 33–44. [DOI] [PubMed] [Google Scholar]
- 16.Romeo BC W; Fossati P; Rotge J Meta-analysis of central and peripheral γ-aminobutyric acid levels in patients with unipolar and bipolar depression. Journal of Psychiatry & Neuroscience, 2018; 43(1): 58–66. [DOI] [PMC free article] [PubMed] [Google Scholar]
- 17.Abdallah C, Jiang L, DeFeyter H, Fasula M, Krystal J, Rothman D et al. Glutamate metabolism in major depressive disorder. The American journal of psychiatry 2014; 171: 1320–1327. [DOI] [PMC free article] [PubMed] [Google Scholar]
- 18.Meltzer-Brody S, Colquhoun H, Riesenberg R, Epperson C, Deligiannidis K, Rubinow D et al. Brexanolone injection in post-partum depression: two multicentre, double-blind, randomised, placebo-controlled, phase 3 trials. Lancet 2018; 392: 1058–1070. [DOI] [PubMed] [Google Scholar]
- 19.Bhagwagar Z, Wylezinska M, Taylor M, Jezzard P, Matthews P, Cowen P. Increased brain GABA concentrations following acute administration of a selective serotonin reuptake inhibitor. The American journal of psychiatry 2004; 161(2): 368–370. [DOI] [PubMed] [Google Scholar]
- 20.Sanacora G, Mason G, Rothman D, Krystal J. Increased occipital cortex GABA concentrations in depressed patients after therapy with selective serotonin reuptake inhibitors. The American journal of psychiatry 2002; 159(4): 663–665. [DOI] [PubMed] [Google Scholar]
- 21.Levine J, Panchalingam K, Rapoport A, Gershon S, McClure R, Pettegrew J. Increased cerebrospinal fluid glutamine levels in depressed patients. Biol Psychiatry 2000; 47(7): 586–593. [DOI] [PubMed] [Google Scholar]
- 22.Yuksel C, Ongur D. Magnetic Resonance Spectroscopy Studies of Glutamate-Related Abnormalities in Mood Disorders. Biol Psychiatry 2010; 68(9): 785–794. [DOI] [PMC free article] [PubMed] [Google Scholar]
- 23.Dang YH, Ma XC, Zhang JC, Ren Q, Wu J, Gao CG et al. Targeting of NMDA receptors in the treatment of major depression. Curr Pharm Des 2014; 20(32): 5151–5159. [DOI] [PubMed] [Google Scholar]
- 24.Kim Y, Na K. Role of glutamate receptors and glial cells in the pathophysiology of treatment-resistant depression. Prog Neuropsychopharmacol Biol Psychiatry 2016; 70: 117–126. [DOI] [PubMed] [Google Scholar]
- 25.Kugaya A, Sanacora G, Verhoeff N, Fujita M, Mason GF, Seneca NM et al. Cerebral benzodiazepine receptors in depressed patients measured with [123i]iomazenil SPECT. Biological Psychiatry 2003; 54(8): 792–799. [DOI] [PubMed] [Google Scholar]
- 26.Godlewska B, Near J, Cowen P. Neurochemistry of major depression: a study using magnetic resonance spectroscopy. Psychopharmacology (Berl) 2015; 232(3): 501–507. [DOI] [PMC free article] [PubMed] [Google Scholar]
- 27.Walter M, Henning A, Grimm S, Schulte R, Beck J, Dydak U et al. The relationship between aberrant neuronal activation in the pregenual anterior cingulate, altered glutamatergic metabolism, and anhedonia in major depression. Arch Gen Psychiatry 2009; 66(5): 478–486. [DOI] [PubMed] [Google Scholar]
- 28.Grimm S, Luborzewski A, Schubert F, Merkl A, Kronenberg G, Colla M et al. Region-specific glutamate changes in patients with unipolar depression. J Psychiatr Res 2009; 46(8): 1059–1065. [DOI] [PubMed] [Google Scholar]
- 29.Godlewska B, Masaki C, Sharpley A, Cowen P, Emir U. Brain glutamate in medication-free depressed patients: A proton MRS study at 7 Tesla. Psychological Medicine 2018; 48(10): 1731–1737. [DOI] [PMC free article] [PubMed] [Google Scholar]
- 30.Abdallah C, Hannestad J, Mason G, Holmes S, DellaGioia N, Sanacora G et al. Metabotropic Glutamate Receptor 5 and Glutamate Involvement in Major Depressive Disorder: A Multimodal Imaging Study. Biological Psychiatry 2017; 2(July 2017): 449–456. [DOI] [PMC free article] [PubMed] [Google Scholar]
- 31.Moriguchi S, Takamiya A, Noda Y, Horita N, Wada M, Tsugawa S, Plitman E, Sano Y, Tarumi R, ElSalhy M, Katayama N, Ogyu K, Miyazaki T, Kishimoto T, Graff-Guerrero A, Meyer J, Blumberger D, Dakalakis Z, Mimura M, & Nakajima S Glutamatergic neurometabolite levels in major depressive disorder: a systematic review and meta-analysis of proton magnetic resonance spectroscopy studies. Molecular Psychiatry 2019; 24: 952–964. [DOI] [PMC free article] [PubMed] [Google Scholar]
- 32.Michael N, Erfurth A, Ohrmann P, Arolt V, Heindel W, Pfleiderer B. Metabolic changes within the left dorsolateral prefrontal cortex occurring with electroconvulsive therapy in patients with treatment resistant unipolar depression. Psychol Med 2003; 33(7): 1277–1284. [DOI] [PubMed] [Google Scholar]
- 33.Pfleiderer B, Michael N, Erfurth A, Ohrmann P, Hohmann U, Wolgast M et al. Effective electroconvulsive therapy reverses glutamate/glutamine deficit in the left anterior cingulum of unipolar depressed patients. Psychiatry Res 2003; 122(3): 185–192. [DOI] [PubMed] [Google Scholar]
- 34.Sanacora G, Mason G, Rothman D, Hyder F, Ciarcia J, Ostroff R et al. Increased cortical GABA concentrations in depressed patients receiving ECT. The American journal of psychiatry 2003; 160: 577–579. [DOI] [PubMed] [Google Scholar]
- 35.Taylor MJ, Godlewska BR, Norbury R, Selvaraj S, Near J, Cowen PJ. Early increase in marker of neuronal integrity with antidepressant treatment of major depression: 1H-magnetic resonance spectroscopy of N-acetyl-aspartate. Int J Neuropsychopharmacol 2012; 15(10): 1541–1546. [DOI] [PMC free article] [PubMed] [Google Scholar]
- 36.Sanacora G, Fenton L, Fasula M, Rothman D, Levin Y, Krystal J et al. Cortical GABA concentrations in depressed patients receiving cognitive behavioral therapy. Biol Psychiatry 2006; 59: 284–286. [DOI] [PubMed] [Google Scholar]
- 37.Abdallah C, Niciu M, Fenton L, Fasula M, Jiang L, Black A et al. Decreased Occipital Cortical Glutamate Levels in Response to Successful Cognitive Behavioral Therapy and Pharmacotherapy for Major Depressive Disorder. Psychotherapy and psychosomatics 2014; 83(5): 298–307. [DOI] [PMC free article] [PubMed] [Google Scholar]
- 38.Legarreta M, Sheth C, Prescot A, Renshaw P, McGlade E, Yurgelun-Todd D. An Exploratory Proton MRS Examination of Gamma-Aminobutyric Acid, Glutamate, and Glutamine and Their Relationship to Affective Aspects of Chronic Pain. Neuroscience Research 2020. [DOI] [PubMed] [Google Scholar]
- 39.Levar N, van Leeuwen JMC, Denys D & van Wingen GA Divergent influences of anterior cingulate cortex GABA concentrations on the emotion circuitry. NeuroImage 2017; 158: 136–144. [DOI] [PubMed] [Google Scholar]
- 40.Horn D, Yu C, Steiner J, Buchmann J, Kaufmann J, Osoba A et al. Glutamatergic and resting-state functional connectivity correlates of severity in major depression - the role of pregenual anterior cingulate cortex and anterior insula. Frontiers In Systems Neuroscience 2010; 4(July 2010): 1–10. [DOI] [PMC free article] [PubMed] [Google Scholar]
- 41.Northoff GS E Why Are Cortical GABA Neurons Relevant to Internal Focus in Depression? A cross-level model linking cellular, biochemical, and neural network findings. Mol Psychiatry 2014; 19(9): 966–977. [DOI] [PMC free article] [PubMed] [Google Scholar]
- 42.Hamilton M A rating scale for depression. J Neurol Neurosurg Psychiatry 1960; 23: 56–62. [DOI] [PMC free article] [PubMed] [Google Scholar]
- 43.First MB, Spitzer RL, Miriam G, Williams JBW. Structured Clinical Interview for DSM-IV-TR Axis I Disorders, Research Version, Patient Edition, (SCID-I/P). Biometric Research Department, New York State Psychiatric Institute: New York, 2002. [Google Scholar]
- 44.Montgomery SA, Asberg M. A new depression scale designed to be sensitive to change. Br J Psychiatry 1979; 134: 382–389. [DOI] [PubMed] [Google Scholar]
- 45.Fournier JC, DeRubeis RJ, Hollon SD, Dimidjian S, Amsterdam JD, Shelton RC et al. Antidepressant Drug Effects and Depression Severity: A Patient-Level Meta-analysis. JAMA 2010; 303(1): 47–53. [DOI] [PMC free article] [PubMed] [Google Scholar]
- 46.Landin R, DJ D, TA D, WZ P, MA D. The impact of restrictive entry criterion during the placebo lead-in period Biometrics 2000; 56(1): 271–278. [DOI] [PubMed] [Google Scholar]
- 47.Hill KR, Gardus JD, Bartlett EA, Perlman G, Parsey RV, DeLorenzo C. Measuring brain glucose metabolism in order to predict response to antidepressant or placebo: A randomized clinical trial. Neuroimage Clin 2021; 32: 102858. [DOI] [PMC free article] [PubMed] [Google Scholar]
- 48.Lin A, Andronesi O, Bogner W, Choi IY, Coello E, Cudalbu C et al. Minimum Reporting Standards for in vivo Magnetic Resonance Spectroscopy (MRSinMRS): Experts’ consensus recommendations. NMR Biomed 2021; 34(5): e4484. [DOI] [PMC free article] [PubMed] [Google Scholar]
- 49.Kreis R The trouble with quality filtering based on relative Cramér‐Rao lower bounds. Magnetic resonance in Medicine 2016; 75(1): 15–18. [DOI] [PubMed] [Google Scholar]
- 50.Landheer K, Juchem C. Are Cramér‐Rao lower bounds an accurate estimate for standard deviations in in vivo magnetic resonance spectroscopy? NMR in Biomedicine 2021; 34(7): e4521. [DOI] [PubMed] [Google Scholar]
- 51.Mescher M, Merkle H, Kirsch J, Garwood M, Gruetter R. Simultaneous in vivo spectral editing and water suppression. NMR Biomed 1998; 11(6): 266–272. [DOI] [PubMed] [Google Scholar]
- 52.Saleh MG, Edden RAE, Chang L, Ernst T. Motion correction in magnetic resonance spectroscopy. Magn Reson Med 2020; 84(5): 2312–2326. [DOI] [PMC free article] [PubMed] [Google Scholar]
- 53.Harris AD, Puts NA, Edden RA. Tissue correction for GABA-edited MRS: Considerations of voxel composition, tissue segmentation, and tissue relaxations. J Magn Reson Imaging 2015; 42(5): 1431–1440. [DOI] [PMC free article] [PubMed] [Google Scholar]
- 54.Harris AD, Nicolaas AJP, Edden RAE. Tissue correction for GABA‐edited MRS: Considerations of voxel composition, tissue segmentation, and tissue relaxations. Journal of Magnetic Resonance Imaging 2015; 42(5): 1431–1440. [DOI] [PMC free article] [PubMed] [Google Scholar]
- 55.Edden RA, Puts NA, Harris AD, Barker PB, Evans CJ. Gannet: A batch-processing tool for the quantitative analysis of gamma-aminobutyric acid-edited MR spectroscopy spectra. J Magn Reson Imaging 2014; 40(6): 1445–1452. [DOI] [PMC free article] [PubMed] [Google Scholar]
- 56.Klose U In vivo proton spectroscopy in presence of eddy currents. Magn Reson Med 1990; 14(1): 26–30. [DOI] [PubMed] [Google Scholar]
- 57.Near J, Edden R, Evans CJ, Paquin R, Harris A, Jezzard P. Frequency and phase drift correction of magnetic resonance spectroscopy data by spectral registration in the time domain. Magn Reson Med 2015; 73(1): 44–50. [DOI] [PMC free article] [PubMed] [Google Scholar]
- 58.Wilson M, Reynolds G, Kauppinen RA, Arvanitis TN, Peet AC. A constrained least-squares approach to the automated quantitation of in vivo (1)H magnetic resonance spectroscopy data. Magn Reson Med 2011; 65(1): 1–12. [DOI] [PubMed] [Google Scholar]
- 59.Keysers C, Gazzola V, Wagenmakers E. Using Bayes factor hypothesis testing in neuroscience to establish evidence of absence. Nature Neuroscience 2020; 23(July): 788–799. [DOI] [PMC free article] [PubMed] [Google Scholar]
- 60.Colloca L, Barsky A. Placebo and Nocebo Effects. New England Journal of Medicine 2020; 382(6): 554–561. [DOI] [PubMed] [Google Scholar]
- 61.Whiteford HA, Harris MG, McKeon G, Baxter A, Pennell C, Barendregt JJ et al. Estimating remission from untreated major depression: a systematic review and meta-analysis. Psychol Med 2013; 43(8): 1569–1585. [DOI] [PubMed] [Google Scholar]
- 62.Yang J, Zhang M, Ahn H, Zhang Q, Jin T, Li I et al. Development and evaluation of a multimodal marker of major depressive disorder. Hum Brain Mapp 2018; 39: 4420–4439. [DOI] [PMC free article] [PubMed] [Google Scholar]
- 63.Draganov M, Vives-Gilabert Y, Diego-Adelino J, Vicent-Gil M, Puigdemont D, Portella M. Glutamatergic and GABA-ergic abnormalities in First-episode depression. A 1-year follow-up 1H-MR spectroscopic study. Journal of Affective Disorders 2020; 266: 572–577. [DOI] [PubMed] [Google Scholar]
- 64.Njau S, Joshi S, Espinoza R, Leaver A, Vasavada M, Marquina A et al. Neurochemical correlates of rapid treatment response to electroconvulsive therapy in patients with major depression. J Psychiatr Neurosci 2017; 42(1): 6–16. [DOI] [PMC free article] [PubMed] [Google Scholar]
- 65.Colic L, von During F, Denzel D, Demenescu LR, Lord AR, Martens L et al. Rostral Anterior Cingulate Glutamine/Glutamate Disbalance in Major Depressive Disorder Depends on Symptom Severity. Biol Psychiatry Cogn Neurosci Neuroimaging 2019; 4(12): 1049–1058. [DOI] [PubMed] [Google Scholar]
- 66.Yang J, Shen J. In vivo evidence for reduced cortical glutamate-glutamine cycling in rats treated with the antidepressant/antipanic drug phenelzine. Neuroscience 2005; 135: 927–937. [DOI] [PubMed] [Google Scholar]
- 67.Taylor MJ, Mannie Z, Norbury R, Near J, Cowen P. Elevated cortical glutamate in young people at increased familial risk of depression. International Journal of Neuropsychopharmacology 2011; 14: 255–259. [DOI] [PubMed] [Google Scholar]
- 68.Bobo WV, Angleró GC, Jenkins G, Hall-Flavin DK, Weinshilboum R, Biernacka JM. Validation of the 17-item Hamilton Depression Rating Scale definition of response for adults with major depressive disorder using equipercentile linking to Clinical Global Impression scale ratings: analysis of Pharmacogenomic Research Network Antidepressant Medication Pharmacogenomic Study (PGRN-AMPS) data. Human psychopharmacology 2016; 31(3): 185–192. [DOI] [PMC free article] [PubMed] [Google Scholar]
- 69.Bespalov A, Steckler T, Skolnick P. Be positive about negatives-recommendations for the publication of negative (or null) results. Eur Neuropsychopharmacol 2019; 29(12): 1312–1320. [DOI] [PubMed] [Google Scholar]
Associated Data
This section collects any data citations, data availability statements, or supplementary materials included in this article.