

Abstract
Neural oscillations may be sensitive to aspects of brain maturation such as myelination and synaptic density changes. Better characterization of developmental trajectories and reliability is necessary for understanding typical and atypical neurodevelopment. Here, we examined reliability in 110 typically developing children and adolescents (aged 9–17 years) across 2.25 years. From 10 min of magnetoencephalography resting-state data, normalized source spectral power and intraclass correlation coefficients were calculated. We found sex-specific differences in global normalized power, with males showing age-related decreases in delta and theta, along with age-related increases in beta and gamma. Females had fewer significant age-related changes. Structural magnetic resonance imaging revealed that males had more total gray, subcortical gray, and cortical white matter volume. There were significant age-related changes in total gray matter volume with sex-specific and frequency-specific correlations to normalized power. In males, increased total gray matter volume correlated with increased theta and alpha, along with decreased gamma. Split-half reliability was excellent in all frequency bands and source regions. Test–retest reliability ranged from good (alpha) to fair (theta) to poor (remaining bands). While resting-state neural oscillations can have fingerprint-like quality in adults, we show here that neural oscillations continue to evolve in children and adolescents due to brain maturation and neurodevelopmental change.
Keywords: magnetoencephalography, neurodevelopment, reliability, resting state, spectral power
Introduction
Examining spontaneous neural oscillations during a resting-state has become increasingly prevalent during the last decade of neuroimaging research. Functional brain imaging using magnetoencephalography (MEG) offers excellent characterization of brain dynamics and neural oscillations. Oscillations arise from the rhythmic fluctuations in the excitability of neurons and the shifting balance between states of excitation and inhibition within gray matter (Başar et al. 2001; Uhlhaas et al. 2008; Singer 2011).
Neural oscillations are sensitive to developmental changes. As the brain matures, there is a redistribution of power across frequency bands, slow wave activity decreases while higher frequency power increases (Clarke et al. 2001; Whitford et al. 2007; Barry and Clarke 2009; Segalowitz et al. 2010; Cragg et al. 2011; Gómez et al. 2013, 2017; Schäfer et al. 2014; Miskovic et al. 2015; Brookes et al. 2018; Hunt et al. 2019; Ott et al. 2021). While the previous research has been informative in elucidating general trends in resting-state spectral power, there is a lack of longitudinal data tracking age-dependent change within the same children and adolescents. Another prominent finding in parietal–occipital regions is that alpha peak frequency, or maximum power in the alpha frequency band, increases from 6 Hz at 12 months of age to adult-like 10–12 Hz oscillations by 6–12 years of age (Somsen et al. 1997; Marshall et al. 2002; Miskovic et al. 2015). These broad spectral changes are influenced by multiple brain maturation processes. During adolescence, changes in neuronal density and synaptic pruning, along with gray matter volume reduction, may be processes underlying declines in spectral power (Whitford et al. 2007). At the same time, changing neurotransmitter levels and information processing efficiency (Segalowitz et al. 2010), along with functional organization of neural networks and changes in white matter (Smit et al. 2012), may also underlie the spectral power changes seen during adolescence. Beyond these broad changes in neural oscillations, our understanding of the reproducibility and reliability of MEG-derived spontaneous oscillations remains scarce.
Few studies have examined sex-specific differences in resting-state spectral power during childhood and adolescence. The existence of sex-specific differences in resting oscillations in children and adolescents in the EEG literature has conflicting reports, from no differences to the existence of a maturational lag in girls which disappears by adolescence (Clarke et al. 2001; Barry et al. 2004). A common sex-specific difference appears in the alpha band. For example, males have been found to have less theta and more alpha band power and higher alpha peak frequency than females between the ages of 8 and 12 years (Clarke et al. 2001). Another example of sex-specific differences in the alpha band is that more advanced pubertal stage predicts reduced alpha power in prefrontal and occipital regions in males but not female adolescents aged 9–17 years (Howsley and Levita 2018). It is known that sex-specific differences exist in gray matter volume during adolescence, with gray matter volume peaking 1–2 years earlier in females than males (Giedd et al. 1999; Lenroot et al. 2007; Giedd and Rapoport 2010). If gray matter development is a contributing factor underlying changes in resting-state spectral power, then it is expected that differences in resting-state spectral power between females and males may exist as well. A recent MEG study has explored the impact of sex on resting-state spectral power in development and found that females had greater delta and beta power while males had greater alpha power (Ott et al. 2021). Furthermore, males exhibited decreasing theta power with age while females had increasing theta power with age (Ott et al. 2021). Despite the same temporal resolution capabilities for EEG and MEG, MEG has some important advantages for studying developmental differences in resting oscillations. The skull creates several problems for EEG from spatial smearing of brain signals to changes in thickness throughout development impacting signal quality at various ages and between sexes. Assessing resting oscillations in development with MEG may offer novel insights into sex-specific differences in spectral power during childhood and adolescence.
The majority of reliability studies on MEG-derived spontaneous oscillations have examined adults (Colclough et al. 2016; Garces et al. 2016; Martin-Buro et al. 2016; Marquetand et al. 2019; Candelaria-Cook et al. 2020; Candelaria-Cook and Stephen 2020). In healthy adults, MEG spectral power has good reliability in theta, alpha, and beta bands [interclass correlation coefficients (ICCs) >0.6] over a 7-day test–retest interval (Martin-Buro et al. 2016), and excellent reliability in theta-gamma bands (ICCs > 0.86) in global and regional spectral measures over both 1 h and 1 week test–retest intervals (Candelaria-Cook et al. 2020). The reliability of MEG functional connectivity has varied depending on connectivity measure (Garces et al. 2016) with coherence, pairwise phase consistency, and phase-locking value performing best (Candelaria-Cook and Stephen 2020). Similarly, the imaginary part of coherency and weighted phase-lag index showed excellent reliability in alpha frequency, while other frequency bands showed lower reliability levels (Marquetand et al. 2019). To date, there are no studies on the reliability of MEG-derived spontaneous oscillations and resting state in children and adolescents.
The present study was designed to determine the reliability of MEG spectral power in neurodevelopment. Longitudinal MEG resting-state data were collected at 3 timepoints across 2.25 years in 110 typically developing children and adolescents in New Mexico and Nebraska. Each 10-min MEG session included 5 min of eyes open and 5 min of eyes closed resting data. We expected typically developing children to show age-related differences in spectral power, more specifically decreased low frequency power and increased high frequency power with increasing age. This study also compared the reliability of normalized source spectral power within session and across years. To determine reliability, both split-half and test–retest ICCs are quantified and presented. Better characterization of developmental trajectories, along with information on test retest reliability, is necessary for understanding typical and atypical neurodevelopment.
Materials and methods
Participants
The present study included 110 typically developing children and adolescents from the Mind Research Network (MRN) in New Mexico and the University of Nebraska Medical Center (UNMC) in Nebraska, see Table 1 for participant characteristics. Existing MEG resting-state recordings were selected from the larger National Science Foundation funded Developmental Chronnecto-Genomics (DevCoG) study (https://devcog.mrn.org/). The DevCoG study was a multisite, multimodal dataset that tracked brain structure, brain function, cognitive performance, and genetic measures longitudinally in children 9–14 years. Selected data had MEG resting-state recordings from 3 annual visits. If a participant enrolled in the DevCoG study but did not have MEG data from all 3 annual visits, they were not included here. This was done to have a complete dataset with no missing data for statistical tests, specifically between-year ICCs. Over the course of the longitudinal study, a few participants developed an anxiety (4 participants), depression (4 participants), or attention deficit disorder (4 participants) during visits 2 and/or 3. Those subjects were retained in the current dataset. Of those participants, 3 participants were taking medication for depression and/or anxiety, and 2 participants were taking medication for attention deficit hyperactivity disorder (ADHD). In our sample, rates of anxiety were equally distributed between sexes (2 males, 2 females), depression was higher in males (3 males, 1 female), and ADHD was predominately male (4 males). The DevCoG study contains unique information (e.g. MEG) and is separate from the ABCD study. For detailed information on study procedures and participants, see Stephen et al. (2021). Informed consent/assent was obtained from all participants included in this study and their parents. The research protocol and procedures were approved by Advarra Institutional Review Board (MRN site) and the UNMC Institutional Review Board (UNMC site). Study procedures were in accordance with the ethical standards of the institutional research committee and with the 1964 Helsinki Declaration and its later amendments on ethical standards.
Table 1.
Participant characteristics.
| Males | Females | ||
|---|---|---|---|
| Demographics | |||
| Sample size (% total) | 63 (57%) | 47 (43%) | |
| MRN site sample size | 31 | 28 | |
| UNMC site sample size | 32 | 19 | |
| Ethnicity (% Hispanic) | 19.0% | 27.7% | |
| Ethnicity (% non-Hispanic) | 81.0% | 72.3% | |
| Race (% Caucasian) | 92.1% | 84.8% | |
| Race (% African American) | 3.2% | 4.3% | |
| Race (% American Indian) | 3.2% | 10.9% | |
| Race (% Hawaiian) | 1.6% | 0% | |
| Age at visit1 (mean ± SD) | 11.90 ± 1.80 | 11.55 ± 1.70 | |
| Age 9 at visit1 (% total) | 17.5% | 21.3% | |
| Age 10 at visit1 (% total) | 17.5% | 21.3% | |
| Age 11 at visit1 (% total) | 19.0% | 23.4% | |
| Age 12 at visit1 (% total) | 9.5% | 8.5% | |
| Age 13 at visit1 (% total) | 19.0% | 17.0% | |
| Age 14 at visit1 (% total) | 17.5% | 8.5% | |
| SES (mean ± SD) | 46.92 ± 11.21 | 45.54 ± 10.88 | |
| Data quality | (Mean ± SD) | (Mean ± SD) | |
| % Epochs rejected eyes open | 9.43 ± 9.38 | 8.09 ± 9.19 | |
| % Epochs rejected eyes closed* | 11.84 ± 11.6 | 7.35 ± 7.43 | |
| # Split-half epochs eyes open Yr1 | 33.16 ± 5.44 | 34.85 ± 4.31 | |
| # Split-half epochs eyes closed Yr1* | 30.90 ± 7.66 | 34.60 ± 4.31 | |
| # Split-half epochs eyes open Yr2 | 35.62 ± 5.99 | 34.96 ± 6.89 | |
| # Split-half epochs eyes closed Yr2 | 34.83 ± 4.77 | 34.30 ± 5.89 | |
| # Split-half epochs eyes open Yr3 | 36.52 ± 5.22 | 36.64 ± 6.34 | |
| # Split-half epochs eyes closed Yr3 | 34.67 ± 5.63 | 35.81 ± 4.52 | |
* is the readily accepted symbol denoting significance. It does not make sense to change this to lower case `a' given the expectations in the field.
Asterisks represent significant differences between groups (*p < 0.05). All other comparisons (p > 0.05).
MEG data acquisition
Data from MRN and UNMC were collected using a whole-cortex 306-channel MEG system (Elekta MEGIN) located in a magnetically shielded room, as described in Stephen et al. (2021). Both sites had similar data acquisition parameters. Prior to data acquisition, 3-dimensional digitization equipment (Polhemus Fastrack) was used to register the location of 4 head position indicator (HPI) coils placed on the participant’s mastoid bone and upper forehead, the position of the nasion and preauricular points and head shape. At the MRN site, 4 additional electrodes monitored eyeblinks and heartbeats. During the scan, participants sat upright and were monitored by audio and video links in the control room. MEG data were sampled at 1 kHz with an acquisition passband of 0.1–330 Hz. To allow for motion correction, continuous HPI monitoring was enabled.
Data were collected in eyes-open and eyes-closed resting states. Session order (open/closed) was counterbalanced between participants, and maintained for all 3 visits. Each phase of rest was recorded for 5 min with participants instructed to rest quietly. Prior to collecting eyes-open data, a 30-s segment of eyeblink data was collected for modeling eyeblink projectors. During eyes-open resting state, a white fixation cross was present on the center of the screen.
Structural MRI data acquisition and processing
Structural magnetic resonance images (MRIs) were used to map source locations. At the MRN site, sagittal T1-weighted anatomical MR images were obtained using a Siemens 3T TIM Trio with a 32-channel head coil. At the UNMC site, sagittal T1-weighted anatomical MR images were obtained using a Siemens 3T Magnetom Skyra with a 32-channel head coil. The parameters of the structural scan were harmonized across sites: field of view = 256 mm × 256 mm, resolution 1.0 mm × 1.0 mm × 1.0 mm, flip angle = 8°, time echo = 1.9 ms, time repetition = 2,400 ms, 192 slices, orientation = sagittal.
Cortical reconstruction and volumetric segmentation were performed with FreeSurfer 5.3 software; details on the method can be found at (http://surfer.nmr.mgh.harvard.edu/) and (https://surfer.nmr.mgh.harvard.edu/fswiki/FreeSurferMethodsCitation). From each subject’s structural T1 scan, tissue was automatically segmented into gray and white matter and summarized in an aseg atlas morphometry table of volume and intensity statistics. Values were compared without adjustment for total brain volume between sexes. The values used here included total gray (sum of cortex, subcortical gray, and cerebellum gray), subcortical gray (volume of structures including thalamus, caudate, putamen, pallidum, hippocampus, amygdala, accumbens, and substantia nigra), and cortical white matter volume.
MEG data processing
To correct for magnetic noise and head motion, raw MEG data were processed with Neuromag Max-Filter 2.2 software using the temporal extension of signal space separation with movement compensation (Taulu and Kajola 2005; Taulu and Hari 2009), correlation limit 0.95, and buffer length 6 s. Signal space projection (Uusitalo and Ilmoniemi 1997) was used to remove heartbeat and eyeblink artifacts through an automated process using MNE software (Gramfort et al. 2013). For artifact removal, separate EOG and EKG channels were used for MRN site data, whereas selected MEG channels were used for UNMC site data. In instances where the automated artifact projector failed, manual projectors combined with visual inspection were used to remove the artifact. Continuous rest data were segmented into artifact-free 4-s epochs. Individual epochs had the rejection threshold set to 5 picotesla. For split-half analysis, each 5-min rest segment (open/closed) was divided into first-half and second-half components (see Fig. 1).
Fig. 1.

Rest task design. Resting-state data were collected with 5-min eyes closed and 5-min eyes open fixated on a white cross. Split-half reliability determined absolute agreement in MEG spectral power within each year. Test–retest reliability determined consistency in MEG spectral power across 3 annual visits.
Source analysis was performed with MNE software (Gramfort et al. 2013, 2014) using an anatomically constrained linear estimation inverse model, dynamic statistical parametric mapping (dSPM) (Dale et al. 2000). The dSPM inverse model identifies where the estimated current at each cortical surface vertex differed significantly from the baseline noise. FreeSurfer software was used to reconstruct the cortical surface from each participant’s T1-weighted MRI. The spatial subsampling method of a repeatedly subdivided octahedron created 4,098 locations per hemisphere with a source space of 4.9 mm. The forward solution was calculated with a single-layer (inner skull) boundary element model. Other parameters of the model included: a 0.2 loose constraint source orientation, a signal-to-noise ratio of 3, and empty room data as baseline noise.
Power spectral density measures were computed from source based time-courses. Power was extracted from individual epochs using a multi-taper method with discrete prolate spheroidal sequence windows for each frequency band and region. The following frequencies were used to define bands: delta (1–4 Hz), theta (5–8 Hz), alpha (9–13 Hz), beta (14–29 Hz), and gamma (31–58 Hz). Along with frequency-specific information, we also generated broadband (1–58 Hz) data to examine differences in total 1–58 Hz power. The FreeSurfer cortical parcellation DKT atlas (Desikan et al. 2006; Klein and Tourville 2012) was used to define 62 regions. The voxel time series for all voxels within the region were averaged by regional label to create the power spectral density measure. Information from all regional voxels went into the regional average. To normalize power spectral density, power within each individual frequency band was divided by total 1–58 Hz power. This normalization procedure removes individual variation in spectral amplitude and individual offsets for each subject but does not remove between-sex differences. To normalize broadband data, the base 10 log was computed. Global, whole-brain, source data were derived from the average normalized power across all regional labels. Regional power spectral density measures from visits 1, 2, and 3 were used for ICC calculations. All spectral data were exported to MATLAB (2018a, MathWorks) and further analyzed via custom scripts.
Intraclass correlation coefficient
ICCs were calculated with SPSS (version 26 for Macintosh). Different ICC models were used, depending on factors explored. For within-session analyses, a 2-way mixed effects model with absolute agreement and single measurement criteria was used, also known as an ICC (3,1) model. For between-year test–retest analyses, a 2-way mixed-effects model with consistency and single measurement criteria was used. Absolute agreement criteria was selected for within-session split-half analyses as the data were not expected to change within session, while consistency criteria was selected for between-year analyses as the data were expected to change due to neurodevelopment. We defined ICC reliability with the following criteria: >0.75 excellent, 0.75–0.60 good, 0.59–0.40 fair, <0.40 poor, following guidelines by Cicchetti and Sparrow (1981). For test–retest reliability ICCs, 5 min of each resting-state (EC, EO) from 3 sessions (yearly averages) were used in the model. For split-half reliability ICCs, 2.5 min of each resting state (EC, EO) from each year, i.e. first-half and second-half session average, were used in the model (Fig. 1). Eyes-open and eyes-closed data were analyzed separately.
Statistical analysis
Statistics were performed using SPSS, version 26 for Macintosh (IBM). An omnibus repeated measures analysis of variance (RM-ANOVA) was used to evaluate sex-specific differences in global, whole-brain, spectral power with the statistical threshold set at p < 0.05. Greenhouse–Geisser corrections were made to account for violations of sphericity when necessary. For the omnibus RM-ANOVA, sex (male, female) was the between-subject factor and within-subject factors included: frequency (delta, theta, alpha, beta, gamma), resting state (eyes-closed, eyes-open), and visit (visit1, visit2, visit3). There was also a RM-ANOVA conducted on broadband or total 1–58 Hz power with sex as the between-subject factor and within-subject factors of resting-state (eyes-closed, eyes-open) and visit (visit1, visit2, visit3).
Age effects were explored in a separate analysis in order to evaluate age-related change at each visit. A multilevel linear model or linear mixed model (LMM) approach was used to model age-related changes across repeated visits. The LMM approach utilized individual growth trajectories along with group (sex-specific) mean response. Models were run in 2 stages: First, linear first-order polynomial and quadratic second-order polynomial curves tested age-related changes to global, whole-brain, normalized power within each of the 6 frequency bands (delta, theta, alpha, beta, gamma, and broadband). Age was modeled with a random intercept and random slope. Subject was also a random/repeated variable with a diagonal covariance structure. Visit was a repeated variable with a diagonal covariance structure. Males and females were tested separately for age-related changes. Linear models were selected as the best fit when the quadratic model did not offer significant improvement according to the −2 log likelihood criteria. False discovery rate (FDR) correction was used to control for type I error across sex, resting state, and frequency band (24 tests); q < 0.05. Second, interactions between age by sex were tested to determine if different developmental trajectories existed between groups, i.e. whether differences between males and females present at younger or older ages, or whether the differences persist throughout development. All frequency bands and resting states were analyzed for interactions. Similar to previous analysis, age was modeled with a random intercept and random slope. Subject was also a random/repeated variable with a diagonal covariance structure. Males and females were tested together. The age by sex interaction evaluated different linear trends between sex. The age2 by sex interaction evaluated different quadratic linear trends between sex.
For structural MR analysis, LMMs were also run in 2 stages: First, linear first-order polynomial and quadratic second-order polynomial curves tested age-related changes to total gray matter volume, subcortical gray matter volume, and cortical white matter volume. Age was modeled with a random intercept and random slope. Subject was also a random/repeated variable with a diagonal covariance structure. Males and females were tested separately for age-related changes. Second, males and females were tested together to evaluate the age by sex interaction to determine if different developmental trajectories existed between sex. For all LMMs, the fixed effects were used to generate fitted values for graphing purposes. LMM procedures on MEG spectral power included complete datasets from all participants with all 3 timepoints of MEG data. There were a few participants who had all 3 MEG visit data but completed 2 of 3 MRI scans. In those instances, LMM procedures on structural MR analysis used maximum likelihood estimation approach for missing data.
Partial correlations controlling for age were used to examine relationships between MEG spectral power and structural MRI total brain volume. Normalization procedures removing sex differences were not performed on data from either modality. All available paired data (MEG/MRI) from individual visits were included. In instances where MRI data were unavailable from a single visit, the paired MEG data from that visit were also removed from analysis.
Results
Developmental trajectories for global normalized power and participant age
Analysis of whole-brain normalized power, or global normalized power, revealed significant differences in sex. The omnibus RM-ANOVA on delta-gamma frequencies revealed a resting-state and sex interaction, F(1, 106) = 6.129, p = 0.015. Follow-up analyses found that females had higher global normalized power (delta-gamma frequencies combined) than males during an eyes-open resting state, F(1,106) = 4.844, p = 0.030, data not shown. There was also a visit and sex interaction, F(1.986, 210.539) = 3.014, p = 0.05, with follow-up analyses revealing differences between males and females that were greatest during Visit 3, F(1,106) = 7.876, p = 0.006, or when the cohorts were the oldest. All other sex interactions were p > 0.106. There were significant main effects of visit and frequency. Global normalized power (delta-gamma frequencies combined) was different across visit, F(1.986, 210.539) = 14.774, p < 0.001, with a quadratic relationship F(1,106) = 27.175, p < 0.001, indicating the first and last visit had lower global normalized power than the second visit. Global normalized power was different across frequency, F(1.661, 176.084) = 1955.258, p < 0.001, with a linear relationship F(1, 106) = 4303.580, p < 0.001, indicating global normalized power was highest in the delta frequency band and lowest in the gamma frequency band. A RM-ANOVA was also conducted on broadband or total 1–58 Hz power to determine if males and females differed in total 1–58 Hz power prior to normalization procedures. There were no significant differences between males and females in total 1–58 Hz power, all interactions p > 0.189 and main effect of gender p = 0.251. Combined, the results indicate a lack of sex differences in total 1–58 Hz power, but the presence of frequency-specific sex differences. Furthermore, due to the lack of sex differences in total 1–58 Hz power, normalized power measures can be directly interpreted.
Given the frequency-specific sex differences present in the omnibus RM-ANOVA, age-related changes in global normalized power were explored in males and females separately. Broadband (1–58 Hz) data, along with individual frequency bands, were used in LMMs. False discovery rate correction was used to control for type I error across sex, resting state, and frequency band (24 tests); q < 0.05. Linear and quadratic polynomial curves were used to evaluate age-related changes in global normalized power. In males, the first-order linear polynomial curve fit best in all frequency bands tested. During an eyes-closed resting state, males had significant age-related decreases at the whole-brain level in delta (F(1, 119.030) = 19.806, p < 0.001) and theta (F(1, 196.027) = 6.333, p = 0.013) normalized power, while also exhibiting significant age-related increases in beta (F(1, 220.655) = 7.481, p = 0.007) and gamma normalized power (F(1, 256.826) = 17.455, p < 0.001), as shown in Fig. 2. During an eyes-open resting state, males had significant age-related decreases at the whole-brain level in delta normalized power (F(1, 125.064) = 28.993, p < 0.001) while also exhibiting significant age-related increases in beta (F(1, 313.808) = 9.418, p = 0.002) and gamma normalized power (F(1, 134.525) = 13.369, p < 0.001), as shown in Fig. 3. In females, the first-order linear polynomial curves fit best in delta, theta, beta, gamma, and broadband, while a quadratic curve fit best for alpha band. During an eyes-closed resting state, there were no significant age-related changes for females in any frequency band that survived FDR correction. During an eyes-open resting state, females had significant age-related quadratic changes at the whole-brain level in alpha normalized power (F(1, 110.873) = 9.009, p = 0.003) while also exhibiting significant age-related increases in gamma normalized power (F(1, 166.593) = 7.091, p = 0.009), as shown in Fig. 3.
Fig. 2.

Eyes-closed global normalized power. Individual and group mean trajectories with 95% prediction bands for eyes-closed global normalized power by frequency band. Solid line fit indicates significant relationship between power and age. Dashed line fit indicates that the relationship between power and age was not significant. Males had significant linear age-related decreases in delta and theta, while also exhibiting significant age-related linear increases in beta and gamma normalized power. Females had no significant age-related changes in any frequency band. Different developmental trajectories exist between males and females in delta, beta, and gamma normalized power.
Fig. 3.

Eyes-open global normalized power. Individual and group mean trajectories with 95% prediction bands for eyes-open global normalized power by frequency band. Solid line fit indicates significant relationship between power and age. Dashed line fit indicates that the relationship between power and age was not significant. Males had significant linear age-related decreases in delta, while also exhibiting significant age-related linear increases in beta and gamma normalized power. Females had significant quadratic age-related changes in alpha, while also exhibiting significant age-related linear increases in gamma normalized power. Different developmental trajectories exist between males and females in delta and beta normalized power.
To determine if different developmental trajectories existed between males and females, interactions were explored in frequency bands which previously showed linear trends, specifically delta, theta, beta, and gamma in the eyes-closed resting state and delta, alpha, beta, and gamma in the eyes-open resting state. Significant age and sex interactions were present during an eyes-closed resting-state for delta (F(1, 201.060) = 6.586, p = 0.011), beta (F(1, 796.038) = 7.765, p = 0.005), and gamma normalized power (F(1, 310.487) = 4.549, p = 0.034), as shown in Fig. 2. During an eyes-open resting state, significant age and sex interactions were present for delta (F(1, 209.328) = 4.739, p = 0.031) and beta normalized power (F(1, 1463.095) = 4.225, p = 0.040), as shown in Fig. 3. Visualization of individual trajectories in Figs 2 and 3 shows a high degree of heterogeneity within sex.
Structural MRI analysis
MRI-based structural analysis on total gray matter volume, subcortical gray matter volume, and cortical white matter volume from FreeSurfer was compared between males and females with age as a covariate. First, LMMs were used to assess age and sex effects across each of the 3 volumes. For total gray matter volume, in both males and females, quadratic polynomial curves fit age-related change in total gray matter volume best. Males (F(1, 95.072) = 10.903, p = 0.001) and females (F(1, 86.079) = 4.413, p = 0.039) had significant age-related changes in total gray matter volume (Fig. 4). For subcortical gray matter volume, in males, a quadratic polynomial curve fit age-related change best, while a linear polynomial curve fit females’ data best. Males (F(1, 91.021) = 8.913, p = 0.004) had significant age-related change in subcortical gray matter volume. For cortical white matter volume, in males, a quadratic polynomial curve fit age-related change best, while a linear polynomial curve fit females best. Males (F(1, 87.759) = 7.691, p = 0.007) had significant age-related change in cortical white matter volume.
Fig. 4.

Structural MRI by age and sex. Mean volume by age for females and males, along with group average values by sex in A) total gray matter, B) subcortical gray matter, and C) cortical white matter. Group mean shown with 95% confidence bands. Solid line fit indicates significant relationship between volume and age. Dashed line fit indicates that the relationship between volume and age was not significant. Males had significant age-related change in total gray matter, subcortical gray matter, and cortical white matter volume, while females had significant age-related change in total gray matter volume. Different developmental trajectories exist between males and females in total gray matter volume and cortical white matter volume. Males also had significantly more total gray matter volume, subcortical gray matter volume, and cortical white matter volume than females. Asterisks denote p < 0.001.
Next, to determine if different developmental trajectories existed, age-by-sex models were evaluated. For total gray matter volume, the quadratic model fit best. There was a significant age2 by sex interaction (F(1, 181.402) = 7.303, p = 0.001) indicating different developmental trajectories exist and different quadratic linear trends exist between males and females. For subcortical gray matter volume, the linear model fit best. The age by sex interaction was not significant indicating developmental trajectories were similar between males and females. For cortical white matter volume, the quadratic model fit best. There was a significant age2 by sex interaction (F(1, 164.564) = 3.431, p = 0.035) indicating different developmental trajectories and different quadratic linear trends exist between males and females. Males had significantly more total gray matter volume (F(1, 260) = 69.020, p < 0.001), subcortical gray matter volume (F(1, 260) = 29.960, p < 0.001), and cortical white matter volume (F(1, 260) = 42.602, p < 0.001) than females across all ages (Fig. 4).
Structural MRI and MEG correlations
To determine if relationships existed between global normalized power assessed with MEG and gray and white matter volume assessed with MRI, partial correlations controlling for age were used. All available paired data (MEG/MRI) from 3 visits were included in the analysis, with multiple timepoints included for most subjects. The majority of data were from visits 1 and 2. There were 115 female MEG/MRI pairs and 145 male MEG/MRI pairs used. For males, in an eyes-closed resting state, as total gray matter volume increased it was correlated with increased theta and alpha global normalized power, along with decreased beta and gamma global normalized power (Table 2). Similarly, for males in an eyes-open resting state, as total gray matter volume increased, it was correlated with increased theta and alpha global normalized power, along with decreased gamma global normalized power. For females, in both resting states, as total gray matter volume increased, it was correlated with increased alpha global normalized power, along with decreased delta global normalized power (Table 2). Also for females in an eyes-open resting state, as total gray matter volume increased, it was correlated with increased beta global normalized power. For males, in both resting states, as total cortical white matter volume increased, it was correlated with increased theta and alpha global normalized power, along with decreased delta global normalized power. For females, in both resting states, as total cortical white matter volume increased, it was correlated with increased alpha global normalized power, along with decreased delta global normalized power. For males, in both resting states, as subcortical gray matter volume increased, it was correlated with increased alpha global normalized power. For females, in both resting states, as subcortical gray matter volume increased, it was correlated with increased alpha global normalized power, along with decreased delta global normalized power. For females, in an eyes-open resting state, as subcortical gray matter volume increased, it was correlated with increased beta normalized power.
Table 2.
Structural MRI and global normalized power partial correlations.
| Total gray | Subcortical gray | Cortical white | ||||
|---|---|---|---|---|---|---|
| r | p-value | r | P-value | r | p-value | |
| Males | ||||||
| Eyes-closed delta | n.s. | n.s. | −0.049 | 0.006 | ||
| Eyes-closed theta | 0.252 | <0.001 | n.s. | 0.292 | 0.002 | |
| Eyes-closed alpha | 0.416 | <0.001 | 0.405 | <0.001 | 0.418 | <0.001 |
| Eyes-closed beta | −0.103 | 0.021 | n.s. | n.s. | ||
| Eyes-closed gamma | −0.130 | <0.001 | n.s. | n.s. | ||
| Eyes-open delta | n.s. | n.s. | −0.028 | 0.010 | ||
| Eyes-open theta | 0.248 | <0.001 | n.s. | 0.347 | 0.003 | |
| Eyes-open alpha | 0.480 | <0.001 | 0.377 | <0.001 | 0.481 | <0.001 |
| Eyes-open beta | n.s. | n.s | n.s. | |||
| Eyes-open gamma | −0.096 | 0.002 | n.s | n.s. | ||
| Females | ||||||
| Eyes-closed delta | −0.234 | 0.017 | −0.246 | 0.009 | −0.224 | 0.013 |
| Eyes-closed theta | n.s | n.s. | n.s. | |||
| Eyes-closed alpha | 0.323 | <0.001 | 0.292 | 0.002 | 0.390 | <0.001 |
| Eyes-closed beta | n.s. | n.s. | n.s. | |||
| Eyes-closed gamma | n.s. | n.s. | n.s. | |||
| Eyes-open delta | −0.291 | 0.005 | −0.305 | 0.001 | −0.261 | 0.002 |
| Eyes-open theta | n.s. | n.s. | n.s. | |||
| Eyes-open alpha | 0.348 | <0.001 | 0.279 | 0.003 | 0.351 | <0.001 |
| Eyes-open beta | 0.204 | 0.022 | 0.304 | 0.001 | n.s. | |
| Eyes-open gamma | n.s. | n.s. | n.s. | |||
Global normalized power reliability
In the eyes-closed state, ICCs for global normalized power within-session ranged from 0.90–0.97 with the lowest reliability in delta and highest reliability in gamma, while ICCs between years ranged from 0.15–0.65 with the lowest reliability in delta and highest reliability in alpha. In an eyes-open state, ICCs for global normalized power within-session ranged from 0.95–0.98 with lowest reliability in beta and highest reliability in alpha, while ICCs between years from 0.25–0.58 with the lowest reliability in delta and highest reliability in alpha.
Source region split-half reliability
Within-session, spilt-half reliability was examined to compare first-half and second-half session averages. In typically developing children and adolescents, there was excellent split-half reliability during an eyes-closed resting state in all frequency bands and source regions (ICC range = 0.83–0.99) (Fig. 5). During an eyes-closed resting state, split-half reliability ranged from 0.83–0.92 for delta frequency band, 0.92–0.97 for theta frequency band, 0.93–0.97 for alpha frequency band, 0.87–0.96 for beta frequency band, 0.95–0.98 for gamma frequency band, and 0.95–0.99 for broadband data. There was also excellent split-half reliability during an eyes-open resting state in all frequency bands and source regions (ICC range = 0.85–0.99) (Fig. 5). During an eyes-open resting state, split-half reliability ranged from 0.88–0.97 for delta frequency band, 0.93–0.97 for theta frequency band, 0.96–0.99 for alpha frequency band, 0.85–0.96 for beta frequency band, 0.95–0.98 for gamma frequency band, and 0.96–0.99 for broadband data. During both resting states, typically developing children and adolescents had the highest split-half reliability in theta, alpha, and gamma frequency bands, although the differences were subtle since all frequency bands had excellent reliability.
Fig. 5.
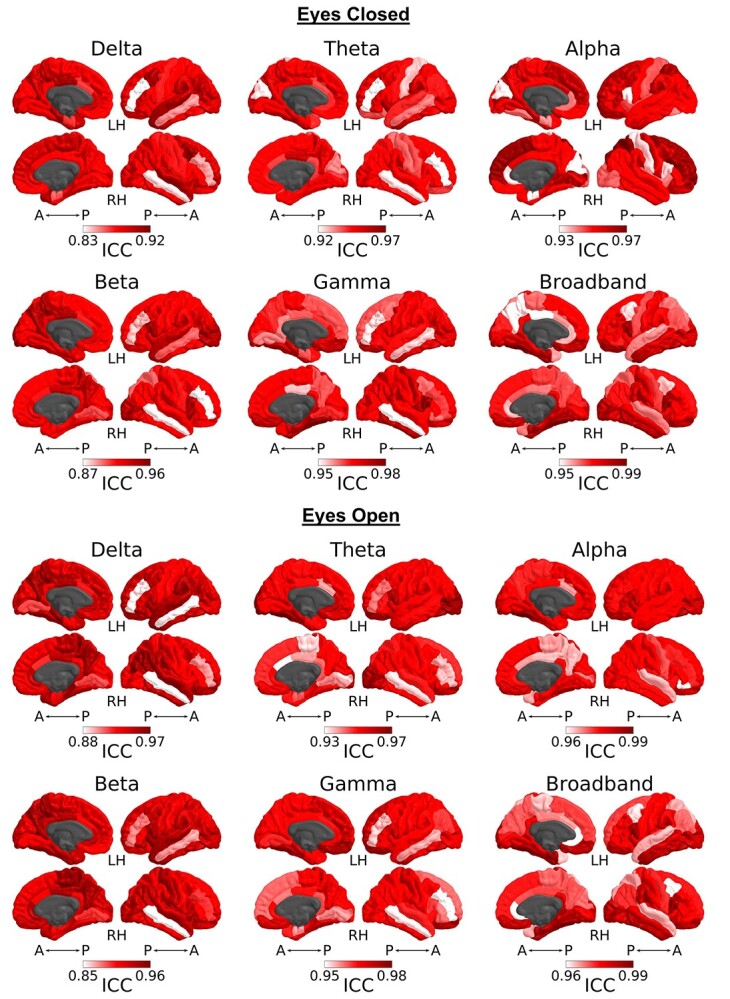
Split-half reliability. ICCs of source space normalized power during the eyes-closed and eyes-open resting state were calculated within-session to compare first-half and second-half session averages. ICC values were calculated for each frequency band and region separately. Within-session ICC values ranged from 0.83 to 0.99 (excellent) across all frequency bands. Individual figures are plotted with frequency-specific data ranges to show slight regional differences. In typically developing children and adolescents, within-session reliability was excellent in all frequency bands and source regions during an eyes-closed state (ICC range = 0.83–0.99) and during an eyes-open state (ICC range = 0.85–0.99).
Source region test–retest reliability
Test–retest reliability was examined across 3 yearly 10-min sessions. During an eyes-closed resting state, between-year reliability ranged from 0.12–0.55 for delta frequency band, 0.39–0.66 for theta frequency band, 0.53–0.75 for alpha frequency band, 0.22–0.56 for beta frequency band, 0.26–0.58 for gamma frequency band, and 0.04–0.59 for broadband data, as shown in Fig. 6. During an eyes-open resting state, between-year reliability ranged from 0.19–0.59 for delta frequency band, 0.39–0.62 for theta frequency band, 0.47–0.65 for alpha frequency band, 0.24–0.52 for beta frequency band, 0.21–0.56 for gamma frequency band, and 0.05–0.62 for broadband data, as shown in Fig. 6. The highest test–retest reliability was found in the alpha (EC ICC average = 0.61, good, EO ICC average = 0.55, fair) and theta (EC ICC average = 0.51, EO ICC average = 0.46, both fair) bands, while the remaining frequency bands averaged poor reliability, as shown in Fig. 6. The region with the highest reliability in all bands was the inferior temporal region. During both eyes-closed and eyes-open resting states, typically developing children and adolescents had the highest 3-year reliability in the alpha frequency band.
Fig. 6.

Test–retest reliability. ICCs of source space normalized power during the eyes-closed and eyes-open resting-state were calculated across 3 yearly 10-min sessions. ICC values were calculated for each frequency band and region separately. Within-session ICC values ranged from 0.04 to 0.75 across all frequency bands. In typically developing children and adolescents, between-year reliability was highest in the alpha frequency band, ICC range = 0.53–0.75 during eyes-closed and ICC range = 0.48–0.65 during eyes-open resting state.
Discussion
Using longitudinal data from 3 annual visits, we have examined developmental patterns in global normalized spectral power, structural MRI gray and white matter volume and correlations between those measures, as well as the reliability of MEG spectral power in a large typically developing cohort from New Mexico and Nebraska. We found sex-specific linear trends in global normalized power. Males had significant age-related decreases in slow-wave power, along with age-related increases in beta and gamma normalized power in both resting states. In contrast, females had fewer significant age-related changes but still exhibited age-related linear increase in gamma normalized power in an eyes-open resting state. The structural MRI analysis revealed that males and females had significant age-related change in total gray matter volume with different developmental trajectories existing between sexes. Males had significantly more total gray matter volume, subcortical gray matter volume, and cortical white matter volume than females. Total gray matter volume, subcortical gray matter volume, and cortical white matter volume had sex-specific and frequency band-specific correlations. We also examined the reliability of normalized source spectral power within session and across years. Within-session split-half reliability was excellent in all frequency bands and source regions (ICC range = 0.83–0.99) during both resting states. Between-year test–retest reliability ranged from good to poor depending on frequency band and source region. The highest test–retest reliability was found in the alpha (ICC average = 0.61, good) and theta (ICC average = 0.49, fair) bands, while the remaining frequency bands averaged poor reliability. Although test–retest reliability was considerably lower than split-half reliability, there were abundant age-related differences in global normalized power and gray and white matter volume, which may be contributing to the lower between-year reliability in development.
Age-dependent change in frequency- dependent global normalized spectral power
Our findings replicate previous relationships between spectral power and age. We found that males had significant age-related decreases in delta and theta power. These findings parallel similar decreases in delta and theta power with increasing age in EEG (Clarke et al. 2001; Whitford et al. 2007; Barry and Clarke 2009; Segalowitz et al. 2010; Cragg et al. 2011; Miskovic et al. 2015), along with decreases in delta power in MEG (Gómez et al. 2013, 2017) and decreases in theta power in MEG (Gómez et al. 2013, 2017; Schäfer et al. 2014; Brookes et al. 2018; Hunt et al. 2019). We also found no significant age-related changes in global normalized alpha power for males in either resting state or for females in the eye-closed resting state. Meanwhile, in the eyes-open resting state, females had age-related quadratic change in alpha power. Previous MEG studies have found no association between alpha band power and age (Schäfer et al. 2014; Solis et al. 2021), while others have found negative correlations in frontal regions (Gómez et al. 2017; Hunt et al. 2019) and region-specific trends such as occipital, parietal, and temporal increases in alpha band power with age (Hunt et al. 2019). In the current study, we did not perform regional analysis and therefore cannot comment on whether alpha band changes are region specific. However, a related study which performed regional analyses also did not find age-related differences in alpha band power in this developmental cohort (Solis et al. 2021). In the higher frequency bands, we also found that males had age-related increases in beta, while males and females had age-related increases in gamma. These findings parallel studies that show increased high frequency power with increasing age in EEG (Clarke et al. 2001; Barry and Clarke 2009; Segalowitz et al. 2010; Cragg et al. 2011) and MEG within beta (Gómez et al. 2013; Schäfer et al. 2014; Hunt et al. 2019) and gamma (Hunt et al. 2019), but specifically low gamma (Schäfer et al. 2014), as the gamma frequency band used in the current study (31–58 Hz) is similar to low gamma used by Schäfer et al. (2014). Also, we found that linear trends best explained the relationships between frequency and age, similar to EEG developmental trends that are largely linear in nature (Barry and Clarke 2009). It should be noted that the previous research mentioned, both EEG and MEG, tracked developmental trajectories of spectral power with cross-sectional data. Using repeated measures across development in the same individuals, as this study does, may elucidate novel trends not seen before. Our source MEG findings were similar to other source MEG analyses (Schäfer et al. 2014; Brookes et al. 2018), but parallel MEG sensor findings as well (Gómez et al. 2013, 2017). Our results are consistent with Gómez et al. (2013) who suggested that these spectral findings can be attributed to 2 physiological processes. Increases in spectral power are consistent with white matter developmental curves (Smit et al. 2012), whereas decreases in slow-wave activity may be attributed to the relationship with gray matter volume (Whitford et al. 2007).
Sex-specific differences
We expected typically developing children to show age-related differences in spectral power, more specifically decreased low frequency power and increased high frequency power with increasing age. However, we expected these trends to occur in both sexes but only found evidence in multiple frequency bands (delta, theta, beta, gamma) in males. Females had fewer significant age-related changes but still exhibited age-related quadratic change in alpha normalized power and age-related linear increase in gamma normalized power in the eyes-open resting state. Sex-specific differences in MEG oscillatory power have been found in caudal brain regions in adults aged 22–75 years. Specifically, in lower frequencies, males had higher power in left caudal region, while in higher frequencies females had higher power in right caudal region (Hoshi and Shigihara 2020). Another MEG study in adults found that the females had higher beta power, alpha frequency, and spectral entropy than males (Zappasodi et al. 2006). In a recent developmental sample (9–15 years) from a single DevCoG site, sex-specific differences in resting-state MEG have been found. Using a region-specific analysis, females had higher delta power in bilateral inferior temporal regions and higher beta power in the right superior parietal region, whereas males had higher alpha power in the left dorsal prefrontal cluster (Ott et al. 2021). Furthermore, males exhibited decreasing theta power with age while females had increasing theta power with age (Ott et al. 2021). The current results which examined sex differences in global normalized power, with all regions summed, cannot be directly compared to the results from the more specific regional analysis; however, here we also found evidence of age-related decreases in theta normalized power in males at the whole-brain level. The presence of sex-specific differences in task-based MEG studies has been observed underlying selective attention (Taylor et al. 2021) and visuospatial processing (Fung et al. 2020; Killanin et al. 2020).
The existence of sex-specific differences in resting oscillations and power in children and adolescents in the EEG literature has conflicting reports, ranging from no differences to evidence suggesting females lag males in the development of electrophysiological correlation of cortico-cortical connections (Clarke et al. 2001; Barry et al. 2004) which disappears by adolescence (Clarke et al. 2001; Cragg et al. 2011). A common sex-specific difference appears in alpha power with males showing more alpha power than females (Barry and Clarke 2009) between ages 10–13 years (Cragg et al. 2011) and 8–12 years (Clarke et al. 2001), along with less theta power (Clarke et al. 2001; Barry and Clarke 2009) and less delta and beta power than females especially in posterior regions (Barry and Clarke 2009). There have also been reports of sex-specific differences in gamma frequency but (Cragg et al. 2011) cautiously noted that myogenic activity may be contributing to the differences between sexes. Also, more advanced pubertal stage predicted reduced alpha power in prefrontal and occipital regions in males but not in females aged 9–17 years (Howsley and Levita 2018). While the EEG results point to some potential sex-specific differences in spectral power, EEG differences should be interpreted with caution, as many differences may be related to skull thickness differences between males and females at this age range.
It is possible that the present study did not detect developmental changes in females because the developmental reductions in gray matter had already slowed down in females (Giedd et al. 1999; Giedd and Rapoport 2010). Longitudinal MR scans of typically developing children and adolescents have shown that gray matter volumes have inverted U-shaped trajectories (Lenroot et al. 2007; Giedd and Rapoport 2010), while white matter volumes generally increase with age (Lenroot et al. 2007). Here we found similar U-shaped trajectories in total gray matter volume to (Lenroot et al. 2007), along with replicating more total gray matter volume and white matter volume in males than females. Although it has been shown that region-specific gray matter volumes typically peak 1–3 years earlier in females than males (Lenroot et al. 2007; Giedd and Rapoport 2010), we did not perform age-specific or region-specific analyses in the current study. We did find that increases in total gray matter volume and subcortical gray matter volume were positively correlated with global normalized alpha power for both males and females. While we found a positive correlation between structural MRI and MEG measures, the relationship should be interpreted cautiously, as both measures can have U-shaped trajectories in development, but a correlation relies heavily on linear relationships. While noninvasive studies cannot definitively determine the factors that cause these developmental changes, this initial analysis examining relationships between structure and function provided additional evidence for strong associations between gray matter volume and normalized oscillatory power.
Spectral power reliability in development
We found excellent split-half reliability in all frequency bands and source regions, while test–retest reliability ranged across good (alpha), fair (theta), and poor (all remaining frequency bands). While short-term reliability may be high, this research suggests that yearly intervals may have lower reliability. This difference between split-half reliability and test–retest reliability is not surprising for neurodevelopmental research where change is expected due to brain maturation. As we have shown here, there were abundant age-related changes in gray and white matter volume, along with age-related differences in global normalized power, both of which may be contributing to the low test–retest reliability values. Occasionally, a low ICC can reflect that a within-subject change occurred, as is the case here, and may not mean that a measure itself is inaccurate. Although our between-year ICC model allowed for slight changes over time by using consistency instead of absolute measurement criteria, it still is not well suited for neurodevelopmental change because the values cannot change much over time and will produce poor ICC values when real change occurs. Along these lines, diverging trajectories could also explain the variation across years in development. It remains possible that children exposed to various adverse childhood experiences which influence white matter microstructure (Poletti et al. 2015) or participant substance use may experience different long-term trajectories than those not exposed.
In adults, MEG-derived spectral power test–retest reliability over 7 days has good reliability in theta, alpha, and beta bands (Martin-Buro et al. 2016) and excellent reliability in theta-gamma bands in global and regional averages (Candelaria-Cook et al. 2020). Although the previous studies did not assess split-half reliability within the same task, 1 hour reliability was also excellent in theta–gamma bands (Candelaria-Cook et al. 2020). Here, our split-half reliability results are in line with previous 1 hour reliability findings. Furthermore, when compared to adults, this developmental sample had lower test–retest reliability of MEG spectral power. To date, there are no developmental studies assessing MEG spectral power reliability in children and adolescents; therefore, the closest comparisons will be drawn from EEG research. Scalp-wide EEG power spectral density profiles in children between 4 and 11 years have been shown to have excellent short-term reliability across 6 days within typically developing controls (ICC = 0.86) and those with autism (ICC = 0.81) (Levin et al. 2020). This reflects the overall stability of the power spectrum over relatively short time windows. Meanwhile, long-term stability of EEG profiles is lower. When alpha power was examined across a 0.6- to 3-year interval, children 3–9 years had fair to excellent reliability and were moderately stable, with ICCs between 0.65–0.86 in the eyes-open condition and 0.52–0.90 in the eyes-closed condition (Vuga et al. 2008). Furthermore, higher ICCs and EEG asymmetry stability values were found in older school-aged children when compared to preschool age children, reflecting brain maturation (Vuga et al. 2008). It has been previously mentioned that due to the high short-term reliability, power spectral density is thought to have a fingerprint-like quality to each individual’s EEG (Levin et al. 2020). While the current study also found excellent short-term reliability of normalized spectral power with MEG, long-term reliability was considerably lower; therefore, a persistent fingerprint-like quality is not attainable in children and adolescents when abundant neurodevelopmental changes occur.
Limitations
The current study has limitations, which need to be addressed. First, the study age range of 9–17 years limits complete understanding of age-related changes in spectral power. Within this age range, the majority of trends revealed were linear; although it remains possible, a broader age range may reveal quadratic patterns in spectral power. Previous MEG research has found that spectral changes across the lifespan follow a quadratic relationship in delta, theta, alpha, high beta, and gamma bands with peaks achieved around the fifth or sixth decade of life (Gómez et al. 2013). Furthermore, later in adulthood, between 22 and 75 years, there is less slow oscillatory power change and fast oscillatory power increases with age in rostral regions and decreases in caudal regions (Hoshi and Shigihara 2020), implying the current age group offers a small window of oscillatory changes over the lifespan. Second, the current study only looked at normalized power, a typical measure for most MEG spectral power analyses. Other measures, such as absolute power and various functional connectivity metrics may reveal different relationships. Relative power reflects increases or decreases as a function of total power. It normalizes the data but can be dependent on changes in other bands. Furthermore, regional analyses may reveal different maturational trends (Gómez et al. 2017). Future studies should investigate other measures. Third, both sites tracked eyeblink and heartbeat artifacts differently, known sources of noise in MEG resting-state data. MRN monitored artifacts with dedicated channels, while UNMC artifacts were identified from frontal MEG channels. We did the best to harmonize data, but the 2 sites did have slightly different data processing pipelines. Lastly, here we have provided information on partial correlations between structural MRI and MEG global normalized power. Correlations rely on linear relationships between variables, but due to the fact that gray and white matter volumes have inverted U-shaped trajectories and spectral power may also have U-shaped or quadratic trajectories, the true relationships between the variables are complicated. As such, we cautiously interpret the findings and invite further multimodal investigation.
Conclusion
Assessing resting oscillations in development with MEG offered novel insights into sex-specific differences in spectral power during childhood and adolescence. Structural MRI analysis also provided evidence of sex-specific differences in gray and white matter volume with different developmental trajectories existing between sexes. Although between-year reliability was lower than within-session reliability, it reflects brain maturation and neurodevelopmental change within participants, which our evidence here shows. Resting-state recordings are practical for large multisite studies, with the current study representing successful multisite example.
Authors’ contribution
FTC-C: Conceptualization, data curation, visualization, formal analysis, writing—original draft. IS: Data collection, project administration, writing—review and editing. MES: Data curation, writing—review and editing. Y-PW and VDC: Funding acquisition, writing—review and editing. TWW: Funding acquisition, methodology, writing—review and editing. JMS: Funding acquisition, conceptualization, methodology, writing—review and editing, supervision.
Acknowledgments
We thank the participants and their parents who graciously offered their time for this study. We also thank Mikki Schantell for assisting with Nebraska site participant demographics.
Contributor Information
Felicha T Candelaria-Cook, The Mind Research Network, a Division of Lovelace Biomedical Research Institute, 1101 Yale Blvd NE, Albuquerque, NM 87106, United States.
Isabel Solis, The Mind Research Network, a Division of Lovelace Biomedical Research Institute, 1101 Yale Blvd NE, Albuquerque, NM 87106, United States; Department of Psychology, University of New Mexico, 1 University of New Mexico, Albuquerque, NM 87131, United States.
Megan E Schendel, The Mind Research Network, a Division of Lovelace Biomedical Research Institute, 1101 Yale Blvd NE, Albuquerque, NM 87106, United States.
Yu-Ping Wang, Department of Biomedical Engineering, Tulane University, 6823 St. Charles Avenue, New Orleans, LA 70118, United States.
Tony W Wilson, Institute for Human Neuroscience, Boys Town National Research Hospital, 14090 Mother Teresa Lane, Boys Town, NE 68010, United States.
Vince D Calhoun, Tri-Institutional Center for Translational Research in Neuroimaging and Data Science (TReNDS), Georgia State University, Georgia Institute of Technology, and Emory University, 55 Park Pl NE, Atlanta, GA 30303, United States.
Julia M Stephen, The Mind Research Network, a Division of Lovelace Biomedical Research Institute, 1101 Yale Blvd NE, Albuquerque, NM 87106, United States.
Funding
This work was supported in part by grants from the National Science Foundation (NSF) (1539067, 2112455) and the National Institutes of Health (P50 AA022534; R01-MH121101; P30GM122734). The funding sources had no role in study design, analysis and interpretation of the data, or the writing of this manuscript.
Conflict of interest statement
The authors declare that the research was conducted in the absence of any commercial or financial relationships that could be construed as a potential conflict of interest.
References
- Barry RJ, Clarke AR. Spontaneous EEG oscillations in children, adolescents, and adults: typical development, and pathological aspects in relation to AD/HD. J Psychophysiol. 2009:23:157–173. [Google Scholar]
- Barry RJ, Clarke AR, McCarthy R, Selikowitz M, Johnstone SJ, Rushby JA. Age and gender effects in EEG coherence: I. developmental trends in normal children. Clin Neurophysiol. 2004:115:2252–2258. [DOI] [PubMed] [Google Scholar]
- Başar E, Başar-Eroglu C, Karakaş S, Schürmann M. Gamma, alpha, delta, and theta oscillations govern cognitive processes. Int J Psychophysiol. 2001:39:241–248. [DOI] [PubMed] [Google Scholar]
- Brookes MJ, Groom MJ, Liuzzi L, Hill RM, Smith HJF, Briley PM, Hall EL, Hunt BAE, Gascoyne LE, Taylor MJ, et al. Altered temporal stability in dynamic neural networks underlies connectivity changes in neurodevelopment. NeuroImage. 2018:174:563–575. [DOI] [PubMed] [Google Scholar]
- Candelaria-Cook FT, Stephen JM. Test-retest reliability of magnetoencephalography resting-state functional connectivity in schizophrenia. Front Psychiatry. 2020, 551952. [DOI] [PMC free article] [PubMed] [Google Scholar]
- Candelaria-Cook FT, Schendel ME, Ojeda CJ, Bustillo JR, Stephen JM. Reduced parietal alpha power and psychotic symptoms: test-retest reliability of resting-state magnetoencephalography in schizophrenia and healthy controls. Schizophr Res. 2020:215:229–240. [DOI] [PMC free article] [PubMed] [Google Scholar]
- Cicchetti D, Sparrow SA. Developing criteria for establishing interrater reliability of specific items: applications to assessment of adaptive behavior. American Journal of mental deficiency. 1981:86:127–37. [PubMed]
- Clarke AR, Barry RJ, McCarthy R, Selikowitz M. Age and sex effects in the EEG: development of the normal child. Clin Neurophysiol. 2001:112:806–814. [DOI] [PubMed] [Google Scholar]
- Colclough GL, Woolrich MW, Tewarie PK, Brookes MJ, Quinn AJ, Smith SM. How reliable are MEG resting-state connectivity metrics? NeuroImage. 2016:138:284–293. [DOI] [PMC free article] [PubMed] [Google Scholar]
- Cragg L, Kovacevic N, McIntosh AR, Poulsen C, Martinu K, Leonard G, Paus T. Maturation of EEG power spectra in early adolescence: a longitudinal study. Dev Sci. 2011:14:935–943. [DOI] [PubMed] [Google Scholar]
- Dale AM, Liu AK, Fischl BR, Buckner RL, Belliveau JW, Lewine JD, Halgren E. Dynamic statistical parametric mapping: combining fMRI and MEG for high-resolution imaging of cortical activity. Neuron. 2000:26:55–67. [DOI] [PubMed] [Google Scholar]
- Desikan RS, Ségonne F, Fischl B, Quinn BT, Dickerson BC, Blacker D, Buckner RL, Dale AM, Maguire RP, Hyman BT, et al. An automated labeling system for subdividing the human cerebral cortex on MRI scans into gyral based regions of interest. NeuroImage. 2006:31:968–980. [DOI] [PubMed] [Google Scholar]
- Fung MH, Taylor BK, Frenzel MR, Eastman JA, Wang YP, Calhoun VD, Stephen JM, Wilson TW. Pubertal testosterone tracks the developmental trajectory of neural oscillatory activity serving visuospatial processing. Cereb Cortex. 2020:30:5960–5971. [DOI] [PMC free article] [PubMed] [Google Scholar]
- Garces P, Martin-Buro MC, Maestu F. Quantifying the test-retest reliability of magnetoencephalography resting-state functional connectivity. Brain Connectivity. 2016:6:448–460. [DOI] [PubMed] [Google Scholar]
- Giedd JN, Rapoport JL. Structural MRI of pediatric brain development: what have we learned and where are we going? Neuron. 2010:67:728–734. [DOI] [PMC free article] [PubMed] [Google Scholar]
- Giedd JN, Blumenthal J, Jeffries NO, Castellanos FX, Liu H, Zijdenbos A, Paus T, Evans AC, Rapoport JL. Brain development during childhood and adolescence: a longitudinal MRI study. Nat Neurosci. 1999:2:861–863. [DOI] [PubMed] [Google Scholar]
- Gómez C, Pérez-Macías JM, Poza J, Fernández A, Hornero R. Spectral changes in spontaneous MEG activity across the lifespan. J Neural Eng. 2013:10:066006. [DOI] [PubMed] [Google Scholar]
- Gómez CM, Rodríguez-Martínez EI, Fernández A, Maestú F, Poza J, Gómez C. Absolute power spectral density changes in the magnetoencephalographic activity during the transition from childhood to adulthood. Brain Topogr. 2017:30:87–97. [DOI] [PubMed] [Google Scholar]
- Gramfort A, Luessi M, Larson E, Engemann D, Strohmeier D, Brodbeck C, Goj R, Jas M, Brooks T, Parkkonen L, et al. MEG and EEG data analysis with MNE-Python. Front Neurosci. 2013:7. [DOI] [PMC free article] [PubMed] [Google Scholar]
- Gramfort A, Luessi M, Larson E, Engemann DA, Strohmeier D, Brodbeck C, Parkkonen L, Hämäläinen MS. MNE software for processing MEG and EEG data. NeuroImage. 2014:86:446–460. [DOI] [PMC free article] [PubMed] [Google Scholar]
- Hoshi H, Shigihara Y. Age- and gender-specific characteristics of the resting-state brain activity: a magnetoencephalography study. Aging (Albany NY). 2020:12:21613–21637. [DOI] [PMC free article] [PubMed] [Google Scholar]
- Howsley P, Levita L. Developmental changes in the cortical sources of spontaneous alpha throughout adolescence. Int J Psychophysiol. 2018:133:91–101. [DOI] [PubMed] [Google Scholar]
- Hunt BAE, Wong SM, Vandewouw MM, Brookes MJ, Dunkley BT, Taylor MJ. Spatial and spectral trajectories in typical neurodevelopment from childhood to middle age. Netw Neurosci. 2019:3:497–520. [DOI] [PMC free article] [PubMed] [Google Scholar]
- Killanin AD, Wiesman AI, Heinrichs-Graham E, Groff BR, Frenzel MR, Eastman JA, Wang YP, Calhoun VD, Stephen JM, Wilson TW. Development and sex modulate visuospatial oscillatory dynamics in typically-developing children and adolescents. NeuroImage. 2020:221:117192. [DOI] [PMC free article] [PubMed] [Google Scholar]
- Klein A, Tourville J. 101 Labeled brain images and a consistent human cortical labeling protocol. Front Neurosci. 2012:6. [DOI] [PMC free article] [PubMed] [Google Scholar]
- Lenroot RK, Gogtay N, Greenstein DK, Wells EM, Wallace GL, Clasen LS, Blumenthal JD, Lerch J, Zijdenbos AP, Evans AC, et al. Sexual dimorphism of brain developmental trajectories during childhood and adolescence. NeuroImage. 2007:36:1065–1073. [DOI] [PMC free article] [PubMed] [Google Scholar]
- Levin AR, Naples AJ, Scheffler AW, Webb SJ, Shic F, Sugar CA, Murias M, Bernier RA, Chawarska K, Dawson G, et al. Day-to-day test-retest reliability of EEG profiles in children with autism spectrum disorder and typical development. Front Integr Neurosci. 2020:14:21. [DOI] [PMC free article] [PubMed] [Google Scholar]
- Marquetand J, Vannoni S, Carboni M, Li Hegner Y, Stier C, Braun C, Focke NK. Reliability of magnetoencephalography and high-density electroencephalography resting-state functional connectivity metrics. Brain Connectivity. 2019:9:539–553. [DOI] [PubMed] [Google Scholar]
- Marshall PJ, Bar-Haim Y, Fox NA. Development of the EEG from 5 months to 4 years of age. Clin Neurophysiol. 2002:113:1199–1208. [DOI] [PubMed] [Google Scholar]
- Martin-Buro MC, Garces P, Maestu F. Test-retest reliability of resting-state magnetoencephalography power in sensor and source space. Hum Brain Mapp. 2016:37:179–190. [DOI] [PMC free article] [PubMed] [Google Scholar]
- Miskovic V, Ma X, Chou CA, Fan M, Owens M, Sayama H, Gibb BE. Developmental changes in spontaneous electrocortical activity and network organization from early to late childhood. NeuroImage. 2015:118:237–247. [DOI] [PMC free article] [PubMed] [Google Scholar]
- Ott LR, Penhale SH, Taylor BK, Lew BJ, Wang YP, Calhoun VD, Stephen JM, Wilson TW. Spontaneous cortical MEG activity undergoes unique age- and sex-related changes during the transition to adolescence. NeuroImage. 2021:244:118552. [DOI] [PMC free article] [PubMed] [Google Scholar]
- Poletti S, Mazza E, Bollettini I, Locatelli C, Cavallaro R, Smeraldi E, Benedetti F. Adverse childhood experiences influence white matter microstructure in patients with schizophrenia. Psychiatry Res. 2015:234:35–43. [DOI] [PubMed] [Google Scholar]
- Schäfer CB, Morgan BR, Ye AX, Taylor MJ, Doesburg SM. Oscillations, networks, and their development: MEG connectivity changes with age. Hum Brain Mapp. 2014:35:5249–5261. [DOI] [PMC free article] [PubMed] [Google Scholar]
- Segalowitz SJ, Santesso DL, Jetha MK. Electrophysiological changes during adolescence: a review. Brain Cogn. 2010:72:86–100. [DOI] [PubMed] [Google Scholar]
- Singer W. Dynamic formation of functional networks by synchronization. Neuron. 2011:69:191–193. [DOI] [PubMed] [Google Scholar]
- Smit DJ, Boersma M, Schnack HG, Micheloyannis S, Boomsma DI, Hulshoff Pol HE, Stam CJ, de Geus EJ. The brain matures with stronger functional connectivity and decreased randomness of its network. PLoS One. 2012:7:e36896. [DOI] [PMC free article] [PubMed] [Google Scholar]
- Solis I, Janowich J, Candelaria-Cook F, Collishaw W, Wang YP, Wilson TW, Calhoun VD, Ciesielski KRT, Stephen JM. Frontoparietal network and neuropsychological measures in typically developing children. Neuropsychologia. 2021:159:107914. [DOI] [PMC free article] [PubMed] [Google Scholar]
- Somsen RJ, Van't Klooster BJ, van der Molen MW, van Leeuwen HM, Licht R. Growth spurts in brain maturation during middle childhood as indexed by EEG power spectra. Biol Psychol. 1997:44:187–209. [DOI] [PubMed] [Google Scholar]
- Stephen JM, Solis I, Janowich J, Stern M, Frenzel MR, Eastman JA, Mills MS, Embury CM, Coolidge NM, Heinrichs-Graham E, et al. The Developmental Chronnecto-Genomics (Dev-CoG) study: a multimodal study on the developing brain. NeuroImage. 2021:225:117438. [DOI] [PMC free article] [PubMed] [Google Scholar]
- Taulu S, Hari R. Removal of magnetoencephalographic artifacts with temporal signal-space separation: demonstration with single-trial auditory-evoked responses. Hum Brain Mapp. 2009:30:1524–1534. [DOI] [PMC free article] [PubMed] [Google Scholar]
- Taulu S, Kajola M. Presentation of electromagnetic multichannel data: the signal space separation method. J Appl Phys. 2005:97. [Google Scholar]
- Taylor BK, Eastman JA, Frenzel MR, Embury CM, Wang YP, Calhoun VD, Stephen JM, Wilson TW. Neural oscillations underlying selective attention follow sexually divergent developmental trajectories during adolescence. Dev Cogn Neurosci. 2021:49:100961. [DOI] [PMC free article] [PubMed] [Google Scholar]
- Uhlhaas PJ, Haenschel C, Nikolić D, Singer W. The role of oscillations and synchrony in cortical networks and their putative relevance for the pathophysiology of schizophrenia. Schizophr Bull. 2008:34:927–943. [DOI] [PMC free article] [PubMed] [Google Scholar]
- Uusitalo MA, Ilmoniemi RJ. Signal-space projection method for separating MEG or EEG into components. Med Biol Eng Comput. 1997:35:135–140. [DOI] [PubMed] [Google Scholar]
- Vuga M, Fox NA, Cohn JF, Kovacs M, George CJ. Long-term stability of electroencephalographic asymmetry and power in 3 to 9 year-old children. Int J Psychophysiol. 2008:67:70–77. [DOI] [PMC free article] [PubMed] [Google Scholar]
- Whitford TJ, Rennie CJ, Grieve SM, Clark CR, Gordon E, Williams LM. Brain maturation in adolescence: concurrent changes in neuroanatomy and neurophysiology. Hum Brain Mapp. 2007:28:228–237. [DOI] [PMC free article] [PubMed] [Google Scholar]
- Zappasodi F, Pasqualetti P, Tombini M, Ercolani M, Pizzella V, Rossini PM, Tecchio F. Hand cortical representation at rest and during activation: gender and age effects in the two hemispheres. Clin Neurophysiol. 2006:117:1518–1528. [DOI] [PubMed] [Google Scholar]