

Abstract
RUNX1 mutations are frequently detected in various myeloid neoplasms and implicate unfavourable clinical outcomes in patients with myelodysplastic syndrome (MDS) and acute myeloid leukaemia (AML). On the other hand, high expression of RUNX1 is also correlated with poor prognosis in AML patients. However, the clinical relevancy of RUNX1 expression in MDS patients remains elusive. This study aimed to investigate the prognostic and biologic impacts of RUNX1 expression in MDS patients. We recruited 341 MDS patients who had sufficient bone marrow samples for next‐generation sequencing. Higher RUNX1 expression occurred more frequently in the patients with Revised International Prognostic Scoring System (IPSS‐R) higher‐risk MDS than the lower‐risk group. It was closely associated with poor‐risk cytogenetics and mutations in ASXL1, NPM1, RUNX1, SRSF2, STAG2, TET2 and TP53. Furthermore, patients with higher RUNX1 expression had significantly shorter leukaemia‐free survival (LFS) and overall survival (OS) than those with lower expression. Subgroups analysis revealed that higher‐RUNX1 group consistently had shorter LFS and OS than the lower‐RUNX1 group, no matter RUNX1 was mutated or not. The same findings were observed in IPSS‐R subgroups. In multivariable analysis, higher RUNX1 expression appeared as an independent adverse risk factor for survival. The prognostic significance of RUNX1 expression was validated in two external public cohorts, GSE 114922 and GSE15061. In summary, we present the characteristics and prognosis of MDS patients with various RUNX1 expressions and propose that RUNX1 expression complement RUNX1 mutation in MDS prognostication, wherein patients with wild RUNX1 but high expression may need more proactive treatment.
Keywords: leukaemic stem cells signature, myelodysplastic syndrome, prognostication, RUNX1 expression, survival
1. INTRODUCTION
Myelodysplastic syndromes (MDSs) represent a heterogeneous group of malignant haematopoietic stem cell (HSC) disorders, with cardinal features of ineffective haematopoiesis, dysplasia of haematopoietic cells, genetic alterations and an inherent propensity of transformation to acute myeloid leukaemia (AML) [1]. The clinical and molecular heterogeneities make these diseases arduous to model and study, highlighting the importance of personalized management [2]. The International Prognostic Scoring System (IPSS) and the revised IPSS (IPSS‐R) have been broadly utilized to risk‐stratify MDS patients and guide treatments [3, 4]. Nonetheless, the prognosis of patients may vary considerably, even within the same risk groups. Therefore, it is crucial to identify novel prognostic biomarkers for better risk classification of patients with MDS.
Besides cytogenetical abnormalities, genetic mutations also correlate with disease phenotypes and clinical outcomes of MDS [5, 6]. For example, mutations in ASXL1, ETV6, EZH2, RUNX1 and TP53 identify patients with poor prognoses within each of the IPSS‐R lower risk categories [5, 7]. In addition, aberrant expression of microRNA, long non‐coding RNA, and BAALC, MN1, and WT1 genes, as well as genes associated with leukaemia stem cell (LSC) character in the bone marrow (BM), predict poorer prognosis [8, 9, 10, 11, 12, 13]. Among the putative mutational targets, RUNX1 is imperative for establishing definitive haematopoiesis and is one of the most commonly mutated genes [14]. MDS patients with mutated RUNX1 had inferior leukaemia‐free survival (LFS) and overall survival (OS) than those without RUNX1 mutations [15, 16, 17, 18].
Interestingly, growing evidence showed that normal RUNX1 also played a critical role during leukemogenesis. Leukemic cells of core‐binding factor AML and certain types of leukaemia with MLL rearrangements require normal RUNX1 to survive [14]. More recently, Wesely et al. delicately demonstrated that the RUNX1 transcription factor is essential for maintaining LSC across various genetic subgroups in AML, implicating RUNX as a potential therapeutic target [19]. Moreover, high expression of RUNX1 has been shown to be intimately associated with poor prognosis in cytogenetically normal AML (CN‐AML) patients [20]. Meanwhile, although MDS is also considered as LSC‐derived myeloid malignancy, the clinical relevancy of RUNX1 expression in MDS patients remains obscure. Thus, this study aimed to investigate the prognostic and biologic impacts of RUNX1 expression in MDS patients.
2. METHODS
2.1. Patients
We recruited 341 patients with primary MDS diagnosed at the National Taiwan University Hospital (NTUH) from 1997 to 2019 who had adequate cryopreserved BM samples for DNA and RNA sequencing at diagnosis. The diagnosis was based on the 2016 World Health Organization classification [21]. For external validation, we collected publicly annotated RNA‐sequencing data from GSE 114922 [22], where gene expression of BM CD34+ haematopoietic stem and progenitor cells and survival data of 77 MDS patients were available; microarray data from GSE 145733 [23], where gene expression profiles were examined in CD34+ BM cells from 54 patients with MDS and 14 patients with AML with myelodysplasia‐related changes (AML‐MRC); and GSE15061, where gene expression and survival data of 110 MDS patients were available [24]. The Research Ethics Committee of the NTUH approved this study (approval number: 201709072RINC), and written informed consent was provided according to the Declaration of Helsinki.
2.2. Cytogenetic study and molecular mutation analysis by targeted next‐generation sequencing (NGS)
Cytogenetic analyses were performed as previously described and interpreted according to the International System for Human Cytogenetic Nomenclature [25, 26]. We employed the TruSight myeloid sequencing panel and the HiSeq platform to analyze gene alterations and mutant allele burden of 54 myeloid‐neoplasm relevant genes (Table S1) as previously described [27] on BM samples of 333 MDS patients. The library preparation and sequencing were following the manufacturer's instructions. The Catalogue Of Somatic Mutations In Cancer database version 86 [28], ClinVar [29], dbSNP database version 151 [30], PolyPhen‐2 (Polymorphism Phenotyping v2) [31], and SIFT [32] were used to evaluate the result of each variant.
2.3. Library preparation and RNA sequencing
We prepared the sequencing library with purified RNA as previously described [33], using the TruSeq Stranded mRNA Library Prep Kit (Illumina, San Diego, CA, USA) and following the manufacturer's recommendations. The detailed methods are described in Supplementary Method 1.
2.4. Bioinformatic analysis and statistical analysis
The normalized signals for RNA sequencing data were analyzed using the pre‐ranked gene set enrichment analysis (GSEA) implemented in the R package clusterProfiler, with gene sets downloaded from the Molecular Signature Database (MSigDB) database. Other statistical methods are detailed in Supplementary Method 2.
3. RESULTS
3.1. Patient characteristics
The patient characteristics are summarized in Table 1. The median age of the 341 MDS patients was 68.3 years. Among the 332 patients who had cytogenetic data at diagnosis, 4.5%, 24.1%, 23.5%, 24.4% and 23.5% had IPSS‐R very‐low risk, low risk, intermediate risk, high risk and very‐high risk MDS, respectively. In total, 48.1% of patients received supportive care only, and 177 received active treatment, including hypomethylating agents, low‐dose cytarabine and AML‐directed intensive chemotherapy at the time of leukemic transformation or as a bridge to allogeneic hematopoeitic stem cell transplantation (allo‐HSCT). Overall, 59 (17.3%) patients received allo‐HSCT. During a median follow‐up duration of 32.9 months (range, 0.2–165.4 months), 117 patients (34%) progressed to AML, and 158 patients succumbed to the disease.
TABLE 1.
Comparison of clinical and laboratory features between patients with lower and higher RUNX1 expression
| Clinical characters | Total (n = 341) | Lower RUNX1 (n = 171) | Higher RUNX1 (n = 170) | p‐Value |
|---|---|---|---|---|
| Sex | 0.737 | |||
| Female | 125 (36.7) | 61 (35.7) | 64 (37.6) | |
| Male | 216 (63.3) | 110 (64.3) | 106 (62.4) | |
| Age a | 68.3 (18.0–94.2) | 65.4 (20.0–94.2) | 69.3 (18.0–93.1) | 0.093 |
| Laboratory data * | ||||
| WBC, X 109 /L | 3.68 (0.31–54.4) | 3.85 (0.49–24.3) | 3.62 (0.31–54.4) | 0.357 |
| ANC, X 109 /L | 1.70 (0.01–3.71) | 1.95 (0.03–19.4) | 1.61 (0.01–3.71) | 0.192 |
| Hb, g/dl | 8.4 (4–17) | 8.3 (4–17) | 8.4 (4–15) | 0.551 |
| Platelet, X 109 /L | 83 (1–721) | 103.5 (3–669) | 72 (1‐721) | 0.035 |
| PB blast (%) | 0 (0–18) | 0 (0–14) | 1 (0–18) | <0.001 |
| BM blast (%) | 6 (0–19) | 2.7 (0–18.6) | 9.2 (0–19.0) | <0.001 |
| 2016 WHO classification | <0.001 | |||
| MDS‐SLD | 35 (10.3) | 30 (17.5) | 5 (2.9) | |
| MDS‐MLD | 50 (14.7) | 33 (19.3) | 17 (10.0) | |
| MDS‐RS | 26 (7.6) | 19 (11.1) | 7 (4.1) | |
| MDS‐RS‐MLD | 24 (7.0) | 19 (11.1) | 5 (2.9) | |
| MDS‐U | 5 (1.5) | 3 (1.8) | 2 (1.2) | |
| MDS‐EB1 | 84 (24.6) | 32 (18.7) | 52 (30.6) | |
| MDS‐EB2 | 117 (34.3) | 35 (20.5) | 82 (48.2) | |
| IPSS‐R † , ‡ | <0.001 | |||
| Very low | 15 (4.5) | 12 (7.3) | 3 (1.8) | |
| Low | 80 (24.1) | 57 (34.5) | 23 (13.8) | |
| Intermediate | 78 (23.5) | 46 (27.9) | 32 (19.2) | |
| High | 81 (24.4) | 29 (17.6) | 52 (31.1) | |
| Very high | 78 (23.5) | 21 (12.7) | 57 (34.1) | |
| Treatment | ||||
| Supportive care | 164 (48.1) | 103 (60.2) | 61 (35.9) | <0.001 |
| Active treatment § | 177 (51.9) | 68 (39.8) | 109 (64.1) | |
| Hypomethylation agents | 134 (39.3) | 49 (28.7) | 85 (50.0) | <0.001 |
| LDAraC ¶ | 30 (8.8) | 8 (4.7) | 22 (12.9) | 0.007 |
| Intensive chemotherapy | 33 (9.7) | 8 (4.7) | 25 (14.7) | 0.002 |
| HSCT | 59 (17.3) | 28 (16.4) | 31 (18.2) | 0.670 |
Note: Statistically significant if p‐value < 0.05.
Abbreviations: ANC, absolute neutrophil count; BM, bone marrow; Hb, hemoglobin; HSCT, allogeneic hematopoietic stem cell transplantation.; IPSS‐R, revised international prognosis scoring system; LDAraC: low‐dose cytarabine; MDS‐EB, MDS with excess blasts; MDS‐MLD, MDS with multilineage dysplasia; MDS‐RS, MDS with ring sideroblasts; MDS‐RS‐MLD, MDS with ring sideroblasts and multilineage dysplasia; MDS‐RS‐SLD, MDS with ring sideroblasts and single lineage dysplasia; MDS‐SLD, MDS with single lineage dysplasia; MDS‐U, MDS, unclassifiable; PB, peripheral blood.
Median (range).
332 patients, including 165 with lower RUNX1 expression and 167 with higher RUNX1 expression, had chromosome data at diagnosis.
IPSS‐R: Very low, ≦1.5; Low, > 1.5‐3; intermediate, > 3‐4.5; High, > 4.5‐6; and Very high, > 6.
Active treatment: HMA, LDAraC, high intensity chemotherapy, and HSCT. Some patients received more than one treatment modality: 14 received HMA and LDAraC, 14 received HMA and high intensity chemotherapy, three received LDAraC and high intensity chemotherapy; four received high intensity chemotherapy and HSCT; 37 received HMA and HSCT; three received HMA, high intensity chemotherapy and HSCT; one received HMA, LDAraC and HSCT; and 14 received HSCT without bridging therapy.
low‐dose cytarabine: at 20 mg once or twice daily for 10 consecutive days every 4–6 weeks.
3.2. Comparison of clinical characteristics and genetic alterations between patients with higher and lower RUNX1 expression
Histograms representing the distribution of RUNX1 expression were plotted in Figure S1A. We first explored the expression of RUNX1 in various IPSS‐R subgroups and found that patients with higher‐risk IPSS‐R had higher expression of RUNX1. Additionally, Pearson's correlation revealed that RUNX1 expression significantly correlated with IPSS‐R subgroups (r = 0.41, p < 0.001, Figure S1B). Specifically, patients with MDS with excess blasts (MDS‐EBs) had substantially higher RUNX1 expression than those with non‐EB MDS (p < 0.001, Figure 1A). The same was true in the GSE 114922 cohort, wherein gene expression of BM CD34+ cells was available (p < 0.001, Figure 1B). More intriguingly, in the GSE 145733 cohort, in which gene expression of CD34+ cells was analysed, RUNX1 expression was significantly correlated with blast counts (r = 0.355, p = 0.003) while patients with AML‐MRC had higher RUNX1 expression than those with either MDS‐EB or non‐EB MDS (p = 0.037, Figure 1C), indicating that RUNX1 might play a role during the acute transformation of MDS. Meanwhile, patients with poor‐risk karyotype had higher RUNX1 expression than those with normal karyotypes and others in the NTUH cohort (p = 0.003, Figure 1D).
FIGURE 1.

Box plot depicting RUNX1 expression in patients with myelodysplastic syndromes (MDS) with or without excess blasts (excess blasts [EBs] and non‐EB, respectively) from the National Taiwan University Hospital (NTUH), GSE 114922 and GSE 145733 cohorts, and in patients with acute myeloid leukaemia with myelodysplasia‐related changes (AML‐MRC) from the GSE 145733 cohort; and patients with various karyotypes in the NTUH cohort. (A) Patients with MDS‐EB had significantly higher RUNX1 expression than those with non‐EB MDS in the NTUH cohort. (B) Patients with MDS‐EB had significantly higher RUNX1 expression than those with non‐EB MDS in the GSE 114922 cohort. (C) Patients with AML‐MRC had significantly higher RUNX1 expression than those with MDS‐EB or non‐EB MDS in the GSE 145733 cohort. (D) Patients with poor‐risk karyotypes had significantly higher RUNX1 expression than those with normal or other karyotypes in the NTUH cohort.
We next examined the difference in RUNX1 expression between patients with wild and mutated RUNX1. Patients with RUNX1 mutations had higher RUNX1 expression than unmutated patients. The expression was remarkably higher in those carrying C‐terminal mutations than others (median, unmutated vs. N‐terminal mutated vs. C‐terminal mutated: 59.6 vs. 81.2 vs. 95.4, p < 0.001), as illustrated in Figure S1C. The mutation details and expression levels of RUNX1 in patients with mutant RUNX1 are displayed in Table S2.
The 341 MDS patients were subsequently divided into the higher‐ and lower‐ RUNX1 expression (higher‐ and lower‐ RUNX1) groups with the median value (62.49 TPM) of the RUNX1 expression as the cut‐off level. The comparison of clinical and laboratory features between the two groups is presented in Table 1. The higher‐RUNX1 group had lower platelet counts (p = 0.035), higher blast percentages in the BM (p < 0.001) and peripheral blood (p < 0.001) at diagnosis compared to the lower‐RUNX1 groups. The higher‐RUNX1 patients more frequently had MDS‐EB, including MDS‐EB1 and MDS‐EB2, but less MDS with single lineage dysplasia (MDS‐SLD), MDS with multilineage dysplasia (MDS‐MLD), MDS with ring sideroblasts and single lineage dysplasia (MDS‐RS‐SLD), and MDS with ring sideroblasts and multilineage dysplasia (MDS‐RS‐MLD) compared to the lower‐RUNX1 group (p < 0.001). Furthermore, the higher‐RUNX1 patients had higher frequencies of IPSS‐R high and very‐high risk MDS but lower frequencies of low and very‐low risk MDS (p < 0.001). Complex karyotypes were more common in the higher‐RUNX1 patients than the lower ones (19.8% vs. 6.7%, p = 0.001, Table S3). There were also more higher‐RUNX1 patients harbouring poor or very poor risk karyotypes per IPSS‐R classification (23.4% vs. 7.3%, p < 0.001).
Regarding molecular gene alterations, 260 (78.1%) of the 333 patients with available data had at least one mutation in the 54 genes analysed. As listed in Table S4, the most common mutation was ASXL1 mutation (24.9%), followed by RUNX1 (16.2%), SF3B1 (14.7%), TET2 (13.8%) and TP53 mutations (12.9%). Higher RUNX1 expression was closely associated with mutations in ASXL1, NPM1, RUNX1, SRSF2, STAG2, TET2, TP53 and ZRSR2 (with respective p values of 0.002, 0.003, <0.001, <0.001, 0.049, 0.011, 0.001 and 0.027, Table S4) whereas lower‐RUNX1 expression, with SF3B1 mutation (p = 0.002).
3.3. The effects of RUNX1 expression on LFS and OS
Parameters including age, sex and those associated with RUNX1 expression (as shown above) were examined consecutively for their potential of confounding with RUNX1 expression (Table S5). By threshold of 10% change in the hazard ratio (HR), IPSS‐R, excess of blasts, poor‐risk karyotypes and TP53 mutation were identified as confounders for OS (HR change, 26.4%, 25.1%, 13.0%, and 11.9%, respectively). As the IPSS‐R score is determined by clinical features that include the excess of blast and poor‐risk karyotypes, we therefore, applied IPSS‐R and TP53 in the subsequent tests for the adjustment of HRs where possible (mutation profile was not available in the validation sets).
We first examined the impact of RUNX1 mutation on survival. Conceivably, patients with mutated RUNX1 had significantly inferior LFS and OS than those with unmutated RUNX1 (adjusted HR [aHR], 1.67, 95% confidence interval [95% CI] 1.15–2.43, p = 0.022 and aHR 1.68, 95% CI 1.14–2.49, p = 0.009, respectively, Figure S2). We next queried the effects of RUNX1 expression on patients’ survival. Patients with higher RUNX1 expression had significantly shorter LFS and OS than those with lower expression (aHR 2.20, 95% CI 1.57–3.11, p < 0.001; and aHR 1.31, 95% CI 1.20–1.44, p < 0.001, respectively, Figure 2A,B). We further incorporated both RUNX1 mutation statuses and RUNX1 expression into risk stratification. The higher‐RUNX1 group consistently had reduced LFS and OS than the lower‐RUNX1 group despite RUNX1 mutation statuses (wild RUNX1, aHR 2.11, 95% CI 1.45–3.06, p < 0.001; and aHR 2.82, 95% CI 1.20–6.61, p = 0.017, respectively, Figure 3A,B; and mutated RUNX1, aHR 2.82, 95% CI 1.20–6.61, p = 0.017; and aHR 3.04, 95% CI 1.24–7.47, p = 0.015, respectively, Figure 3C,D). Moreover, time‐dependent receiver operating characteristic (ROC) curves indicated that RUNX1 expression had better predictive power for LFS and OS than RUNX1 mutation (Figure 4). Subgroups analyses of IPSS‐R risk groups also revealed that higher RUNX1 expression conferred inferior LFS and OS in both IPSS‐R lower‐risk (very low, low and intermediate‐risk) patients (aHR 3.01, 95% CI 1.79–5.05, p < 0.001; and aHR 2.15, 95% CI 1.23–3.78, p = 0.008, respectively, Figure 5A,B) as well as higher‐risk (high and very high risk) patients (aHR 1.85, 95% CI 1.20–2.86, p = 0.006; and aHR 1.55, 95% CI 1.002–2.380, p = 0.049, respectively, Figure 5C,D). Collectively, RUNX1 expression could be complementary to RUNX1 mutation and IPSS‐R to refine the risk stratification of patients with MDS.
FIGURE 2.

Kaplan–Meier survival curves stratified by RUNX1 expression in the total cohort. (A) Leukaemia‐free survival (LFS) and (B) overall survival (OS) of the 341 myelodysplastic syndrome (MDS) patients. Patients with higher RUNX1 expression had inferior LFS and OS than those with lower expression.
FIGURE 3.

Kaplan–Meier survival curves stratified by RUNX1 expression and RUNX1 mutation status in total cohort. (A) Leukaemia‐free survival (LFS) and (B) overall survival (OS) of the 279 myelodysplastic syndrome (MDS) patients with wild RUNX1 and the 54 MDS patients with mutated RUNX1. Patients with higher RUNX1 expression had significantly inferior LFS and OS despite their RUNX1 mutation status.
FIGURE 4.
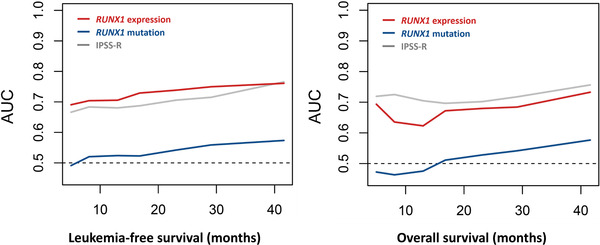
Time‐dependent ROC curve analyses showing that the RUNX1 expression had better predictive power for leukaemia‐free survival (LFS) and overall survival (OS) than RUNX1 mutation. ROC curves were estimated by inverse probability of censoring weighting. AUC, area under the curve
FIGURE 5.

Kaplan–Meier survival curves stratified by RUNX1 expression and Revised International Prognostic Scoring System (IPSS‐R) leukaemia‐free survival (LFS) (A) and overall survival (OS) (B) of the 332 patients in the training cohort who had cytogenetic data at diagnosis (thus IRSS‐R could be calculated). Patients with higher RUNX1 expression had significantly inferior LFS and OS despite their IPSS‐R risk. Patients with higher RUNX1 expression and high IPSS‐R had the worst outcomes while those with lower RUNX1 expression and low IPSS‐R had the best outcomes.
The prognostic implications of RUNX1 expression on LFS and OS were also demonstrated in the subgroups of patients with normal karyotype (n = 185, aHR 2.69, 95% CI 1.59–4.56, p < 0.001; and aHR 2.26, 95% CI 1.29–3.98, p = 0.005, respectively, Figure 3A,B) and patients without unfavourable cytogenetics such as complex karyotypes and monosomy 7 (n = 281, aHR 2.34, 95%CI 1.59–3.44, p < 0.001; and aHR 1.79, 95% CI 1.19–2.71, p = 0.001, respectively, Figure S3C,D). We further analysed the influence of RUNX1 expression on clinical outcomes of MDS patients receiving different treatment regimens. The higher‐RUNX1 patients consistently had inferior LFS and OS (Figure S4), no matter they received supportive care (n = 164, aHR 2.36, 95% CI 1.28–4.38, p = 0.006; and aHR 2.59, 95% CI 1.38–4.89, p = 0.003, respectively) or active treatment (n = 177, aHR 2.06, 95% CI 1.36–3.11, p = 0.001; and aHR 1.62, 95% CI 1.05–2.48, p = 0.028, respectively). Among the 134 patients receiving hypomethylation agents, the differences in LFS and OS between the two groups remained significant (aHR 2.06, 95% CI 1.24–3.40, p = 0.005; and aHR 1.85, 95% CI 1.11–3.09, p = 0.019, respectively, Figure S5). Intriguingly, for the patients receiving allo‐HSCT, the detrimental effect of higher‐RUNX1 expression seemed to be partly alleviated. Among patients with higher‐RUNX1 expression, those who did not received allo‐HSCT had significantly worse LFS and OS than those receiving allo‐HSCT (aHR 2.37, 95% CI 1.39–4.04, p = 0.002; and aHR 2.71, 95% CI 1.55–4.74, p < 0.001, respectively, Figure S6A,B). Additionally, higher‐RUNX1 patients who underwent allo‐HSCT had a comparable OS to lower‐RUNX1 patients with or without HSCT (Figure S6B).
In multivariable analysis, we included age, sex and the confounders IPSS‐R and TP53 mutations in the analysis for LFS and OS. Higher RUNX1 expression, either divided by a median (Table 2) or regarded as continuous values (Table S6), appeared to be an independent adverse prognostic factor for LFS (aHR 2.114, 95% CI 1.506–2.969, p < 0.001 and aHR 1.009, 95% CI 1.005–1.014, p < 0.001, respectively) and OS (aHR 1.721, 95% CI 1.211–2.445, p = 0.002 and aHR 1.007, 95% CI 1.002–1.012, p = 0.004, respectively). By virtue of the association between higher RUNX1 expression and BM blast fractions and poor‐risk karyotypes, respectively, we hypothesized whether the prognostic value of RUNX1 expression levels could simply originate from the other two parameters. Hence, we performed multivariable analysis adopting BM blast percentages, poor‐risk karyotypes and RUNX1 expression as variables. Again, RUNX1 expression remained an independent prognostic factor of LFS and OS, either by dichotomy (aHR 2.032, 95% CI 1.453–2.841, p < 0.001; and aHR 1.591, 95% CI 1.116–2.270, p = 0.010, respectively) or continuous variable (aHR 1.008, 95% CI 1.004–1.012, p < 0.001; and aHR 1.005, 95% CI 1.000–1.010, p = 0.032, respectively).
TABLE 2.
Multivariable analysis for LFS and OS in the 324 MDS patients who had both cytogenetic data and NGS mutation data at diagnosis
| LFS | OS | |||||||
|---|---|---|---|---|---|---|---|---|
| 95% CI | 95% CI | |||||||
| Variable | aHR | Lower | Upper | p‐Value | aHR | Lower | Upper | p‐Value |
| Age* | 1.018 | 1.007 | 1.03 | 0.001 | 1.032 | 1.019 | 1.044 | <0.001 |
| Sex (reference: female) | 1.208 | 0.872 | 1.675 | 0.256 | 1.419 | 0.998 | 2.018 | 0.051 |
| IPSS‐R † | 1.302 | 1.188 | 1.427 | <0.001 | 1.382 | 1.256 | 1.521 | <0.001 |
| TP53 | 2.423 | 1.597 | 3.677 | <0.001 | 4.682 | 3.014 | 7.273 | <0.001 |
| Higher RUNX1 expression ‡ | 2.114 | 1.506 | 2.969 | <0.001 | 1.721 | 1.211 | 2.445 | 0.002 |
Note: Statistically significant if p < 0.05.
Abbreviations: aHR, adjusted hazard ratios; CI, confidence interval, IPSS‐R, Revised International Prognostic Scoring System; LFS, leukaemia‐free survival; MDS, myelodysplastic syndrome; OS, overall survival.
Age, as a continuous variable analysis.
IPSS‐R risk groups: Very good, good, intermediate, poor, very poor.
High versus low RUNX1 expression (median as cutoff).
The prognostic significance of RUNX1 expression was further validated in two external public cohorts, GSE 114922 and GSE15061. Patients were divided into higher‐ and lower‐RUNX1 expression groups with median values as cut‐offs in each dataset (25.1 and 0.54, respectively). The comparisons of clinical and laboratory features between higher‐ and lower‐RUNX1 patients in the two cohorts are displayed in Tables S8 and S9, respectively. Consistently, patients with higher‐RUNX1 expression had worse outcomes than those with lower‐RUNX1 expression in both cohorts (GSE114922, OS, aHR 3.03, 95% CI 1.13–8.15, p = 0.028; and GSE15061, LFS, aHR 1.85, 95% CI 1.08–3.15, p = 0.025; and OS, aHR 1.91, 95% CI 1.09–3.34, p = 0.023, respectively, Figure 6). Sensitivity analysis revealed no significant heterogeneity detected across the training cohort and validation cohorts regarding OS rate at 5 years (p = 0.26, I 2 = 26%).
FIGURE 6.

Kaplan–Meier survival curves of myelodysplastic syndrome (MDS) patients stratified by RUNX1 expression in two independent validation cohorts. (A) Overall survival (OS) of 77 MDS patients in an external validation cohort from GSE 114922; and (B) leukaemia‐free survival (LFS) and (C) OS of 110 MDS patients in an external validation cohort from GSE15061. Patients with higher RUNX1 expression consistently had inferior clinical outcomes. There was no annotated LFS data in GSE 114922.
3.4. Biological implication of higher RUNX1 expression
Following the above observations, we aimed to explore the potential mechanistic insight into how higher RUNX1 expression affects MDS biology and prognosis. GSEA showed that core enriched HSC/leukaemic stem cells (CE‐HSC/LSC) signature and various annotated HSC‐ or LSC‐relevant signatures were significantly enriched in patients with higher RUNX1 expression than their lower RUNX1 expression counter partners (Figure S7), suggesting its role in maintaining and promoting leukaemia growth.
4. DISCUSSION
To the most of our knowledge, this is the first study to investigate the prognostic significance of RUNX1 expression levels in MDS patients. We found that the patients with higher RUNX1 expression showed distinct clinical and biological characteristics and had shorter LFS and OS. Higher RUNX1 expression was an independent poor prognostic factor, irrespective of other risk factors in MDS patients. Furthermore, the prognostic implication of RUNX1 expression remained significant in both IPSS‐R higher‐ and lower‐risk patients as well as RUNX1‐mutated and wild‐type groups.
RUNX1 encodes the DNA binding alpha subunit of the core binding transcription factor, which is a pivotal regulator of definitive haematopoiesis [14]. RUNX1 controls the expression of various target genes involved in haematopoietic differentiation [34, 35]. The roles of RUNX1 in normal haematopoiesis are juxtaposed with high frequencies of RUNX1 mutations and translocations in leukaemia [36, 37]. RUNX1 is involved in recurrent chromosomal translocations, such as t (8;21) (RUNX1‐RUNX1T1) and t (3;21) (EVI1‐RUNX1) in AML [21]. Besides balanced rearrangements, recurrent intragenic mutations have also been identified in AML, MDS and chronic myelomonocytic leukaemia [36, 38, 39]. RUNX1 somatic mutations are detected in roughly 15% of adult patients with de novo AML [36]. They are closely associated with older age, male gender and inferior prognosis compared to AML patients without RUNX1 mutations. In MDS, somatic mutations in RUNX1 occurs in approximately 10% of patients. These patients had a higher propensity and shorter latency for progression to AML than patients with wild RUNX1 [40].
Although RUNX1 is generally considered to be a tumour suppressor, accumulated evidence reveals it plays a central role in leukemogenesis and can act as an oncogene as well [14, 41]. Wild‐type RUNX1 is required for the development of CBF‐AML, including t (8;21)/RUNX1‐RUNX1T1 and inv [16]/CBFB‐MYH11 leukaemia, which suggests a delicate balance between wild RUNX1 and RUNX1‐fusion protein contributes to leukaemia cell survival [14]. RUNX1 is also indispensable for MLL‐fusion leukaemia [42, 43]. Moreover, AML harbouring FLT3‐ITD has higher levels of RUNX1 [44, 45]. In such a context, upregulated RUNX1 cooperates with FLT3‐ITD to induce leukaemia. From a clinical aspect of view, Morita et al. analysed the OS of AML patients from TCGA clinical datasets (n = 187) [46]. Patients were divided into tripartitions according to their RUNX1 expressions. RUNX1 intermediately expressing AML patients displayed the worst OS, whereas those with low RUNX1 expressions exhibited the most favourable prognosis. Concomitantly, another recent study revealed that among patients with CN‐AML, higher RUNX1 expressions were associated with significantly worse OS in two independent cohorts [20]. Recently, Wesely and his colleagues demonstrated the essential role of RUNX1 in LSCs [19]. They found that reducing the RUNX1 protein by approximately 50% in the LSCs markedly abrogated their ability to engraft while RUNX1 knockdown abolished bulk cell survival and colony formation in primary human AML samples across diverse genetic groups. The authors therefore proposed that RUNX1 may be a therapeutic target in LSC elimination. In accordance with the findings, knocking down RUNX1 inhibited leukaemia cells growth in both human CD34+ cells transduced with MLL‐AF9 and the MLL‐AF9 mouse model [42]. Mill et al. conducted similar studies in RUNX1 mutant AML and found that Knockdown of RUNX1 inhibited in vitro and in vivo growth of AML and prolonged survival of mice engrafted with mutant RUNX1‐expressing AML [47]. Literature discussing the role of RUNX1 expression in MDS has been scarce. Herein, we demonstrated that higher RUNX1 expression significantly predicted poor prognosis in MDS patients through multiple layers of analysis, thereby paving the way for targeting RUNX1 in the treatment of MDS patients with higher RUNX1 expression.
In this study, higher RUNX1 expression was shown closely associated with high‐risk characteristics, including excess blasts, poor‐risk karyotypes, higher‐risk IPSS‐R and gene mutations in ASXL1, RUNX1 and TP53. Meanwhile, the multivariable analysis revealed higher RUNX1 expression was an independent poor‐risk factor for LFS and OS. Further, higher RUNX1 expression could predict shorter LFS and OS in both IPSS‐R higher‐ and lower‐risk patients, as well as RUNX1‐mutated and unmutated patients. Collectively, RUNX1 expression may help identify patients who need more active treatment but are categorized in the low‐risk group by the current risk‐stratification system. For instance, allo‐HSCT could overcome the adverse effect of high RUNX1 expression in our MDS cohort, suggesting that patients with higher RUNX1 expression receive allo‐HSCT if eligible.
Notably, in our analysis, higher‐RUNX1 patients could attain a better clinical outcome if they received HSCT. However, the immortal time bias in the retrospective cohort might lead to a biased association. Furthermore, the decision to proceed and the timing of HSCT also varied due to a multitude of reasons, including but not limited to disease stages, availabilities of suitable donors and comorbidities, hence introducing deeper heterogeneity. While a sounder analysis with time‐dependent covariates may help mitigate bias, prospective investigations are required to make a more precise estimate of the impact of HSCT in patients with high RUNX1 expression.
Bioinformatics analysis showed a close association of higher RUNX1 expression with CE HSC/LSC signature and various annotated HSC‐ or LSC‐relevant signatures. In the study to establish a LSC score in MDS patients, we previously identified RUNX1, ASXL1 and TP53 mutations correlated with robust LSC character in MDS while SF3B1 mutation, the opposite [11]. The present study showed that RUNX1, ASXL1 or TP53 mutations were closely associated with higher RUNX1 expression while SF3B1 mutations, on the contrary, with lower RUNX1 expression. From these findings, it is suggested that RUNX1 is indispensable for LSC maintenance. Meanwhile, the casual relationship between RUNX1 expression and disease progression, as well as the dynamics and physiologic implications of RUNX1 expression in the BM, awaits further investigation.
In summary, the investigations herein provide evidence that RUNX1 expression can be prognostic for LFS and OS in patients with MDS, corresponding to that in patients with AML. The prognostic relevance remained valid across IPSS‐R subgroups, among patients with different RUNX1 mutation statuses, and in two external independent cohorts. Higher expression of RUNX1 was also confirmed prognostically detrimental in the multivariable analysis. In connection to the above, experimental studies will be needed to foster our understanding of the regulation of RUNX1 in the heterogeneous cellular contexts of MDS and ultimately deliver patient‐tailored therapeutic avenues.
CONFLICT OF INTEREST
The authors declare that they have no competing interests.
ETHIC STATEMENT
The Research Ethics Committee of the NTUH approved this study (approval number: 201709072RINC), and written informed consent was provided according to the Declaration of Helsinki.
AUTHOR CONTRIBUTIONS
YHW was responsible for data collection and management, statistical analysis, interpretation, visualization, literature research and manuscript writing. CLC, CYY and CLH assisted in statistical analysis. CHT, HAH and WCC were responsible for data collection and management. CCL and HFT conceived and coordinated the study and revised the manuscript.
Supporting information
Supporting Information
ACKNOWLEDGEMENTS
The authors want to thank Professor Ken Mills for providing the survival data as validation. They would also like to acknowledge the service provided by Department of Laboratory Medicine, Department of Medical Research, and Division of Hematology, Department of Internal Medicine, National Taiwan University Hospital. The work was supported by grants from Ministry of Science and Technology, Taiwan, project number: MOST 109‐2314‐B‐002‐221, 109‐2314‐B‐002‐222; and Taiwan Ministry of Health and Welfare, project number: MOHW109‐TDU‐B‐211‐134009.
Wang Y‐H, Yao C‐Y, Lin C‐C, Chen C‐L, Hsu C‐L, Tsai C‐H, et al. Higher RUNX1 expression levels are associated with worse overall and leukaemia‐free survival in myelodysplastic syndrome patients. eJHaem. 2022;3:1209–1219. 10.1002/jha2.547
Contributor Information
Chien‐Chin Lin, Email: lincc@ntu.edu.tw.
Hwei‐Fang Tien, Email: hftien@ntu.edu.tw.
DATA AVAILABILITY STATEMENT
The data reported in this article can be accessed through reasonable requests from the corresponding authors.
REFERENCES
- 1. Cazzola M. Myelodysplastic syndromes. N Engl J Med. 2020;383(14):1358–74. [DOI] [PubMed] [Google Scholar]
- 2. Lindsley RC. Uncoding the genetic heterogeneity of myelodysplastic syndrome. Hematology Am Soc Hematol Educ Program. 2017;2017(1):447–52. [DOI] [PMC free article] [PubMed] [Google Scholar]
- 3. Greenberg P, Cox C, LeBeau MM, Fenaux P, Morel P, Sanz G, et al. International scoring system for evaluating prognosis in myelodysplastic syndromes. Blood. 1997;89(6):2079–88. [PubMed] [Google Scholar]
- 4. Greenberg PL, Tuechler H, Schanz J, Sanz G, Garcia‐Manero G, Solé F, et al. Revised international prognostic scoring system for myelodysplastic syndromes. Blood. 2012;120(12):2454–65. [DOI] [PMC free article] [PubMed] [Google Scholar]
- 5. Kennedy JA, Ebert BL. Clinical implications of genetic mutations in myelodysplastic syndrome. J Clin Oncol. 2017;35(9):968–74. [DOI] [PMC free article] [PubMed] [Google Scholar]
- 6. Papaemmanuil E, Gerstung M, Bullinger L, Gaidzik VI, Paschka P, Roberts ND, et al. Genomic classification and prognosis in acute myeloid leukaemia. N Engl J Med. 2016;374(23):2209–21. [DOI] [PMC free article] [PubMed] [Google Scholar]
- 7. Bernard E, Nannya Y, Hasserjian RP, Devlin SM, Tuechler H, Medina‐Martinez JS, et al. Implications of TP53 allelic state for genome stability, clinical presentation and outcomes in myelodysplastic syndromes. Nat Med. 2020;26(10):1549–56. [DOI] [PMC free article] [PubMed] [Google Scholar]
- 8. Hung S‐Y, Lin C‐C, Hsu C‐L, Yao C‐Y, Wang Y‐H, Tsai C‐H, et al. The expression levels of long non‐coding RNA KIAA0125 are associated with distinct clinical and biological features in myelodysplastic syndromes. Br J Haematol. 2021;192(3):589–98. [DOI] [PubMed] [Google Scholar]
- 9. Minetto P, Guolo F, Clavio M, De Astis E, Colombo N, Grasso R, et al. Combined assessment of WT1 and BAALC gene expression at diagnosis may improve leukaemia‐free survival prediction in patients with myelodysplastic syndromes. Leuk Res. 2015;39(8):866–73. [DOI] [PubMed] [Google Scholar]
- 10. Thol F, Yun H, Sonntag AK, Damm F, Weissinger EM, Krauter J, et al. Prognostic significance of combined MN1, ERG, BAALC, and EVI1(MEBE) expression in patients with myelodysplastic syndromes. Ann Hematol. 2012;91(8):1221–33. [DOI] [PubMed] [Google Scholar]
- 11. Wang YH, Lin CC, Yao CY, Hsu CL, Hou HA, Tsai CH, et al. A 4‐gene leukemic stem cell score can independently predict the prognosis of myelodysplastic syndrome patients. Blood Adv. 2020;4(4):644–54. [DOI] [PMC free article] [PubMed] [Google Scholar]
- 12. Sokol L, Caceres G, Volinia S, Alder H, Nuovo GJ, Liu CG, et al. Identification of a risk dependent microRNA expression signature in myelodysplastic syndromes. Br J Haematol. 2011;153(1):24–32. [DOI] [PMC free article] [PubMed] [Google Scholar]
- 13. Pellagatti A, Benner A, Mills KI, Cazzola M, Giagounidis A, Perry J, et al. Identification of gene expression‐based prognostic markers in the haematopoietic stem cells of patients with myelodysplastic syndromes. J Clin Oncol. 2013;31(28):3557–64. [DOI] [PubMed] [Google Scholar]
- 14. Sood R, Kamikubo Y, Liu P. Role of RUNX1 in hematological malignancies. Blood. 2017;129(15):2070–82. [DOI] [PMC free article] [PubMed] [Google Scholar]
- 15. Chen CY, Lin LI, Tang JL, Ko BS, Tsay W, Chou WC, et al. RUNX1 gene mutation in primary myelodysplastic syndrome–the mutation can be detected early at diagnosis or acquired during disease progression and is associated with poor outcome. Br J Haematol. 2007;139(3):405–14. [DOI] [PubMed] [Google Scholar]
- 16. Tefferi A, Lasho TL, Patnaik MM, Saeed L, Mudireddy M, Idossa D, et al. Targeted next‐generation sequencing in myelodysplastic syndromes and prognostic interaction between mutations and IPSS‐R. Am J Hematol. 2017;92(12):1311–7. [DOI] [PubMed] [Google Scholar]
- 17. Gangat N, Mudireddy M, Lasho TL, Finke CM, Nicolosi M, Szuber N, et al. Mutations and prognosis in myelodysplastic syndromes: karyotype‐adjusted analysis of targeted sequencing in 300 consecutive cases and development of a genetic risk model. Am J Hematol. 2018;93(5):691–7. [DOI] [PubMed] [Google Scholar]
- 18. Della Porta MG, Gallì A, Bacigalupo A, Zibellini S, Bernardi M, Rizzo E, et al. Clinical effects of driver somatic mutations on the outcomes of patients with myelodysplastic syndromes treated with allogeneic haematopoietic stem‐cell transplantation. J Clin Oncol. 2016;34(30):3627–37. [DOI] [PMC free article] [PubMed] [Google Scholar]
- 19. Wesely J, Kotini AG, Izzo F, Luo H, Yuan H, Sun J, et al. Acute myeloid leukaemia iPSCs reveal a role for RUNX1 in the maintenance of human leukaemia stem cells. Cell Rep. 2020;31(9):107688. [DOI] [PMC free article] [PubMed] [Google Scholar]
- 20. Fu L, Fu H, Tian L, Xu K, Hu K, Wang J, et al. High expression of RUNX1 is associated with poorer outcomes in cytogenetically normal acute myeloid leukaemia. Oncotarget. 2016;7(13):15828–39. [DOI] [PMC free article] [PubMed] [Google Scholar]
- 21. Arber DA, Orazi A, Hasserjian R, Thiele J, Borowitz MJ, Le Beau MM, et al. The 2016 revision to the World Health Organization classification of myeloid neoplasms and acute leukaemia. Blood. 2016;127(20):2391–405. [DOI] [PubMed] [Google Scholar]
- 22. Pellagatti A, Armstrong RN, Steeples V, Sharma E, Repapi E, Singh S, et al. Impact of spliceosome mutations on RNA splicing in myelodysplasia: dysregulated genes/pathways and clinical associations. Blood. 2018;132(12):1225–40. [DOI] [PMC free article] [PubMed] [Google Scholar]
- 23. Szikszai K, Krejcik Z, Klema J, Loudova N, Hrustincova A, Belickova M, et al. LncRNA profiling reveals that the deregulation of H19, WT1‐AS, TCL6, and LEF1‐AS1 is associated with higher‐risk myelodysplastic syndrome. Cancers (Basel). 2020;12(10):2726. [DOI] [PMC free article] [PubMed] [Google Scholar]
- 24. Mills KI, Kohlmann A, Williams PM, Wieczorek L, Liu WM, Li R, et al. Microarray‐based classifiers and prognosis models identify subgroups with distinct clinical outcomes and high risk of AML transformation of myelodysplastic syndrome. Blood. 2009;114(5):1063–72. [DOI] [PubMed] [Google Scholar]
- 25. Simons A, Shaffer LG, Hastings RJ. Cytogenetic nomenclature: changes in the ISCN 2013 compared to the 2009 edition. Cytogenet Genome Res. 2013;141(1):1–6. [DOI] [PubMed] [Google Scholar]
- 26. Chou WC, Chou SC, Liu CY, Chen CY, Hou HA, Kuo YY, et al. TET2 mutation is an unfavorable prognostic factor in acute myeloid leukaemia patients with intermediate‐risk cytogenetics. Blood. 2011;118(14):3803–10. [DOI] [PubMed] [Google Scholar]
- 27. Tsai C‐H, Hou H‐A, Tang J‐L, Kuo Y‐Y, Chiu Y‐C, Lin C‐C, et al. Prognostic impacts and dynamic changes of cohesin complex gene mutations in de novo acute myeloid leukaemia. Blood Cancer J. 2017;7(12):663. [DOI] [PMC free article] [PubMed] [Google Scholar]
- 28. Forbes SA, Beare D, Gunasekaran P, Leung K, Bindal N, Boutselakis H, et al. COSMIC: exploring the world's knowledge of somatic mutations in human cancer. Nucleic Acids Res. 2015;43:D805–11. [DOI] [PMC free article] [PubMed] [Google Scholar]
- 29. Landrum MJ, Lee JM, Riley GR, Jang W, Rubinstein WS, Church DM, et al. ClinVar: public archive of relationships among sequence variation and human phenotype. Nucleic Acids Res. 2014;42:D980–5. [DOI] [PMC free article] [PubMed] [Google Scholar]
- 30. Sherry ST, Ward MH, Kholodov M, Baker J, Phan L, Smigielski EM, et al. dbSNP: the NCBI database of genetic variation. Nucleic Acids Res. 2001;29(1):308–11. [DOI] [PMC free article] [PubMed] [Google Scholar]
- 31. Adzhubei I, Jordan DM, Sunyaev SR. Predicting functional effect of human missense mutations using PolyPhen‐2. Curr Protoc Hum Genet. 2013. 10.1002/0471142905.hg0720s76 [DOI] [PMC free article] [PubMed] [Google Scholar]
- 32. Ng PC, Henikoff S. SIFT: predicting amino acid changes that affect protein function. Nucleic Acids Res. 2003;31(13):3812–4. [DOI] [PMC free article] [PubMed] [Google Scholar]
- 33. Wang Y‐H, Hou H‐A, Lin C‐C, Kuo Y‐Y, Yao C‐Y, Hsu C‐L, et al. A CIBERSORTx‐based immune cell scoring system could independently predict the prognosis of patients with myelodysplastic syndromes. Blood Adv. 2021;5(22):4535–48. [DOI] [PMC free article] [PubMed] [Google Scholar]
- 34. Chuang LS, Ito K, Ito Y. RUNX family: regulation and diversification of roles through interacting proteins. Int J Cancer. 2013;132(6):1260–71. [DOI] [PubMed] [Google Scholar]
- 35. Cai X, Gao L, Teng L, Ge J, Oo ZM, Kumar AR, et al. Runx1 deficiency decreases ribosome biogenesis and confers stress resistance to haematopoietic stem and progenitor cells. Cell Stem Cell. 2015;17(2):165–77. [DOI] [PMC free article] [PubMed] [Google Scholar]
- 36. Mendler JH, Maharry K, Radmacher MD, Mrózek K, Becker H, Metzeler KH, et al. RUNX1 mutations are associated with poor outcome in younger and older patients with cytogenetically normal acute myeloid leukaemia and with distinct gene and MicroRNA expression signatures. J Clin Oncol. 2012;30(25):3109–18. [DOI] [PMC free article] [PubMed] [Google Scholar]
- 37. Lam K, Zhang DE. RUNX1 and RUNX1‐ETO: roles in hematopoiesis and leukemogenesis. Front Biosci (Landmark Ed). 2012;17:1120–39. [DOI] [PMC free article] [PubMed] [Google Scholar]
- 38. Haferlach T, Nagata Y, Grossmann V, Okuno Y, Bacher U, Nagae G, et al. Landscape of genetic lesions in 944 patients with myelodysplastic syndromes. Leukaemia. 2014;28(2):241–7. [DOI] [PMC free article] [PubMed] [Google Scholar]
- 39. Kuo MC, Liang DC, Huang CF, Shih YS, Wu JH, Lin TL, et al. RUNX1 mutations are frequent in chronic myelomonocytic leukaemia and mutations at the C‐terminal region might predict acute myeloid leukaemia transformation. Leukaemia. 2009;23(8):1426–31. [DOI] [PubMed] [Google Scholar]
- 40. Tsai SC, Shih LY, Liang ST, Huang YJ, Kuo MC, Huang CF, et al. Biological activities of RUNX1 mutants predict secondary acute leukaemia transformation from chronic myelomonocytic leukaemia and myelodysplastic syndromes. Clin Cancer Res. 2015;21(15):3541–51. [DOI] [PubMed] [Google Scholar]
- 41. Morita K, Suzuki K, Maeda S, Matsuo A, Mitsuda Y, Tokushige C, et al. Genetic regulation of the RUNX transcription factor family has antitumor effects. J Clin Invest. 2017;127(7):2815–28. [DOI] [PMC free article] [PubMed] [Google Scholar]
- 42. Goyama S, Schibler J, Cunningham L, Zhang Y, Rao Y, Nishimoto N, et al. Transcription factor RUNX1 promotes survival of acute myeloid leukaemia cells. J Clin Invest. 2013;123(9):3876–88. [DOI] [PMC free article] [PubMed] [Google Scholar]
- 43. Wilkinson AC, Ballabio E, Geng H, North P, Tapia M, Kerry J, et al. RUNX1 is a key target in t (4;11) leukaemias that contributes to gene activation through an AF4‐MLL complex interaction. Cell Rep. 2013;3(1):116–27. [DOI] [PMC free article] [PubMed] [Google Scholar]
- 44. Salarpour F, Goudarzipour K, Mohammadi MH, Ahmadzadeh A, Faraahi S, Farsani MA. Evaluation of CCAAT/enhancer binding protein (C/EBP) alpha (CEBPA) and runt‐related transcription factor 1 (RUNX1) expression in patients with de novo acute myeloid leukaemia. Ann Hum Genet. 2017;81(6):276–83. [DOI] [PubMed] [Google Scholar]
- 45. Behrens K, Maul K, Tekin N, Kriebitzsch N, Indenbirken D, Prassolov V, et al. RUNX1 cooperates with FLT3‐ITD to induce leukaemia. J Exp Med. 2017;214(3):737–52. [DOI] [PMC free article] [PubMed] [Google Scholar]
- 46. Morita K, Maeda S, Suzuki K, Kiyose H, Taniguchi J, Liu PP, et al. Paradoxical enhancement of leukemogenesis in acute myeloid leukaemia with moderately attenuated RUNX1 expressions. Blood Adv. 2017;1(18):1440–51. [DOI] [PMC free article] [PubMed] [Google Scholar]
- 47. Mill CP, Fiskus W, DiNardo CD, Qian Y, Raina K, Rajapakshe K, et al. RUNX1‐targeted therapy for AML expressing somatic or germline mutation in RUNX1. Blood. 2019;134(1):59–73. [DOI] [PMC free article] [PubMed] [Google Scholar]
Associated Data
This section collects any data citations, data availability statements, or supplementary materials included in this article.
Supplementary Materials
Supporting Information
Data Availability Statement
The data reported in this article can be accessed through reasonable requests from the corresponding authors.