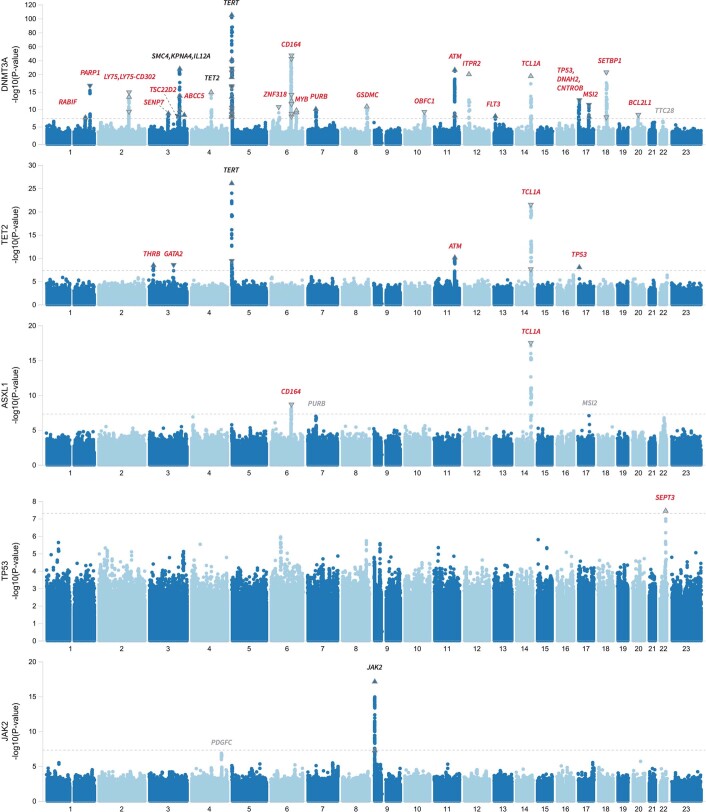
Extended Data Fig. 5. GWAS of CHIP Subtypes.
Manhattan plot showing results from a genome-wide association analysis of CHIP subtypes. While we ran CHIP subtype analysis for each of the 8 most recurrently mutated CHIP genes (Tables S11–S19), we show Manhattan plots for the 5 CHIP subtypes that had at least 1 genome-wide significant common variant association. These included DNMT3A-CHIP (23 significant loci), TET2-CHIP (6 significant loci), ASXL1-CHIP (2 significant loci), TP53-CHIP (1 significant locus), and JAK2-CHIP (1 significant locus). Novel biologically relevant genes are labeled at each locus, with red denoting novel loci, black identifying previously identified loci and grey identifying loci with suggestive signal (P < 5 x 10⁻⁷). Association models were run with age, age2, sex, and age-by-sex, and 10 ancestry-informative principal components (PCs) as covariates. P-values are uncorrected and are from two-sided tests performed using approximate Firth logistic regression.

