Abstract
Background
Idiopathic pulmonary fibrosis (IPF) is a temporally and spatially heterogeneous lung disease. Identifying whether IPF in a patient is progressive or stable is crucial for treatment regimens.
Purpose
To assess the role of hyperpolarized (HP) xenon 129 (129Xe) MRI measures of ventilation and gas transfer in IPF generally and as an early signature of future IPF progression.
Materials and Methods
In a prospective study, healthy volunteers and participants with IPF were consecutively recruited between December 2015 and August 2019 and underwent baseline HP 129Xe MRI and chest CT. Participants with IPF were followed up with forced vital capacity percent predicted (FVC%p), diffusing capacity of the lungs for carbon monoxide percent predicted (DLco%p), and clinical outcome at 1 year. IPF progression was defined as reduction in FVC%p by at least 10%, reduction in DLco%p by at least 15%, or admission to hospice care. CT and MRI were spatially coregistered and a measure of pulmonary gas transfer (red blood cell [RBC]-to-barrier ratio) and high-ventilation percentage of lung volume were compared across groups and across fibrotic versus normal-appearing regions at CT by using Wilcoxon signed rank tests.
Results
Sixteen healthy volunteers (mean age, 57 years ± 14 [SD]; 10 women) and 22 participants with IPF (mean age, 71 years ± 9; 15 men) were evaluated, as follows: nine IPF progressors (mean age, 72 years ± 7; five women) and 13 nonprogressors (mean age, 70 years ± 10; 11 men). Reduction of high-ventilation percent (13% ± 6.1 vs 8.2% ± 5.9; P = .03) and RBC-to-barrier ratio (0.26 ± 0.06 vs 0.20 ± 0.06; P = .03) at baseline were associated with progression of IPF. Participants with progressive disease had reduced RBC-to-barrier ratio in structurally normal-appearing lung at CT (0.21 ± 0.07 vs 0.28 ± 0.05; P = .01) but not in fibrotic regions of the lung (0.15 ± 0.09 vs 0.14 ± 0.04; P = .62) relative to the nonprogressive group.
Conclusion
In this preliminary study, functional measures of gas transfer and ventilation measured with xenon 129 MRI and the extent of fibrotic structure at CT were associated with idiopathic pulmonary fibrosis disease progression. Differences in gas transfer were found in regions of nonfibrotic lung.
© RSNA, 2022
Online supplemental material is available for this article.
See also the editorial by Gleeson and Fraser in this issue.
Summary
In a prospective study, reduced lung function at hyperpolarized 129Xe MRI and extent of fibrotic structure at CT were associated with disease progression in idiopathic pulmonary fibrosis 1 year later.
Key Results
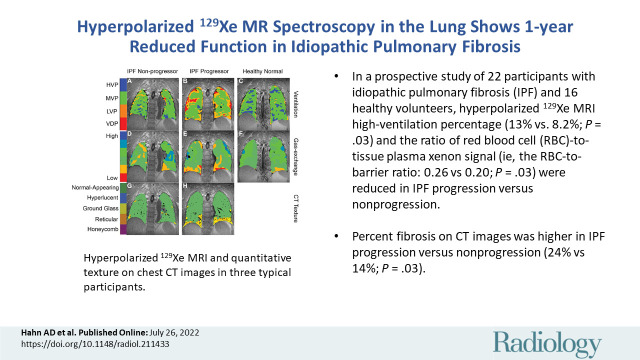
■ In a prospective study of 22 participants with idiopathic pulmonary fibrosis (IPF) and 16 healthy volunteers, hyperpolarized xenon 129 MRI high-ventilation percentage (13% vs 8.2%; P = .03) and the ratio of red blood cell (RBC)-to-tissue-plasma xenon signal (ie, the RBC-to-barrier ratio; 0.26 vs 0.20; P = .03) were reduced in IPF progression versus nonprogression.
■ Percent fibrosis on CT images was higher in IPF progression versus nonprogression (24% vs 14%; P = .03).
■ Reduced RBC-to-barrier ratio in IPF progression occurred in normal-appearing lung at CT (0.21 vs 0.28; P = .01).
Introduction
Idiopathic pulmonary fibrosis (IPF) is a fibrotic lung disease with a poor prognosis, with a median life expectancy of 3–5 years (1). The progression of IPF is highly variable from patient to patient (2). Although the majority of patients will die within 3–5 years, nearly a quarter of patients can survive for over 10 years (3). Given this heterogeneity in disease progression (4), it is clinically challenging to manage care and tailor treatment with the antifibrotic medications nintedanib and pirfenidone (5,6).
The diagnosis of IPF has relied on high-spatial-resolution CT, which provides a confident diagnosis when a classic usual interstitial pneumonia pattern is present (7). However, structural alterations such as honeycombing and traction bronchiectasis are backward-looking; the disease has already progressed to advanced stages by the time these signs are apparent. Pulmonary function tests are commonly used to monitor and assess disease progression in IPF (8). However, pulmonary function tests do not provide regional information and are most useful for monitoring rather than predicting progression for similar reasons as CT. Despite its diagnostic importance, CT has shown limited promise as a tool in predicting progression (9), although quantitative CT computer analysis of lung texture has shown promising preliminary results (10,11).
Hyperpolarized (HP) xenon 129 (129Xe) MRI has shown potential for evaluating global and regional gas exchange, with a strong focus on applications in IPF (12–16). HP 129Xe MRI uses nonionizing radiation for more frequent longitudinal evaluation early in interstitial lung disease without concern for accumulated radiation dose. Recent work demonstrated that whole-lung HP 129Xe spectroscopy may be sensitive to progression of gas-exchange efficiency in IPF (17), and HP helium 3 diffusion-weighted MRI was also shown to be sensitive to longitudinal changes in IPF disease (18). Gas exchange can be evaluated regionally with HP 129Xe MRI by using spectroscopic imaging methods that isolate red blood cell (RBC) and tissue with plasma components (TP; also known as barrier) of the capillary-tissue interface (13). Several ratio measures of normalized gas exchange have emerged: RBC-to-gas, barrier-to-gas, and RBC-to-barrier (also known as RBC-to-TP) ratios (12,19,20). Finally, recent advances in anatomic high resolution ultrashort echo time MRI (21,22) enable direct comparison of fibrotic lung injury at chest CT to functional MRI measures of gas exchange using deformable co-registration (23).
The purpose of this exploratory work was to assess the role of HP 129Xe MRI measures of ventilation and gas exchange in IPF generally and as an early signature of future IPF progression prospectively at baseline with follow-up clinical evaluation at 1 year. We hypothesized that the functional metrics of gas exchange and ventilation measured by using HP 129Xe MRI would be reduced in participants with IPF versus in healthy volunteers of comparable age. A secondary hypothesis was that gas exchange and ventilation measured by using HP 129Xe MRI would be associated with disease progression in IPF and that gas exchange would be colocalized with pathologic structure of interstitial lung disease, as identified at CT.
Materials and Methods
This prospective study was Health Insurance Portability and Accessibility Act compliant, and written informed consent was obtained in accordance with approved institutional review board (Health Sciences Institutional Review Board 2013–0266 and Health Sciences Institutional Review Board 2014–1572) and investigational new drug (Food and Drug Administration Investigational New Drug number 118077) protocols.
Participants and Study Design
Participants were consecutively recruited between December 2015 and August 2019 from either our healthy database within the Department of Radiology or the interstitial lung disease clinic in the Department of Medicine at the University of Wisconsin (Madison). Healthy volunteers were required to be a current nonsmoker without lung disease, advanced heart disease, or history of cancer and age at least 18 years; subsequently volunteers were excluded if age less than 50 years to better compare with the population with IPF. Participants with IPF were outpatients of either sex at age 18 years with a clinical diagnosis of IPF. All participants had to be able to provide consent and undergo MRI. Study participants underwent MRI on either a 1.5-T (HDx; GE Healthcare) or 3.0-T (750 HD; GE Healthcare) scanner by using a quadrature vest coil (Clinical MR Solutions) tuned to the 129Xe resonant frequency (17.66 MHz at 1.5 T and 35.32 MHz at 3.0 T). Pulmonary function tests were acquired according to clinical standards of care with standardization outlined in the American Thoracic Society guideline document (24). Percent predicted values for pulmonary function test measures were calculated based on reference values of the global lung function initiative (25). Forced expiratory value in 1 second percent predicted (FEV1%p) and forced vital capacity percent predicted (FVC%p) by spirometry and diffusing capacity of the lungs for carbon monoxide percent predicted (DLco%p) by the single-breath method were obtained immediately before imaging in 10 of 16 healthy volunteers and all participants with IPF. These measures were also acquired again in the participants with IPF approximately 1 year after undergoing imaging.
Within the IPF cohort, participants were classified as progressors or nonprogressors over the 1 year after undergoing imaging based on the following criteria: reduction in FVC%p by 10%, reduction in DLco%p by 15%, or end-of-life care (3).
A subset of the cohort from this work was reported in previously published work (19,26,27), which assessed repeatability and technical improvements to image reconstruction, secondary to the primary clinical outcomes of the study. Our study is distinguished in that we investigated the original clinical questions that guided our study design regarding baseline associations between imaging metrics (CT and 129Xe MRI) and disease progression, and this analysis was not reported previously.
129Xe Preparation and Delivery
Details of polarized gas preparation and delivery were published previously (19) and are also reported in the online supplement.
Image Acquisition
HP 129Xe MRI.—Image acquisition methods for the spectroscopic MRI have been previously published (19). A detailed description of image acquisition parameters and methods for MRI are provided in Appendix E1 (online).
Multidetector CT.—Chest CT images were acquired by using a standard of care imaging protocol (Appendix E1 [online]). The clinical features of CT images were independently read for pattern of fibrosis to support diagnosis of IPF according to American Thoracic Society/Fleischner criteria (7) (M.L.S., a radiologist with >20 years of experience). For quantitative texture analysis, lung parenchyma on anatomic CT images was classified as normal appearing, hyperlucent, ground glass, reticulated, or honeycombed using an automated commercial lung texture analysis algorithm (LTA; Imbio) (28). The nonnormal texture classes were grouped into a single class, referred to as fibrotic, to facilitate clarity and robustness of the analysis.
Image Processing and Analysis
Image analysis methods for MRI have been published previously (19,29). The detailed description of the imaging processing and analysis is provided in Appendix E1 (online). To perform multimodal regional analysis, 129Xe and CT images were registered by using the open-source software Advanced Normalization Tools (23). The registration pipeline is shown in Figure E1 (online). Gas-exchange images were registered to the volume-matched thoracic three-dimensional proton images by using an affine transformation. Ventilation images were registered to the two-dimensional multisection proton data. These two- and three-dimensional proton and anatomic CT images were then registered to the high-spatial-resolution ultrashort echo time three-dimensional volume by using symmetric diffeomorphic nonrigid transformation (30). These transformations were then used to register the functional 129Xe data and the CT-based texture classifications to the same space for regional analysis.
Statistical Analysis
The number of enrolled participants was chosen based on power estimates from pilot studies of 129Xe MRI in healthy individuals and patients with interstitial lung disease. The study was powered to detect differences in ventilation defect percent between participants with IPF and healthy participants by using pilot data in seven participants with IPF and nine older (age range, 50–60 years) healthy volunteers. At the time, the technique for measuring gas exchange was still being developed. Based on our sample sizes (nine participants with progressive IPF and 13 participants with nonprogressive IPF), we had 80% power to detect a 1.15-SD difference in the mean (α = .05). This size difference is reasonable to expect because the difference between participants with IPF and healthy volunteers has been reported in to be in the range of 2 SD for metrics of interest (19,31). Similar or larger differences in the other outcome variables examined will have the same or larger power.
129Xe MRI was compared with spirometry and CT, which represent the standard of care measurements. Statistical analysis was performed by using statistical software (R version 4.1.2; R Foundation for Statistical Computing, https://www.r-project.org) and reviewed by a biostatistician (K.E.L., with 30 years of experience). Correlations within the entire IPF cohort between spirometry and whole lung average gas-exchange metrics, ventilation metrics, and percentage of fibrotic or equivalent nonfibrotic lung and subtextures based on CT were computed by using Spearman correlations. Whole-lung average gas-exchange metrics and ventilation metrics were compared between healthy participants and participants with IPF, and between groups with IPF progression and without IPF progression by using Wilcoxon signed rank tests.
In the IPF cohort, average gas exchange and ventilation metrics of ventilation defect percent, low-ventilation percent, medium-ventilation percent, and high-ventilation percent within fibrotic and normal-appearing regions of the lung were explored based on CT lung texture analysis and compared by using paired Wilcoxon signed rank tests. Differences in these functional metrics within fibrotic and normal-appearing regions of the lung were compared between progressor groups by using Wilcoxon signed rank tests.
Receiver operating characteristic curves were used to explore the performance of RBC-to-barrier ratio and high-ventilation percent as classifiers of disease progression. Logistic regression was used to generate classifiers based on combinations of metrics.
The exploratory nature of this study, especially given the natural history design, demands that we conduct statistical tests for a variety of outcomes to determine which measures are most relevant for follow-up in larger studies. Because this is an exploratory study, we are willing to accept a higher probability for type 1 error but need to consider the effect of multiple comparisons. There are different approaches to control for number of tests in exploratory studies. As an exploratory study, we decided to accept an overall type I error of 10%, so with six metrics and a conservative Bonferroni adjustment we consider a P value of less than .017 as indicating statistical significance. With the small sample size of this study, this level of significance will be difficult to achieve even for strong effect sizes, so we allow a P value of less than .05 as a threshold that would identify measures worthy of follow-up with a similar study design and a larger study population.
Results
Characteristics of Study Sample
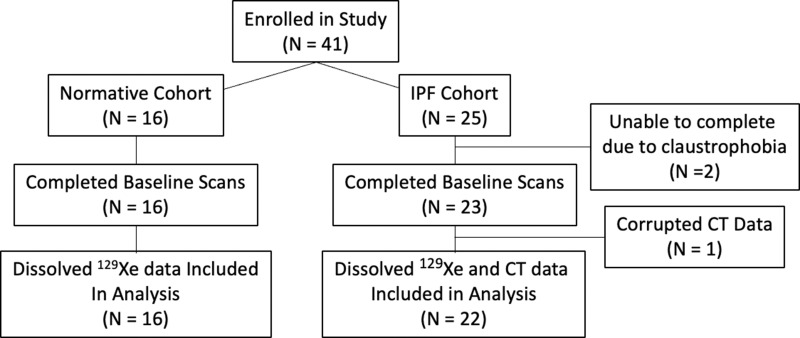
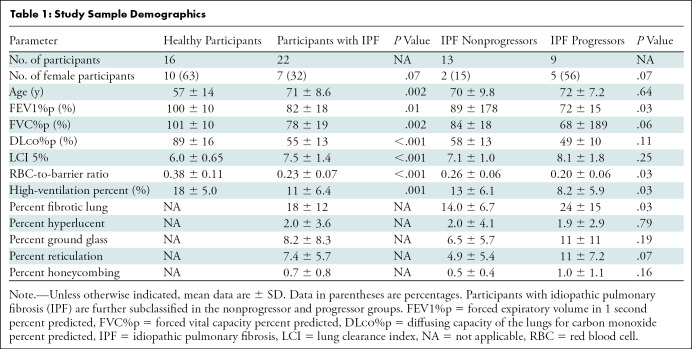
A total of 41 participants were recruited, 39 of whom underwent HP 129Xe MRI. Two participants with IPF were unable to complete the examination because of claustrophobia and one participant was excluded because of data corruption. This resulted in a cohort consisting of a healthy group (n = 16; six men and 10 women; mean age, 57 years ± 14 [SD]) and an IPF group (n = 22; 15 men and seven women; mean age, 71 years ± 9). Within the IPF cohort, nine participants were progressors (four men and five women; mean age, 72 years ± 7) and 13 were nonprogressors (11 men and two women; mean age, 70 ± 10). In 19 of 22 (86%) of the participants with IPF, CT and MRI were performed on the same day. In three of 22 (14%), CT was performed 18–30 months before MRI. All three of the latter participants were in the nonprogression group. A flow diagram of the study enrollment is presented in Figure 1. Full study sample demographics and pulmonary function tests are provided in Table 1. The group of participants with IPF that progressed had moderately more severe IPF in terms of both gender, age, lung physiology, or GAP, index (32) and extent of fibrosis on chest CT images. CT showed a more definitively usual interstitial pneumonia pattern at CT in the progression group and two of the nine progressed to end-of-life care (Table 2).
Figure 1:
Flow diagram of study recruitment and analysis. IPF = idiopathic pulmonary fibrosis.
Table 1:
Study Sample Demographics
Table 2:
CT Pattern, Severity, Treatment, and Outcomes for Idiopathic Pulmonary Fibrosis Progressors and Nonprogressors
Five of the older healthy participants (n = 5; four men and one woman; mean age, 65 years ± 4) first imaged at 1.5 T were imaged again at 3.0 T with a time delay of 1.9–3.6 years to estimate bias and repeatability for the RBC-to-barrier ratio. These measurements found a small bias of 0.02, a coefficient of variation of 7.8%, and a repeatability coefficient of 0.05 (Fig E2 [online]).
Global Comparisons
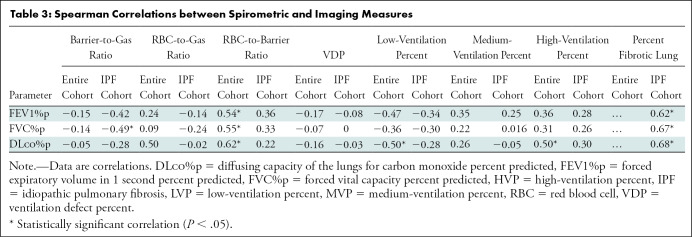
Notably, healthy volunteers had higher RBC-to-barrier ratio (0.38 ± 0.11 vs 0.23 ± 0.07, respectively; P < .001) and high-ventilation percent (17.8% ± 5.0 vs 11.2% ± 6.4; P = .001) than IPF. Correlations between whole-lung imaging markers and spirometry are provided in Table 3. Several correlations between functional imaging markers and spirometry were found. In ventilation metrics, low-ventilation percent was negatively correlated with FEV1%p (r = –0.47; P = .009), FVC%p (r = –0.36; P = .049), and DLco%p (r = –0.50; P = .007); high-ventilation percent was positively correlated with DLco%p (r = 0.50; P = .007). For gas exchange metrics, whole-lung mean RBC-to-barrier ratio was positively correlated with FEV1%p (r = 0.54; P = .002), FVC%p (r = 0.55; P = .002), and DLco%p (r = 0.62; P < .001), whereas the RBC-to-gas ratio was negatively correlated with DLco%p (r = –0.50; P = .006). Of the structural imaging markers acquired from CT texture, the percentage of total fibrotic lung negatively correlated with FEV1%p (r = –0.62; P = .004), FVC%p (r = 0.67; P < .001), and DLco%p (r = –0.68; P = .001). In addition to percent fibrosis, FVC%p and DLco%p were independently negatively correlated with fibrotic subtextures, including ground-glass opacity (FVC%p, r = –0.73 [P < .001]; and DLco%p, r = –0.50 [P = .02]) and reticulation (FVC%p, r = –0.67 [P < .001]; DLco%p, r = –0.71 [P = .03]) as shown in the online supplement, Table E1 (online). We found no evidence of global associations between lung texture measures and MRI measures.
Table 3:
Spearman Correlations between Spirometric and Imaging Measures
Regional Comparisons
Differences in ventilation and gas exchange markers were found between regions of normal-appearing versus fibrotic lung. RBC-to-gas ratio (0.30 ± 0.10 vs 0.19 ± 0.11; P < .001) and RBC-to-barrier ratio (0.25 ± 0.07 vs 0.15 ± 0.07; P < .001) were lower in fibrotic lung regions, and medium-ventilation percent was reduced in the fibrotic lung (61% ± 20 vs 57% ± 22; P = .02). Low-ventilation percent was only slightly elevated in fibrotic lung at quantitative chest CT (22% ± 16 vs 26% ± 16; P = .07). We found no evidence that barrier-to-gas ratio (1.22 vs 1.10; P = .36) or RBC-to-gas ratio (0.27 vs 0.29; P = .65) were different between participants with IPF with progressive disease. A full report of regional associations between MRI measures and percent fibrosis at CT for each marker can be found in Table 4.
Table 4:
Functional Imaging Measures at CT in the Idiopathic Pulmonary Fibrosis Cohort
Disease Progression
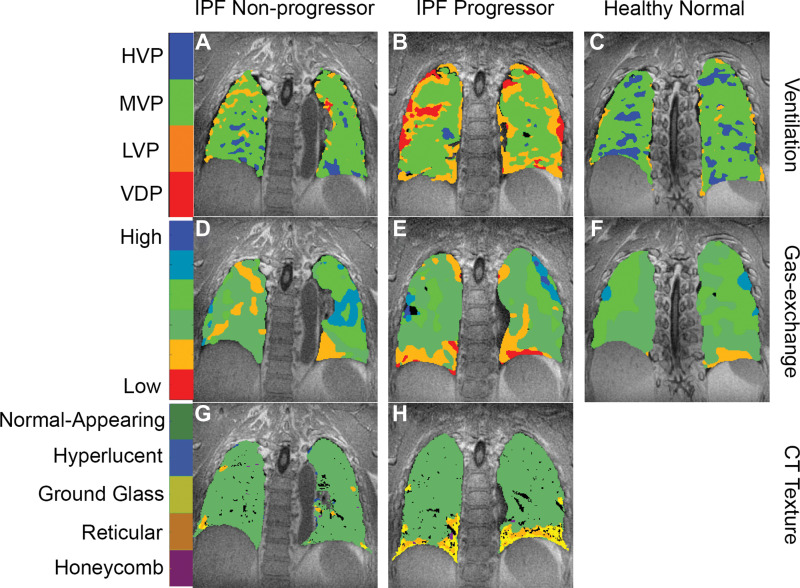
The progression of disease was associated with the levels of certain functional and structural imaging markers. RBC-to-barrier ratio showed a positive relationship with DLco%p in the participants with IPF who progressed (r = 0.55; P = .15), but no pattern existed in participants with IPF who did not progress (r = –0.16; P = .62) or for participants with IPF overall (r = 0.22; P = .35). There was no evidence of an interaction between IPF progression and the relationship between DLco%p and RBC-to-barrier ratio (regression coefficient, 0.003; P = .23). The percentage of total normal-appearing lung, the RBC-to-barrier ratio, and the high-ventilation percent were reduced in participants with IPF with progressive disease (Table 1). On average, in IPF progression versus nonprogression groups, percentage of normal-appearing lung was reduced by 10% (86% vs 76%; P = .03), whole lung RBC-to-barrier ratio was reduced by 0.06 (0.26 vs 0.20; P = .03), and whole lung high-ventilation percent was reduced by 5.2% (13.4% vs 8.2%; P = .05). Boxplots of these differences are in Figure 2; representative images from a healthy volunteer, IPF nonprogressor, and IPF progressor are in Figure 3.
Figure 2:
Box plots of (A) high-ventilation percent in healthy volunteers, idiopathic pulmonary fibrosis (IPF) nonprogressors, and IPF progressors, (B) red blood cell (RBC)-to-barrier ratio in healthy volunteers, IPF nonprogressors, and IPF progressors, and (C) percent of fibrotic lung in the IPF groups only. Statistically significant differences are indicated and show consistently higher high-ventilation percent and RBC-to-barrier ratio in healthy versus IPF groups and in IPF nonprogressors versus progression groups. Percent fibrotic lung was also higher in the progressor versus nonprogressor groups.
Figure 3:
Hyperpolarized xenon 129 (129Xe) MRI and quantitative texture on chest CT images in three typical participants. In a 68-year-old man with nonprogressive idiopathic pulmonary fibrosis (IPF), (A) 129Xe ventilation, (D) 129Xe gas exchange, and (G) CT-based texture images are shown. In a 65-year-old man with progressive IPF, (B) 129Xe ventilation, (E) 129Xe gas exchange, and (H) CT-based texture images are shown. In a 63-year-old healthy man, (C) 129Xe ventilation and (F) 129Xe gas exchange images are shown. CT data were not acquired in the healthy volunteer. Note the progressively poorer ventilation and gas exchange going from healthy volunteer to nonprogressor to progressor, and the increased prevalence of fibrotic textures in the participant with progressive IPF. HVP = high-ventilation percent, LVP = low-ventilation percent, MVP = medium-ventilation percent, VDP = ventilation defect percent.
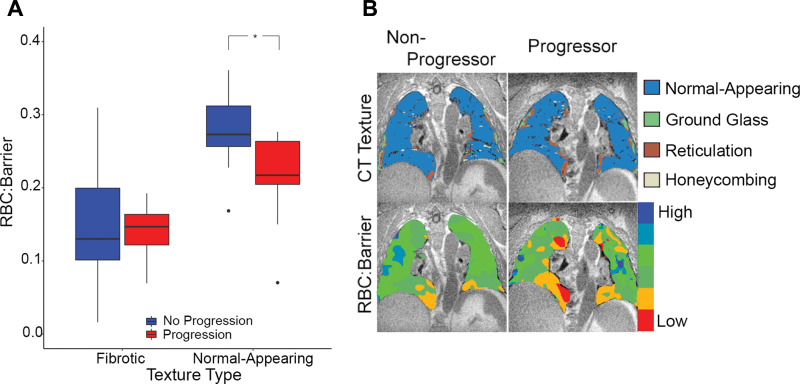
The RBC-to-barrier ratio in the texturally normal-appearing regions of the lung was more strongly associated with disease progression than was the whole lung RBC-to-barrier ratio. RBC-to-barrier ratio was reduced in normal-appearing lung for participants with IPF with disease progression (0.28 ± 0.05 vs 0.21 ± 0.07; P = .01), whereas RBC-to-barrier ratio in fibrotic lung was not associated with progression (0.15 ± 0.09 vs 0.14 ± 0.04; P = .62). A linear model of the dependence of RBC-to-barrier ratio on the interaction between disease progression and lung texture (normal-appearing vs fibrotic) confirmed the differences in RBC-to-barrier ratio when evaluating normal-appearing versus fibrotic lung (regression coefficient-0.07 ± 0.03; P = .02). Boxplots depicting these relationships and example images are shown in Figure 4. No evidence of a positive relationship between RBC-to-barrier ratio and percentage of normal-appearing lung (r = 0.41; P = .06) or RBC-to-barrier ratio within fibrotic lung regions (r = 0.11; P = .64) was found.
Figure 4:
(A) Box plots of the red blood cell (RBC)-to-barrier ratio in fibrotic and normal-appearing lung in progressor and nonprogressor groups. * Statistically significant difference. Note the overall reduced RBC-to-barrier ratio in fibrotic lung and the difference in progression groups in the normal-appearing lung (P = .01) but not in the fibrotic lung (P = .67). (B) Images in a 77-year-old man with idiopathic pulmonary fibrosis (IPF) from the nonprogressor group (left) and a 77-year-old man with IPF from the progressor group (right) show exemplary differences demonstrated on the box plots (A). Note that RBC-to-barrier ratio is uniformly low in fibrotic regions on CT images but also reduced in normal-appearing regions, and more prominently in the participant with progressive IPF.
The area under the receiver operating characteristic curve (AUC) of the receiver operating characteristic curves for a selection of markers is provided in Table 5. The classifier combining high-ventilation percent and RBC-to-barrier ratio in normal-appearing lung had the highest performance (AUC, 0.89 ± 0.14) and was greater than the AUCs for high-ventilation percent alone (AUC, 0.75 ± 0.12; P = .04) and DLco%p (AUC, 0.72 ± 0.13; P = .03), but was not greater than percent fibrosis at chest CT (AUC, 0.78 ± 0.10; P = .19). Figure E3 (online) shows receiver operating characteristic curves and CIs for the normal-appearing RBC-to-barrier ratio, the high-ventilation percent, and the high-ventilation percent with RBC-to-barrier ratio in normal-appearing lung. The operating point (marked by crosshairs) for the classifier combining the high-ventilation percent with RBC-to-barrier ratio in normal-appearing lung had higher sensitivity and specificity (sensitivity, 0.89; specificity, 0.85) than either the high-ventilation percent (sensitivity, 0.89; specificity, 0.69) or RBC-to-barrier ratio (sensitivity, 0.67; specificity, 0.85) classifiers alone.
Table 5:
Spirometric and Imaging-based Metrics as Predictors of Disease Progression
Discussion
Our work is a prospective exploratory study of multimodal quantitative imaging of pulmonary structure and function by using hyperpolarized (HP) xenon 129 (129Xe) MRI and quantitative CT texture analysis in study participants with idiopathic pulmonary fibrosis (IPF) and healthy volunteers to identify baseline predictors of IPF and IPF disease progression. The association between pulmonary function and percent fibrosis at CT with disease progression supports current clinical decision-making. At HP 129Xe MRI, red blood cell (RBC)-to-barrier ratio (measure of gas exchange) and high-ventilation percent were reduced at baseline in participants with IPF who progressed in the year after imaging. Our results also suggested that HP 129Xe MRI helps to detect reduced RBC-to-barrier ratio in participants with IPF progression compared with participants without progression in nonfibrotic lung, despite both groups showing the expected lower overall RBC-to-barrier ratio in fibrotic lung compared with nonfibrotic lung. This indicates that HP 129Xe MRI may help provide complementary information to CT.
Exploratory receiver operating characteristic analysis further supports a role for functional measures using HP 129Xe MRI. Our results showed that percentage of fibrotic lung, high-ventilation percent, and RBC-to-barrier ratio all performed reasonably well as independent predictors of disease progression with an area under the receiver operating curve greater than 0.7; moreover, the best classifier combines both high-ventilation percent and RBC-to-barrier ratio, resulting in an area under the receiver operating curve of nearly 0.9, although this was not better than percent fibrosis at CT.
Recent advances in quantitative CT texture analysis have shown promise in predicting lung function decline and progression in IPF (9,11,33–35). It is therefore surprising that CT texture and HP 129Xe MRI measures both correlate modestly to lung function but not to each other. We hypothesize that CT texture and HP 129Xe MRI help measure different aspects of IPF injury that contribute to lung function decline but at different stages of the disease process.
Correlations between gas-exchange measures and spirometry have been described previously in the literature (13,16), and we showed similar findings. However, the trend between RBC-to-barrier ratio with DLco%p in participants with IPF progression contrasts with moderate to strong associations when correlating across healthy participants and participants with IPF in our study and previous studies (13). This further suggests quantitative measures of CT texture may be useful to predict progression (9,11,33).
Our study had limitations. First, the sample size was small. Second, although we identified where the disease-related effect is largest compared with the underlying natural variation, the nonstatistically significant metrics we analyzed may have real effects that are smaller than the variation allows us to detect at this power level. Third, because of changes in scanner availability over the course of our study, a portion of the participants with IPF were imaged at 1.5 T and a portion were imaged at 3.0 T but correcting for field strength did not influence the statistical significance of our findings. Additionally, repeatability across field strengths for the five older healthy participants scanned at both 1.5 T and 3.0 T suggests good repeatability across field strengths despite a substantial delay between visits. The indication that these experiments can be performed reliably at multiple field strength speaks to the generalizability of these results. Fourth, the IPF progression group had moderately more severe IPF than our nonprogression group at baseline. Fifth, we only acquired 1-year follow-up data in the IPF participants, which makes it hard to rule out the natural effects of aging. Finally, in our study sample, healthy volunteers did not perfectly match to participants with IPF in terms of being generally younger and with more women than is typical. Male sex is an independent risk factor for progression of fibrotic lung disease in general and IPF in particular (7). Patient sex and baseline severity influence the overall trajectory of the disease and may influence the imaging metrics, and this is not captured here.
In conclusion, we demonstrated that functional measures of gas exchange and ventilation measured at xenon 129 MRI and the extent of fibrotic structure at CT are associated with disease progression in idiopathic pulmonary fibrosis (IPF) 1 year later. Moreover, differences in xenon gas exchange in participants with progression appear to be driven by lower values in regions of nonfibrotic lung, rather than in fibrotic regions at CT. Our findings need to be verified in a longitudinal multicenter study with more rigorous testing of the repeatability of the MRI-based measurements of gas exchange and ventilation in a larger sample of participants with IPF.
Acknowledgments
Acknowledgments
The authors thank Janice Yakey, MSCRA, RN, CCRC, for help with recruitment and clinical follow-up and Bastiaan Driehuys, PhD, for generous help with providing analysis tools.
Study supported by the University of Wisconsin, Department of Radiology and Medical Physics, Research and Development Fund, Wisconsin Alumni Research Foundation, Pulmonary Imaging Center; National Institutes of Health/Office of Research Infrastructure Programs (S10 OD016394); National Institutes of Health/National Heart, Lung, and Blood Institute (R01HL126771, R01HL146689); and research support from GE Healthcare.
Disclosures of conflicts of interest: A.D.H. No relevant relationships. K.J.C. Full-time employee for Imbio. G.P.B. No relevant relationships. L.A.T. No relevant relationships. J.K. Employed by Polarean; stock options in Polarean. R.V.C. No relevant relationships. K.E.L. No relevant relationships. M.L.S. Radiology editorial board; shareholder in Stemina Biomarker Discovery, Healthmyne, X-Vax, Elucent Medical, Elucent Technology. N.S. No relevant relationships. S.B.F. Money to institution from GE Healthcare; consulting fees from Polarean, Sanofi/Regeneron; honoraria from Polarean, Sanofi/Regeneron; co-chair of QIBA Lung Density Biomarker Subcommittee.
Abbreviations:
- DLco%p
- diffusing capacity of the lungs for carbon monoxide percent predicted
- FEV1%p
- forced expiratory volume in 1 second percent predicted
- FVC%p
- forced vital capacity percent predicted
- HP
- hyperpolarized
- IPF
- idiopathic pulmonary fibrosis
- RBC
- red blood cell
- TP
- tissue with plasma components
References
- 1.Demedts M, Costabel U. ATS/ERS international multidisciplinary consensus classification of the idiopathic interstitial pneumonias. Eur Respir J 2002;19(5):794–796. [DOI] [PubMed] [Google Scholar]
- 2.Ley B, Collard HR, King TE Jr. Clinical course and prediction of survival in idiopathic pulmonary fibrosis. Am J Respir Crit Care Med 2011;183(4):431–440. [DOI] [PubMed] [Google Scholar]
- 3.Nathan SD, Shlobin OA, Weir N, et al. Long-term course and prognosis of idiopathic pulmonary fibrosis in the new millennium. Chest 2011;140(1):221–229. [DOI] [PubMed] [Google Scholar]
- 4.King TE Jr, Pardo A, Selman M. Idiopathic pulmonary fibrosis. Lancet 2011;378(9807):1949–1961. [DOI] [PubMed] [Google Scholar]
- 5.Noble PW, Albera C, Bradford WZ, et al. Pirfenidone in patients with idiopathic pulmonary fibrosis (CAPACITY): two randomised trials. Lancet 2011;377(9779):1760–1769. [DOI] [PubMed] [Google Scholar]
- 6.Richeldi L, du Bois RM. Pirfenidone in idiopathic pulmonary fibrosis: the CAPACITY program. Expert Rev Respir Med 2011;5(4):473–481. [DOI] [PubMed] [Google Scholar]
- 7.Lynch DA, Sverzellati N, Travis WD, et al. Diagnostic criteria for idiopathic pulmonary fibrosis: a Fleischner Society White Paper. Lancet Respir Med 2018;6(2):138–153. [DOI] [PubMed] [Google Scholar]
- 8.Raghu G, Collard HR, Egan JJ, et al. An official ATS/ERS/JRS/ALAT statement: idiopathic pulmonary fibrosis: evidence-based guidelines for diagnosis and management. Am J Respir Crit Care Med 2011;183(6):788–824. [DOI] [PMC free article] [PubMed] [Google Scholar]
- 9.Robbie H, Daccord C, Chua F, Devaraj A. Evaluating disease severity in idiopathic pulmonary fibrosis. Eur Respir Rev 2017;26(145):170051. [DOI] [PMC free article] [PubMed] [Google Scholar]
- 10.Maldonado F, Moua T, Rajagopalan S, et al. Automated quantification of radiological patterns predicts survival in idiopathic pulmonary fibrosis. Eur Respir J 2014;43(1):204–212. [DOI] [PubMed] [Google Scholar]
- 11.Jacob J, Bartholmai BJ, Rajagopalan S, et al. Predicting Outcomes in Idiopathic Pulmonary Fibrosis Using Automated Computed Tomographic Analysis. Am J Respir Crit Care Med 2018;198(6):767–776. [DOI] [PMC free article] [PubMed] [Google Scholar]
- 12.Mammarappallil JG, Rankine L, Wild JM, Driehuys B. New Developments in Imaging Idiopathic Pulmonary Fibrosis With Hyperpolarized Xenon Magnetic Resonance Imaging. J Thorac Imaging 2019;34(2):136–150. [DOI] [PMC free article] [PubMed] [Google Scholar]
- 13.Kaushik SS, Freeman MS, Yoon SW, et al. Measuring diffusion limitation with a perfusion-limited gas--hyperpolarized 129Xe gas-transfer spectroscopy in patients with idiopathic pulmonary fibrosis. J Appl Physiol (1985) 2014;117(6):577–585. [DOI] [PMC free article] [PubMed] [Google Scholar]
- 14.Stewart NJ, Leung G, Norquay G, et al. Experimental validation of the hyperpolarized 129 Xe chemical shift saturation recovery technique in healthy volunteers and subjects with interstitial lung disease. Magn Reson Med 2015;74(1):196–207. [DOI] [PubMed] [Google Scholar]
- 15.Wang JM, Robertson SH, Wang Z, et al. Using hyperpolarized 129Xe MRI to quantify regional gas transfer in idiopathic pulmonary fibrosis. Thorax 2018;73(1):21–28. [DOI] [PMC free article] [PubMed] [Google Scholar]
- 16.Wang Z, Robertson SH, Wang J, et al. Quantitative analysis of hyperpolarized 129Xe gas transfer MRI. Med Phys 2017;44(6):2415–2428. [DOI] [PubMed] [Google Scholar]
- 17.Weatherley ND, Stewart NJ, Chan HF, et al. Hyperpolarised xenon magnetic resonance spectroscopy for the longitudinal assessment of changes in gas diffusion in IPF. Thorax 2019;74(5):500–502. [DOI] [PMC free article] [PubMed] [Google Scholar]
- 18.Chan H-F, Weatherley ND, Johns CS, et al. Airway Microstructure in Idiopathic Pulmonary Fibrosis: Assessment at Hyperpolarized 3He Diffusion-weighted MRI. Radiology 2019;291(1):223–229. [DOI] [PubMed] [Google Scholar]
- 19.Hahn AD, Kammerman J, Evans M, et al. Repeatability of regional pulmonary functional metrics of Hyperpolarized 129Xe dissolved-phase MRI. J Magn Reson Imaging 2019;50(4):1182–1190. [DOI] [PMC free article] [PubMed] [Google Scholar]
- 20.Mata J, Guan S, Qing K, et al. Evaluation of Regional Lung Function in Pulmonary Fibrosis with Xenon-129 MRI. Tomography 2021;7(3):452–465. [DOI] [PMC free article] [PubMed] [Google Scholar]
- 21.Johnson KM, Fain SB, Schiebler ML, Nagle S. Optimized 3D ultrashort echo time pulmonary MRI. Magn Reson Med 2013;70(5):1241–1250. [DOI] [PMC free article] [PubMed] [Google Scholar]
- 22.Zhu X, Chan M, Lustig M, Johnson KM, Larson PEZ. Iterative motion-compensation reconstruction ultra-short TE (iMoCo UTE) for high-resolution free-breathing pulmonary MRI. Magn Reson Med 2020;83(4):1208–1221. [DOI] [PMC free article] [PubMed] [Google Scholar]
- 23.Avants BB, Tustison NJ, Stauffer M, Song G, Wu B, Gee JC. The Insight ToolKit image registration framework. Front Neuroinform 2014;8:44. [DOI] [PMC free article] [PubMed] [Google Scholar]
- 24.Graham BL, Steenbruggen I, Miller MR, et al. Standardization of Spirometry 2019 Update. An Official American Thoracic Society and European Respiratory Society Technical Statement. Am J Respir Crit Care Med 2019;200(8):e70–e88. [DOI] [PMC free article] [PubMed] [Google Scholar]
- 25.Quanjer PH, Stanojevic S, Cole TJ, et al. Multi-ethnic reference values for spirometry for the 3-95-yr age range: the global lung function 2012 equations. Eur Respir J 2012;40(6):1324–1343. [DOI] [PMC free article] [PubMed] [Google Scholar]
- 26.Hahn AD, Kammerman J, Fain SB. Removal of hyperpolarized 129Xe gas-phase contamination in spectroscopic imaging of the lungs. Magn Reson Med 2018;80(6):2586–2597. [DOI] [PMC free article] [PubMed] [Google Scholar]
- 27.Kammerman J, Hahn AD, Cadman RV, Malkus A, Mummy D, Fain SB. Transverse relaxation rates of pulmonary dissolved-phase Hyperpolarized 129Xe as a biomarker of lung injury in idiopathic pulmonary fibrosis. Magn Reson Med 2020;84(4):1857–1867. [DOI] [PMC free article] [PubMed] [Google Scholar]
- 28.Jacob J, Bartholmai BJ, Rajagopalan S, et al. Automated Quantitative Computed Tomography Versus Visual Computed Tomography Scoring in Idiopathic Pulmonary Fibrosis: Validation Against Pulmonary Function. J Thorac Imaging 2016;31(5):304–311. [DOI] [PubMed] [Google Scholar]
- 29.Zha W, Niles DJ, Kruger SJ, et al. Semiautomated Ventilation Defect Quantification in Exercise-induced Bronchoconstriction Using Hyperpolarized Helium-3 Magnetic Resonance Imaging: A Repeatability Study. Acad Radiol 2016;23(9):1104–1114. [DOI] [PMC free article] [PubMed] [Google Scholar]
- 30.Avants BB, Epstein CL, Grossman M, Gee JC. Symmetric diffeomorphic image registration with cross-correlation: evaluating automated labeling of elderly and neurodegenerative brain. Med Image Anal 2008;12(1):26–41. [DOI] [PMC free article] [PubMed] [Google Scholar]
- 31.Hahn AD, Malkus A, Kammerman J, et al. Characterization of R*2 and tissue density in the human lung: Application to neonatal imaging in the intensive care unit. Magn Reson Med 2020;84(2):920–927. [DOI] [PMC free article] [PubMed] [Google Scholar]
- 32.Ley B, Ryerson CJ, Vittinghoff E, et al. A multidimensional index and staging system for idiopathic pulmonary fibrosis. Ann Intern Med 2012;156(10):684–691. [DOI] [PubMed] [Google Scholar]
- 33.Fain SB, Lynch DA, Hatt C. Invited Commentary on “Quantitative CT Analysis of Diffuse Lung Disease”. RadioGraphics 2020;40(2):E1–E3. [DOI] [PubMed] [Google Scholar]
- 34.Humphries SM, Yagihashi K, Huckleberry J, et al. Idiopathic Pulmonary Fibrosis: Data-driven Textural Analysis of Extent of Fibrosis at Baseline and 15-Month Follow-up. Radiology 2017;285(1):270–278. [DOI] [PMC free article] [PubMed] [Google Scholar]
- 35.Kim GHJ, Weigt SS, Belperio JA, et al. Prediction of idiopathic pulmonary fibrosis progression using early quantitative changes on CT imaging for a short term of clinical 18-24-month follow-ups. Eur Radiol 2020;30(2):726–734. [DOI] [PubMed] [Google Scholar]


