Abstract
The intestinal microbiota and its metabolites play vital roles in host growth, development, and immune regulation. This study analyzed the microbial community distribution and the cytokine and short-chain fatty acid (SCFA) content of cecal contents (Con group), soft feces (SF group), and hard feces (HF group) of 60-day-old Hyplus rabbits and verified the effect of soft feces on the cecal immune microenvironment by coprophagy prevention (CP). The results showed that there were significant differences in the levels of phylum and genus composition, cytokines, and SCFAs among the Con group, SF group, and HF group. The correlation analysis of cytokines and SCFAs with differential microbial communities showed that Muribaculaceae, Ruminococcaceae_UCG-014, Ruminococcaceae_NK4A214_group, and Christensenellaceae_R-7_Group are closely related to cytokines and SCFAs. After CP treatment, the contents of propionic acid, butyric acid, IL-4, and IL-10 in cecum decreased significantly, whereas TNF-α and IL-1β increased significantly. Moreover, the inhibition of coprophagy led to the downregulation of the expression levels of tight junction proteins (Claudin-1, Occludin, and ZO-1) related to intestinal inflammation and intestinal barrier function, and the ring-like structure of ZO-1 was disrupted. In conclusion, coprophagy can not only help rabbits obtain more probiotics and SCFAs but also play an essential role in improving the immune microenvironment of cecum.
1. Introduction
Animal feces contain a large number of intestinal microorganisms. Their main function is to digest and absorb nutrients in food and macromolecular substances that the host itself cannot completely decompose, to provide the host with energy and nutrients necessary for growth and development [1]. Carbohydrates are an important energy source in animals. There are a large number of polysaccharides that cannot be decomposed and utilized in the food taken by animals; microorganisms in the intestine provide the host with enzymes and biochemical metabolic pathways that the host lacks so that the host can produce energy by fermenting the degraded polysaccharides (starch, cellulose, hemicellulose, and colloid) and absorbing oligosaccharides. Additionally, a large number of short-chain fatty acids (SCFAs) (acetic acid, propionic acid, and butyric acid) are produced [2–5]. The intestinal microbiota helps to maintain the integrity of the intestinal epithelial mucosal barrier function and causes immune system-mediated mucosal protection. The intestinal microbiota regulates the tight junctions of intestinal epithelial cells and protects intestinal epithelial cells from damage by controlling the proliferation rate of intestinal epithelial cells and inducing cytoprotective proteins [6, 7]. The mucosal epithelial barrier is the first line of defense against the invasion of intestinal pathogenic microorganisms and toxins. As an important part of the intestinal mucosal barrier, changes in tight junction proteins can cause abnormal intestinal barrier function and affect the intestinal health of rabbits, so they play a vital role in the occurrence of intestinal inflammation and diseases. Microbial colonization can stimulate intestinal goblet cells to secrete mucin, which plays a vital role in maintaining intestinal health [8]. In addition, an increasing number of studies have shown that host behavior can affect intestinal microbiota, and intestinal microbiota can also affect animal behavior [9, 10].
Coprophagy refers to the behavior of animals feeding on feces, and animal feeding on feces includes feeding on their own feces and the feces from other animals to meet their nutritional needs [11]. Coprophagy prevention can cause weight loss or growth retardation [12]. Soft feces of rabbits contain a large number of bacterial proteins and nutrients. Eating soft feces can prolong the time of feed passing through the digestive tract, improve the digestion and absorption efficiency of feed, help to maintain the normal microbiota of the digestive tract, and alleviate nutritional diseases [13, 14]. Preventing rabbits from eating their feces reduces the content of vitamin A in the blood, causes them to slowly lose weight, increases the content of acetic acid and propionic acid in the blood, reduces the content of butyric acid, and causes skin damage to the eyes and ears. In addition, fecal eating behavior can also help herbivores obtain the necessary intestinal microbiota and maintain the diversity and function of the intestinal microbiota [15, 16]. Overall, coprophagy plays a very essential role in the nutrition and health in small herbivores.
In recent years, an increasing number of research reports have shown that coprophagy is of great significance to rabbit growth, development, and immune regulation [17, 18]. However, the microbiota and metabolites that play a key role in rabbit soft feces are still unknown. The rapid development of high-throughput sequencing technology has helped researchers better understand the composition of host intestinal microbiota and identify the key microbiota and metabolites, which has played an important role in improving human and animal health [19, 20]. Combined analysis of the microbiome and metabolome can better identify the key regulatory metabolic pathways, determine the key microbiota, and explain the molecular mechanisms of biological growth and development, environmental response, physiological state, and pathological response. Therefore, in this study, high-throughput sequencing technology and gas chromatography-mass spectrometer (GC-MS) were used to analyze the cecal contents, microbial diversity, SCFAs, and cytokines of soft and hard feces from Hyplus rabbits [21]. Subsequently, the effect of soft feces on cecal immune microenvironment was verified by coprophagy prevention treatment in rabbits, aimed to screen the key microbiota and its metabolites that play an important role in regulating the growth, development, and immune function of rabbits.
2. Materials and Methods
2.1. Animal Ethics
All the experimental procedures applied in this study were reviewed and approved by the Ministry of Science and Technology in China (2014). All procedures involving live rabbit handling, management, and health care are performed under the approval of the Institutional Animal Care and Use Committee (IACUC) of Henan Agricultural University (permit number: 21-0156).
2.2. Experimental Design, Animals, and Management
In this study, a total of 32 60-day-old Hyplus rabbits (half male and half female) with similar weight provided by Jiyuan Sunshine Rabbit Technology Co., Ltd. were used as experimental animals. All Hyplus rabbits were fed according to the feeding standard of Jiyuan Sunshine Rabbit Technology Co., Ltd. The composition of the diet is shown in Table 1. After 20 days of adaptive feeding, the soft feces and hard feces of Hyplus rabbits were collected. Eight rabbits were randomly selected for cecal content collection after euthanasia. The collected samples were divided into three groups: cecal content group (Con1-6), soft feces group (SF1-8), and hard feces group (HF1-8). All samples were stored at -80°C for a short time, and DNA was extracted as soon as possible. Then, the remaining 10 Hyplus rabbits were randomly divided into two groups (CN1-5 and CP1-5), wearing collars for the coprophagy prevention (CP) test (half male and half female). In the CP group, rabbits were fitted with a wide collar (7 cm) to prevent them from consuming their feces to build the coprophagy prevention rabbit model; in the CN group, the rabbits were fitted with a narrow collar (2.5 cm) that did not prevent them from consuming their feces. These Hyplus rabbits were kept in cages alone and had free access to feed and water. The same rabbit species (same age), basic dietary composition, feeding method, and environment were used. All rabbits were raised according to the appropriate guidelines for raising rabbits.
Table 1.
The composition and nutritional composition of diets (dry basis).
| Feeds | Contents (%) | Nutrient level | Contents (%) |
|---|---|---|---|
| Soybean meal | 20.0 | ME (MJ/kg)(2) | 12.20 |
| Corn | 16.0 | Crude protein | 14.88 |
| Wheat bran | 20.0 | Crude fiber | 16.53 |
| Alfalfa meal | 15.0 | Ether extract | 2.64 |
| Peanut | 24.5 | Met | 0.65 |
| Soybean oil | 0.5 | Lys | 0.98 |
| Premix(1) | 4.0 | Ca | 1.05 |
| Total | 100.0 | P | 0.35 |
(1) Premix is VA 8000 IU, VD3 900 IU, VE 100 mg, VK3 2 mg, VB1 1 mg, VB2 3 mg, VB6 1 mg, VB12 0.01 mg, niacin 50 mg, pantothenic acid 8.0 mg, folic acid 0.5 mg, zinc 50 mg, iron 50 mg, manganese 30 mg, magnesium 150 mg, iodine 0.5 mg, selenium 0.1 mg, salt 5 g, choline 1.5 g, methionine 3.0 g, and lysine 2.9 g per kg of diet. (2) The metabolizable energy is the calculated value, and the rest is the measured value.
2.3. Cytokine and SCFA Content Detection in Soft Feces, Hard Feces, and Cecal Contents
An ELISA Kit (Meimian, Jiangsu, China) was used to analyze the content of several cytokines (including TNF-α, IL-1β, IL-6, TGF-β, IL-4, IL-10, and IL-13) in the cecal contents, soft feces, and hard feces. GC-MS (Agilent, CA, USA) was used to detect SCFA content in cecal contents, soft feces, and hard feces, including formic acid, isocaproic acid, heptanoic acid, propanoic acid, isobutyric acid, butyric acid, valeric acid, acetic acid, isovaleric acid, and hexanoic acid.
2.4. Extraction and Quality Assessment of Total DNA from Soft Feces, Hard Feces, and Cecal Contents and Library Construction
The fecal genomic DNA Extraction Kit (Tiangen, Beijing, China) was used to extract the fecal genomic DNA from all samples. Meanwhile, NanoDrop was used to quantify DNA, and the quality of DNA was assessed by 1.2% agarose gel electrophoresis. Then, the V3+V4 region of 16S rRNA was amplified by PCR, gel recovery, and fluorescence quantification. The forward primer was 5′-ACTCCTACGGGAGGCAGCA-3′ and the reverse primer was 5′-GGACTACHVGGGTWTCTAAT-3′. Subsequently, the sequencing library was prepared using the TruSeq Nano DNA LT Library Prep Kit, and the library was assessed using an Agilent Bioanalyzer.
2.5. Illumina NovaSeq 6000 High-Throughput Sequencing
The qualified library was quantified by the quant-iT PicoGreen dsDNA Assay Kit on the Promega QuantiFluor fluorescence quantitative system. After gradient dilution of qualified online sequencing libraries (index sequences could not be repeated), they were mixed according to the required sequencing amount in the corresponding proportion and denatured into single strands by NaOH for online sequencing. PE250 sequencing was performed with an Illumina NovaSeq 6000 sequencer, and the corresponding reagent was NovaSeq 6000 S2 Reagent Kit v1.5 (300 cycles). Sequencing service was performed by Bioyigene Biotechnology Co., Ltd. (Wuhan, China).
2.6. Bioinformatics Analysis of 16S rRNA Gene Sequencing Data
Bioinformatics analysis was mainly based on Xu et al. and Deng et al. [7, 22]. (1) By calculating statistics on the ASV/OTU table after flattening, the specific composition table of the microbial community in each sample at each classification level was obtained, and the column diagram of phylum and genus levels was drawn by QIIME2 software. (2) The ggtree package was used to visualize an evolutionary tree to show the position of each ASV/OTU in the evolutionary tree and the evolutionary distance between them and reflect their composition, abundance, taxonomy, and other information through a heatmap and histogram. (3) In this study, Chao1 and observed species indexes were used to characterize richness, Shannon and Simpson indexes were used to characterize diversity, Faith's PD index was used to characterize evolution-based diversity, Pielou's evenness index was used to characterize evenness, and Good's coverage index was used to characterize coverage. Based on alpha diversity, QIIME2 was used to draw rarefaction curve (reference for calculation method of alpha diversity index http://scikit-bio.org/docs/latest/generated/skbio.diversity.alpha.html#module-Skbio.diversity.alpha). (4) Using the uclust function of stat package in R language, UPGMA algorithm (i.e., average clustering method) was used for clustering analysis of the Bray-Curtis distance matrix by default, and the R package ggtree was used for visualization. (5) The VennDiagram package in R software was used to make a Venn diagram according to the ASV/OTU abundance table, and the number of members of each set was counted according to their presence or absence in each sample (group), that is, the number of unique ASVs/OTUs in each group and the number of common ASVs/OTUs among groups (note that it is not an abundance value). The principal component coordinate scores of each sample and each taxon were calculated by R script, combined with the contents of cytokines and SCFAs, and presented in the form of interaction diagram (RDA figure) (RDA was conducted by using Shanghai Personal Gene Cloud Platform, https://www.genescloud.cn/chart/).
2.7. Functional Potential Prediction
The analysis process of PICRUST2 was slightly modified on the basis of Langille et al. [23]. Its important function is to count the metabolic pathway of the microbiota and analyze the differences in metabolic pathways and the species composition of metabolic pathways. The main analysis process was as follows: (1) first, the 16S rRNA gene sequence of the known microbial genome was aligned to construct a new evolutionary tree. (2) Using the castor hidden state prediction algorithm, according to the copy number of the gene family corresponding to the reference sequence in the evolutionary tree, the nearest sequence species of the characteristic sequence was inferred, and then, the copy number of gene family was obtained. (3) The copy number of the gene family of each sample was calculated by combining the abundance characteristic sequences of each sample. (4) Finally, the gene family was “mapped” to various databases, and MinPath was used to infer the existence of metabolic pathways to obtain the abundance data of metabolic pathways in each sample. (5) After obtaining the abundance data of metabolic pathways, the metagenomeSeq package in R software was used to determine the metabolic pathways with significant differences between groups. (6) The functional composition of samples/groups was obtained, and the species composition of the pathways was analyzed by using the hierarchical sample metabolic pathway abundance table (Table S2).
2.8. Correlation Analysis of Cytokines, SCFAS, and Microbiota
In order to analyze the correlation (Pearson correlation) between the microbiota, cytokines, and SCFAs in the three group, we used OmicShare Tools (Pearson correlation analysis was performed using the OmicShare tools, a free online platform for data analysis (https://www.omicshare.com/tools)) online analysis software to analyze the correlation between the first 15 genera and the cytokines and SCFAs in the Con group, HF group, and SF group. The cytokines include TNF-α, IL-1β, IL-6, TGF-β, IL-4, IL-10, and IL-13; the short-chain fatty acids included formic acid, isocaproic acid, heptanoic acid, propanoic acid, isobutyric acid, butyric acid, valeric acid, acetic acid, isovaleric acid, and hexanoic acid.
2.9. Verification the Regulatory Function Soft Feces in Cecal Immune Microenvironment by Coprophagy Prevention Model
ELISA kits were used to detect the contents of TNF-α, IL-1β, IL-4, and IL-10 in the cecal content of CN and CP groups. GC-MS was used to detect acetic acid, propionic acid, and butyric acid in cecal contents of CP and CN groups. Subsequently, the cecal tissues in the CN and CP groups were subjected to HE and immunofluorescence staining to analyze the protein expression levels of ZO-1. In addition, the mRNA and protein expression levels of ZO-1, OCLN, and CLDN1 were measured by qRT-PCR and Western blot, respectively. The Western blot antibody was purchased from Servicebio (Item No. ZO-1: GB111402; Claudin-1: GB112543; Occludin: GB111401). The preparation of paraffin sections refers to Miao et al. [24]. After the sections are prepared, they were placed in a pathology section scanner (Hungary, 3DHISTECH) to collect images with the following parameters: DAPI UV excitation wavelength 330-380 nm, emission wavelength 420 nm, and blue light; CY5 was set to pink light.
2.10. Statistical Analysis
A completely randomized trial design was used in this study. The two groups were statistically analyzed by Student's t test and one-way ANOVA. In high-throughput sequencing, the statistical method between two groups was Student's t test, and three groups or more was one-way ANOVA. An ∗ indicates significant difference, P < 0.05; ∗∗ indicates a very significant difference, P < 0.01; NS indicates that there is no significant difference between the data, i.e., P > 0.05.
3. Results
3.1. Detection Results of Cytokines in Soft and Hard Feces and Cecal Contents
TNF-α, IL-1β, IL-6, TGF-β, IL-4, IL-10, and IL-13 were significantly higher in both the soft and hard feces groups than in the cecal content group; IL-1β, TGF-β, IL-4, and IL-13 contents were higher in the hard feces group than in the soft feces group, and the difference was statistically significant between the two groups (Figures 1(a)–1(g)). The results of PCA showed that there was less dispersion between samples within groups in the cecal content group, and the dispersion between samples within groups in the soft feces and hard feces groups was greater than that in the cecum content group; the samples between the cecum content group, soft feces group, and hard feces group were each independently distributed, with the samples in the soft and hard feces groups being closer together and farther away from the samples of the cecum content group (Figure 1(h)).
Figure 1.
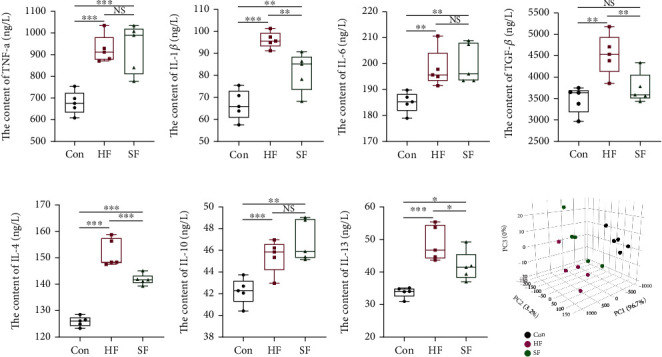
Cytokine content in cecal contents and soft and hard feces. (a–g) The content of cytokines such as TNF-α, IL-1β, IL-6, TGF-β, IL-4, IL-10, and IL-13, respectively, in the cecal contents and soft and hard feces. (h) The three-dimensional PCA diagram of cytokine content in normalized cecal contents and soft and hard feces.
3.2. Detection Results of SCFAs in Soft Feces, Hard Feces, and Cecal Contents
The GC-MS method was used to determine the content of volatile short-chain fatty acids in the three groups, and the results are shown in Figure 2. The contents of isobutyric acid, butyric acid, valeric acid, and isohexanoic acid in the cecal content group were significantly higher than those in the soft feces group and hard feces group (P < 0.05). The contents of acetic acid, isobutyric acid, butyric acid, isovaleric acid, valeric acid, and caproic acid in the soft feces group were significantly higher than those in the hard feces group (P < 0.05). The content of formic acid content in the soft feces group and the hard feces group was significantly higher than that of the cecal content group (P < 0.05), and the content of the hard feces group was higher than that of the soft feces group; the difference was statistically significant (P < 0.05). There was no significant difference in the content of enanthic acid in the cecal content group, soft feces group, and hard feces group (P > 0.05).
Figure 2.
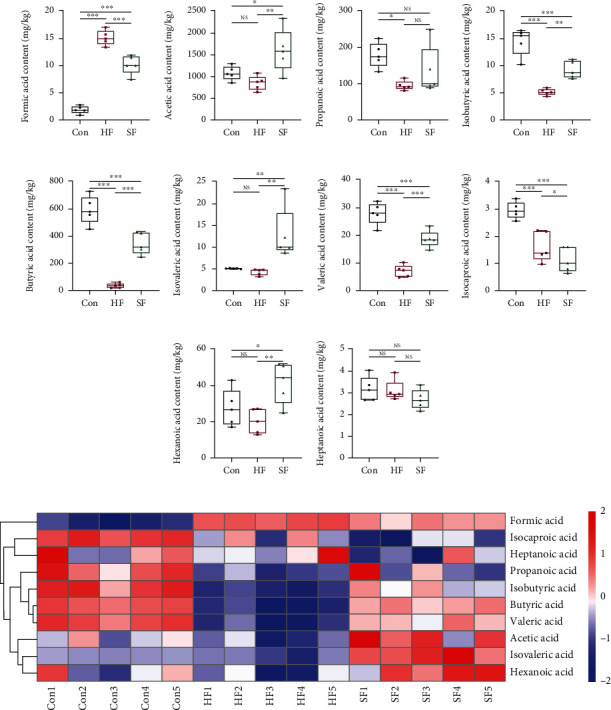
SCFA Content in cecal contents and soft and hard feces. (a–j) The contents of SCFAs such as formic acid, isocaproic acid, heptanoic acid, propanoic acid, isobutyric acid, butyric acid, valeric acid, acetic acid, isovaleric acid, and hexanoic acid in cecal contents and soft and hard feces, respectively. (k) The relative abundance of SCFAs such as formic acid, isocaproic acid, heptanoic acid, propanoic acid, isobutyric acid, butyric acid, valeric acid, acetic acid, isovaleric acid, and hexanoic acid in cecal contents and soft and hard feces in the form of heatmap.
3.3. Species Composition among Soft Feces, Hard Feces, and Cecal Content Groups
Using QIIME software, the composition and abundance distribution of each sample at both the phylum and genus levels were obtained, and the analysis results were represented in the form of a histogram. At the phylum classification level (Figure 3(a)), Firmicutes and Bacteroides were the main phyla of the three groups of samples. The relative abundance of Firmicutes (84.48%) in the soft feces group was significantly higher than that in the hard feces group (69.66%) and cecal content group (56.82%), but the relative abundance of Bacteroides in the soft feces group (8.30%) was significantly lower than that in the hard feces group (26.67%) and cecal content group (38.31%). At the genus level (Figure 3(b)), the relative abundance of Muribaculaceae in the cecal content group (31.17%) and the hard feces group (23.74%) was significantly higher than that of the soft feces group (3.78%) and Ruminococcaceae_NK4A214_group in the soft feces group. The relative abundances of Lachnospiraceae_NK4A136_group, Christensenellaceae_R-7_group, and Subdoligranulum (21.73%, 8.18%, 8.13%, and 7.93%, respectively) in the soft feces group were significantly higher than those of the cecal content group (5.71%, 2.30%, 1.39%, and 1.56%, respectively) and hard fecal group (5.07%, 4.76%, 2.92%, and 1.34%, respectively); the relative abundance of Ruminococcaceae_UCG-014 (12.84%) in the hard feces group was significantly higher than that of the cecal content group (2.80%) and soft feces group (3.39%).
Figure 3.
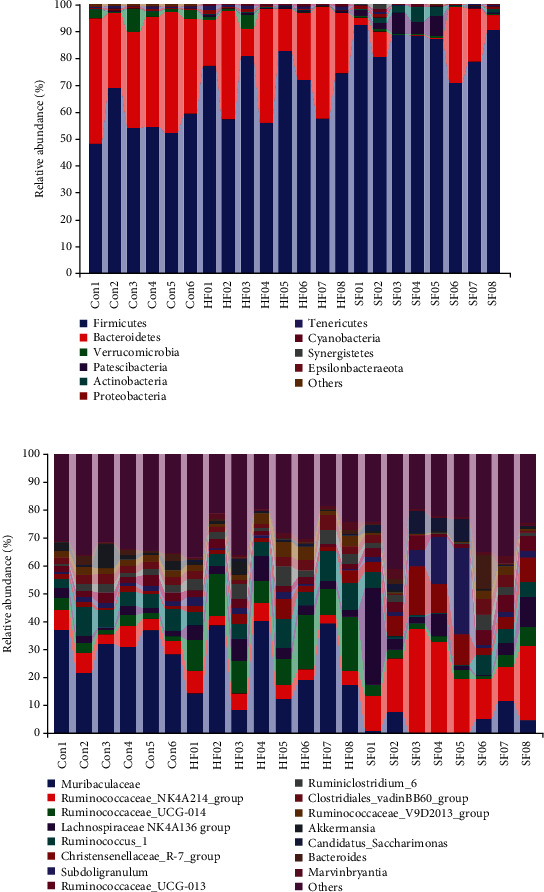
Microbiota composition of cecal contents and soft and hard feces. (a) Composition and distribution of microbiota of cecal contents and soft and hard feces at the phylum level. (b) Composition and distribution of microbiota of cecal contents and soft and hard feces at genus level.
3.4. Alpha and Beta Diversity of Microbiota in Soft Feces, Hard Feces, and Cecal Content Groups
The alpha diversity results are shown in Figure 4(a). The Chao1, Faith's PD, Shannon, Pielou's evenness, and observed species in cecal content group were significantly higher than those in the soft feces group and hard feces group. There was no significant difference in any of the above indices between the soft feces group and the hard feces group (P > 0.05). The sparse curve results of Good's coverage are shown in Figure 4(b). The smoothness of the curves of the three groups of samples reflects the impact of sequencing depth on the diversity of observed samples. The curves of the three groups of samples tended to be gentle, indicating that the sequencing results sufficiently reflected the diversity contained in the current samples. If the sequencing depth had continued to increase, it would have indicated that a large number of new ASV/OTUs had not been found. Then, the dimension of multidimensional microbial data was reduced by principal coordinate analysis (PCoA), and the main trend of data change is displayed by the distribution of samples on the continuous sorting axis. In addition, permutational multivariate analysis of variance (PERMANOVA) was used to identify whether there were significant differences among the three groups of samples. The beta diversity of the three groups of samples was analyzed by the above methods. The results showed that in the PCoA diagram (Figure 4(c)), there was an obvious separation between the samples of the cecal content group, the soft feces group, and the hard feces group, and the dispersion between the samples of the cecal content group was less than that between the samples of soft feces group and hard feces group. The results of difference analysis between groups are shown in Figure 4(c). There was a very significant difference between the cecal content group and the soft and hard feces group (P < 0.05), but there is no significant difference between the soft and hard feces groups (P > 0.05).
Figure 4.
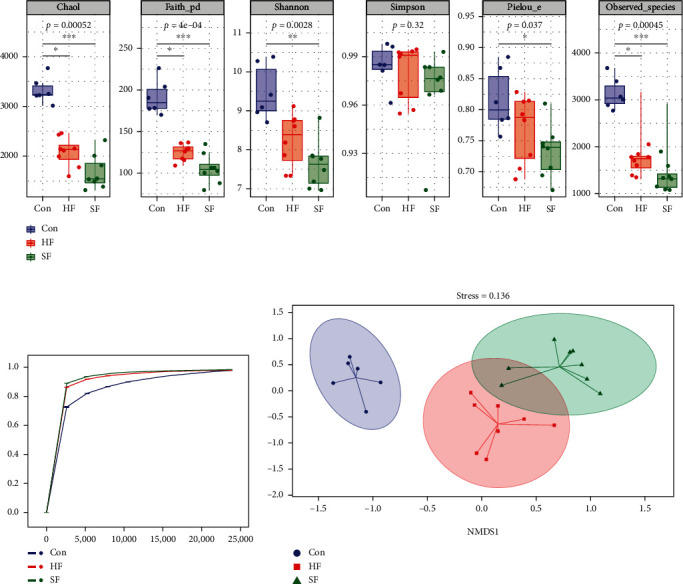
Alpha and beta diversity of cecal contents and soft and hard feces. (a) Alpha diversity of Chao1, observed species, Shannon, Simpson, Faith's PD, and Pielou's evenness in cecal contents and soft and hard feces. (b) Good's coverage sparse curve reflecting the sequencing depth of 16S rRNA gene sequencing. (c) PCoA analysis results of cecal contents and soft and hard feces.
3.5. Species Differences and Marker Analysis
The ASV/OTU abundance table (Table S1) was used to make a Venn diagram of the Con group, the SF group, and the HF group. The three groups of samples had 13,765, 5,442, and 7,344 ASV/OTUs, respectively. Three groups of samples had a total of 623 ASV/OUTs (Figure 5(a)). The RDA results showed that SCFAs were mainly correlated to the Con group and SF group, and cytokines were mainly correlated with the fecal microbiome (HF and SF groups) (Figure 5(b)). The relative abundance of the top 15 bacterial genera in the three groups of samples was drawn using software as shown in Figure 5(c). The relative abundance of Muribaculaceae and Ruminococcus_1 in the Muribaculaceae Con group and the HF group was higher than that in the SF group and Ruminococcaceae_NK4A214_group in the SF group. The relative abundances of Christensenellaceae_R-7_group, Subdoligranulum, and Candidatus_Saccharimonas in the SF group were higher than those in the Con group and the HF group.
Figure 5.
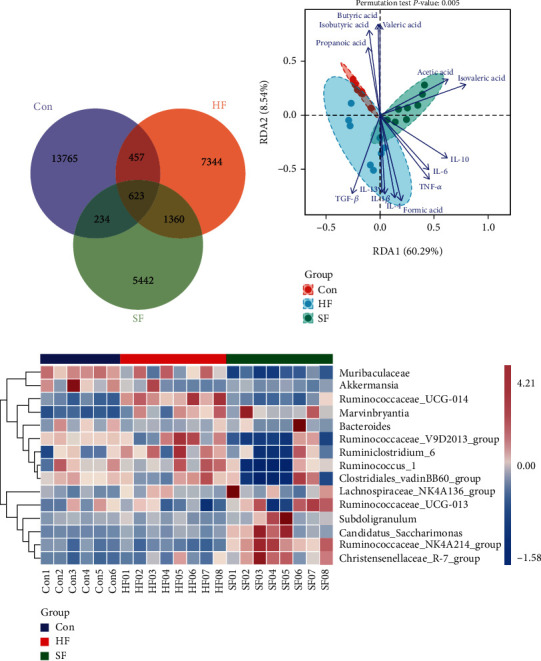
Different species and markers of cecal contents and soft and hard feces. (a) The Wayne diagram drawn by ASV/OUT in three groups of samples of cecal content group and soft and hard feces group. (b) The RDA diagram of correlation analysis between samples of cecal content group and soft and hard feces group and cytokines and SCFAs. (c) Relative abundance of the top 15 bacteria in the cecal content group and soft and hard feces group.
3.6. Functional Potential Predictive Analysis
The relative abundance results of primary and secondary metabolic pathways in the MetaCyc database are shown in Figure 6(a). The relative abundance of pathways related to biosynthesis was high, mainly including amino acid biosynthesis, carbohydrate biosynthesis, coenzyme factor, and vitamin biosynthesis. The relative abundances of enzymes related to the synthesis of acetic acid, propionic acid, and butyrate in the three groups were further analyzed. The relative abundances of acetic acid synthase such as EC: 6.3.4.3, EC: 1.5.1.20, EC: 2.3.1.54, and EC: 2.3.1.169 in the soft feces group were significantly higher than those in the Con group (Figure 6(b)). For propionate synthase, the relative abundance of the EC: 2.7.1.1 enzyme in the soft feces group was significantly higher than that in the Con group (Figure 6(c)). Among butyrate synthases, the relative abundances of EC: 2.3.1.9, EC: 4.2.1.17, EC: 1.3.8.1, and EC: 2.8.3.8 in the soft feces group were significantly higher than those in the Con group (Figure 6(d)). After obtaining the abundance data of metabolic pathways, metagenomeSeq was used to figure out the metabolic pathways with significant differences among the three groups. As shown in Figures 6(e) and 6(f), the upregulated metabolic pathways in the hard fecal group were PWY-7198 and PWY-7210 compared with the cecal content group, and the upregulated metabolic pathways in the soft fecal group were PWY-7198, PWY-7210, P341-PWY, and P123-PWY compared with the cecal content group; that is, P341-PWY and P123-PWY were upregulated in soft feces group relative to hard feces group. Finally, according to the significantly different metabolic pathways, the hierarchical sample metabolic pathway abundance table (Table S2) is used to analyze the species composition of different pathways. The results are shown in Figures 6(g) and 6(h). The P125-PWY pathway is superpathway of (R,R)-butanediol biosynthesis, in which the relative abundance of Christensenellaceae_R-7_group in the soft feces group is higher than that of the cecal content group and the hard feces group; the P341-PWY pathway is glycolysis V (Pyrococcus), of which the soft feces group and the hard feces group. The relative abundance of Lachnoclostridium in the group was higher than that of the cecal content group.
Figure 6.
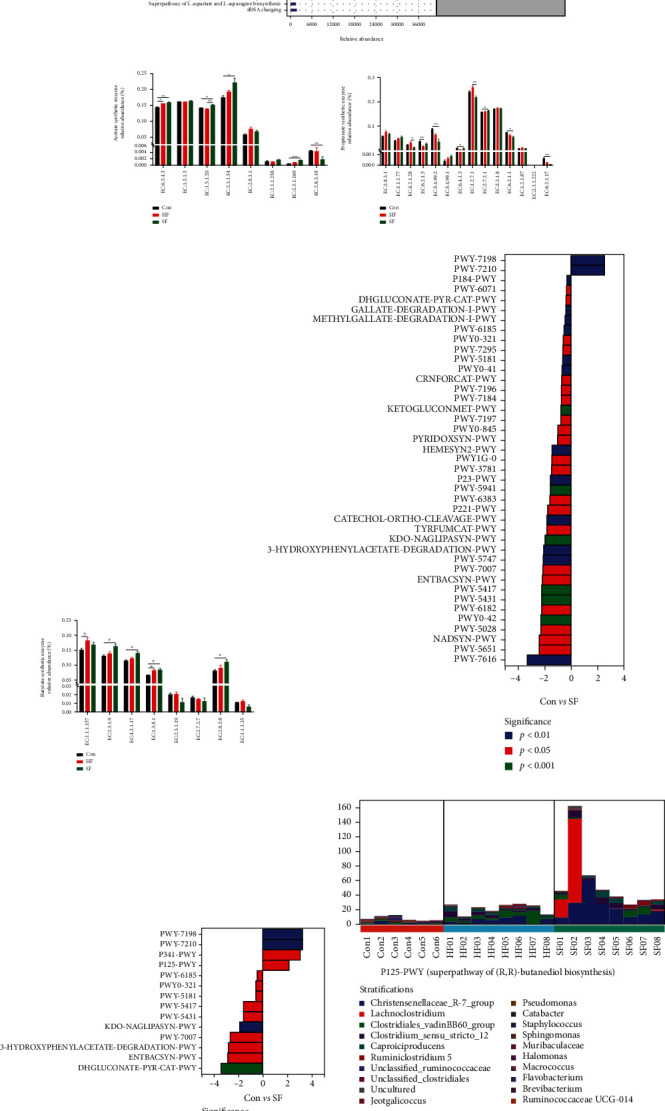
Functional potential prediction of microbiota in cecal contents and soft and hard feces. (a) The analysis results of the MetaCyc metabolic pathway including various pathways involved in primary and secondary metabolism and related metabolites, biochemical reactions, enzymes, and genes. (b) The relative abundance of enzymes related to acetic acid synthase in the cecal content group and soft and hard feces group. (c) The relative abundance of propionate synthase-related enzymes in the cecal content group and soft and hard feces group. (d) The relative abundance of butyrate synthase-related enzymes in cecal content group and soft and hard feces group. (e) Different metabolic pathway between cecal content group and hard fecal group. (f) Different metabolic pathway between cecal content group and soft feces group. (g, h) The species composition of upregulated metabolic pathways such as P341-PWY and P123-PWY in soft feces group compared with the hard feces group.
3.7. Correlation Analysis of Cytokines, SCFAs, and Microbiota
The correlation analysis results of SCFAs and the microbiota are shown in Figure 7(a). Among them, Ruminococcaceae_NK4A214_group had a significant positive correlation with acetic acid, butyric acid, isobutyric acid, isovaleric acid, and hexanoic acid; Christensenellaceae_R-7_group had a positive correlation with acetic acid, butyric acid, isobutyric acid, isovaleric acid, and hexanoic acid; Muribaculaceae has a significant positive correlation with isocaproic acid; and Ruminococcaceae_UCG-014 had a significant negative correlation with acetic acid, propionic acid, isobutyric acid, butyric acid, valeric acid, and caproic acid. The results of the correlation analysis between cytokines and the top 15 most abundant bacteria in the three groups of samples are shown in Figure 7(b). Muribaculaceae has a significant positive correlation with IL-1β, IL-4, and TGF-β; in contrast, Candidatus_Saccharimonas has a significant negative correlation with IL-1β, IL-4, and TGF-β.
Figure 7.
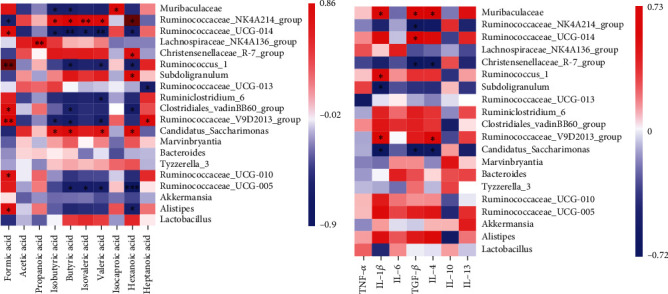
Correlation analysis between SCFAs, cytokines, and different microbiota. (a) The correlation analysis between the bacteria with the top 15 relative abundance and SCFAs. (b) Correlation analysis between the bacteria with the top 15 relative abundance and cytokines.
3.8. Effect of Coprophagy Prevention on the Cecal Immune Microenvironment
After coprophagy prevention, the cytokines TNF-α and IL-1β significantly increased, whereas the cytokines IL-4 and IL-10 significantly decreased (Figure 8(a)). After coprophagy prevention, the contents of propionic acid and butyric acid were significantly lower than those in the control group (P < 0.01 or P < 0.001), and there was no significant difference in the content of acetic acid between the two groups (P > 0.05) (Figure 8(b)). HE staining showed that the intestinal mucosa in the CP group was damaged (Figure 8(c)). In addition, based on the results of HE staining, the intestinal samples of the CN group and CP group were scored for inflammation (Figure 8(d)). The results showed that the inflammation score of the CP group was significantly higher than that of the CN group (P < 0.001). qRT-PCR results showed that the mRNA expression levels of ZO-1, OCLN, and CLDN1 in the CP group were significantly lower than those in the CN group (P < 0.05 or P < 0.01 or P < 0.001) (Figure 8(e)). The staining degree of ZO-1 protein (purple) in the CP group was shallower (compared with that in the CN group), indicating that the abundance of ZO-1 protein in the CP group was lower (Figures 8(f) and 8(g)). Moreover, the Western blot results were consistent with the qRT-PCR results. The protein expression levels of ZO-1, Occludin, and Claudin1 in the CP group were significantly lower than those in the CN group (P < 0.01 or P < 0.001) (Figures 8(h) and 8(i)).
Figure 8.
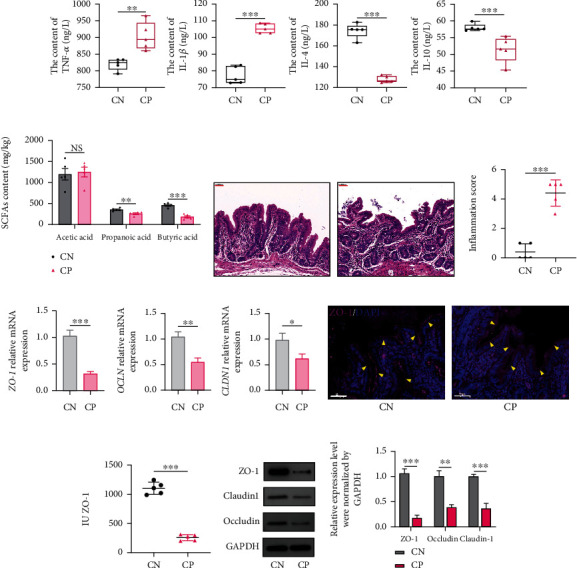
Effect of coprophagy prevention on cytokines and tight junction proteins in cecal contents. (a) Changes in cytokines such as TNF-α, IL-1β, IL-4, and IL-10 in the contents of the cecum after coprophagy prevention. (b) Changes in SCFAs in cecal contents after coprophagy prevention. (c) HE staining. (d) Immunological score analysis and staining results. (e) The mRNA expression levels of ZO-1, OCLN, and CLDN1. (f) Immunofluorescence staining to analyze the changes in the expression levels of ZO-1. (g) Fluorescence analysis results of ZO-1. (h) WB analysis of ZO-1, Claudin-1, and Occludin protein expression levels. (i) Grayscale analysis of ZO-1, Claudin-1, and Occludin protein expression levels.
4. Discussion
Due to the special colon separation mechanism of rabbits, they can produce two different forms of feces: soft feces and hard feces [25, 26]. There are many nutrients in soft feces, and rabbits begin eating soft feces at a very early age. This behavior aids in prolonging the retention time of food in the digestive tract and improving the utilization rate of nutrients in food [27–29]. The chemical composition of soft feces is similar to that of the cecal contents, and there are a large number of microorganisms in both of them. These microorganisms can produce a variety of enzymes and SCFAs and play an important role in improving rabbit growth performance and immune function [5, 30]. In this study, the combination analysis of microbiome and metabolome was performed to explore the difference in microbial diversity, SCFAs, and cytokine concentration of cecal contents, soft feces, and hard feces in Hyplus rabbit; our results help better understand the key regulatory metabolic pathways, key flora, and their metabolites and play an important role in clarifying the molecular mechanism of soft feces in rabbit growth, intestinal development, and immune regulation.
The value of Firmicutes/Bacteroides may be related to obesity and emaciation in the host [31–33]. In this study, the relative abundance of Muribaculaceae in the Con group and the HF group was higher than that in the SF group at the genus classification level. The relative abundance of this genus brings about a very important impact on host intestinal development and health. The increase in Akkermansiaceae and the decrease in Muribaculaceae can promote the healthy development of bones [34]. Additionally, Akkermansiaceae, especially Akkermansia muciniphila, plays a protective role in diet-induced obesity and other diseases [35]. Moreover, the relative abundance of the specific genus Ruminococcaceae_NK4A214_group was reduced in the HF group, and it was significantly correlated with bile acid and vitamin A levels, which is proved to be vital for the treatment of rats with ulcerative colitis [36]. Christensenellaceae_R-7_group as a probiotic is significantly negatively correlated with body mass index (BMI) and inflammation and metabolic diseases such as IBD and metabolic syndrome [37]. Through association analysis (microbiome and metabolomics analysis), it was confirmed that Muribaculaceae, Christensenellaceae_R-7_group, and Ruminococcaceae_NK4A214_group have a strong positive correlation with SCFAs and IL-10, and they have a strong negative correlation with TNF-α, IL-1β, and TGF-β. Candidatus_Saccharimonas has a strong negative correlation with IL-1β, TGF-β, and IL-4. These results show that there are abundant genes (microorganisms) that can synthesize SCFAs (acetic acid, propionic acid, and butyric acid) in soft feces, which may be the key for promoting growth and development and resisting external environmental interference [38, 39]. These findings may also help explaining why the host can improve the digestion and absorption efficiency of feed and help uncovering the underlying mechanism that eating soft feces helps maintaining the normal microbiota of the digestive tract and alleviates nutritional diseases.
After coprophagy prevention, the content of IL-4 and IL-10 in the cecal contents decreased, and the content of TNF-α and IL-1β increased, which further verified that some microorganisms in soft feces can increase the expression level of cytokines associated with anti-inflammation and reduce the expression level of cytokines involved in the process of inflammation. The intestinal mucosa is a physical barrier against invading intraluminal pathogens and toxins [40, 41]. The results of immunofluorescence staining further confirmed that coprophagy prevention caused damage to the intestinal mucosa, indicating the importance of soft feces in maintaining the intestinal immune microenvironment. Moreover, HE and immunofluorescence staining showed that intestinal inflammation occurred, the ring structure of ZO-1 was destroyed, and the expression of tight junction associated proteins decreased significantly after coprophagy prevention. The tight junctions (TJs) mainly maintain the integrity of the epithelial barrier by regulating the paracellular permeability [42]. The expression level of intestinal TJ proteins is closely related to the integrity of the intestinal barrier, which has an important impact on the balance of the intestinal environment and even body health. In the process of coprophagy prevention, the body suddenly interrupted the intake of probiotics, SCFAs, and cytokines in the external environment. Over time, the homeostasis of the intestinal environment is disrupted, leading to diseases such as enteritis and intestinal leakage.
5. Conclusions
Soft feces are rich in beneficial microorganisms (Muribaculaceae, Ruminococcaceae_NK4A214_group, and Christensenellaceae_R-7_group) and their metabolites (SCFAs and cytokines). Feeding on soft feces plays a very important role in improving the immune microenvironment of the cecum.
Acknowledgments
This research was funded by the National Key Research and Development Program of China (2018YFD0502203), Special Fund for Henan Agriculture Research System (HARS-22-13-G1), and “Special Fund for the Construction of National Modern Agricultural Industrial Park of Biyang County (NMAIP-BY-S01)”.
Contributor Information
Ming Li, Email: liming@henau.edu.cn.
Huifen Xu, Email: huifen221@126.com.
Data Availability
The raw sequence files were deposited to the National Center for Biotechnology Information Sequence Read Archive with accession number PRJNA774036.
Disclosure
The funders had no role in the study design, data collection, and interpretation or the decision to submit the work for publication.
Conflicts of Interest
The authors declare that there are no conflicts of interest.
Authors' Contributions
YN, YW, SX, and YJ contributed in the data curation. CG, HH, MN, and LY contributed in the methodology. ZL and MS contributed in the visualization. ZL contributed in the writing of the original draft. ZL and HX contributed in the writing, reviewing, and editing of the paper; HX and ML contributed in the supervision, resources, and funding acquisition of the paper.
Supplementary Materials
Table S1: the ASV/OTU abundance table.
Table S2: the hierarchical sample metabolic pathway abundance table.
Table S3: primer information used in this study.
References
- 1.Wang Y. B., Xu L. P., Sun X. L., et al. Characteristics of the fecal microbiota of high- and low-yield hens and effects of fecal microbiota transplantation on egg production performance. Research in Veterinary Science . 2020;129:164–173. doi: 10.1016/j.rvsc.2020.01.020. [DOI] [PubMed] [Google Scholar]
- 2.Flint H. J., Bayer E. A., Rincon M. T., Lamed R., White B. A. Polysaccharide utilization by gut bacteria: potential for new insights from genomic analysis. Nature Reviews Microbiology . 2008;6(2):121–131. doi: 10.1038/nrmicro1817. [DOI] [PubMed] [Google Scholar]
- 3.Fang W., Fang Z., Zhou P., et al. Evidence for lignin oxidation by the giant panda fecal microbiome. PLoS One . 2012;7(11, article e50312) doi: 10.1371/journal.pone.0050312. [DOI] [PMC free article] [PubMed] [Google Scholar]
- 4.Zhu L., Wu Q., Dai J., Zhang S., Wei F. Evidence of cellulose metabolism by the giant panda gut microbiome. Proceedings of the National Academy of Sciences . 2011;108(43):17714–17719. doi: 10.1073/pnas.1017956108. [DOI] [PMC free article] [PubMed] [Google Scholar]
- 5.Tremaroli V., Backhed F. Functional interactions between the gut microbiota and host metabolism. Nature . 2012;489(7415):242–249. doi: 10.1038/nature11552. [DOI] [PubMed] [Google Scholar]
- 6.Liu W. C., Guo Y., An L. L., Zhao Z. H. Protective effects of dietary betaine on intestinal barrier function and cecal microbial community in indigenous broiler chickens exposed to high temperature environment. Environmental Science and Pollution Research . 2021;28(9):10860–10871. doi: 10.1007/s11356-020-11326-6. [DOI] [PubMed] [Google Scholar]
- 7.Xu L. P., Sun X. L., Wan X. H., et al. Dietary supplementation with Clostridium butyricum improves growth performance of broilers by regulating intestinal microbiota and mucosal epithelial cells. Animal Nutrition . 2021;7(4):1105–1114. doi: 10.1016/j.aninu.2021.01.009. [DOI] [PMC free article] [PubMed] [Google Scholar]
- 8.Cash H. L., Whitham C. V., Behrendt C. L., Hooper L. V. Symbiotic bacteria direct expression of an intestinal bactericidal lectin. Science . 2006;313(5790):1126–1130. doi: 10.1126/science.1127119. [DOI] [PMC free article] [PubMed] [Google Scholar]
- 9.Cryan J. F., Dinan T. G. Mind-altering microorganisms: the impact of the gut microbiota on brain and behaviour. Nature Reviews Neuroscience . 2012;13(10):701–712. doi: 10.1038/nrn3346. [DOI] [PubMed] [Google Scholar]
- 10.Bravo J. A., Forsythe P., Chew M. V., et al. Ingestion of Lactobacillus strain regulates emotional behavior and central GABA receptor expression in a mouse via the vagus nerve. Proceedings of the National Academy of Sciences . 2011;108(38):16050–16055. doi: 10.1073/pnas.1102999108. [DOI] [PMC free article] [PubMed] [Google Scholar]
- 11.Bo T. B., Zhang X. Y., Kohl K. D., Wen J., Tian S. J., Wang D. H. Coprophagy prevention alters microbiome, metabolism, neurochemistry, and cognitive behavior in a small mammal. The ISME Journal . 2020;14(10):2625–2645. doi: 10.1038/s41396-020-0711-6. [DOI] [PMC free article] [PubMed] [Google Scholar]
- 12.Barnes R. H. Nutritional implications of coprophagy. Nutrition Reviews . 1962;20:289–291. doi: 10.1111/j.1753-4887.1962.tb04498.x. [DOI] [PubMed] [Google Scholar]
- 13.Wang Y. D., Sun S. J., Xue M. M., et al. Effect of fasting caecotrophy on growth performance, fur quality, slaughter index, lipid metabolism and cecal microbes of New Zealand white rabbits. Chinese Journal of Veterinary Science . 2019;39(7):1388–1393. [Google Scholar]
- 14.Kerti A., Bárdos L., Deli J., Oláh P. Relationship of retinoid and carotenoid metabolism with caecotrophy in rabbits. Acta Veterinaria Hungarica . 2005;53(3):309–318. doi: 10.1556/avet.53.2005.3.4. [DOI] [PubMed] [Google Scholar]
- 15.Combes S., Gidenne T., Cauquil L., Bouchez O., Fortun-Lamothe L. Coprophagous behavior of rabbit pups affects implantation of cecal microbiota and health status. Journal of Animal Science . 2014;92(2):652–665. doi: 10.2527/jas.2013-6394. [DOI] [PubMed] [Google Scholar]
- 16.Klaasen H. L., Koopman J. P., Scholten P. M., van den Brink M. E., Theeuwes A. G. M. Effect of preventing coprophagy on colonisation by segmented filamentous bacteria in the small bowel of mice. Microbial Ecology in Health and Disease . 1990;3(2):99–103. doi: 10.3109/08910609009140123. [DOI] [Google Scholar]
- 17.Soave O., Brand C. D. Coprophagy in animals: a review. The Cornell Veterinarian . 1991;81(4):357–364. [PubMed] [Google Scholar]
- 18.Kovács M., Szendro Z., Milisits G., et al. Effect of nursing methods and faeces consumption on the development of the bacteroides, lactobacillus and coliform flora in the caecum of the newborn rabbits. Reproduction Nutrition Development . 2006;46(2):205–210. doi: 10.1051/rnd:2006010. [DOI] [PubMed] [Google Scholar]
- 19.Jin Y. Q., Chen G., Xiao W. M., et al. Sequencing XMET genes to promote genotype-guided risk assessment and precision medicine. Science China . 2019;62(7):895–904. doi: 10.1007/s11427-018-9479-5. [DOI] [PMC free article] [PubMed] [Google Scholar]
- 20.Li H. Q., Zhou Y., Ling H. Y., Luo L., Qi D., Feng L. The effect of dietary supplementation with Clostridium butyricum on the growth performance, immunity, intestinal microbiota and disease resistance of tilapia (Oreochromis niloticus) PLoS One . 2019;14(12, article e0223428) doi: 10.1371/journal.pone.0223428. [DOI] [PMC free article] [PubMed] [Google Scholar]
- 21.Chichlowski M., Bokulich N., Harris C. L., et al. Effect of bovine Milk Fat Globule Membrane and Lactoferrin in infant formula on gut microbiome and metabolome at 4 months of age. Current Developments in Nutrition . 2021;5(5, article nzab027) doi: 10.1093/cdn/nzab027. [DOI] [PMC free article] [PubMed] [Google Scholar]
- 22.Deng Y., Tang D., Hou P., et al. Dysbiosis of gut microbiota in patients with esophageal cancer. Microbial Pathogenesis . 2021;150, article 104709 doi: 10.1016/j.micpath.2020.104709. [DOI] [PubMed] [Google Scholar]
- 23.Langille M. G., Zaneveld J., Caporaso J. G., et al. Predictive functional profiling of microbial communities using 16S rRNA marker gene sequences. Nature Biotechnology . 2013;31(9):814–821. doi: 10.1038/nbt.2676. [DOI] [PMC free article] [PubMed] [Google Scholar]
- 24.Miao X., Wang Z., Chen B., et al. miR-140-5p suppresses retinoblastoma cell proliferation, migration, and invasion by targeting CEMIP and CADM3. Cellular and Molecular Biology . 2018;64(6):42–47. doi: 10.14715/cmb/2018.64.6.8. [DOI] [PubMed] [Google Scholar]
- 25.Franz R., Kreuzer M., Hummel J., Hatt J. M., Clauss M. Intake, selection, digesta retention, digestion and gut fill of two coprophageous species, rabbits (Oryctolagus cuniculus) and guinea pigs (Cavia porcellus), on a hay-only diet. Journal of Animal Physiology and Animal Nutrition . 2011;95(5):564–570. doi: 10.1111/j.1439-0396.2010.01084.x. [DOI] [PubMed] [Google Scholar]
- 26.Guerra Aldrigui L., Nogueira‐Filho S. L., Altino V. S., Mendes A., Clauss M., Nogueira S. S. Direct and indirect caecotrophy behaviour in paca (Cuniculus paca) Journal of Animal Physiology and Animal Nutrition . 2018;102(6):1774–1782. doi: 10.1111/jpn.12961. [DOI] [PubMed] [Google Scholar]
- 27.Heijtz R. D., Wang S., Anuar F., et al. Normal gut microbiota modulates brain development and behavior. Proceedings of the National Academy of Sciences . 2011;108(7):197–199. doi: 10.1073/pnas.1010529108. [DOI] [PMC free article] [PubMed] [Google Scholar]
- 28.Al-Asmakh M., Anuar F., Zadjali F., Rafter J., Pettersson S. Gut microbial communities modulating brain development and function. Gut Microbes . 2012;3(4):366–373. doi: 10.4161/gmic.21287. [DOI] [PMC free article] [PubMed] [Google Scholar]
- 29.Den Besten G., Van Eunen K., Groen A. K., Venema K., Reijngoud D. J., Bakker B. M. The role of short-chain fatty acids in the interplay between diet, gut microbiota, and host energy metabolism. Journal of Lipid Research . 2013;54(9):2325–2340. doi: 10.1194/jlr.R036012. [DOI] [PMC free article] [PubMed] [Google Scholar]
- 30.Ziętak M., Kovatcheva-Datchary P., Markiewicz L. H., Ståhlman M., Kozak L. P., Bäckhed F. Altered microbiota contributes to reduced diet-induced obesity upon cold exposure. Cell Metabolism . 2016;23:1216–1223. doi: 10.1016/j.cmet.2016.05.001. [DOI] [PMC free article] [PubMed] [Google Scholar]
- 31.Bäckhed F., Ding H., Wang T., et al. The gut microbiota as an environmental factor that regulates fat storage. Proceedings of the National Academy of Sciences . 2004;101(44):15718–15723. doi: 10.1073/pnas.0407076101. [DOI] [PMC free article] [PubMed] [Google Scholar]
- 32.Turnbaugh P. J., Ley R. E., Mahowald M. A., Magrini V., Mardis E. R., Gordon J. I. An obesity-associated gut microbiome with increased capacity for energy harvest. Nature . 2006;444(7122):1027–1031. doi: 10.1038/nature05414. [DOI] [PubMed] [Google Scholar]
- 33.Ley R. E., Turnbaugh P. J., Klein S., Gordon J. I. Human gut microbes associated with obesity. Nature . 2006;444(7122):1022–1023. doi: 10.1038/4441022a. [DOI] [PubMed] [Google Scholar]
- 34.Chevalier C., Kieser S., Çolakoğlu M., et al. Warmth prevents bone loss through the gut microbiota. Cell Metabolism . 2020;32(4):575–590.e7. doi: 10.1016/j.cmet.2020.08.012. [DOI] [PMC free article] [PubMed] [Google Scholar]
- 35.Liu Y., Yang K., Jia Y., et al. Gut microbiome alterations in high-fat-diet-fed mice are associated with antibiotic tolerance. Nature Microbiology . 2021;6(7):874–884. doi: 10.1038/s41564-021-00912-0. [DOI] [PubMed] [Google Scholar]
- 36.Zhang T., Sun P., Geng Q., et al. Disrupted spermatogenesis in a metabolic syndrome model: the role of vitamin A metabolism in the gut–testis axis. Gut . 2022;71(1):78–87. doi: 10.1136/gutjnl-2020-323347. [DOI] [PMC free article] [PubMed] [Google Scholar]
- 37.Waters J. L., Ley R. E. The human gut bacteria Christensenellaceae are widespread, heritable, and associated with health. BMC Biology . 2019;17(1):p. 83. doi: 10.1186/s12915-019-0699-4. [DOI] [PMC free article] [PubMed] [Google Scholar]
- 38.Dalile B., Van Oudenhove L., Vervliet B., Verbeke K. The role of short-chain fatty acids in microbiota-gut-brain communication. Nature Reviews Gastroenterology & Hepatology . 2019;16(8):461–478. doi: 10.1038/s41575-019-0157-3. [DOI] [PubMed] [Google Scholar]
- 39.Markowiak-Kopeć P., Śliżewska K. The effect of probiotics on the production of short-chain fatty acids by human intestinal microbiome. Nutrients . 2020;12(4):p. 1107. doi: 10.3390/nu12041107. [DOI] [PMC free article] [PubMed] [Google Scholar]
- 40.Bansal V., Costantini T., Kroll L., et al. Traumatic brain injury and intestinal dysfunction: uncovering the neuro-enteric axis. Journal of Neurotrauma . 2009;26(8):1353–1359. doi: 10.1089/neu.2008.0858. [DOI] [PMC free article] [PubMed] [Google Scholar]
- 41.Pfannkuche H., Gäbel G. Glucose, epithelium, and enteric nervous system: dialogue in the dark. Journal of Animal Physiology and Animal Nutrition . 2009;93:277–286. doi: 10.1111/j.1439-0396.2008.00847.x. [DOI] [PubMed] [Google Scholar]
- 42.Takuya S. Regulation of intestinal epithelial permeability by tight junctions. Cellular and Molecular Life Sciences . 2013;70:631–659. doi: 10.1007/s00018-012-1070-x. [DOI] [PMC free article] [PubMed] [Google Scholar]
Associated Data
This section collects any data citations, data availability statements, or supplementary materials included in this article.
Supplementary Materials
Table S1: the ASV/OTU abundance table.
Table S2: the hierarchical sample metabolic pathway abundance table.
Table S3: primer information used in this study.
Data Availability Statement
The raw sequence files were deposited to the National Center for Biotechnology Information Sequence Read Archive with accession number PRJNA774036.


