

Abstract
Adult T-cell leukemia and lymphoma (ATLL) is an intractable T-cell neoplasia caused by a retrovirus, namely human T-cell leukemia virus type 1 (HTLV-1). Patients suffering from ATLL present a poor prognosis and have a dearth of treatment options. In contrast to the sporadic expression of viral transactivator protein Tax present at the 5’ promoter region long terminal repeats (LTR), HTLV-1 bZIP gene (HBZ) is encoded by 3’LTR (the antisense promoter) and maintains its constant expression in ATLL cells and patients. The antisense promoter is associated with selective retroviral gene expression and has been an understudied phenomenon. Herein, we delineate the activity of transcription factor MEF (myocyte enhancer factor)-2 family members, which were found to be enriched at the 3'LTR and play an important role in the pathogenesis of ATLL. Of the four MEF isoforms (A to D), MEF-2A and 2C were highly overexpressed in a wide array of ATLL cell lines and in acute ATLL patients. The activity of MEF-2 isoforms were determined by knockdown experiments that led to decreased cell proliferation and regulated cell cycle progression. High enrichment of MEF-2C was observed at the 3'LTR along with cofactors Menin and JunD resulting in binding of MEF-2C to HBZ at this region. Chemical inhibition of MEF-2 proteins resulted in the cytotoxicity of ATLL cells in vitro and reduction of proviral load in a humanized mouse model. Taken together, this study provides a novel mechanism of 3’LTR regulation and establishes MEF-2 signaling a potential target for therapeutic intervention for ATLL.
Introduction
The development of adult T-cell leukemia and lymphoma (ATLL) is attributed to human T-cell leukemia virus type 1 (HTLV-1) infection,1,2 which infects an estimated 20 million people worldwide,3 with a recent outbreak among aboriginal populations in central Australia.4 HTLV-1 is endemic to regions of southwestern Japan, South American countries, equatorial Africa, and small groups in the Middle East.5,6 HTLV-1 possesses common retroviral genes (gag, pol, env) and some regulatory genes such as transactivation protein Tax and HTLV-1 bZIP factor (HBZ). Tax along with other viral genes are expressed through promoter activity from the 5’LTR (long terminal repeats) region. The only protein encoded on the negative strand and transcribed from the 3’LTR is HBZ.7 ATLL cells from patients frequently express HBZ8 while other viral proteins are transcriptionally repressed.9-11 HBZ inhibits Tax-mediated viral transcription from the 5’LTR via interactions with CREB/ATF that impede their DNA binding ability and prevents binding to Tax at the 5’LTR.12 HBZ also interacts with AP-1 transcription factor family members including c-Jun, JunB, and JunD, and modulates their transcriptional activity.13
Previously, we showed that a member of the Myocyte enhancer factor transcription family, MEF-2A, interacts directly with Tax at the 5’LTR and recruits transcriptional machinery such as CREB/p300 while disassociating the repressive histone deacetylase (HDAC) complex to promote viral gene expression and T-cell proliferation.14 MEF-2 is a member of the MCM-Agamous-Deficiens-Serum response factor (MADS) box group of transcription factors. The MEF-2 family consists of four isoforms (A to D, reviewed in15), which are well studied in the development of skeletal, cardiac, and neural tissues. Interestingly, some of these isoforms play critical roles in T-cell development by regulating the transcription of the T-cell growth factor interleukin-2 (IL-2).16 MEF-2 dysregulation has been implicated in several T-cell leukemias/lymphomas including peripheral T-cell lymphoma (PTCL)17 and T-cell acute lymphoblastic leukemia (T-ALL).18
In the study presented herein, we demonstrate the gene and protein level expression patterns of MEF-2 isoforms in multiple ATLL cell lines, and in a specific ATLL cohort termed North American (NA)-ATLL, who exhibit acute clinical manifestations with higher rates of aggressive subtypes compared to chronic counterparts.19 NA-ATLL patients demonstrate chemoresistance and a distinct pattern of somatic mutations.20 Most patients in this cohort showed drastically higher expression of MEF-2A and MEF-2C. The transient silencing of both isoforms decreased Tax and HBZ expression in ATLL cells. Similarly, chemical inhibition of MEF-2 by MC1568, a selective class I HDAC inhibitor known to suppress its activity,21-23 caused cytotoxicity exclusively in HTLV-1-infected T cells along with the downregulation of viral proteins in a MEF-2-dependent manner. Similarly, in HTLV-1-infected humanized mice, MC1568 exposure led to a reduction in the proviral load and viral gene expression. MEF-2 genes are required for G0/G1 transition in response to growth factor stimulation.24 Consequently, the suppression of MEF-2A and MEF-2C expression led to a decrease in proliferation and cell cycle arrest of ATLL cells suggesting its involvement in ATLL pathogenesis. In order to further tease out the molecular mechanisms underlying MEF-2 activity in ATLL, we examined direct interactions of MEF-2A/C with HBZ and their recruitment to the 3’LTR along with Menin, a tumor suppressor protein. Together, these proteins assembled at the 3’LTR along with MEF-2A and MEF-2C provide a novel mechanism of transcriptional regulation of HBZ at the antisense promotor regulation of HTLV-1 gene expression. Collectively, this study sheds light on the complex mechanism of ATLL pathogenesis, HTLV-1 gene regulation from the 3’LTR and establishes MEF-2 signaling as a potential target for therapeutic intervention for treatment of ATLL.
Methods
Patient samples and primary cells
Samples from NA-ATLL patients were obtained from the Albert Einstein College of Medicine (NY, USA) as published before.19,20,25 In addition, samples from nine HTLV-1-associated myelopathy/tropical spastic paraparesis (HAM/TSP) patients (82% female) and ten asymptomatic HTLV-1-infected individuals (60% female) were studied. These were followed up at a reference outpatient clinic of Infectious and Parasitic Diseases Service (DIP) at the Hospital Universitário Oswaldo Cruz (HUOC/UPE), located in Recife, Pernambuco, Brazil. HAM/TSP was diagnosed according to World Health Organization guidelines. Samples from ten non-infected healthy Brazilian individuals (70% female) were also included in this study. HTLV-1 serological screening and confirmation was performed at HEMOPE Blood Bank Center, in Recife, Brazil. Infection was additionally confirmed at Fiocruz-PE Institute, also in Recife, Brazil, through quantitative polymerase chain reaction (qPCR) using a previously described protocol.26 Samples were blinded throughout the study and categorized as control/seronegative, asymptomatic carriers (AC), ATLL, and HAM/TSP. The median age range for females and males was: 46-49 and 38-45 (control); 42-43 and 37.5-60 (AC); 48-49 and 38-53 (ATLL); 45-48 and 46-59 (HAM/ TSP), respectively. As for ATLL group, we used ten samples with case ID/Genoptix ID: Pt-4a, Pt-5a, Pt-7a, Pt-15a, Pt-16b, Pt-30a, Pt-32a, ATL30, ATL21, ATL18 as seen in19. Detailed characteristics of ATLL patient samples are mentioned in the supplementary of19. HTLV-1 proviral load measurement and determination, molecular and immunological methods such as immunoblots, immunoprecipitation, flow cytometry, reverse transcription qPCR (RT-qPCR), and chromatin-immunoprecipitation are provided in the Online Supplementary Appendix. The primers and antibodies used in RT-qPCR, western blotting and chromatin immunoprecipitation (ChIP) assays are also provided in various tabular forms in the Online Supplementary Appendix.
Ethics statement
This manuscript utilizes patient-derived samples and blinded data from the Albert Einstein College New York from a retrospective study. The patient cohort has been published before and was handled according to the Institutional Ethics Committee approval.
Results
MEF-2A and MEF-2C are the two predominantly expressed isoforms in HTLV-1-infected/adult T-cell leukemia and lymphoma cell lines
All cell lines were maintained at minimum 85% viability to ensure the utilization of exponential growth phase culture (Online Supplementary Figure S1A). Standard curve-based analysis revealed that non-virus-producing cell lines (SP, ATL-2S, ATL-55T, ATL-ED and M8166) contained lower copies of HTLV-1 provirus Online Supplementary Figure S1B and C), whereas virus-producing cell lines (MT-2, MT-4 and SLB-1) contained higher copy numbers. Western blot analysis showed comparable HBZ expression across all cell lines tested (Online Supplementary Figure S1D). Tax was mostly observed in viral-producing like cell lines such as MT-2, MT-4 and SLB-1 with the exception of ATL-2S and M8166, which displayed Tax expression at higher levels. Extracellular secretion of p19 confirmed the viral-producing status of MT-2, MT-4 and SLB-1 (Online Supplementary Figure S1E and F) and fluorescence-activated cell sorting (FACS) phenotyping confirmed their T-cell status and intracellular Tax presence (Online Supplementary Figure S1G). Herein, we stratified the cells in two groups: 1) viralproducing cells (MT-2, MT-4, and SLB-1); 2) non-viral-producing ATLL-like cells (ATL-2S, SP, ATL-55T, ATL-ED, and M8166). In order to understand the role of MEF-2 isoforms in these cell lines, we performed RT-qPCR on all cell lines including naïve and activated T cells (CD3+/CD28+) to determine MEF-2 isoform(s) expression. 100,000-fold up-regulation of MEF-2A was observed in MT-4, SP, ATL-ED, and M8166 cells in comparison to activated T cells (Figure 1A). MEF-2C showed significant upregulation in all cell lines (up to 100-fold change), except in SP, ATL-55T, and M8166. However, MEF-2B/2D expression levels remained unchanged across all cell lines. Collectively, these results suggest that MEF-2A/2C are highly overexpressed in all viral-producing cell line (MT-2, MT-4, SLB-1) and in only two (ATL-2S and ATL-ED) of the five non-viral-producing ATLL cell lines. Furthermore, mRNA changes for MEF-2 isoforms at the single-cell level within CD4+ T-cell populations showed MEF-2A/2C expression peaks shifted among cell lines compared to Jurkat (Online Supplementary Figure S2A). Additionally, HTLV-1-negative non-ATLL cell lines, HUT78, HH and Ly13.2 were also analyzed as controls for MEF-2 expression. Of all isoforms analyzed, only MEF-2C mRNA expression exhibited a slight increase but this was nowhere close to what was observed in ATLL cell line (Online Supplementary Figure S2B). Consistent with the mRNA expression, western blotting for protein expression showed an increase in MEF-2A expression in almost all cell lines in comparison to Jurkat, naïve and activated T cells (Figure 1B). MEF-2C expression was increased compared to naïve and activated T cells implying it could be activation dependent. However, we observed a post-translational modification (a distinct upper band) in most of infected cell lines, except for MT-4 and SP (Figure 1B), which may suggest a divergence of activity in MEF-2C in these cell types. In order to quantitatively corroborate our western blotting results, we utilized an automated capillary-based protein electrophoresis system (WES, Protein Simple) that provides quantitative values of protein expression (Figure 1C) and saw comparable results. Altogether, these results provide additional support for MEF-2A and MEF-2C in HTLV-1/ATLL pathogenesis. Out of the two non-viral producing ATLL cell line, only ATL-ED expressed HBZ and not Tax. Therefore, for further studies to understand the role of MEF-2A/2C in HBZ mediated anti-sense transcriptional activity, we used ATL-ED as a representative cell line. MT-4 was used as a representative viral producing cell line as it had the highest expression of MEF-2A/2C together in comparison to other virus-producing cells.
Figure 1.

Evaluation of mRNA expression and protein expression of MEF-2 isoforms in CD4+ HTLV-1 infected and uninfected T-cell lines. (A) Quantitative reverse transcription polymerase chain reaction (RT-qPCR) was performed to assess the expression of MEF-2 isoforms in several cell lines. MEF-2 mRNA expression in HTLV-1-negative control, Jurkat cells, was compared to expression in HTLV-1-transformed and ATL-derived cell lines. MEF-2 mRNA expression is presented as the mean fold-change of 2 independent experiments relative to activated T cells, which were normalized to 1. Error bars represent the standard deviation of duplicate samples. (B) Top panel illustrates representative western blot of protein expression on MEF-2 isoforms with control (Jurkat) and various HTLV-1-infected T-cell lines. Bottom panel illustrated quantified images using densitometry. Cofilin was used as a loading control. (C) Results from traditional immunoblotting were validated with the automated western blot system, Wes (Protein Simple) with GAPDH used as a loading control. All data represent one of 2 separate experiments. *P<0.05, **P<0.01.
Knockdown of MEF-2A and MEF-2C downregulates viral protein expression
Increased expression of MEF-2A/2C in ATLL cell lines led us to further understand the role of these two isoforms in ATLL using a SMART pool of small interfering RNA (siRNA) per isoform (Dharmacon). MEF-2A knockdown (K/D) in Jurkat, ATL-ED (representative Tax-negative cell line) and MT-4 (Tax-positive virus-producing cell line) was assessed by RT-qPCR and immunoblotting. Dose-dependent downregulation of MEF-2A at both mRNA and protein level was observed in all cell lines but no changes in the other isoforms indicated the specificity of our knockdown (Figure 2A-B; Online Supplementary Figure S3A). HBZ was downregulated in ATL-ED cell line in a dose-dependent manner similar to MEF-2A K/D (Figure 2A). When MEF-2A was depleted in MT-4 cells, a slight decrease in MEF-2C mRNA expression was observed at the highest concentration of siRNA, nonetheless, as expected, a dose-dependent reduction of Tax and HBZ was also observed (Figure 2B). In ATL-ED, decrease of MEF-2C expression was observed along with Tax and HBZ at both mRNA and protein level (Figure 3A). In MT-4, however, decrease in MEF-2C was not dose-dependent at mRNA level (Figure 3B). Further analysis using western blotting indicated the 50 nM dose of siRNA had the highest degree of MEF-2C depletion as well as significant decrease in HBZ expression. As a result, 50 nM of siRNA was used as optimal concentration for further experiments. These results indicate that MEF-2A and MEF-2C K/D in ATL-ED and MT-4 significantly downregulate HBZ and are essential for its transcriptional activity. Additionally, in order to validate that viral protein expression depended on MEF-2A/2C expression, we performed K/D studies in an another common HTLV-1 viral producing cell line, MT-2, and saw that K/D of MEF-2A/2C exhibited decrease in Tax and HBZ (Online Supplementary Figure S3B), similar to what was observed from previous experiments.
Figure 2.

Evaluation of knockdown of MEF-2A with small interfering RNA transfection and downmodulation of viral genes. (A) Upper left- transfection of MEF-2A small interfering (siRNA) at 2 concentrations (10 nM and 50 nM) and quantitative reverse transcription polymerase chain reaction (RT-qPCR) conducted to assess the expression of MEF-2 isoforms in ATL-ED. Upper right-the effect of MEF-2A knockdown on HBZ represented as fold-change compared to scrambled control. Lower left- immunoblots of protein expression after MEF-2A knockdown from respective experiments; and lower right- corresponding densitometry analysis is shown. Error bars represent the standard deviation of duplicate samples. (B) Upper left- transfection of MEF-2A siRNA performed at 2 concentrations (10 nm, 50 nm) in MT-4 cells and RT-qPCR conducted to assess the expression of MEF-2 isoforms. Upper right- Tax and HBZ expression as the mean fold-change compared to scrambled control. Lower left- immunoblots of protein expression after MEF-2A knockdown, and lower right – corresponding densitometry analysis is shown. All data represents one of three separate experiments. *P<0.05, **P<0.01.
Knockdown of MEF-2A and MEF-2C decreases proliferation and cell cycle progression in adult T-cell leukemia and lymphoma cell lines
In order to determine if K/D of MEF-2A/2C modulated physiological and phenotypic changes in ATLL cell lines, we assessed the proliferation and cell cycle progression. Since depletion of MEF-2A/2C was already validated in Jurkat, ATL-ED and MT-4, we sought to determine the proliferation profile via Ki-67 staining. Decreased Ki-67 expression after depletion of MEF-2A/2C suggested that the proliferation of these ATLL cell lines was dependent on these two isoforms of MEF-2 (Figure 4A and B) but there was no considerable change in proliferation in Jurkat cells after K/D. More specifically, there was a stronger inhibition in proliferation with siMEF-2C (~38% decrease) than siMEF2A (~15% decrease) in ATL-ED and MT-4 cell lines (Figure 4C). These results indicate a stronger role of MEF-2C in ATLL progression.
We next sought to determine if proliferation defects were due to any perturbations in cell cycle regulation. Propidium iodide (PI) staining was done following K/D of MEF-2A/2C to observe different phases of the cell cycle. In Jurkat cells, there was a modest decrease in the G2-M proliferating cells compared to scrambled control and siMEF-2A/2C, whereas in ATL-ED and MT-4 cells there was an accumulation of cells in the G1-S phase and a ~50% decrease in the G2-M mitotic cells following K/D (Figure 4C and D). Concurrently, treatment with siMEF-2A/2C resulted in accumulation of cells in G0-G1 phase. These results indicate that MEF-2A/2C K/D regulated cell cycle progression in actively proliferating ATLL cells. In order to further validate the proliferation and cell cycle progression defect, we utilized miR-21C which was previously shown to target the mRNA of MEF-2C.27 After treatment of MT-4, ATL-ED and Jurkat with miR-21C, we observed decrease in MEF-2C expression but not MEF-2D (Online Supplementary Figure S3C). We observed a similar decreasing trend in proliferation and cell cycle progression as seen with K/D of MEF-2A/2C (Online Supplementary Figure S3D and E).
Figure 3.

Evaluation of knockdown of MEF-2C with small interfering RNA transfection and downmodulation of viral genes. (A) Upper left- transfection of small interfering RNA (siRNA) at different concentrations (10 nM, 25 nM, 50 nM and 100 nM) and quantitative reverse transcription polymerase chain reaction (RT-qPCR) conducted to assess the expression of MEF-2 isoforms in ATL-ED. Upper right- effect of MEF-2C knockdown (K/D) on HBZ as represented as fold-change compared to scrambled control. Lower left- immunoblot of protein expression after (K/D) of MEF-2C from respective experiments; lower right- corresponding densitometry values are shown. Error bars represent the standard deviation of duplicate samples. (B) Upper left- transfection of MEF-2C siRNA was performed at various concentrations (10 nM, 50 nM and 100 nM) in MT-4 cells and RT-qPCR conducted to assess the expression of MEF-2 isoforms. Upper right- effect of MEF-2C K/D on Tax and HBZ as the mean fold-change compared to scrambled control. Lower left and right panels show representative immunoblots and densitometric analysis from K/D experiments. All data represents one of three separate experiments. *P<0.05, **P<0.01.
MEF-2A and MEF-2C are significantly upregulated in an acute North American adult T-cell leukemia and lymphoma patient cohort
In order to ascertain the clinical importance of MEF-2 isoforms, we investigated their expression and relevance within patient cohorts. We obtained mRNA from peripheral blood mononuclear cells (PBMC) of ten NA-ATLL patients20,28 along with nine seronegative, nine AC, and nine HAM/TSP patients from the same geographic areas of South America (all patient characteristics and related references are listed in the methods section). Our results showed a significant logarithmic increase of MEF-2A and MEF-2C in NA-ATLL samples (P<0.05) but also a significantly higher fold-change (P<0.01) in the expression of MEF-2C in comparison to seronegative, AC, and HAM/TSP patients (Figure 5). Differences in MEF-2B/2D expression were not statistically significant. We noticed a logarithmic fold-change in MEF-2C expression in most NA-ATLL samples. We also assessed three immortalized NA-ATLL patient-derived cell lines20 for MEF-2 isoforms (Online Supplementary Figure S4A and B) and observed upregulated expression of Tax and HBZ correlated with increased expression of MEF-2A/2C in ATL18 and ATL21. In ATL13, the absence of MEF-2A/2C correlated with lower viral protein expression. In ATL21 cells, lower expression of MEF-2C correlated with the decreased expression of HBZ but not Tax, suggesting a direct relation of MEF-2C to HBZ. These results were corroborated using whole exome sequencing (WES) capillary electrophoresis (Online Supplementary Figure S4C), suggesting linkage between MEF-2A/2C expression and viral protein expression.
MEF-2C is enriched in the 3’LTR and bind with HBZ to control viral expression via Menin, JunD and Sp1/Sp3
We previously reported that MEF-2A is enriched in the 5’LTR of the provirus and interacts with Tax to regulate viral gene expression.14 However, the role of MEF-2C in this context is unknown. Additionally, it remains unclear how viral gene expression is controlled at the 3’LTR. Nuclear/cytoplasmic fractionation of ATL-ED cells showed MEF-2A/2C were only seen in the nuclear fraction along with HBZ (Figure 6A). We then evaluated enrichment of MEF-2A/2C, viral proteins, and various known co-factors including Menin, JunD, Sp1/Sp3 (activator of 3’LTR29) at both 3’LTR and 5’LTR. MEF-2’s canonical promoter in T cells, NR4A1, was utilized as a control.30 At the 3’LTR, we observed a basal level enrichment of MEF-2A and a higher recruitment of MEF-2C along with JunD, Menin, Sp1, and Sp3 but not C/EBPα representing a transcriptionally active state (Figure 6C). At the NR4A1 promoter, both repressor and activator were recruited similarly (Figure 6C) thus reaffirming our previous observations29,31 that the ratio of activators and repressors are key to controlling transcription. At the 5’LTR (Online Supplementary Figure S5A), recruitment of RNA pol II, MEF-2A, and CREB was observed, which is a known binding factor at CRE elements.32 High level enrichment of C/EBPα, HBZ but not Sp1/Sp3, was also observed. Interestingly, HBZ is known to bind with C/EBPα to inhibit the activation of 5’LTR.33 Together, these observations suggest inhibition of transcription at 5’LTR. In order to further validate the recruitment of factors at the 5’ and 3’LTR, we utilized the MT-4 cell line. We observed a higher enrichment of MEF-2A than MEF-2C at 5’LTR and an ~40-fold enrichment of Tax, which is expected for the 5’LTR activity (Online Supplementary Figure S5B). We observed the enrichment of MEF-2C, Menin (a tumor suppressor34), JunD, and HBZ at 3’LTR suggesting their presence within one complex. In order to assess this, we performed protein-protein binding assay in ATL-ED and other representative cell lines.
Figure 4.

Analyzing the proliferation and cell cycle of adult T-cell leukemia and lymphoma cell lines post si-MEF-2A/2C transfection by Ki-67 and propidium iodide staining. (A) Dot plots represent cells stained with Ki-67 and subjected to flow cytometric assays to measure cellular proliferation. (B) Analysis was carried out with Flow-Jo software to quantify the percent proliferation profiles for each cell line and represented as a bar graph. (C) Jurkat, ATL-ED, and MT-4 cells were collected, fixed, and stained with propidium iodide (PI, 25 µg/mL) to assess cell cycle progression via flow cytometry. Left- mock transfected, right- si-MEF-2A and si-MEF-2C transfection with 50 nM respectively. (D)The percentage of sub-G1 cells, G0/G1, S and G2-M cells was analyzed using Flow-Jo software and represented as a stacked column plot.
Figure 5.

Expression of MEF-2 isoforms in North American-adult T-cell leukemia and lymphoma. Quantitative reverse transcription polymerase chain reaction (RT-qPCR) was performed to evaluate the expression of MEF-2 isoforms in activated peripheral blood mononuclear cells (PBMC) (control n=3), seronegative (n=9), asymptomatic carriers (AC, n=9), adult T-cell leukemia and lymphoma (ATLL, n=10), and HTLV-1-associated myelopathy/tropical spastic paraparesis (HAM/TSP, n=9), patient samples. Fold-change is normalized to activated PHA-treated PBMC and compared to asymptomatic carriers and seronegative subjects. Statistical analyses were performed using GraphPad Prism8, where the distribution of each dataset was tested for normality (Kolmogorov-Smirnov and Shapiro-Wilks Normality Testing) and histograms were compared across groups. Data that were not normally distributed underwent non-parametric analysis. All data are presented as mean ± standard error of the mean. Statistical testing included the one-way Anova non-parametric t-test. Data that violated normality did so because of the nature of the heterogeneity of patient cohort. *P<0.05, **P<0.01.
Figure 6.

Cell fractionation and chromatin immunoprecipitation of ATL-ED cells for various transcriptional targets, viral genes, and MEF-2 isoforms at the viral long terminal repeats. (A) Immunoblots representing nuclear and cytoplasmic fractions for protein expression. with Lamin B1 was used as nuclear fraction control in ATL-ED cells. (B) Chromatin immunoprecipitation (ChIP) analysis of ATL-ED for enrichment of transcriptional targets in the 3’ long terminal repeats (3’LTR) of the viral promoter. (C) ChIP analysis of ATL-ED cells for enrichment of transcriptional targets at the 3’ LTR and in the canonical MEF-2 promoter, NR4A1. Shown is the representative image of an average of at least 3 experiments. All targets are represented as fold-change based on 10% input and immunoglobulin G negative control. *P<0.05, **P<0.01.
MEF-2C interacted with Menin along with HBZ at steady state, indicating that these proteins exist in the same complex (Figure 7A), while MEF-2A although bound to Menin rather weakly, and was not enriched in the 3’LTR. Additionally, we found that Menin did not bind to JunD in ATL-ED cells but bound in Jurkat cells (Figure 7B). Transient K/D of both siMEF-2A/2C showed no recruitment of JunD at the 3’ LTR compared to control (Figure 7B and C). From these results we conclude that MEF-2C forms complexes with HBZ and Menin at the 3’LTR, which liberates JunD to activate the antisense promoter (Figure 7D).
Chemical inhibition and small interfering RNA-mediated knockdown of MEF-2A/2C modulates viral gene expression in vitro and in vivo
Due to the known interactions between MEF-2, class IIa HDAC,35 and associated repressor complexes that keep MEF-2 isoform(s) expression in a repressed state,21 we aimed to investigate the effect of MC156821,22 on MEF-2 activity and ATLL cell line survival. We calculated half maximal inhibitory concentration (IC50) curves for primary activated T cells, Jurkat, ATL-ED, and MT-4 cells (Figure 8A). There was no toxicity in activated T cells and calculated IC50 values of 3.011 µM and 0.389 µM for ATL-ED and MT-4, respectively. Furthermore, we derived an IC50 value of 13.38 µM in Jurkat cells, supporting the ATLL-specific cytotoxic activity of MC1568. In order to ensure that the observed cytotoxic activity was due to specific inhibition of MEF-2 activity, we K/D MEF-2A/2C using siMEF-2A/2C and then treated with MC1568 in representative cells. We observed that MEF-2A K/D resulted in increased IC50 values in all ATLL cell lines except Jurkat. Conversely, with MEF-2C K/D, MT-4 and ATL-ED showed no cytotoxicity (Figure 8B). K/D of Serum Response Factor (SRF, transcription factor of the MEF-2 family that has similar interactions with class II HDAC36,37) resulted in no or modest change in IC50 values as shown in Figure 8B. In order to ascertain that observed effects are HTLV-1 mediated, we performed gain-of-function studies with pSG-Tax-His and pSG-HBZ-His overexpression plasmids in all three cell types. As expected, Jurkat did not show any change but both ATL-ED and MT-4 cells showed increase in IC50 upon HBZ (3.02/11.7, 0.38/1.32, respectively) and Tax (3.02/16.65, 0.38/2.65, respectively). In order to assess the in vivo effects of MC1568 treatment, humanized NOD/SCID/γ-null mice were injected with MT-2 cells for 2 weeks to establish HTLV-1 infection followed by MC1568 treatment (Figure 8C). Proviral load in the blood and spleen of MC1568-treated mice was significantly reduced in comparison to control. A decrease of at least ten copies of Ta x and HBZ in the DNA, and a 10-to-20-fold decrease of Tax expression was observed in comparison to control, including a massive downregulation of HBZ at the RNA level (Figure 8D). Similar downregulation of Tax and HBZ was observed in in the spleens of MC1568 treatment group.
Figure 7.
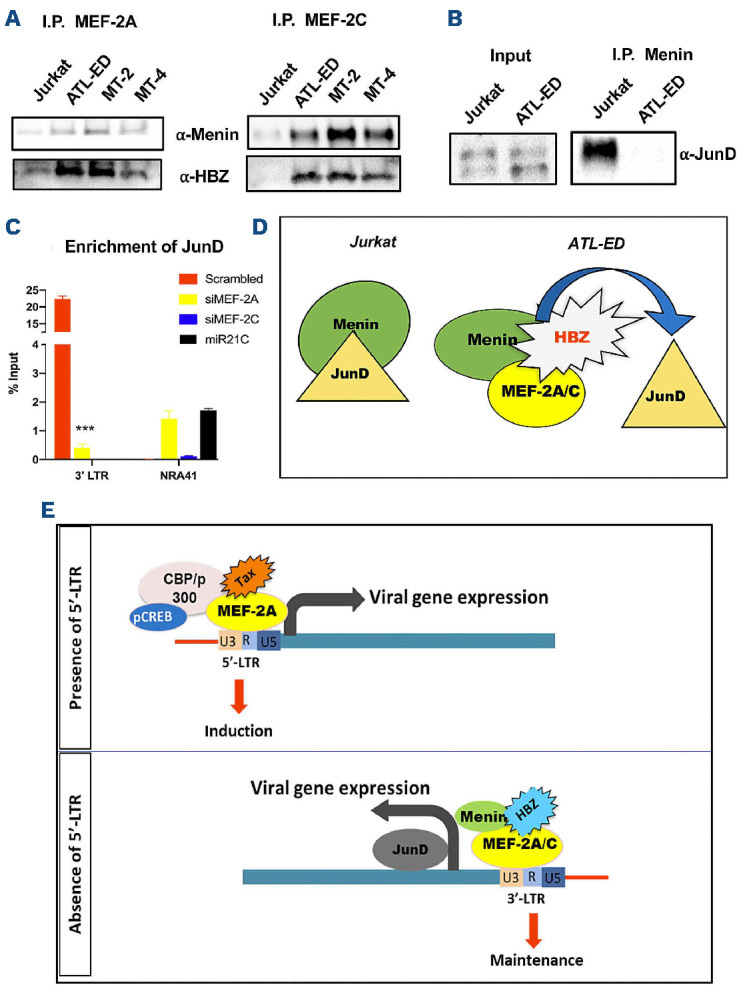
Protein-protein interactions of MEF-2, Menin and JunD and enrichment of JunD in transient knockdown of MEF-2 isoforms. (A) Representative immunoblots after co-immunoprecipitation with MEF-2A and MEF-2C showing endogenous binding of HBZ and Menin in 4 different representative cell lines. (B) Representative immunoblots showing the binding of Menin and JunD in Jurkat and ATL-ED. (C) Cromatin immunoprecipitation (ChIP) analysis of ATL-ED cells for enrichment of JunD at 3’LTR and the canonical MEF-2 NR4A1 promoter after transiently knocking down MEF-2A and MEF-2C. (D) Mechanistic model of MEF-2 isoforms activity in adult T-cell leukemia and lymphoma (ATLL) pathogenesis and viral gene expression. At the 3’ long terminal repeats (3’LTR), we posit that complexes of HBZ, Menin, and MEF-2A/2C are sequestered together to liberate JunD- which controls the transcriptional activity at the antisense promoter for viral gene expression. (E) Role of MEF-2C in the modulation of 3’LTR, aiding in the maintenance of proliferation and survival phenotype from the anti-sense region, in the absence of 5’LTR in ATLL pathogenesis.
Discussion
Despite extensive efforts to understand the etiology and pathogenesis of HTLV-1-induced leukemogenesis, much remains unknown. After integration of the provirus, the LTR are duplicated in identical promoters which influence transcriptional activity of viral proteins along with other co-factors in the pathogenesis of ATLL. Tax and other viral genes are expressed through transcripts initiated by promoter activity from the 5’ LTR region,38 whereas the only protein encoded on the negative strand and transcribed from the 3’LTR is HBZ.7 ATLL cells from patients frequently only express HBZ,8 as all the other viral proteins are transcriptionally repressed.11 Previous studies including ours identified various factors including MEF-2A in facilitating T-cell transformation and leukemogenesis via Tax-mediated 5’ LTR activation and viral replication.14 Classically, retroviruses are known to have active 5’LTR and transcriptionally silent 3’LTR.39 In the pathogenesis of HTLV-1-induced ATLL, there is a loss of 5’ LTR activity due to a variety of reasons including complete loss via mutation or deletion and methylation of the 5’LTR.40 Additionally, Tax is an immunodominant epitope and it is eliminated by immunosurveillance, which abrogates its activity at the 5’LTR.41 Despite the loss of 5’LTR activity, ATLL patients still have aggressive disease progression which may be through the transcriptionally active 3’LTR.32
Figure 8.

MC1568 activity in vitro and in vivo. (A) Percent viability of activated T cells, Jurkat, ATL-ED (TAX-HBZ+), and MT-4 (TAX+HBZ+) after being treated with varying concentrations of MC1568. Compound was serially diluted in DMSO ranging from 50 µM to 0.39 µM, with respective vehicle and untreated controls. Each data point represents the average value obtained from 3 independent experiments. Error bars represent the standard error of mean. Half-maximal inhibitory concentration (IC50) values (µM/L) were determined using a 4-parameter logistic model derived by GraphPad Prism8 software. (B) Cells were treated with either siSRF, siMEF-2A or siMEF-2C for 48 hours and the IC50 curves were derived using GraphPad Prism8. (C) Treatment regimen of the humanized HTLV-1 infection mouse model for induction of infection and treatment with MC1568. (D) Left- evaluation of proviral load after chemical inhibition by MC1568 in isolated peripheral blood mononuclear cells (PBMC) and splenocytes from ATLL NOD/SCID/γnull humanized mice, and right- analyzed for relative expression of viral genes, Px and HBZ using quantitative reverse transcription polymerase chain reaction. Data is represented the standard error of mean of 2 independent experiments. Box-whisker plots represent the median, 25th and 75th percentile values of the untreated and treated groups. Graphs were generated using GraphPad Prism8 software.
In the event of loss of 5’LTR, there would be an inactivity of multiple transcriptional complexes involving MEF-2A and Tax, among others, which drive the pathogenesis HTLV-1 and subsequent ATLL progression. In this study we demonstrated that MEF-2C is another predominant isoform that is highly expressed in the acute ATLL patients, various ATLL cell lines, and is also overexpressed in non-ATLL cell lines. Furthermore, evidence suggests that K/D of MEF-2C results in a decrease in viral protein expression of HBZ, which has resulted in the decrease in the ATLL cell proliferation and blockade of the cell cycle progression. Our results point to the direction of MEF-2C being a crucial factor in ATLL cell fitness. MEF-2C has also been implicated in various leukemias such as T-ALL,42 progression in chronic myelogenous leukemia,43 and in pediatric patient samples of early T-cell precursor acute lymphoblastic leukemia (EPT-ALL).44 Additionally, the activation of MEF-2C showed a post translational modification in ATLL cells, which is currently unknown, and requires further proteomic analysis.
Furthermore, we present data that implicates MEF-2A/2C isoforms in exacerbating aggressive carcinogenesis and related symptoms in NA-ATLL patients. Cell line observations validated in a specific NA-ATLL patient cohort19,20 reaffirmed a significant logarithmic increase in MEF-2A in all ATLL patients compared to seronegative, asymptomatic carriers, and HAM/TSP patients, whereas MEF-2C over expression was observed only in 80% of the cohort. This may be due to multiple reasons, such as the varying degrees of ATLL progression, chemotherapeutic drug pressure, or the presence and/or absence of varying 5’ LTR activity and viral proteins. This was evident from the immortalized patient cell lines where ATL18 cells had a higher expression of MEF-2A/2C and correlated with the presence of Tax and HBZ expression. While in ATL-21 cells, the lower expression of MEF-2C correlated with the absence of HBZ, but MEF-2A correlated with upregulated Tax expression, establishing a clear connection between MEF-2A-Tax, as seen in previously published studies,14 and MEF-2C-HBZ. Although quite promising, further validation is necessary to assess if these correlations seen in our NA-ATLL will hold true in all ATLL patients despite their origin, since a new subgroup of high risk ATL mutational signature has been identified.45,46 Taken together, we demonstrate MEF-2A and MEF-2C as the two predominantly expressed isoform across most HTLV-1 infected cell systems with tangible clinical relevance in the ATLL patients, providing evidence that MEF-2C is an important factor in leukemogenesis.
In order to further explore this newly established linkage between MEF-2C and HBZ, we utilized ATL-ED cells, that lack the activity of 5’LTR thereby allowing possible activation of 3’LTR. At this promoter, significant enrichment of MEF-2C, but not MEF-2A, along with known transcription factors, JunD and Menin, control the activity of the 3’LTR. Although, the 5’LTR was able to recruit MEF-2A/2C, it also recruited CEBPα, a known suppressor of HTLV-1 sense promoter thus explaining why 5’LTR is transcriptionally silent in ATL-ED cells.31 Due to the enrichment of these factors, we hypothesized that these factors are in complex, and our protein-protein binding studies revealed that MEF-2C strongly bound with HBZ forming a complex with a tumor suppressor Menin,47, 4 8 but not with MEF-2A. Interestingly, the tumor suppressor Menin,47,48 bound with JunD in uninfected Jurkat cells but not in ATL-ED implying that a different JunD complex exist in ATLL cells. When 3’LTR is active, Menin interacts with MEF-2C and HBZ, which subsequently allows the release of JunD from Menin’s anti-tumor activity. MEF-2A/2C K/D studies further fortified that there was enrichment of JunD at the 3’LTR and is dependent on the presence of MEF-2C for the transcriptional activation of JunD and the antisense promoter activity of HTLV-1 (Figure 7D).
MEF2 transcription factors act as both activators and repressors depending on the specific kind of interaction with the co-activators or co-repressors respectively.49 Class IIA HDAC (HDAC 4/5/7/9) are known binding partners of MEF-2, which when scaffolded with MEF-2 becomes a transcriptional repressor,50 making MEF-2 isoforms druggable targets. We have shown a specific class II HDAC inhibitor, MC1568, induced cytotoxicity in ATLL cell lines selectively. This inhibitor works in a non-canonical way of HDAC inhibition and allows the repressed state of MEF-2 proteins and their binding entities, in this case viral proteins such as Tax and HBZ. This was evident from the decrease of copy numbers and mRNA expression of both Tax and HBZ in the humanized HTLV-1 model of infection. Further studies using models of patient-derived xenografts, which mimic real-time infection as in patients, will be necessary to assess MEF-2 isoforms as a potential therapeutic target. In conclusion, we establish MEF-2C as a novel target in ATLL pathogenesis especially against the 3’LTR antisense transcriptional activity in the absence of the 5’LTR and MEF-2A (Figure 7E) and can serve as a major therapeutic target for treatment of ATLL.
Supplementary Material
Acknowledgments
We thank NIH AIDS reagents program for providing HTLV-1-infected/ATLL cell lines. HBZ antibody was a gift from Dr. Patrick Green (Ohio State University). TAX (LT-4) antibody was gifted by Dr. Yuetsu Tanaka (Japan).
Funding Statement
Funding: These studies are fully supported by the funding from NIH/NINDS via R01 NS097147 to PJ.
References
- 1.Nakao K, Abematsu N, Sakamoto T. Systemic diseases in patients with HTLV-1-associated uveitis. Br J Ophthalmol. 2018;102(3):373-376. [DOI] [PubMed] [Google Scholar]
- 2.Eusebio-Ponce E, Anguita E, Paulino-Ramirez R, Candel FJ. HTLV-1 infection: an emerging risk. Pathogenesis, epidemiology, diagnosis and associated diseases. Rev Esp Quimioter. 2019;32(6):485-496. [PMC free article] [PubMed] [Google Scholar]
- 3.Coffin JM. The discovery of HTLV-1, the first pathogenic human retrovirus. Proc Natl Acad Sci U S A. 2015;112(51):15525-15529. [DOI] [PMC free article] [PubMed] [Google Scholar]
- 4.Gruber K. Australia tackles HTLV-1. Lancet Infect Dis. 2018;18(10):1073-1074. [DOI] [PubMed] [Google Scholar]
- 5.Ngoma AM, Omokoko MD, Mutombo PB, Nollet KE, Ohto H. Seroprevalence of human T-lymphotropic virus (HTLV) in blood donors in sub-Saharan Africa: a systematic review and meta-analysis. Vox Sang. 2019;114(5):413-425. [DOI] [PubMed] [Google Scholar]
- 6.Chihara D, Ito H, Katanoda K, et al. Increase in incidence of adult T-cell leukemia/lymphoma in non-endemic areas of Japan and the United States. Cancer Sci. 2012;103(10):1857-1860. [DOI] [PMC free article] [PubMed] [Google Scholar]
- 7.Gaudray G, Gachon F, Basbous J, Biard-Piechaczyk M, Devaux C, Mesnard JM. The complementary strand of the human T-cell leukemia virus type 1 RNA genome encodes a bZIP transcription factor that down-regulates viral transcription. J Virol. 2002;76(24):12813-12822. [DOI] [PMC free article] [PubMed] [Google Scholar]
- 8.Polakowski N, Pearce M, Kuguyo O, Boateng G, Hoang K, Lemasson I. The splice 1 variant of HTLV-1 bZIP factor stabilizes c-Jun. Virology. 2020;549:51-58. [DOI] [PMC free article] [PubMed] [Google Scholar]
- 9.Taniguchi Y, Nosaka K, Yasunaga J, et al. Silencing of human T-cell leukemia virus type I gene transcription by epigenetic mechanisms. Retrovirology. 2005;2:64. [DOI] [PMC free article] [PubMed] [Google Scholar]
- 10.Tamiya S, Matsuoka M, Etoh K, et al. Two types of defective human T-lymphotropic virus type I provirus in adult T-cell leukemia. Blood. 1996;88(8):3065-3073. [PubMed] [Google Scholar]
- 11.Koiwa T, Hamano-Usami A, Ishida T, et al. 5'-long terminal repeat-selective CpG methylation of latent human T-cell leukemia virus type 1 provirus in vitro and in vivo. J Virol. 2002;76(18):9389-9397. [DOI] [PMC free article] [PubMed] [Google Scholar]
- 12.Lemasson I, Lewis MR, Polakowski N, et al. Human T-cell leukemia virus type 1 (HTLV-1) bZIP protein interacts with the cellular transcription factor CREB to inhibit HTLV-1 transcription. J Virol. 2007;81(4):1543-1553. [DOI] [PMC free article] [PubMed] [Google Scholar]
- 13.Matsumoto J, Ohshima T, Isono O, Shimotohno K. HTLV-1 HBZ suppresses AP-1 activity by impairing both the DNA-binding ability and the stability of c-Jun protein. Oncogene. 2005;24(6):1001-1010. [DOI] [PubMed] [Google Scholar]
- 14.Jain P, Lavorgna A, Sehgal M, et al. Myocyte enhancer factor (MEF)-2 plays essential roles in T-cell transformation associated with HTLV-1 infection by stabilizing complex between Tax and CREB. Retrovirology. 2015;12:23. [DOI] [PMC free article] [PubMed] [Google Scholar]
- 15.Madugula K, Mulherkar R, Khan ZK, et al. MEF-2 isoforms' (A-D) roles in development and tumorigenesis. Oncotarget. 2019;10(28):2755-2787. [DOI] [PMC free article] [PubMed] [Google Scholar]
- 16.Pan F, Ye Z, Cheng L, Liu JO. Myocyte enhancer factor 2 mediates calcium-dependent transcription of the interleukin-2 gene in T lymphocytes: a calcium signaling module that is distinct from but collaborates with the nuclear factor of activated T cells (NFAT). J Biol Chem. 2004;279(15):14477-14480. [DOI] [PubMed] [Google Scholar]
- 17.Tsukasaki K, Tobinai K. Human T-cell lymphotropic virus type I-associated adult T-cell leukemia-lymphoma: new directions in clinical research. Clin Cancer Res. 2014;20(20):5217-5225. [DOI] [PubMed] [Google Scholar]
- 18.Zuurbier L, Gutierrez A, Mullighan CG, et al. Immature MEF2C-dysregulated T-cell leukemia patients have an early T-cell precursor acute lymphoblastic leukemia gene signature and typically have non-rearranged T-cell receptors. Haematologica. 2014;99(1):94-102. [DOI] [PMC free article] [PubMed] [Google Scholar]
- 19.Shah UA, Chung EY, Giricz O, et al. North American ATLL has a distinct mutational and transcriptional profile and responds to epigenetic therapies. Blood. 2018;132(14):1507-1518. [DOI] [PMC free article] [PubMed] [Google Scholar]
- 20.Chung EY, Mai Y, Shah UA, et al. PAK kinase inhibition has therapeutic activity in novel preclinical models of adult T-cell leukemia/lymphoma. Clin Cancer Res. 2019;25(12):3589-3601. [DOI] [PubMed] [Google Scholar]
- 21.Nebbioso A, Manzo F, Miceli M, et al. Selective class II HDAC inhibitors impair myogenesis by modulating the stability and activity of HDAC-MEF2 complexes. EMBO Rep. 200;10(7):776-782. [DOI] [PMC free article] [PubMed] [Google Scholar]
- 22.Panella S, Marcocci ME, Celestino I, et al. MC1568 inhibits HDAC6/8 activity and influenza A virus replication in lung epithelial cells: role of Hsp90 acetylation. Future Med Chem. 2016;8(17):2017-2031. [DOI] [PubMed] [Google Scholar]
- 23.Venza I, Visalli M, Oteri R, Cucinotta M, Teti D, Venza M. Class II-specific histone deacetylase inhibitors MC1568 and MC1575 suppress IL-8 expression in human melanoma cells. Pigment Cell Melanoma Res. 2013;26(2):193-204. [DOI] [PubMed] [Google Scholar]
- 24.Di Giorgio E, Gagliostro E, Clocchiatti A, Brancolini C. The control operated by the cell cycle machinery on MEF2 stability contributes to the downregulation of CDKN1A and entry into S phase. Mol Cell Biol. 2015;35(9):1633-1647. [DOI] [PMC free article] [PubMed] [Google Scholar]
- 25.Shah UA, Shah N, Qiao B, et al. Epidemiology and survival trend of adult T-cell leukemia/lymphoma in the United States. Cancer. 2020;126(3):567-574. [DOI] [PMC free article] [PubMed] [Google Scholar]
- 26.Costa EA, Magri MC, Caterino-de-Araujo A. The best algorithm to confirm the diagnosis of HTLV-1 and HTLV-2 in at-risk individuals from Sao Paulo, Brazil. J Virol Methods. 2011;173(2):280-286. [DOI] [PubMed] [Google Scholar]
- 27.Yelamanchili SV, Chaudhuri AD, Chen LN, Xiong H, Fox HS. MicroRNA-21 dysregulates the expression of MEF2C in neurons in monkey and human SIV/HIV neurological disease. Cell Death Dis. 2010;1:e77. [DOI] [PMC free article] [PubMed] [Google Scholar]
- 28.Ye BH, Chung E, Pradhan K, et al. S-Phase progression of North American ATLL cells is critically regulated by the proto-oncogene BCL6 and targetable by PARP inhibition. Blood. 2019;134(Suppl 1):S3779. [Google Scholar]
- 29.Yao J, Grant C, Harhaj E, et al. Regulation of human T-cell leukemia virus type 1 gene expression by Sp1 and Sp3 interaction with TRE-1 repeat III. DNA Cell Biol. 2006;25(5):262-276. [DOI] [PubMed] [Google Scholar]
- 30.Lehmann LH, Jebessa ZH, Kreusser MM, et al. A proteolytic fragment of histone deacetylase 4 protects the heart from failure by regulating the hexosamine biosynthetic pathway. Nat Med. 2018;24(1):62-72. [DOI] [PubMed] [Google Scholar]
- 31.Grant C, Nonnemacher M, Jain P, et al. CCAAT/enhancer-binding proteins modulate human T cell leukemia virus type 1 long terminal repeat activation. Virology. 2006;348(2):354-369. [DOI] [PubMed] [Google Scholar]
- 32.Lemasson I, Polakowski NJ, Laybourn PJ, Nyborg JK. Transcription regulatory complexes bind the human T-cell leukemia virus 5' and 3' long terminal repeats to control gene expression. Mol Cell Biol. 2004;24(14):6117-6126. [DOI] [PMC free article] [PubMed] [Google Scholar]
- 33.Clerc I, Polakowski N, Andre-Arpin C, et al. An interaction between the human T cell leukemia virus type 1 basic leucine zipper factor (HBZ) and the KIX domain of p300/CBP contributes to the down-regulation of tax-dependent viral transcription by HBZ. J Biol Chem. 2008;283(35):23903-23913. [DOI] [PMC free article] [PubMed] [Google Scholar]
- 34.Borowiak M, Kuhlmann AS, Girard S, et al. HTLV-1 bZIP factor impedes the menin tumor suppressor and upregulates JunD-mediated transcription of the hTERT gene. Carcinogenesis. 2013;34(11):2664-2672. [DOI] [PubMed] [Google Scholar]
- 35.Cosenza M, Pozzi S. The therapeutic strategy of HDAC6 inhibitors in lymphoproliferative disease. Int J Mol Sci. 2018;19(8):2337. [DOI] [PMC free article] [PubMed] [Google Scholar]
- 36.Davis FJ, Gupta M, Camoretti-Mercado B, Schwartz RJ, Gupta MP. Calcium/calmodulin-dependent protein kinase activates serum response factor transcription activity by its dissociation from histone deacetylase, HDAC4. Implications in cardiac muscle gene regulation during hypertrophy. J Biol Chem. 2003;278(22):20047-20058. [DOI] [PubMed] [Google Scholar]
- 37.Zhang M, Urabe G, Little C, et al. HDAC6 regulates the MRTF-A/SRF axis and vascular smooth muscle cell plasticity. JACC Basic Transl Sci. 2018;3(6):782-795. [DOI] [PMC free article] [PubMed] [Google Scholar]
- 38.Azran I, Schavinsky-Khrapunsky Y, Aboud M. Role of Tax protein in human T-cell leukemia virus type-I leukemogenicity. Retrovirology. 2004;1:20. [DOI] [PMC free article] [PubMed] [Google Scholar]
- 39.Guntaka RV. Transcription termination and polyadenylation in retroviruses. Microbiol Rev. 1993;57(3):511-521. [DOI] [PMC free article] [PubMed] [Google Scholar]
- 40.Katsuya H, Islam S, Tan BJY, et al. The nature of the HTLV-1 provirus in naturally infected individuals analyzed by the viral DNA-Capture-Seq approach. Cell Rep. 2019;29(3):724-735. [DOI] [PubMed] [Google Scholar]
- 41.Bangham CR. CTL quality and the control of human retroviral infections. Eur J Immunol. 2009;39(7):1700-1712. [DOI] [PubMed] [Google Scholar]
- 42.Homminga I, Pieters R, Langerak AW, et al. Integrated transcript and genome analyses reveal NKX2-1 and MEF2C as potential oncogenes in T cell acute lymphoblastic leukemia. Cancer Cell. 2011;19(4):484-497. [DOI] [PubMed] [Google Scholar]
- 43.Agatheeswaran S, Chakraborty S. MEF2C and CEBPA: possible co-regulators in chronic myeloid leukemia disease progression. Int J Biochem Cell Biol. 2016;77(Pt A):165-170. [DOI] [PubMed] [Google Scholar]
- 44.Neumann M, Heesch S, Gokbuget N, et al. Clinical and molecular characterization of early T-cell precursor leukemia: a high-risk subgroup in adult T-ALL with a high frequency of FLT3 mutations. Blood Cancer J. 2012;2(1):e55. [DOI] [PMC free article] [PubMed] [Google Scholar]
- 45.Kataoka K, Nagata Y, Kitanaka A, et al. Integrated molecular analysis of adult T cell leukemia/lymphoma. Nat Genet. 2015;47(11):1304-1315. [DOI] [PubMed] [Google Scholar]
- 46.Marcais A, Lhermitte L, Artesi M, et al. Targeted deep sequencing reveals clonal and subclonal mutational signatures in adult T-cell leukemia/lymphoma and defines an unfavorable indolent subtype. Leukemia. 2021;35(3):764-776. [DOI] [PubMed] [Google Scholar]
- 47.Yang YJ, Song TY, Park J, et al. Menin mediates epigenetic regulation via histone H3 lysine 9 methylation. Cell Death Dis. 2013;4:e583. [DOI] [PMC free article] [PubMed] [Google Scholar]
- 48.Thakker RV. Multiple endocrine neoplasia type 1 (MEN1) and type 4 (MEN4). Mol Cell Endocrinol. 2014;386(1-2):2-15. [DOI] [PMC free article] [PubMed] [Google Scholar]
- 49.Di Giorgio E, Hancock WW, Brancolini C. MEF2 and the tumorigenic process, hic sunt leones. Biochim Biophys Acta Rev Cancer. 2018;1870(2):261-273. [DOI] [PubMed] [Google Scholar]
- 50.Di Giorgio E, Franforte E, Cefalu S, et al. The co-existence of transcriptional activator and transcriptional repressor MEF2 complexes influences tumor aggressiveness. PLoS Genet. 2017;13(4):e1006752. [DOI] [PMC free article] [PubMed] [Google Scholar]
Associated Data
This section collects any data citations, data availability statements, or supplementary materials included in this article.