

Abstract
Alzheimer’s disease (AD) is the most common cause of dementia, accounting for 50-60% of cases and affecting nearly 6 million people in the United States. The prevalence is projected to increase to 14 million people by the year 2050.1 Despite its prevalence, the diagnosis of AD remains difficult since clinical symptoms are often nonspecific. Definitive diagnosis requires either antemortem brain biopsy or postmortem autopsy. However, clinical neuroimaging has been playing a greater role in the diagnosis and management of AD, and several positron emission tomography (PET) tracers approach the sensitivity of tissue diagnosis in identifying AD pathology. This review will focus on the utility of PET imaging in the setting of cognitive impairment, with an emphasis on its role in the diagnosis of AD.
Keywords: positron emission tomography, Alzheimer’s disease, dementia, amyloid, tau, neurodegeneration
Introduction
Alzheimer’s disease (AD) is the most common cause of dementia, accounting for 50-60% of cases and affecting nearly 6 million people in the United States. The prevalence is projected to increase to 14 million people by the year 2050.1 Despite its prevalence, the diagnosis of AD remains difficult since clinical symptoms are often nonspecific. Definitive diagnosis requires either antemortem brain biopsy or postmortem autopsy. However, clinical neuroimaging has been playing a greater role in the diagnosis and management of AD, and several positron emission tomography (PET) tracers approach the sensitivity of tissue diagnosis in identifying AD pathology. This review will focus on the utility of PET imaging in the setting of cognitive impairment, with an emphasis on its role in the diagnosis of AD.
Pathophysiology of AD
In 1906, Alois Alzheimer first described the two neuropathologic hallmarks of AD: amyloid plaques and neurofibrillary tangles. Amyloid plaques are extracellular deposits of beta-amyloid (Aβ) in the brain parenchyma, and neurofibrillary tangles are intracellular hyperphosphorylated paired helical filaments of tau protein.
The amyloid cascade hypothesis remains the most widely accepted theory to explain the pathogenesis of AD, with the deposition of Aβ plaques in the brain inciting a pathological cascade that leads to neurofibrillary tangles, neuronal loss, and cognitive impairment. This hypothesis has formed the basis of the 2018 “ATN” research framework of AD, put forth by the National Institute on Aging and Alzheimer’s Association.2 “ATN” reflects three stages of disease, with “A” representing Aβ deposition, “T” tau deposition, and “N” neurodegeneration. Histopathological literature has described characteristic patterns of spread of Aβ and tau. Aβ has been shown to deposit in the neocortex early, before spreading to the allocortex, diencephalic nuclei, striatum, cholinergic nuclei of the basal forebrain, brainstem, and finally cerebellum.3 On the other hand, neurofibrillary tangle deposition begins in the transentorhinal cortex, before spreading to the hippocampus and association neocortex,4 closely tracking synaptic loss and neurodegeneration. Neurofibrillary tangles typically spare the motor, somatosensory, and visual cortices until late in the disease course.
Neuroimaging techniques by magnetic resonance imaging (MRI) and PET have been developed to track the ATN stages in vivo. In addition, as the complexity of AD has come to light, other PET tracers have been developed to explore synaptic function, cholinergic function, dopaminergic function, and neuroinflammation.5
Clinical Standard-of-Care Neuroimaging
MRI
When a patient presents with cognitive symptoms, clinical standard-of-care typically begins with structural MRI to exclude a potentially treatable condition, although uncommon. A 2003 meta-analysis found that 0.9% of dementia cases were secondary to a reversible etiology, with 0.6% of cases successfully reversed.6 Diagnostic considerations for partially or fully reversible dementias may include brain masses, chronic subdural hematomas, adverse drug effects, depression, alcohol use, and systemic endocrine and nutritional deficiencies. Normal pressure hydrocephalus (NPH) is another potentially reversible cause of cognitive impairment, characterized by a classic triad of ataxia, urinary incontinence, and dementia. MRI findings of NPH include an acute callosal angle, disproportionate ventricular enlargement, gyral crowding at the vertex, and enlarged Sylvian fissures (Fig. 1).7 When identified early, symptoms can be responsive to ventricular shunt placement.
Fig. 1.
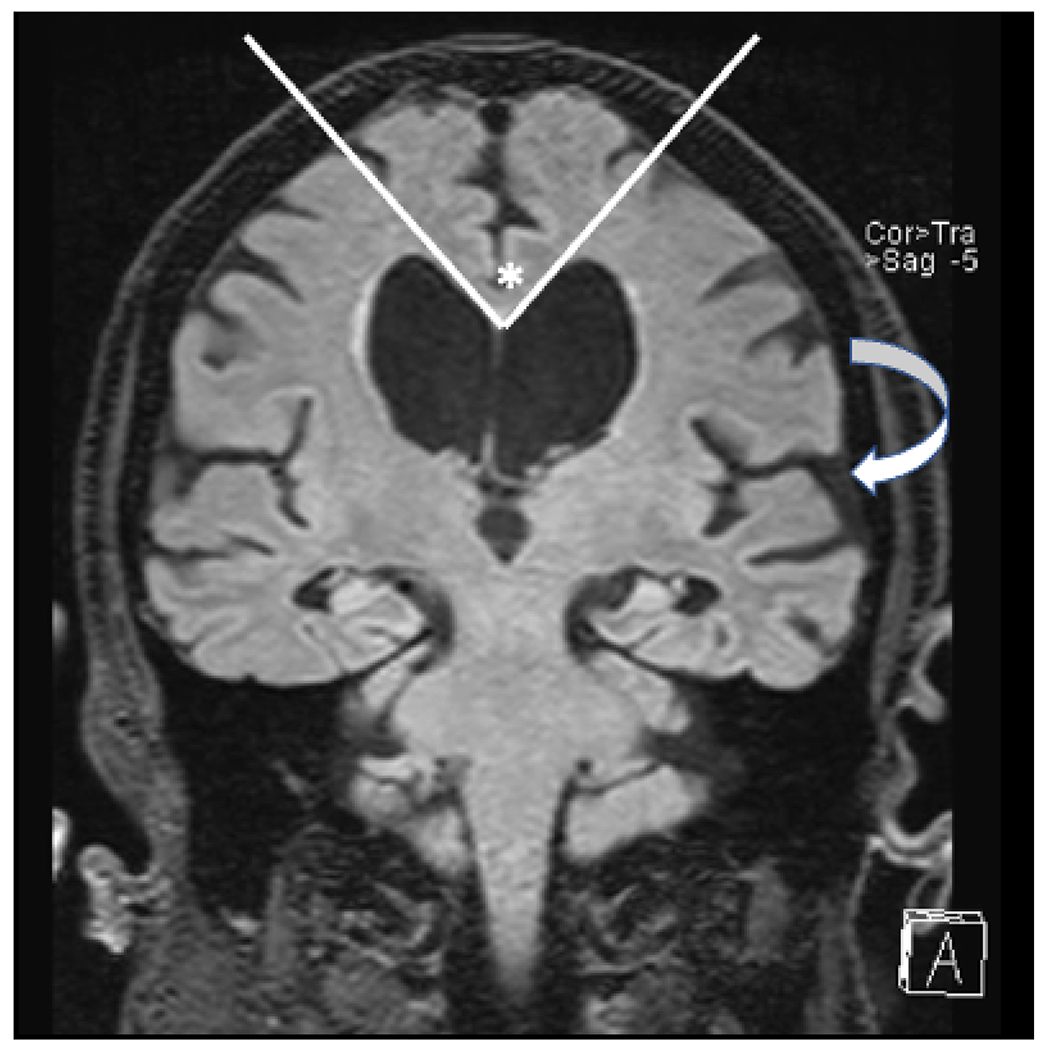
Coronal T2 FLAIR image in a patient with normal pressure hydrocephalus. The lateral ventricles are dilated out of proportion to sulcal prominence, there is an acute callosal angle (*), and there is widening of the Sylvian fissures (arrow).
Beyond excluding reversible causes of cognitive impairment, MRI can also be useful in identifying brain atrophy, particularly of the hippocampi, which are commonly affected early in AD. Qualitative MR assessment of hippocampal atrophy can be supplemented with quantitative metrics, such as measuring hippocampal volumes with FDA-approved software such as Neuroquant (https://www.cortechs.ai/products/neuroquant/), Neuroreader (https://brainreader.net/) and Icometrix (https://icometrix.com/). Using such software packages, hippocampal volumes from the patient can be compared to a database of normal controls, matched for age, sex, and intracranial volume. However, there is evidence that visual assessment of medial temporal lobe atrophy has similar accuracy as quantitative hippocampal volumes,8 and volumes alone do not have high enough accuracies to diagnose AD.9 One meta-analysis of 33 studies and almost 4000 subjects found that hippocampal volumes had a pooled mean sensitivity and specificity of 73% and 71% respectively for diagnosing AD.9 Atrophy of the medial temporal lobe had a pooled mean sensitivity and specificity of 64% and 65%, and lateral ventricular volumes had a pooled mean sensitivity and specificity of only 57% and 64%.
FDG-PET
18F-Fluorodeoxyglucose (FDG) PET is another noninvasive imaging modality commonly used to diagnose AD. FDG-PET assesses cerebral glucose metabolism, which is typically decreased in the posterior cingulate, precuneus, and temporoparietal cortex in AD,10 due to decreased synaptic density and function. A meta-analysis of 119 studies from 1990 to 2010 showed that FDG-PET has a high accuracy in differentiating AD from normal controls, with 90% sensitivity and 89% specificity, compared to 83% sensitivity and 89% specificity by MRI.11 In clinical practice, FDG-PET is covered by the U.S. Centers for Medicare and Medicaid Services to differentiate AD and frontotemporal dementia (FTD) in individuals who have had cognitive impairment for more than 6 months. Unlike AD, FTD is characterized by decreased FDG avidity in the frontal and temporal lobes.12
Beyond visually identifying regional patterns of decreased FDG avidity, quantitative assessment of FDG-PET can be useful clinically to detect more subtle areas of hypometabolism. Automated software packages can be used to coregister FDG-PET images to an atlas of normal brain images from individuals in a similar age range (Fig. 2). FDG uptake in atlas-based anatomic regions are then compared between the patient and the normal controls. Z-scores are obtained for each anatomic region, which reflect the degree of decreased FDG avidity in each region, compared to the normal controls. These Z-scores can be used to confirm whether the pattern of decreased FDG avidity is most compatible with AD or FTD (Figs. 3–5). Several papers that have investigated whether automated quantitative methods for assessing regional FDG uptake improve detection of AD have reported an increase in specificities from approximately 58-84% for visual assessment to 87-98% with quantitative assessment.13–15 On the other hand, sensitivities for detecting AD are similar, ranging from 73- 85% for visual assessment and 73-98% for quantitative assessment.
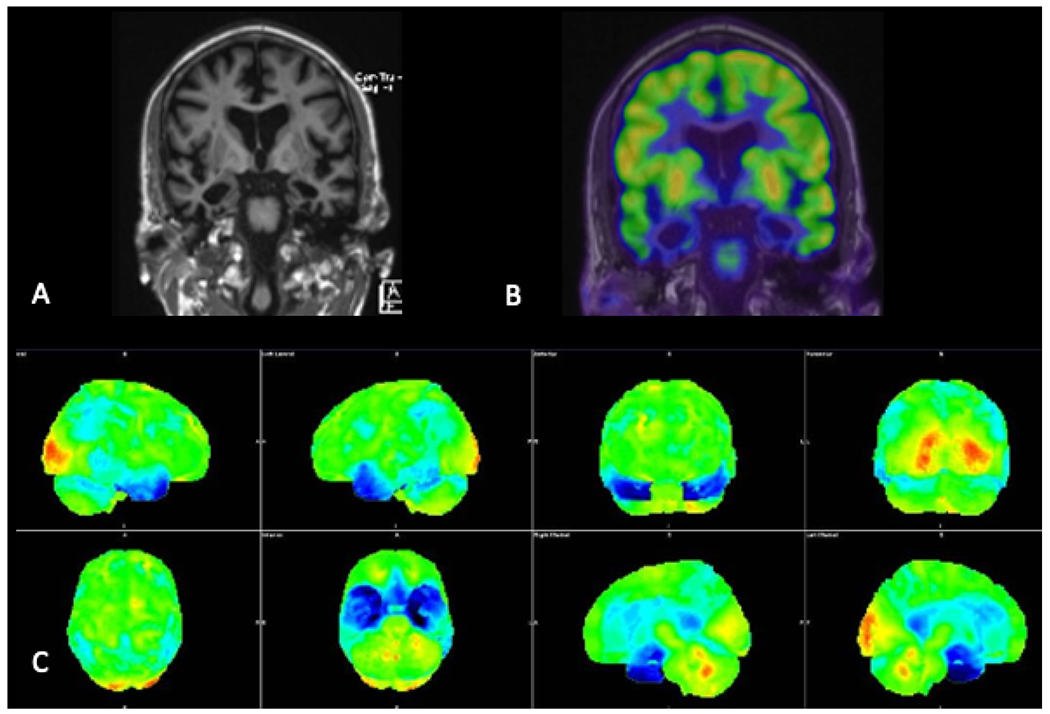
Fig. 2.
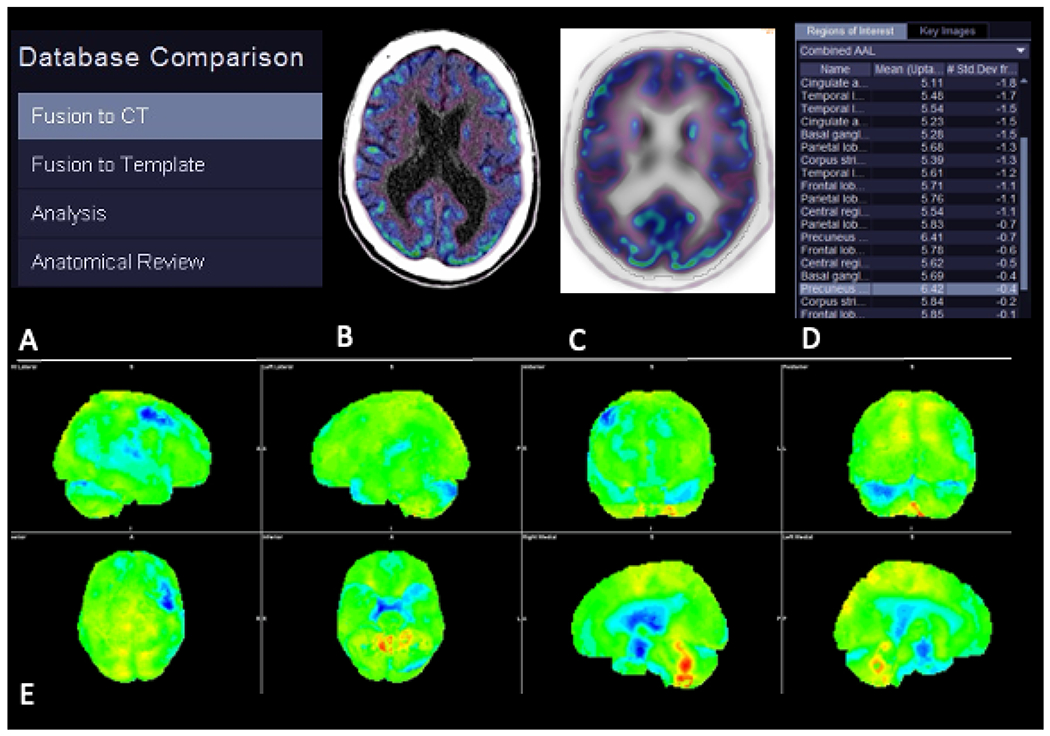
Typical workflow when comparing a patient’s FDG-PET scan with a normative database. Steps (A) include fusion of the patient’s PET scan with a structural image (B), fusion of the patient’s structural image to a template image in the same space as the normative images (C), and comparison of FDG avidity between the patient and the database across all voxels and regions-of-interest (D). Three-dimensional stereotactic surface projection images (E) with colors representing the patient’s FDG avidity in standard deviations from the normative database.
Fig. 3.
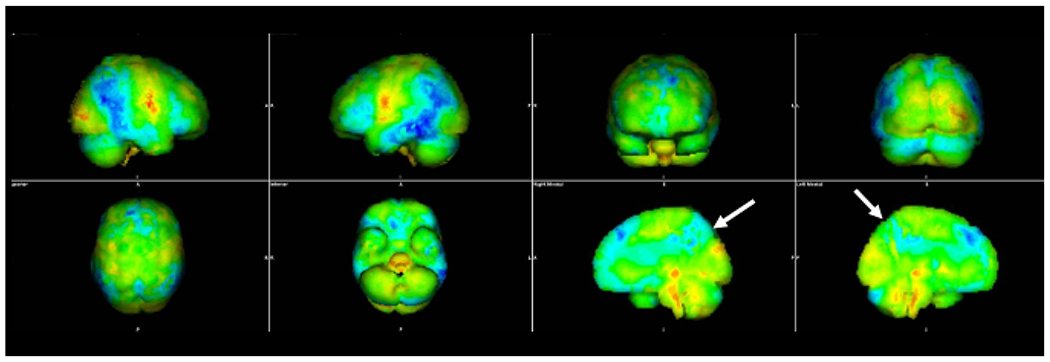
Three-dimensional stereotactic surface projection images in a patient with Alzheimer’s disease. The blue color denotes brain regions in which the FDG avidity is at least three standard deviations lower than similarly aged healthy controls from a normative database. The distribution of decreased FDG avidity in the temporal and parietal lobes, particularly the precuneus (arrows), is typical of Alzheimer’s disease.
Fig. 5.
Axial T1-weighted MR image (A) demonstrates marked bilateral frontal lobe atrophy in a patient with behavioral variant frontotemporal dementia (bvFTD). Three-dimensional stereotactic surface projection images (B) demonstrate decreased FDG avidity in frontal and temporal lobes bilaterally, a distribution typical of bvFTD.
In addition to differentiating AD and FTD, FDG-PET can be useful in diagnosing atypical forms of AD. For example, patients with posterior cortical atrophy (PCA), commonly considered the “visual variant of AD,” have decreased FDG avidity in the temporal and parietal lobes, similar to typical AD, but also in the occipital lobes (Fig. 6).16 Involvement of the occipital lobes is typically more asymmetric than in dementia with Lewy bodies (Fig. 7). Cerebral amyloid angiopathy (Fig. 8) would be another entity to consider with occipital lobe involvement and can be seen concomitantly with AD.17 Patients with logopenic variant primary progressive aphasia (lvPPA), the “language variant of AD,” typically have decreased FDG avidity in the temporal and parietal lobes, but it is typically asymmetric, commonly involving the left hemisphere (Fig. 9).18–21 The other two subtypes of primary progressive aphasia (PPA), nonfluent variant PPA (nfvPPA) and semantic variant PPA (svPPA), are considered clinical syndromes of frontotemporal lobar degeneration. On FDG-PET, nfvPPA typically shows decreased FDG avidity in the frontal and parietal lobes, and svPPA shows decreased FDG avidity in the temporal lobe, commonly preferentially involving the left hemisphere (Fig. 10).18
Fig. 6.
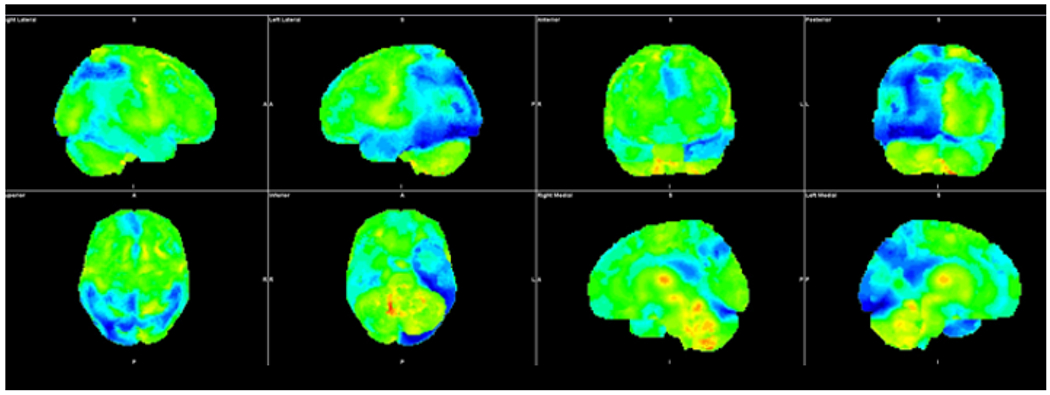
Three-dimensional stereotactic surface projection images demonstrate decreased FDG avidity in parietal and temporal lobes bilaterally, more pronounced on the left. In addition, there is decreased FDG avidity in the left occipital lobe. The temporoparietal distribution and asymmetric involvement of the left occipital lobe is compatible with posterior cortical atrophy, the visual variant of Alzheimer’s.
Fig. 7.
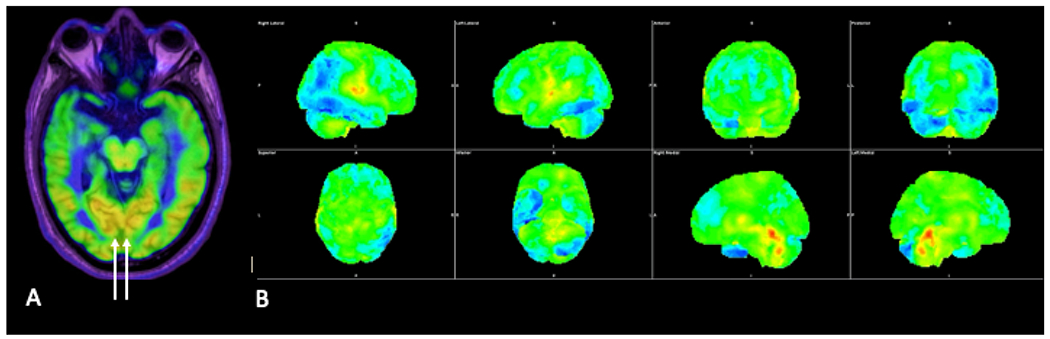
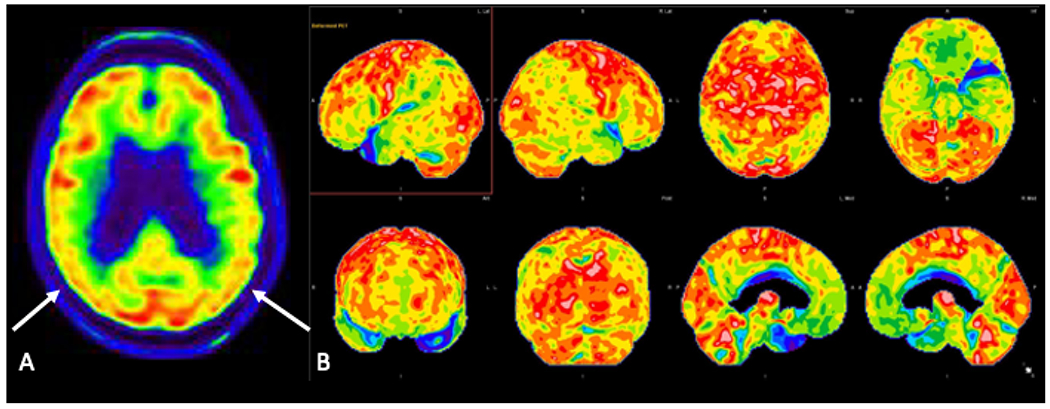
Axial FDG-PET image (A) in a patient with Lewy body dementia showing decreased FDG avidity in the temporal and occipital lobes bilaterally, although with preserved FDG avidity in the medial occipital lobes (arrows). Three-dimensional stereotactic surface projection images (B) demonstrate decreased FDG avidity in the bilateral temporal and occipital lobes and left parietal lobe.
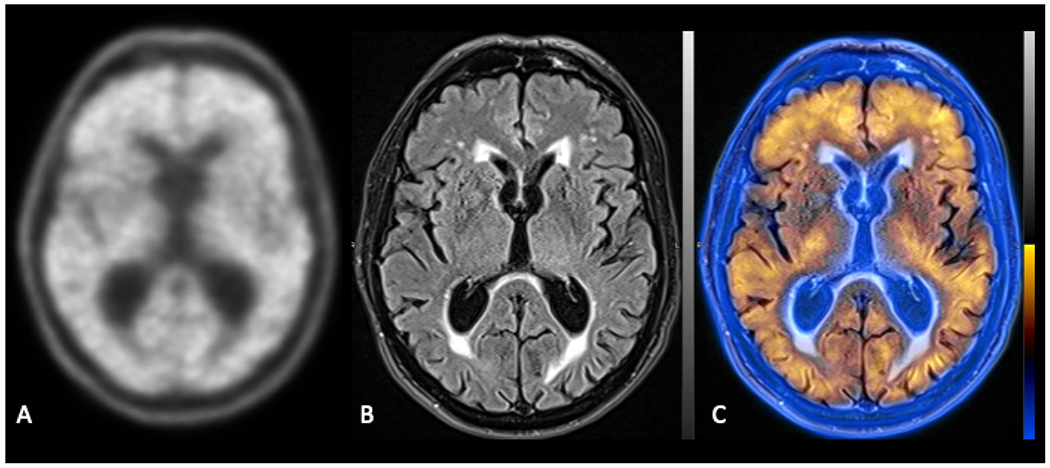
Fig. 8.
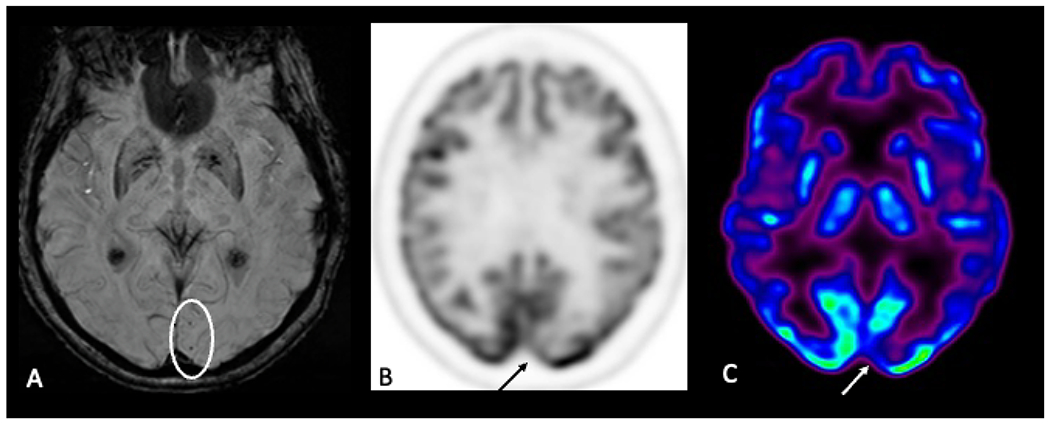
Axial susceptibility-weighted image (A) shows foci of microhemorrhage, suggestive of amyloid angiopathy. Axial FDG-PET images (B,C) demonstrate decreased FDG avidity in the left occipital lobe in the region of the microhemorrhages.
Fig. 9.
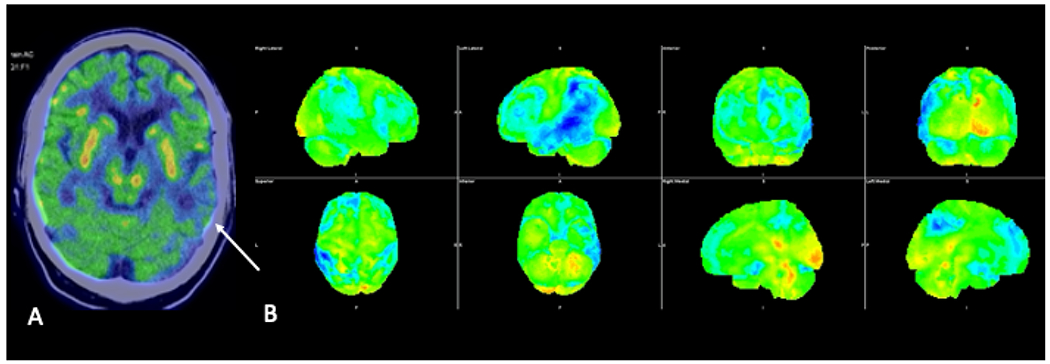
Axial FDG-PET image fused to the CT of the head (A) demonstrating asymmetrically decreased FDG avidity in the left temporal lobe (arrow). Three-dimensional stereotactic surface projection images (B) demonstrate asymmetrically decreased FDG avidity in the left parietal and temporal lobes, suggestive of logopenic variant primary progressive aphasia, the language variant of Alzheimer’s.
Fig. 10.
Coronal T1-weighted MRI (A), coronal FDG-PET image fused to the MRI (B), and three-dimensional stereotactic surface projection images demonstrating marked bilateral temporal lobe atrophy with associated decreased FDG avidity, compatible with semantic variant primary progressive aphasia.
Research PET tracers for neuroimaging AD
Amyloid PET
Since Aβ deposition is one of the neuropathologic hallmarks of AD, the use of amyloid PET using the tracer, 11C-Pittsburgh Compound B (PiB), in 2002 was a major advancement in the field in allowing for in vivo assessment of Aβ deposition.22 Although its 20-minute half-life limits routine clinical use, due to the need for a cyclotron in proximity, PiB PET remains widely used in AD research studies. Previously, the radiotracer 18F-FDDNP was developed to assess amyloid deposition, but it fell out of favor as it showed an affinity for both Aβ and tau,23 lacking specificity.
Currently, there are 3 FDA-approved 18F-labeled radiopharmaceuticals, florbetaben (NeuraCeq), florbetapir (Amyvid), and flutemetamol (Vizamyl). A positive scan shows cortical activity that is greater than or equal to white matter, commonly in the frontal, parietal, and temporal lobes, as well as the posterior cingulate gyrus and precuneus, resulting in loss of gray-white differentiation (Figs. 11,12). Because healthy controls can have Aβ deposition for years before developing AD,24 a positive amyloid scan does not definitively diagnose AD. However, a negative amyloid PET scan is useful in excluding AD.
Fig. 11.
Axial image from an amyloid PET scan using the tracer, Pittsburgh Compound B, fused to the MRI of the head (A) demonstrating beta-amyloid deposition in the bilateral frontal lobes and right greater than left parietal lobes. Axial image from a tau PET scan using the tracer, MK6240, fused to the MRI of the head (B) demonstrating tau deposition in the right uncus.
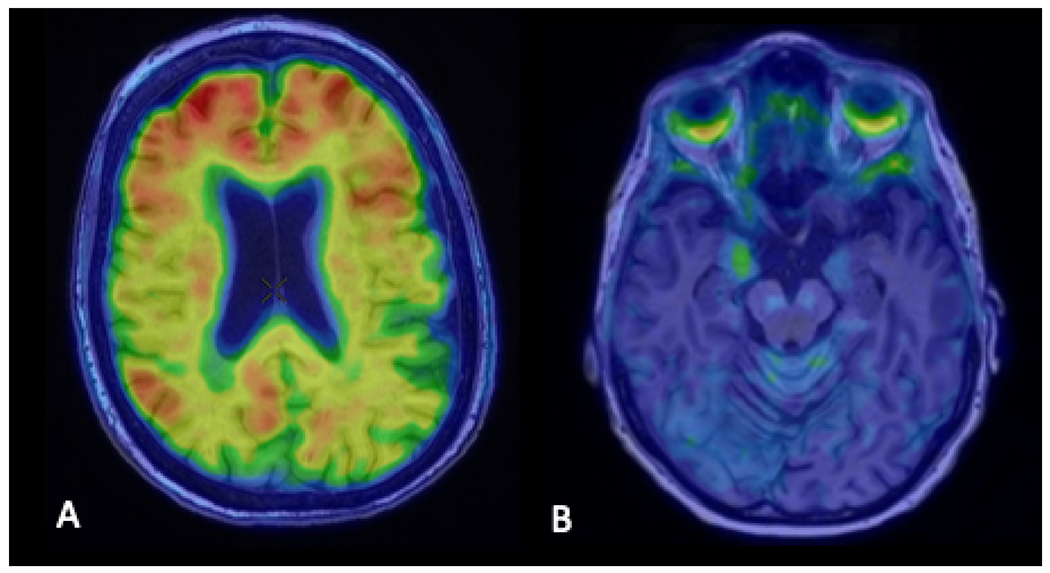
Fig. 12.
Axial image from an amyloid PET scan using the tracer, 18F-florbetaben, demonstrating diffuse beta-amyloid deposition (A). Axial T2 FLAIR image (B) fused to the amyloid PET image (C) confirms that the amyloid tracer uptake is in both cortical gray matter and white matter.
Identifying the presence of Aβ deposition will become even more important as anti-amyloid therapies are being developed. The first, aducanumab (Aduhelm), was FDA approved in June 2021 and is a monoclonal antibody designed to clear Aβ in the brain, in the hopes of slowing the progression of cognitive impairment.25 In clinical trials, the main adverse effects of aducanumab have been termed amyloid-related imaging abnormalities (ARIA), manifesting as either brain edema (ARIA-E), brain hemorrhage (ARIA-H) or a combination of the two.26 Up to one third of trial patients receiving aducanumab had one of these adverse events, with 10% of patients having symptoms, such as headache, confusion, vision changes, dizziness, nausea, or vomiting.27 Amyloid PET scans will be crucial to identify patients with Aβ, who may benefit from this drug, and MR imaging will be crucial to monitoring these patients for edema and hemorrhage.
Tau PET
PET tracers can also be used for in vivo visualization of tau neurofibrillary tangle (NFT) aggregates, the other pathological hallmark of AD. The only FDA-approved tau tracer is [18F]-flortaucipir (AV-1451, trade name: Tauvid), which is considered a first-generation tau tracer (Fig. 13). In typical amnestic AD, high [18F]-flortaucipir uptake is seen in the posterior cingulate, precuneus, and lateral temporal and parietal lobes, with sparing of the primary visual, auditory, and sensorimotor cortices.28 Unlike amyloid PET, which is typically read as positive or negative, [18F]-flortaucipir uptake correlates with severity of cortical atrophy, allowing for AD staging. The major drawback of the first-generation tracers is off-target binding, especially to the choroid plexus, which can limit accurate quantification of tau deposition in the temporal lobes. Second generation ligands, such as [18F]-MK6240 (Fig. 11) and [18F]-PI-2620, are actively being tested, and early results have indicated decreased off-target signal with improved binding to tau aggregates.28
Fig. 13.
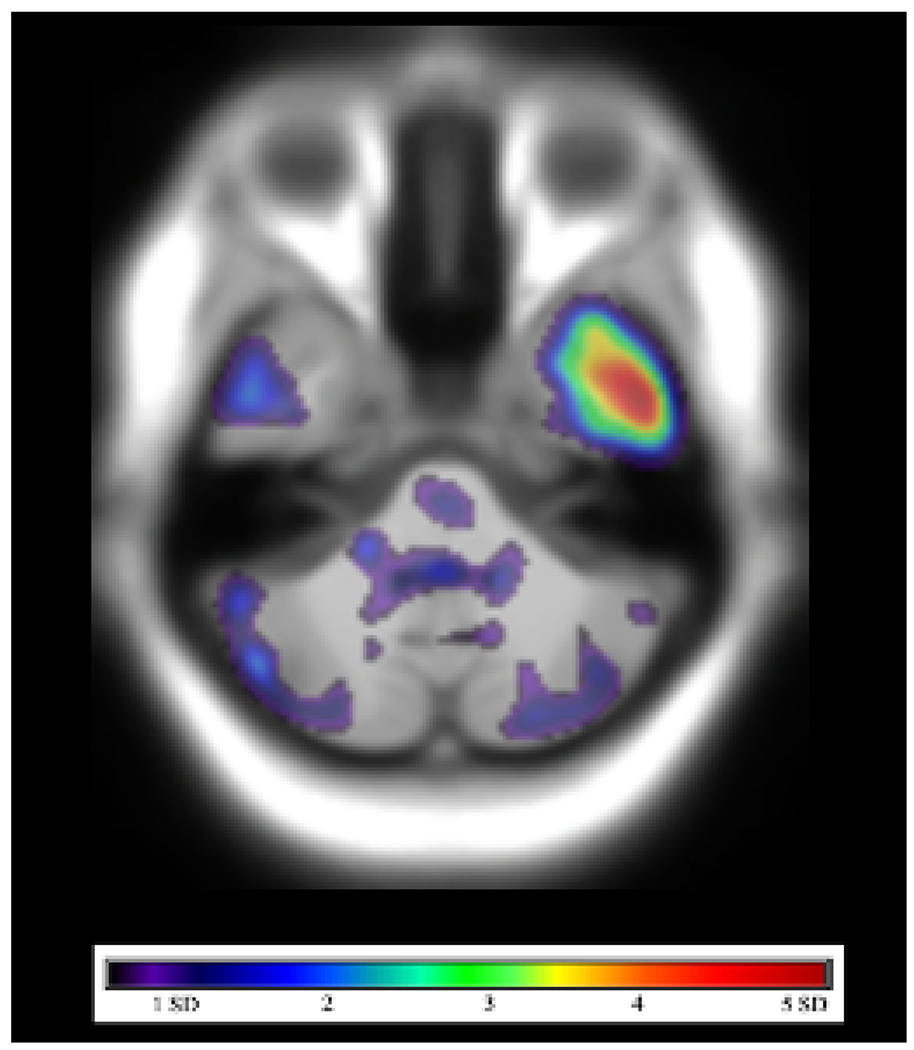
[18F]-flortaucipir PET-MRI in a patient with mild cognitive impairment. SUVR in a combined region-of-interest, including the entorhinal cortex, amygdala, and inferior temporal cortex, was greater than 1.22 relative to cerebellar cortex, compatible with increased tau deposition.
Of note, several non-AD neurodegenerative diseases are also characterized by tau deposition, including Pick disease, progressive supranuclear palsy, and corticobasal degeneration. However, [18F]-flortaucipir has been shown to have lower affinity for the non-Alzheimer’s disease tauopathies. On the other hand, [18F]-flortaucipir uptake may be seen in chronic traumatic encephalopathy (CTE), typically in the superior and dorsolateral frontal cortex early in the disease process, then later involving the temporal and parietal cortices.29
Future of PET in Dementia
Several new tracers are currently being developed to further characterize pathophysiologic processes underlying dementia using PET.
SV2A (Synaptic Markers)
Loss of normal synaptic density is a well-characterized and consistent pathologic process in AD. Post-mortem evaluation in patients with prodromal or mild AD has identified the hippocampus as the site with the most pronounced synaptic loss, with the degree of synaptic loss corresponding to AD severity.30 PET imaging targeting synaptic vesicle glycoprotein 2A (SV2A), which is nearly ubiquitous in presynaptic terminal synaptic vesicles, allows for in vivo examination of synaptic density. Early investigations have shown reductions in SV2A binding with the radiotracer [11C]UCB-J in the mesiotemporal and neocortical regions of the brain in early AD patients, which was reduced to an even greater extent than the associated gray matter loss.31 Similar to other 11C PET tracers, the short 20-minute half-life of this tracer limits its use to clinical facilities with onsite cyclotrons. [18F]UCB-H is another radiotracer that targets SV2A, and reduced hippocampal uptake with this tracer, reflective of synaptic loss, has been shown to correlate with cognitive impairment in MCI and AD.32
Neuroinflammation
Neuroinflammation is another key pathophysiologic process in AD, characterized by activated microglia and astrocytes surrounding Aβ plaques. To date, the most well-studied avenue to target activated microglia is via the increased expression of the translocator protein (18 kDa) (TSPO). In the central nervous system, TSPO is primarily expressed in the outer mitochondrial membrane of steroid-producing cells, such as microglia, astrocytes, and endothelial cells, to transport cholesterol into the mitochondria.33 TSPO expression can be assessed with [11C]-PK-11195, considered a first generation TSPO tracer, with increased uptake on PET showing an association with Aβ accumulation in patients with MCI and AD compared to healthy controls.34
First generation TSPO tracers, like [11C]-PK-11195, demonstrate two major drawbacks: their relatively low brain permeability and their high nonspecific or plasma binding, resulting in a low signal-to-noise ratio.35 To combat these issues, second generation radiopharmaceuticals have been developed, including [18F]-FEMPA,36 [18F]-FEPPA,37 [18F]-DPA-714,38 and [11C]-PBR28.39 However, the second generation TSPO tracers show variable binding affinity that is dependent on an rs6971 genetic polymorphism, meaning a genetic test must be completed before results can be interpreted.40 Other tracers, such as [11C]-deuterium-L-deprenyl (DED), bind irreversibly to monoamine oxidase B, which can be an alternative way of identifying neuroinflammation, since MAO-B is overexpressed in activated astrocytes.40
Cholinergic cell death
Cholinergic cell death underlies both AD and Dementia with Lewy Bodies (DLB), and the degree of cell death strongly correlates with symptom severity.41 Multiple radiopharmaceuticals have been developed to target the cholinergic system, such as [18F]-Fluoroethoxybenzovesamicol (FEOBV)42 and [18F]-VAT,43 which has high binding affinity for the vesicular acetylcholine transporter, a glycoprotein on the membrane of synaptic vesicles of cholinergic neurons. Studies measuring FEOBV tracer activity have found cortical cholinergic degeneration to be proportional to cholinergic basal forebrain atrophy in AD, suggesting FEOBV may have utility in quantifying cholinergic degeneration.42 Early studies have also shown FEOBV to be more sensitive for the detection of early AD than certain amyloid tracers.44 The slow kinetics of FEOBV in the basal ganglia may be disadvantageous clinically, however, as studies may require long scan times.
Dopaminergic targets
Dopaminergic tracers can be used to differentiate AD from DLB. For example, decreased uptake of the radiotracer [18F]FDOPA, a labeled analogue of L-DOPA, has been reported in the putamen in DLB patients compared to AD.45 In one retrospective review of 46 cases of suspected DLB on FDG PET/CT, only 6 were still considered DLB after [18F]FDOPA PET/CT.45 [18F]-FP-CIT is another tracer that can be used to measure striatal dopamine transporter activity. Reduced [18F]-FP-CIT has been reported to correlate with occipital Aβ deposition in patients with DLB, possibly contributing to visuospatial dysfunction in these patients.46
Summary
While FDG PET is the most widely used PET tracer in current clinical practice, there are numerous PET radiotracers that allow us to monitor the pathophysiology underlying AD, such as Aβ deposition, tau deposition, loss of synaptic density, neuroinflammation, cholinergic cell death, and decreased monoamine neurotransmission. Currently, there are 3 FDA-approved 18F-labeled radiopharmaceuticals to assess Aβ deposition: florbetaben (NeuraCeq), florbetapir (Amyvid), and flutemetamol (Vizamyl). These are used in clinical trials, but not yet reimbursed for clinical diagnostic use. [18F]-flortaucipir, used to assess tau deposition in staging AD, is similarly FDA-approved, but not yet used clinically. As more of these PET radiotracers enter mainstream clinical practice, our ability to diagnose, manage, and potentially treat neurodegenerative disease will improve dramatically.
Fig. 4.
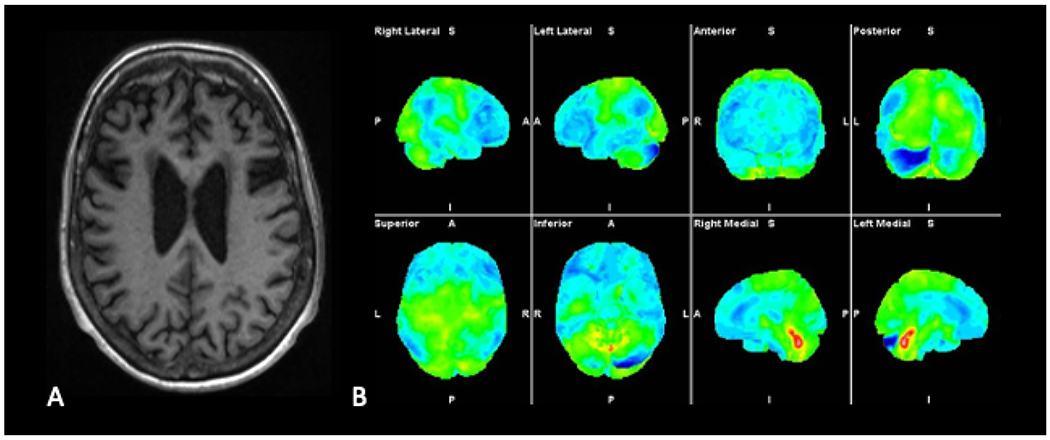
Axial FDG-PET image (A) in a patient with amnestic mild cognitive impairment demonstrates decreased FDG avidity in the parietal lobes bilaterally (arrows). Three-dimensional stereotactic surface projection images (B) demonstrate decreased FDG avidity in the precuneus, posterior cingulate gyrus, and temporal and parietal lobes bilaterally, suggestive of underlying AD pathology.
Key Points:
Specific PET tracers allow for in vivo localization of amyloid and tau, the pathologic hallmarks of Alzheimer’s disease
An understanding of the different distributions of decreased FDG avidity can help differentiate typical AD from AD variants and other common neurodegenerative diseases, such as frontotemporal dementia
Several new PET radiotracers are actively being researched and show potential in the diagnosis and management of neurodegenerative diseases
Clinics Care Points.
Although the imaging evaluation of dementia typically begins with MRI, FDG-PET has higher sensitivity for diagnosing Alzheimer’s disease.
Automated software packages that compare a patient’s FDG avidity against a normative database of FDG images from healthy controls can be helpful in improving detection of Alzheimer’s disease.
There are FDA-approved tracers of amyloid and tau, but they are not yet widely reimbursed and therefore typically obtained only in the setting of clinical trials.
Disclosures:
Research reported in this publication was supported in part by the following grants: National Institutes of Health/National Institute on Aging R01AG068398 (G.C.), ASNR 2021 Boerger Research Fund for Alzheimer’s Disease and Neurocognitive Disorders (A.F.).
Abbreviations:
- PET
positron emission tomography
- MRI
magnetic resonance imaging
- AD
Alzheimer’s disease
- Aβ
beta-amyloid
Footnotes
Publisher's Disclaimer: This is a PDF file of an unedited manuscript that has been accepted for publication. As a service to our customers we are providing this early version of the manuscript. The manuscript will undergo copyediting, typesetting, and review of the resulting proof before it is published in its final form. Please note that during the production process errors may be discovered which could affect the content, and all legal disclaimers that apply to the journal pertain.
References
- 1.Alzheimer’s Association. 2019 Alzheimer’s disease facts and figures. Accessed March 20, 2022. https://www.alz.org/media/documents/alzheimers-facts-and-figures-2019-r.pdf.
- 2.Jack CR Jr., Bennett DA, Blennow K, et al. NIA-AA Research Framework: Toward a biological definition of Alzheimer’s disease. Alzheimers Dement 2018;14:535–562. [DOI] [PMC free article] [PubMed] [Google Scholar]
- 3.Thal DR, Rub U, Orantes M, Braak H. Phases of A beta-deposition in the human brain and its relevance for the development of AD. Neurology 2002;58:1791–1800. [DOI] [PubMed] [Google Scholar]
- 4.Braak H, Braak E. Evolution of the neuropathology of Alzheimer’s disease. Acta Neurol Scand Suppl 1996;165:3–12. [DOI] [PubMed] [Google Scholar]
- 5.Kumar ADS. Neuropathology and therapeutic management of Alzheimer’s disease - An update. Drugs Future 2008;33:433. [Google Scholar]
- 6.Clarfield AM. The decreasing prevalence of reversible dementias: an updated meta-analysis. Arch Intern Med 2003;163:2219–2229. [DOI] [PubMed] [Google Scholar]
- 7.Hashimoto M, Ishikawa M, Mori E, Kuwana N, Study of Ioni. Diagnosis of idiopathic normal pressure hydrocephalus is supported by MRI-based scheme: a prospective cohort study. Cerebrospinal Fluid Res 2010;7:18. [DOI] [PMC free article] [PubMed] [Google Scholar]
- 8.Persson K, Barca ML, Cavallin L, et al. Comparison of automated volumetry of the hippocampus using NeuroQuant(R) and visual assessment of the medial temporal lobe in Alzheimer’s disease. Acta Radiol 2018;59:997–1001. [DOI] [PubMed] [Google Scholar]
- 9.Lombardi G, Crescioli G, Cavedo E, et al. Structural magnetic resonance imaging for the early diagnosis of dementia due to Alzheimer’s disease in people with mild cognitive impairment. Cochrane Database Syst Rev 2020;3:CD009628. [DOI] [PMC free article] [PubMed] [Google Scholar]
- 10.Mahalingam S, Chen MK. Neuroimaging in Dementias. Semin Neurol 2019;39:188–199. [DOI] [PubMed] [Google Scholar]
- 11.Bloudek LM, Spackman DE, Blankenburg M, Sullivan SD. Review and meta-analysis of biomarkers and diagnostic imaging in Alzheimer’s disease. J Alzheimers Dis 2011;26:627–645. [DOI] [PubMed] [Google Scholar]
- 12.Brown RK, Bohnen NI, Wong KK, Minoshima S, Frey KA. Brain PET in suspected dementia: patterns of altered FDG metabolism. Radiographics 2014;34:684–701. [DOI] [PubMed] [Google Scholar]
- 13.Frisoni GB, Bocchetta M, Chetelat G, et al. Imaging markers for Alzheimer disease: which vs how. Neurology 2013;81:487–500. [DOI] [PMC free article] [PubMed] [Google Scholar]
- 14.Ng S, Villemagne VL, Berlangieri S, et al. Visual assessment versus quantitative assessment of 11C-PIB PET and 18F-FDG PET for detection of Alzheimer’s disease. J Nucl Med 2007;48:547–552. [DOI] [PubMed] [Google Scholar]
- 15.Rabinovici GD, Rosen HJ, Alkalay A, et al. Amyloid vs FDG-PET in the differential diagnosis of AD and FTLD. Neurology 2011;77:2034–2042. [DOI] [PMC free article] [PubMed] [Google Scholar]
- 16.Whitwell JL, Graff-Radford J, Singh TD, et al. (18)F-FDG PET in Posterior Cortical Atrophy and Dementia with Lewy Bodies. J Nucl Med 2017;58:632–638. [DOI] [PMC free article] [PubMed] [Google Scholar]
- 17.Bergeret S, Queneau M, Rodallec M, et al. [(18) F]FDG PET may differentiate cerebral amyloid angiopathy from Alzheimer’s disease. Eur J Neurol 2021;28:1511–1519. [DOI] [PubMed] [Google Scholar]
- 18.Cerami C, Dodich A, Greco L, et al. The Role of Single-Subject Brain Metabolic Patterns in the Early Differential Diagnosis of Primary Progressive Aphasias and in Prediction of Progression to Dementia. J Alzheimers Dis 2017;55:183–197. [DOI] [PMC free article] [PubMed] [Google Scholar]
- 19.Whitwell JL, Jack CR Jr., Kantarci K, et al. Imaging correlates of posterior cortical atrophy. Neurobiol Aging 2007;28:1051–1061. [DOI] [PMC free article] [PubMed] [Google Scholar]
- 20.Rabinovici GD, Jagust WJ, Furst AJ, et al. Abeta amyloid and glucose metabolism in three variants of primary progressive aphasia. Ann Neurol 2008;64:388–401. [DOI] [PMC free article] [PubMed] [Google Scholar]
- 21.Gorno-Tempini ML, Dronkers NF, Rankin KP, et al. Cognition and anatomy in three variants of primary progressive aphasia. Ann Neurol 2004;55:335–346. [DOI] [PMC free article] [PubMed] [Google Scholar]
- 22.Klunk WE, Mathis CA. The future of amyloid-beta imaging: a tale of radionuclides and tracer proliferation. Curr Opin Neurol 2008;21:683–687. [DOI] [PMC free article] [PubMed] [Google Scholar]
- 23.Agdeppa ED, Kepe V, Liu J, et al. Binding characteristics of radiofluorinated 6-dialkylamino-2-naphthylethylidene derivatives as positron emission tomography imaging probes for beta-amyloid plaques in Alzheimer’s disease. J Neurosci 2001;21:RC189. [DOI] [PMC free article] [PubMed] [Google Scholar]
- 24.Hardy JA, Higgins GA. Alzheimer’s disease: the amyloid cascade hypothesis. Science 1992;256:184–185. [DOI] [PubMed] [Google Scholar]
- 25.Office of the Commissioner. FDA grants accelerated approval for Alzheimer’s drug. U.S. Food and Drug Administration. Published June 7, 2021. Accessed March 20, 2022. https://www.fda.gov/news-events/press-announcements/fda-grants-accelerated-approval-alzheimers-drug. [Google Scholar]
- 26.EMERGE and EMERGE and ENGAGE Topline Results: Two Phase 3 Studies to Evaluate Aducanumab in Patients With Early Alzheimer’s Disease. 2019; (https://investors.biogen.com/static-files/ddd45672-9c7e-4c99-8a06-3b557697c06f).
- 27.Tampi RR, Forester BP, Agronin M. Aducanumab: evidence from clinical trial data and controversies. Drugs Context 2021;10. [DOI] [PMC free article] [PubMed] [Google Scholar]
- 28.Mueller A, Bullich S, Barret O, et al. Tau PET imaging with (18)F-PI-2620 in Patients with Alzheimer Disease and Healthy Controls: A First-in-Humans Study. J Nucl Med 2020;61:911–919. [DOI] [PMC free article] [PubMed] [Google Scholar]
- 29.McKee AC, Stern RA, Nowinski CJ, et al. The spectrum of disease in chronic traumatic encephalopathy. Brain 2013;136:43–64. [DOI] [PMC free article] [PubMed] [Google Scholar]
- 30.Scheff SW, Price DA, Schmitt FA, DeKosky ST, Mufson EJ. Synaptic alterations in CA1 in mild Alzheimer disease and mild cognitive impairment. Neurology 2007;68:1501–1508. [DOI] [PubMed] [Google Scholar]
- 31.Mecca AP, Chen MK, O’Dell RS, et al. In vivo measurement of widespread synaptic loss in Alzheimer’s disease with SV2A PET. Alzheimers Dement 2020;16:974–982. [DOI] [PMC free article] [PubMed] [Google Scholar]
- 32.Bastin C, Bahri MA, Meyer F, et al. In vivo imaging of synaptic loss in Alzheimer’s disease with [18F]UCB-H positron emission tomography. Eur J Nucl Med Mol Imaging 2020;47:390–402. [DOI] [PubMed] [Google Scholar]
- 33.Rupprecht R, Papadopoulos V, Rammes G, et al. Translocator protein (18 kDa) (TSPO) as a therapeutic target for neurological and psychiatric disorders. Nat Rev Drug Discov 2010;9:971–988. [DOI] [PubMed] [Google Scholar]
- 34.Parbo P, Ismail R, Hansen KV, et al. Brain inflammation accompanies amyloid in the majority of mild cognitive impairment cases due to Alzheimer’s disease. Brain 2017;140:2002–2011. [DOI] [PubMed] [Google Scholar]
- 35.Vivash L, O’Brien TJ. Imaging Microglial Activation with TSPO PET: Lighting Up Neurologic Diseases? J Nucl Med 2016;57:165–168. [DOI] [PubMed] [Google Scholar]
- 36.Varrone A, Oikonen V, Forsberg A, et al. Positron emission tomography imaging of the 18-kDa translocator protein (TSPO) with [18F]FEMPA in Alzheimer’s disease patients and control subjects. Eur J Nucl Med Mol Imaging 2015;42:438–446. [DOI] [PubMed] [Google Scholar]
- 37.Suridjan I, Pollock BG, Verhoeff NP, et al. In-vivo imaging of grey and white matter neuroinflammation in Alzheimer’s disease: a positron emission tomography study with a novel radioligand, [18F]-FEPPA. Mol Psychiatry 2015;20:1579–1587. [DOI] [PMC free article] [PubMed] [Google Scholar]
- 38.Hamelin L, Lagarde J, Dorothee G, et al. Distinct dynamic profiles of microglial activation are associated with progression of Alzheimer’s disease. Brain 2018;141:1855–1870. [DOI] [PubMed] [Google Scholar]
- 39.Toppala S, Ekblad LL, Tuisku J, et al. Association of Early beta-Amyloid Accumulation and Neuroinflammation Measured With [(11)C]PBR28 in Elderly Individuals Without Dementia. Neurology 2021;96:e1608–e1619. [DOI] [PMC free article] [PubMed] [Google Scholar]
- 40.Zhou R, Ji B, Kong Y, et al. PET Imaging of Neuroinflammation in Alzheimer’s Disease. Front Immunol 2021;12:739130. [DOI] [PMC free article] [PubMed] [Google Scholar]
- 41.Grothe MJ, Schuster C, Bauer F, Heinsen H, Prudlo J, Teipel SJ. Atrophy of the cholinergic basal forebrain in dementia with Lewy bodies and Alzheimer’s disease dementia. J Neurol 2014;261:1939–1948. [DOI] [PubMed] [Google Scholar]
- 42.Aghourian M, Aumont E, Grothe MJ, Soucy JP, Rosa-Neto P, Bedard MA. FEOBV-PET to quantify cortical cholinergic denervation in AD: Relationship to basal forebrain volumetry. J Neuroimaging 2021;31:1077–1081. [DOI] [PubMed] [Google Scholar]
- 43.Jin H, Yue X, Liu H, et al. Kinetic modeling of [(18) F]VAT, a novel radioligand for positron emission tomography imaging vesicular acetylcholine transporter in non-human primate brain. J Neurochem 2018;144:791–804. [DOI] [PMC free article] [PubMed] [Google Scholar]
- 44.Aghourian M, Legault-Denis C, Soucy JP, et al. Quantification of brain cholinergic denervation in Alzheimer’s disease using PET imaging with [(18)F]-FEOBV. Mol Psychiatry 2017;22:1531–1538. [DOI] [PubMed] [Google Scholar]
- 45.Emsen B, Villafane G, David JP, et al. Clinical impact of dual-tracer FDOPA and FDG PET/CT for the evaluation of patients with parkinsonian syndromes. Medicine (Baltimore) 2020;99:e23060. [DOI] [PMC free article] [PubMed] [Google Scholar]
- 46.Yoo HS, Lee S, Chung SJ, et al. Dopaminergic Depletion, beta-Amyloid Burden, and Cognition in Lewy Body Disease. Ann Neurol 2020;87:739–750. [DOI] [PubMed] [Google Scholar]