

Abstract
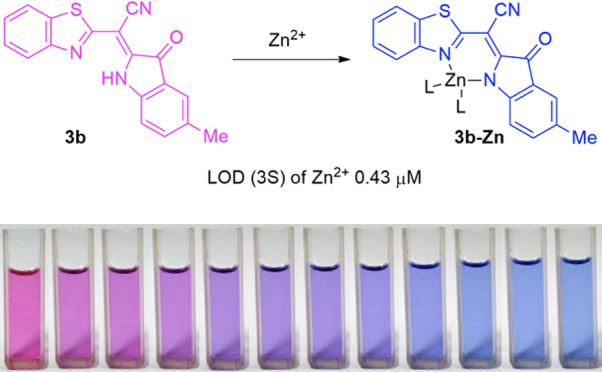
A new one-pot approach for the synthesis of the Zn2+-sensitive probes 2-azahetaryl-2-(oxoindolin-2-ylidene)acetonitriles 3a–c and 4 is described. The method includes the in situ formation of imidoylchloride and its further condensation with azahetarylacetonitrile 1. The structure of the obtained compounds is studied using 1H nuclear magnetic resonance (NMR), 13C NMR, infrared (IR), high-resolution mass spectrometry (HRMS), and UV–Vis spectroscopy techniques. Two model ligands both exhibiting the highest extinction coefficient and the best solubility in a Tris buffer pH 7.2/dimethyl sulfoxide (DMSO) solution, namely 5-methyl-benzothiazole derivative 3b and benzoxazole derivative 4, are thoroughly studied as colorimetric probes for Zn2+. The probe 3b has the highest sensitivity to Zn2+, showing a limit of ion detection (LOD) calculated by the 3S criterion of 0.43 μM and selectivity upon masking Cu2+ ions with Na2S2O3. The composition of the complexes in the solution was determined by the limited logarithm method. The stability constant (lg K) values of 3b-Zn of 10.27 ± 0.02 and 4-Zn of 12.5 ± 0.2 indicate the formation of complexes of average stability.
1. Introduction
Zinc is widely recognized as a “gatekeeper of the immune system”1 that protects the human body against diseases and possesses antioxidant, anti-inflammatory, and antiviral activities,2 including against Sars-Cov2.3−7 To assess the individual or population zinc status, various biomarkers are recommended, in particular, concentration of zinc in plasma or serum.8−10
From a research perspective, the recommended methods for the determination of Zn2+ in biofluids are atomic absorption spectroscopy and inductively coupled plasma mass spectrometry.11,12 However, these methods are too expensive to be involved in routine clinical analysis. Fluorescence analysis is also a widely used technique;13 however, UV–VIS spectrophotometry (SP) remains the state-of-the-art technique for biochemical and clinical research due to its accuracy, sensitivity, and simplicity. Despite the large number of chromophore probes for zinc,14 a limited number of them are used for serum and plasma SP analysis. Well-known ones in the range are PAR15 and Zincon,16 but they either do not have contrasting color transitions or sufficient selectivity or require toxic masking agents such as cyanide ions, for example, in serum analysis with nitro-PAPS17 (Figure 1).
Figure 1.

Structure of well-known chromophore probes for zinc.
It is known that porphyrinoids because of their large conjugated system have a strong absorption peak in the visible region.18 This feature correlates with their wide use as a sensitive chromogenic reagent for the detection of metal traces.18−22 However, their coordination to metals often requires elevated temperature, auxiliaries, or pH far from biologically relevant conditions,18,19 probably because of the rigidity of the cavity and the required deprotonations (Figure 2a). Moreover, fast functionalization of porphyrins suffers from significant synthetic limitations; thus, switching their coordination and optical properties is troublesome. Multistep synthesis of the probe is indeed usually required.23
Figure 2.

(a, b) Porphyrinoids and their simplified analogues as metal probes.
Here, we report simplified nonmacrocyclic analogues of porphyrins, 2-azahetaryl-2-(oxoindolin-2-ylidene)acetonitriles 3a–c and 4 that are easily available by a one-pot three-component reaction. Featuring the dipyrrin-like skeleton, they exhibit the potential for metal chelation. The representative probe 3b can chelate Zn2+ at room temperature (hereafter rt) in Tris buffer pH 7.2/DMSO (1/5, v/v) with a LOD equal to 0.43 μM and selectivity upon masking Cu2+ ions (Figure 2b).
2. Results and Discussion
2.1. Synthesis
To modulate the spectral characteristics of colorimetric probes, we aimed at simplifying the structure of the well-known porphyrins. Thus, we envisaged that 2-azahetaryl-2-(oxoindolin-2-ylidene)acetonitriles 3a–c and 4 might be competitive with porphyrins in terms of light absorption, while they could be synthesized from commercially available isatines 2 and N-hetarylacetonitriles 1 easily accessed synthetically from the readily available starting materials. Moreover, kinetics of the coordination of Zn2+ might be enhanced because of the decreased steric hindrance at the coordination site.
It is known that the reaction of isatines with nucleophiles is directed at position 3 of isatin. To direct the reaction at position 2, a preactivation can be achieved by refluxing isatin and PCl5 in benzene. The resulting imidoylchloride is so far, requiring isolation and dissolution in more polar solvents to perform the condensation reaction. This two-step approach decreases the yield of the product due to the poor stability of imidoylchloride, promoting the formation of byproducts.24−26
To overcome this limitation, we have reported a one-pot method consisting first ofin situ formation of imidoylchloride followed by its condensation with hetarylacetonitrile 1 (Scheme 1).27 Similar three-component reactions were applied for the synthesis of 2-azahetarylenaminonitriles as reported earlier by our group.28
Scheme 1. Synthesis of Dyes 3a–c and 4.

The limiting reaction step of the process is the generation of imidoylchloride, yet the reaction is over within an hour. The yield of the products ranges from 70 to 87%, and their purification is achieved by simple filtration through a plug of silica gel using dichloromethane as an eluent. In the 1H NMR spectra of 3a–c and 4, the characteristic broad peak of the proton of the amino group is significantly deshielded (δ = 11.4–12.0 ppm). Most likely, the reason for this downfield shift is an intramolecular hydrogen bond that forms between the nitrogen of the azaheterocycle and the hydrogen of the indolinone backbone. Single crystals of 3b are grown by a gas diffusion method from CHCl3/hexane; XRD allows the full assessment of the molecular structure (Figure 3).
Figure 3.

Molecular structure of 3b according to X-ray diffraction with the atom numbering used in the crystallographic analysis. (a) Planar projection and (b) orthogonal projection.
According to the XRD of 3b, the estimated length of the hydrogen bond N3H3A···N1 is 2.15 Å and the angle N3–H3A···N1 is equal to 123.3°. The dihedral angle between heterocycle planes is equal to 8.8°, which indicates an effective charge delocalization in the molecule, promoting the shift of the NH in 1H NMR to the deshielded side.
A complete assignment of the peaks at 1H and 13C NMR was performed using 2D NMR techniques (COSY, HMBC, and HMQC).
The method showed a wide scope allowing to generate a library of ligands to modulate the donating properties of the R substituent and the nature and electronic properties of the attached heterocycle. Thus, a library of compounds has been accessed based on either benzothiazole (3) or benzoxazole (4) from a reaction with unsubstituted isatin (a), isatin featuring a σ-donor such as a methyl group (b), or a π-donor such as a methoxy group (c).
2.2. Photophysical Properties
2-Azahetaryl-2-(5-R-3-oxoindoline-2-ylidene)acetonitriles are characterized by the rich color ranging from red to purple. The nonsubstituted isatin compounds 3a and 4 in DMSO featured absorption spectra with a long wave band at 425–600 nm and the maximum centered around 520 and 515 nm, respectively (Figure 4 and Table 1). Methyl- and methoxy-substituted compounds 3b and 3c in DMSO featured absorption spectra with the maximum centered around 530 and 550 nm, respectively, and featuring less intensive peaks at 650–750 nm. The increased bathochromic shift of the substituted dyes compared to nonsubstituted ones may be rationalized by the presence of electron density donors at the oxoindolinone core consequently shrinking of the HOMO–LUMO gap.
Figure 4.
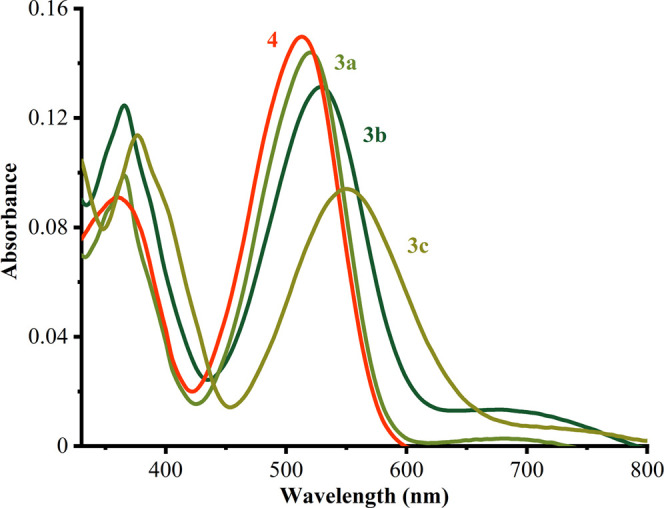
Absorption spectra of dyes 3a–c and 4 in DMSO solution. C = 10 μmol·L–1 and l = 1.00 cm.
Table 1. Spectrophotometric Characteristics of Dyes 3a–c and 4 in DMSO Solution.
| dye | λmax1, nm | ελmax1, mol–1 L cm–1, 104 | λmax2, nm | ελmax2, mol–1 L cm–1, 104 |
|---|---|---|---|---|
| 3a | 363 | 1.10 ± 0.11 | 520 | 1.48 ± 0.05 |
| 3b | 367 | 1.37 ± 0.07 | 530 | 1.38 ± 0.05 |
| 3c | 376 | 1.26 ± 0.05 | 550 | 1.03 ± 0.05 |
| 4 | 357 | 1.09 ± 0.14 | 515 | 1.66 ± 0.10 |
2.3. Photostability Test
To assess the stability of dyes in DMSO solutions, UV–Vis absorption spectra were recorded after 24 h, 72 h, 96 h, and 6 months of exposure to indirect light. The absorbance of the solutions remains unchanged, which indicates a high photostability of the dye solutions (see Figure S14).
2.4. UV–Vis Spectra in H2O/DMSO Solutions
Water solubility of 2-azahetaryl-2-(5-R-3-oxoindolin-2-ylidene)acetonitriles affects seriously their spectroscopic and chemical properties. The influence of water on the absorption spectra of the dyes 3a, 3b, and 4 in DMSO and the values of their molar absorption coefficient (ε) were studied (see Supporting Information Section 3). The molar absorption coefficient change was calculated as Δεmax, % = (εmax DMSO – εmax H2O/DMSO) × 100/εmax DMSO, where εmax DMSO and εmax H2O/DMSO are the molar absorption coefficient of dyes at λmax in DMSO and H2O/DMSO mixtures with different solvent ratios (v/v), respectively. Apparently, dyes 3b and 4 were found to be the most hydrophilic compounds in H2O/DMSO (1/(1.5 to 5), v/v) mixtures. The decrease of the molar absorption coefficient was lower than 10% (Δεmax ≤ 10%), while a decrease of the absorbance value up to 50% was observed for dye 3a (see Table S2). Based on this observation, dyes 3b and 4 were chosen for further investigations.
The deprotonation of molecules 3b and 4 at the NH site upon titration with alkaline solution is demonstrated in Figures 5 and 6. The isosbestic points located at 584 nm for 3b and 562 nm for 4 indicate the coexistence of two forms (neutral and anionic) of dyes in alkaline solutions. The bathochromic shifts (Δλ) of the absorption bands of neutral forms (λmax = 530 nm (3b) and λmax = 515 nm (4)) to anionic forms are equal to 150 nm for 3b and 130 nm for 4, which correspond to the drastic color change from purple to turquoise visible by the naked eye. These transitions were shown to be reversible. The bathochromic shift occurring under basic conditions may be rationalized by the formation of an anion, characterized by the facilitated oscillation of the π-electrons compared to the neutral form. Therefore, less energy is required to excite the electrons, which causes a long-wavelength π → π* electronic transition (see Scheme S1).
Figure 5.
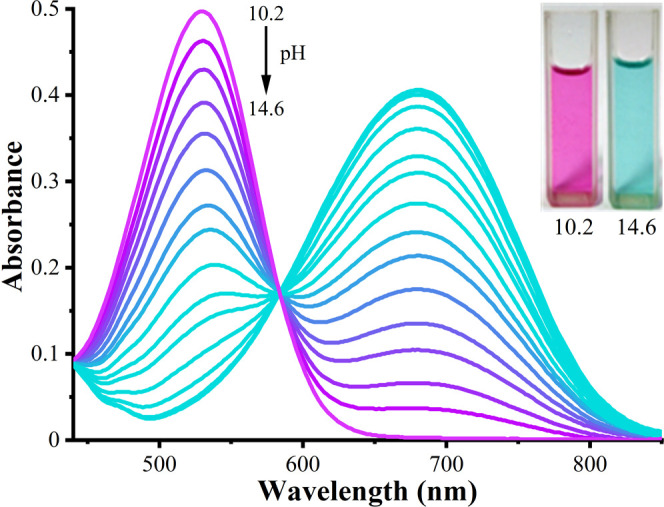
Absorption spectra of 40 μmol·L–13b in H2O/DMSO (1/5, v/v) upon addition of different amounts of NaOH. Photographs of neutral (left) and anionic (right) forms of dye in solution with appropriate pH are shown in the inset. l = 1.00 cm.
Figure 6.
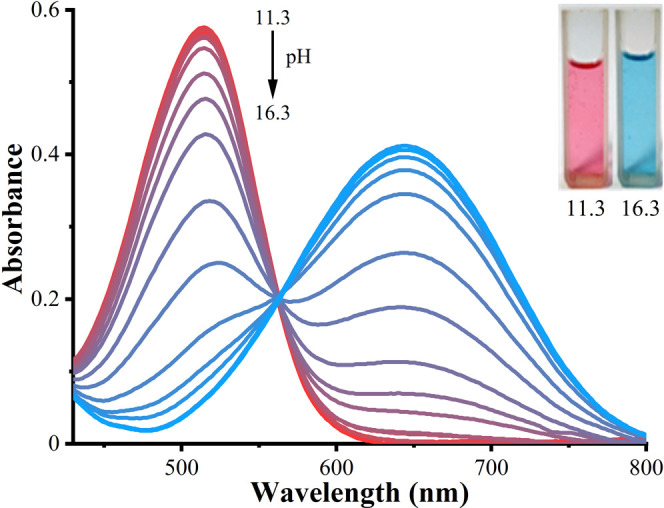
Absorption spectra of 40 μmol.L–14 in H2O/DMSO (1/3, v/v) upon addition of different amounts of NaOH. Photographs of neutral (left) and anionic (right) forms of dye in solution with appropriate pH are shown in the inset. l = 1.00 cm.
The apparent ionization constant (pKa) values of molecules 3b and 4 in H2O/DMSO mixtures have been obtained with spectrophotometric titrations according to eq 1 (Section 4.3) (Tables 2, S4, and S5).
Table 2. Apparent Ionization Constants of the Dyes 3b and 4 in H2O/DMSO Solutions.
| dye | H2O/DMSO(v/v) | pKa |
|---|---|---|
| 3b | 1/5 | 13.7 ± 0.1 |
| 4 | 1/3 | 15.2 ± 0.2 |
2.5. Interaction with Zn2+
It was envisioned that dyes 3b and 4 can chelate Zn2+ due to the presence of the dipyrrin-like skeleton.29 Indeed, upon addition of Zn2+ to the solution of 3b and 4, the hyperchromic effect occurs at 600 and 565 nm, respectively. Meanwhile, the color changes from purple (3b) and red (4) to blue, which corresponds to the bathochromic shift of λmax in the UV–vis spectra (Figures 7 and 8). Such changes may probably indicate the formation of complexes. The most convenient environment for the interaction of the ligand and Zn2+ was chosen based on two factors: the largest achievable light absorption of the complex at the appropriate wavelength (to ensure the highest detection sensitivity) and the lowest possible DMSO content. Keeping this in mind and considering the data presented in Figures S17b and S18 and Table S3, the ratios of Tris buffer (pH 7.2) and DMSO of 1/5 (3b) and 1/3 (4) were the best.
Figure 7.

Absorption spectra of dye 3b without and in the presence of different amounts of Zn2+, C3b = 38 μmol·L–1, Tris buffer (pH 7.2)/DMSO (1/5, v/v) (a), photographs of dye 3b in the presence of different amounts of Zn2+ (b); concentration of Zn2+ is shown in the insets.
Figure 8.

Absorption spectra of dye 4 without and in the presence of different amounts of Zn2+, C4 = 9.9 μmol·L–1, Tris buffer (pH 7.2)/DMSO (1/3, v/v) (a); photographs of dye 4 in the presence of different amounts of Zn2+ (b); concentration of Zn2+ is shown in the insets.
The classic Bent and French method30 was applied for spectral data processing. Considering the shape of the saturation curves in Figures 9 and 10, it can be assumed that a medium stability complex was formed in the solutions. The molar composition of complexes (ZnmRn) was established as described in Section 4.4. The calculations gave the values of n/m equal to 1 for both complexes of probes 3b and 4 with Zn2+, which confirmed the formation of ZnR complexes in solutions. Under these conditions, the neutral forms of probes appeared to be predominant in the solutions (see Figure S19).
Figure 9.
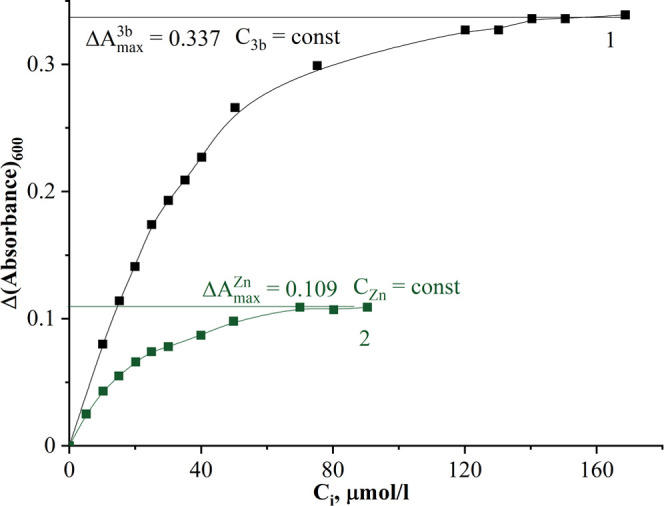
Saturation curves of the complex formation between Zn2+ and probe 3b in Tris buffer (pH 7.2)/DMSO (1/5, v/v). C(3b) = 38 μmol·L–1 (1); C(Zn2+) = 10 μmol·L–1 (2).
Figure 10.
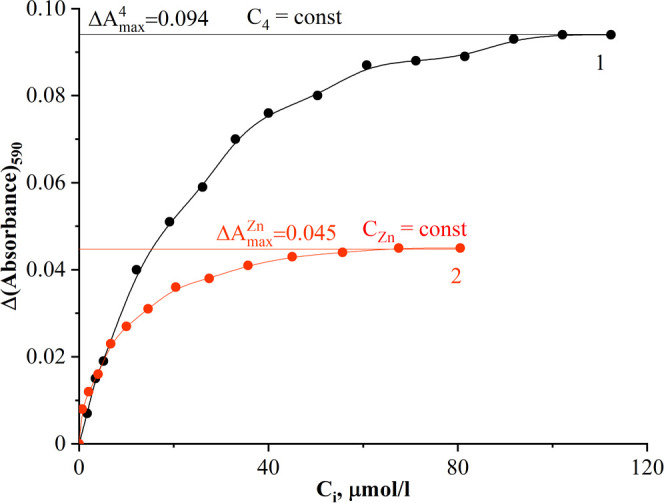
Saturation curves of the complex formation between Zn2+ and probe 4 in Tris buffer (pH 7.2)/DMSO (1/3, v/v). C(4) = 10 μmol·L–1 (1) and C(Zn2+) = 5 μmol·L–1 (2).
The stability constants of the complexes 3b-Zn and 4-Zn have been calculated by processing the data from the saturation curves (Figures 9 and 10) using eq 2 (see Supporting Information Section 5). The values of the affinity constants were found to be equal lg Kf = 10.27 ± 0.02 and lg Kf = 12.5 ± 0.2 for probes 3b and 4, respectively.
2.6. Spectrophotometric Determination of Zn2+
Hence, the absorbance of probes 3b and 4 at the maximum of the complexes after treatment with the Zn2+ solutions was also found to be dependent on their concentration. The dependence of the absorption maxima and absorbance at the wavelength ranges with a minimum spectrum overlap is consistent with the Beer–Lambert law in the wide Zn2+ concentration ranges (Table 3).
Table 3. Performance Characteristics of Zn2+ Spectrophotometric Determination (ΔAλ = Aλi – Aλ0, n = 6, P = 0.95).
| dye | regression equation | RSD2 | linear range, μmol·L–1 | LOD (3S), μmol·L–1 |
|---|---|---|---|---|
| 3b | ΔA640 = (0.003 ± 0.001) + (0.0103 ± 0.0001)·CZn, μmol·L–1 | 0.999 | 1.0–20.0 | 0.43 |
| ΔA600 = (0.005 ± 0.002) + (0.0111 ± 0.0002)·CZn, μmol·L–1 | 0.998 | 0.54 | ||
| 4 | ΔA610 = (0.0013 ± 0.0009) + (0.0028 ± 0.0002)·CZn, μmol·L–1 | 0.992 | 1.7–12.1 | 0.96 |
| ΔA590 = (0.002 ± 0.001) + (0.0032 ± 0.0002)·CZn, μmol·L–1 | 0.990 | 0.94 |
The dye 3b exhibits better characteristics due to the wider linearity of the Zn2+ concentration range and higher sensitivity. The selectivity of dyes 3b toward Zn2+ was appraised by titration of the probe with various metal ions under the optimal conditions of zinc complex formation (see Supporting Information Section 6). It was shown that heavy metal ions such as Fe3+, Fe2+, Ni2+, and Cd2+ did not affect the absorption of dye 3b (see Figure S22). As expected, only Co2+ and Cu2+ caused significant change in the colors of the solutions. However, the change of the color in the presence of Co2+ is a very slow process and the absorption spectrum change could be observed after 30 min of solution treatment with Co2+ (see Figure S23). Due to this fact, the presence of an equal amount of Co2+ does not interfere with the Zn2+ determination during 20 min after the probe treatment. It was found that Cu2+ ions could be masked using 1.0 mmol·L–1 Na2S2O3 solution (see Figure S24).
To prove the reliability of the technique, the probe 3b was applied for the detection of Zn2+ in the serum model solution (stripped of protein) (see Supporting Information Section 7). The model solution of two times diluted pretreated blood serum was prepared as recommended in ref (31) using standard solutions of Zn2+, Cu2+, Fe2+, Na+, K+, Ca2+, Mg2+, and Tris buffer (pH = 7.2). The resulting samples were analyzed spectrophotometrically. For this purpose, 2.5 mL of 40 μmol·L–1 of probe 3b solution in DMSO was mixed with 0.5 mL of model solution in Tris buffer (pH = 7.2) in the presence of Na2S2O3, and the absorbance of the solutions was measured. The recovery value does not exceed 105% for 5.0 and 10.0 μmol·L–1 spiked Zn2+ in the sample. The data obtained suggest that the proposed technique could be used for Zn2+ determination in real samples. Full method validation using real samples will be the aim of our future work.
A comparison of probe 3b with other reported colorimetric probes for Zn2+ in complex matrices has shown that the closest analogue of probe 3b in terms of sensitivity, metal ion selectivity, and contrasting color change accompanying the complexation is Zincon (see Table S9). Moreover, probe 3b demonstrates much better stability in solutions than Zincon.16 Finally, a high DMSO content in the sample solution does not interfere with the determination of the Zn total amount in the pretreated biosamples using probe 3b.
3. Conclusions
In summary, we have developed a one-pot approach for the synthesis of 2-azahetaryl-2-(oxoindolin-2-ylidene)acetonitriles via in situ formation of imidoylchloride, and we have found that these dyes are sensitive probes for Zn2+ ions when Cu2+ ions are masked with Na2S2O3. The best analytical response is achieved with benzothiazole derivative 3b with a LOD of 0.43 μM in a Tris buffer pH 7.2/DMSO solution. The contrasting color change accompanied with the complex formation and the stability of the dye and its complex with zinc facilitate the highly sensitive and selective determination of Zn2+ ions using UV–Vis spectrophotometry. Therefore, probe 3b is promising for detecting and monitoring Zn2+ ions in biological fluids, such as serum.
4. Experimental Section32
4.1. Materials and Methods
All chemicals and solvents were analytical grade and used without further purification. Isatin 2a, 5-methylisatin 2b, and 5-methoxyisatin 2c were provided by Enamine Ltd. 2-(Benzo[d]thiazol-2-yl)acetonitrile 1a was synthesized by a known method.33 2-(Benzo[d]thiazol-2-yl)acetonitrile 1b was synthesized as described in Section 4.2.
Preparative chromatography was performed manually with silica gel (63–200 μm).
1H NMR and 13C{1H} NMR spectra were recorded on a Bruker Avance 300 (300 and 75 MHz, respectively) or Bruker Avance III 400 (400 and 101 MHz, respectively) spectrometer and were referenced to the residual proton resonances of the DMSO-d6: 2.50 for 1H and 40.0 ppm for 13C. The degree of carbon atom substitution was determined by NMR spectra acquired according to the DEPT-135 or JMOD methods. Two-dimensional (2D) (COSY, HMQC, HMBC) spectra were recorded on a Bruker Avance III 400 spectrometer and Bruker Avance 500. All spectra were recorded at ambient temperature (298 K). Coupling constants (J) were reported in Hz, and chemical shift (δ) were reported in ppm. The multiplicity of signals is indicated using the following abbreviations: s = singlet, bs = broad singlet, d = doublet, t = triplet, q = quartet, quint = quintet, dd = doublet of doublets, ddd = doublet of doublets of doublets, dt = doublet of triplets, m = multiplet, and br = broad.
IR spectra were recorded on a FT-IR spectrometer Perkin Elmer in KBr plates.
High-resolution mass spectra (HRMS) were recorded on a GCT Premier spectrometer upon electron spray ionization (ESI) or chemical ionization (DCI, CH4).
Melting points were determined on a Boetius micro-hot stage apparatus with a VEB Analytik 1399RNMK 05 observation lens.
X-ray crystallography was performed on a single-crystal diffractometer Agilent Gemini. A gas diffusion method was implemented for growing single crystals.
Absorption spectra were recorded on a SHIMADZU UV-2401 PC spectrophotometer. pH measurements were performed with a STARTER 3100 bench pH meter (OHAUS).
4.2. Synthesis
4.2.1. 2-(Benzo[d]oxazol-2-yl)acetonitrile
A solution of 2-aminophenol (4.36 g, 40 mmol) and 2-cyanoacetimidate hydrochloride34 (6.36 g, 44 mmol) in anhydrous CH2Cl2 (110 mL) was heated to reflux over a period of 10 h (TLC elution system: CHCl3/CH3OH (9:1)). The reaction mixture was then cooled, diluted with CH2Cl2 (110 mL), and washed with 10% NaOH solution until discoloration of the aqueous layer. The organic layer was dried over MgSO4 and concentrated under reduced pressure to yield the desired compound. A total of 4.43 g of the product (28 mmol, 70 % yield) was obtained as a beige solid. 1H NMR (400 MHz, chloroform-d) δ 4.13 (s, 2H), 7.37–7.45 (m, 2H), 7.55–7.60 (m, 1H), 7.74–7.79 (m, 1H). The compound was used in the next step without further purification.
4.2.2. General Procedure for the Synthesis of 2-Hetaryl-2-(5-R-3-oxoindolin-2-ylidene)acetonitriles 3a–c and 4
To a strongly stirred suspension of 5-R-isatine (1 mmol) in hot benzene (10–15 mL), phosphorus pentachloride (1.3 mmol) was added. The resulting mixture was refluxed for 1 h. Then, a solution of hetarylacetonitrile (1 mmol) in benzene was added dropwise and a characteristic color change occurred. The mixture was allowed to cool to room temperature upon stirring. The precipitate was then filtered and washed with minimum amounts of ethanol and water and again with ethanol. The dry precipitate was purified by filtration through a plug of silica gel (eluent: CH2Cl2).
4.2.3. (Z)-2-(Benzo[d]thiazol-2-yl)-2-(3-oxoindolin-2-ylidene)acetonitrile 3a
The product (236 mg, 0.78 mmol, 78% yield) was obtained as a dark-red powder (mp >300 °C) from 147 mg (1 mmol) of isatin 1a and 174 mg (1 mmol) of 2-(benzo[d]thiazol-2-yl)acetonitrile 2a. IR (KBr): 3408, 2205, 1712, 1589. 1H NMR (400 MHz, DMSO-d6) δ 7.16 (td, J = 7.5, 0.8 Hz, 1H, 5-HIs), 7.50 – 7.56 (m, 2H, 5-HBt, 7-HIs), 7.66 (ddd, J = 8.2, 7.8, 1.1 Hz, 1H, 6-HBt), 7.66–7.71 (m, 1H, 6-HIs), 7.73 (d, J = 7.6 Hz, 1H, 4-HIs), 8.20 (d, J = 8.1, 1.0, 0.6 Hz, 1H, 7-H), 8.21 (d, J = 8.0, 1.3, 0.6 Hz, 1H, 4-H), 11.55 (s, 1H, NH). 13C{1H} NMR (101 MHz, DMSO-d6) δ 80.2 (C), 114.5 (CH), 116.9 (C), 119.9 (C), 123.0 (CH), 123.2 (CH), 123.6 (CH), 125.7 (CH), 126.4 (CH), 127.6 (CH), 134.3 (C), 138.2 (CH), 143.7 (C), 151.9 (C), 154.0 (C), 163.4 (C), 185.1 (C). HRMS (ESI) calcd for C17H10N3OS (M + H+) 304.0545, found 304.0545.
4.2.4. (Z)-2-(Benzo[d]thiazol-2-yl)-2-(5-methyl-3-oxoindolin-2-ylidene)acetonitrile 3b
The product (222 mg, 0.7 mmol, 70% yield) was obtained as a dark-red powder (mp 300–301 °C) from 161 mg (1 mmol) of 5-methylisatin 1b and 174 mg (1 mmol) of 2-(benzo[d]thiazol-2-yl)acetonitrile 2a. IR (KBr): 3433, 2204, 1718, 1596.1H NMR (400 MHz, DMSO-d6) δ 2.33 (s, 3H), 7.40 (d, J = 8.2 Hz, 1H), 7.47–7.53 (m, 2H), 7.54 (s, 1H), 7.65 (ddd, J = 8.2, 7.6, 1.1 Hz, 1H), 8.18 (d, J = 7.8 Hz, 1H), 8.20 (d, J = 7.7 Hz, 1H), 11.48 (s, 1H). 13C{1H} NMR (101 MHz, DMSO-d6) δ 20.6 (CH3), 79.7 (C), 114.3 (CH), 116.9 (C), 120.0 (C), 122.9 (CH), 123.1 (CH), 125.6 (CH), 126.3 (CH), 127.6 (CH), 133.1 (C), 134.3(C), 138.8 (CH), 143.9 (C), 150.0 (C), 154.0 (C), 163.5 (C), 185.1 (C). HRMS (ESI) calcd for C18H12N3OS (M + H+) 318.0701, found 318.0704. CCDC deposition number: 2176039
4.2.5. (Z)-2-(Benzo[d]thiazol-2-yl)-2-(5-methoxy-3-oxoindolin-2-ylidene)acetonitrile 3c
The product (290 mg, 0.87 mmol, 87% yield) was obtained as a dark-violet powder (mp 297–298 °C) from 177 mg (1 mmol) of isatin 1c and 174 mg (1 mmol) of 2-(benzo[d]thiazol-2-yl)acetonitrile 2a. IR (KBr): 3428, 2201, 1702, 1591, 1213. 1H NMR (400 MHz, DMSO-d6) δ 3.81 (s, 1H), 7.25 (d, J = 2.2 Hz, 1H), 7.28 (dd, J = 8.6, 2.5 Hz, 1H), 7.44 (d, J = 8.6 Hz, 1H), 7.52 (t, J = 7.5 Hz, 1H), 7.65 (t, J = 7.7 Hz, 1H), 8.20 (d, J = 8.0 Hz, 1H), 8.18 (d, J = 8.2 Hz, 1H), 11.42 (s, 1H). 13C{1H} NMR (101 MHz, DMSO-d6) δ 56.3 (CH3), 79.6 (C), 108.9 (CH), 115.5 (C), 117.0 (C), 120.4 (C), 122.9 (CH), 123.1 (CH), 125.2 (CH), 126.2 (CH), 127.6 (CH), 134.2 (CH), 144.1 (C), 146.2 (C), 154.1 (C), 156.2 (C), 163.5 (C), 185.1 (C). HRMS (ESI) calcd for C18H12N3O2S (M + H+) 334.0650, found 334.0647.
4.2.6. (Z)-2-(Benzo[d]oxazol-2-yl)-2-(3-oxoindolin-2-ylidene)acetonitrile 4
The product (221 mg, 0.77 mmol, 77% yield) was obtained as a dark-red powder (mp >300 °C) from 147 mg (1 mmol) of isatin 1a and 158 mg (1 mmol) of 2-(benzo[d]oxazol-2-yl)acetonitrile 2b. IR (KBr): 3435, 2214, 1719, 1596. 1H NMR (400 MHz, DMSO-d6) δ 7.16 (td, J = 7.4, 0.8 Hz, 1H, 5-HIs), 7.47–7.51 (m, 2H, 5,6-HBzo), 7.52–7.55 (m, 1H, 7-HIs), 7.67 (td, J = 7.8, 1.3 Hz, 1H, 6-HIs), 7.72 (d, J = 7.5 Hz, 1H, 4-HIs), 7.83–7.90 (m, 2H, 4,7-HBzo), δ 11.37 (s, 1H, NH). 13C{1H} NMR (101 MHz, DMSO-d6) δ 74.0 (C), 111.6 (CH), 114.5 (C), 114.6 (CH), 119.97 (C), 120.01 (CH), 123.8 (CH), 125.7 (CH), 126.0 (CH), 126.6 (CH), 138.3 (CH), 141.7 (C), 145.9 (C), 149.9 (C), 151.7 (C), 159.5 (C), 184.6 (C). HRMS (ESI) calcd for C17H10N3O2 (M + H+) 288.0773, found 288.0773. CCDC deposition number: 2176040.
4.3. pKa Determination
The apparent ionization constant (pKa) values of the compounds 3b and 4 were determined spectrophotometrically.35 Titration of 3.00 mL of 40 μmol·L–1 of each compound was performed in H2O/DMSO by adding small portions of 0.010–0.10 M HCl or NaOH solutions and recording the absorption spectrum after each addition. The solution volume has not changed by more than 10%.
The calculation of apparent ionization constants was carried out using the absorption data according to the Henderson–Hasselbalch equation
| 1 |
where AHR is the absorbance of the solution at the absorption maximum of the molecular form of the dye, AR– is the absorbance of the solution at the absorption maximum of the ionic form of the dye, and Ai is the absorbance of the solution at the absorption maximum of the mixture of ionic and neutral forms, corresponding to a certain pH value, which was measured using a pH meter for each solution. The absorption maxima of the neutral and anionic forms of dyes are 530 and 680 nm (3b) and 515 and 645 nm (4), respectively.
4.4. Study of Complexation
The complexation study was realized as recommended in ref (36) using spectrophotometric titration according to the limited logarithm Bent and French method30 and the Molland method.37 For this purpose, two series of solutions were prepared. The first series of solutions contained equal amounts of Zn2+ (10 μmol·L–1 for 3b and 5 μmol·L–1 for 4), whereas the concentration of probes 3b and 4 varied (10–90 μmol·L–1 and 0.5–81 μmol·L–1, respectively) upon the addition of the small portion of the corresponding probe. The second series of solutions contained equal amounts of probes 3b (38 μmol·L–1) or 4 (9.9 μmol·L–1), whereas the concentration of Zn2+ varied (2–90 μmol·L–1 and 1–112 μmol·L–1, respectively). The absorption spectra of these solutions were recorded, and saturation curves ΔA as a function of C, μmol·L–1, were obtained, where ΔA = AR – AZnR at a certain wavelength.
The molar composition of complexes (ZnmRn) was established using the formula n/m = (ΔAmaxZn × CR)/(ΔAmaxR × CZn), where m and n are the number of Zn2+ and the ligand attached to a metal ion consequently, respectively; ΔAmaxZn and ΔAmaxR are absorption, corresponding to the saturation area; and CR and CZn are the initial concentrations of the ligand and Zn2+ in solutions of each series, respectively.
The stability constants of the complexes were calculated using eq 2
| 2 |
where ΔAi is the value of absorbance in the initial linear section of the saturation curves; AmaxZn is the value of absorbance in the saturation region; CR is the concentration of the probe, which corresponds to ΔAi; CZn is the concentration of Zn2+; n is the number of the coordinated ligands; x is the number of protons capable of dissociation of dyes 3b or 4 (x = 1); y is the number of protons detached from the dye (y = 1); and Ka is the ionization constant of dyes 3b or 4.
Acknowledgments
The authors acknowledge the generous support from the French Embassy in Kyiv, Ukraine, and Campus France for mobility allowance of O.O.K., the GDRI “Groupement Franco-Ukrainien en Chimie Molećulaire” for supporting such international collaboration, ANR for funding, and the CNRS, the Université de Toulouse, and the Taras Shevchenko National University of Kyiv for hosting our research. The authors acknowledge the scientific and technical support of the ICT Services (https://ict.cnrs.fr) for NMR and HRMS analysis and Sonia Mallet-Ladeira for XRD analysis. The Enamine Ltd. company is acknowledged for providing the reagents.
Supporting Information Available
The Supporting Information is available free of charge at https://pubs.acs.org/doi/10.1021/acsomega.2c04747.
NMR spectra for all the ligands, photostability test data, absorption property data, deprotonation and complexation study data, and description of Zn2+ detection in the model solution of serum (PDF)
Author Present Address
§ LHFA CNRS – UMR 5069, Université Paul Sabatier, 118, route de Narbonne, 31062 Toulouse Cedex 9, France
Author Contributions
The article is written by the contribution of all authors. O.O.K. performed the synthesis, and V.V.S. performed the compexation studies. All authors have given approval to the final version of the article.
The authors declare no competing financial interest.
Dedication
Dedicated to Prof. Olga A. Zaporozhets in memoriam.
Supplementary Material
References
- Wessels I.; Maywald M.; Rink L. Zinc as a gatekeeper of immune function. Nutrients 2017, 9, 1286. 10.3390/nu9121286. [DOI] [PMC free article] [PubMed] [Google Scholar]
- Cunnane S.Zinc: Clinical and Biochemical Significance, 1st ed.; CRC Press: Boca Raton, 2017. [Google Scholar]
- Pal A.; Squitti R.; Picozza M.; Pawar A.; Rongioletti M.; Dutta A.; Sahoo S.; Goswami K.; Sharma P.; Prasad R. Zinc and COVID-19: basis of current clinical trials. Biol. Trace Elem. Res. 2021, 199, 2882–2892. 10.1007/s12011-020-02437-9. [DOI] [PMC free article] [PubMed] [Google Scholar]
- Name J. J.; Souza A.; Vasconcelos A.; Prado P.; Pereira C. Zinc, vitamin D and vitamin C: perspectives for COVID-19 with a focus on physical tissue barrier integrity. Front. Nutr. 2020, 7, 606398. 10.3389/fnut.2020.606398. [DOI] [PMC free article] [PubMed] [Google Scholar]
- Wessels I.; Rolles B.; Rink L. The potential impact of zinc supplementation on COVID-19 pathogenesis. Front. Immunol. 2020, 11, 1712. 10.3389/fimmu.2020.01712. [DOI] [PMC free article] [PubMed] [Google Scholar]
- Jampilek J.; Kralova K. Potential of nanonutraceuticals in increasing immunity. Nanomaterials 2020, 10, 2224. 10.3390/nano10112224. [DOI] [PMC free article] [PubMed] [Google Scholar]
- Skalny A. V.; Aschner M.; Tinkov A.. Chapter Eight – Zinc. In Advances in Food and Nutrition Research; Elsevier Inc., 2021; pp 251–310. [DOI] [PMC free article] [PubMed] [Google Scholar]
- de Benoist B.; Darnton-Hill I.; Davidsson L.; Fontaine O.; Hotz C. Conclusions of the joint WHO/UNICEF/IAEA/izincg interagency meeting on zinc status indicators. Food Nutr. Bull. 2007, 28, S480–S484. 10.1177/15648265070283S306. [DOI] [PubMed] [Google Scholar]
- Wieringa F.; Dijkhuizen M.; Fiorentino M.; Laillou A.; Berger J. Determination of zinc status in humans: which indicator should we use?. Nutrients 2015, 7, 3252–3263. 10.3390/nu7053252. [DOI] [PMC free article] [PubMed] [Google Scholar]
- King J. C.; Brown K.; Gibson R.; Krebs N.; Lowe N.; Siekmann J.; Raiten D. Biomarkers of nutrition for development (BOND)—Zinc Review. J. Nutr. 2015, 146, 858S–885S. 10.3945/jn.115.220079. [DOI] [PMC free article] [PubMed] [Google Scholar]
- Planeta K.; Kubala-Kukus A.; Drozdz A.; Matusiak K.; Setkowicz Z.; Chwiej J. The assessment of the usability of selected instrumental techniques for the elemental analysis of biomedical samples. Sci. Rep. 2021, 11, 3704 10.1038/s41598-021-82179-3. [DOI] [PMC free article] [PubMed] [Google Scholar]
- Hall A. G.; King J.; McDonald C. comparison of serum, plasma, and liver zinc measurements by AAS, ICP-OES, and ICP-MS in diverse laboratory settings. Biol. Trace Elem. Res. 2022, 200, 2606–2613. 10.1007/s12011-021-02883-z. [DOI] [PMC free article] [PubMed] [Google Scholar]
- Diana R.; Panunzi B. Zinc(II) and aiegens: the “clip approach” for a novel fluorophore family. A review. Molecules 2021, 26, 4176. 10.3390/molecules26144176. [DOI] [PMC free article] [PubMed] [Google Scholar]
- Marczenko Z.; Balcerzak M.. Chapter 56 – Zinc. In Analytical Spectroscopy Library; Elsevier B.V., 2000; pp 466–473. [Google Scholar]
- Kocyła A.; Pomorski A.; Krężel A. Molar absorption coefficients and stability constants of metal complexes of 4-(2-pyridylazo)resorcinol (PAR): revisiting common chelating probe for the study of metalloproteins. J. Inorg. Biochem. 2015, 152, 82–92. 10.1016/j.jinorgbio.2015.08.024. [DOI] [PubMed] [Google Scholar]
- Kocyła A.; Pomorski A.; Krężel A. Molar absorption coefficients and stability constants of zincon metal complexes for determination of metal ions and bioinorganic applications. J. Inorg. Biochem. 2017, 176, 53–65. 10.1016/j.jinorgbio.2017.08.006. [DOI] [PubMed] [Google Scholar]
- Makino T. A Sensitive, direct colorimetric assay of serum zinc using nitro-PAPS And Microwell Plates. Clin. Chim. Acta 1991, 197, 209–220. 10.1016/0009-8981(91)90141-X. [DOI] [PubMed] [Google Scholar]
- Qi Z.-L.; Cheng Y.; Xu Z.; Chen M. Recent advances in porphyrin-based materials for metal ions detection. Int. J. Mol. Sci. 2020, 21, 5839. 10.3390/ijms21165839. [DOI] [PMC free article] [PubMed] [Google Scholar]
- Zaijun L.; Jiaomai P. Advances in synthesis and application of the derivatives of porphyrin as reagents in analytical chemistry. Rev. Anal. Chem. 2002, 21, 167–231. 10.1515/REVAC.2002.21.3.167. [DOI] [Google Scholar]
- Paolesse R.; Nardis S.; Monti D.; Stefanelli M.; Di Natale C. Porphyrinoids for chemical sensor applications. Chem. Rev. 2017, 117, 2517–2583. 10.1021/acs.chemrev.6b00361. [DOI] [PubMed] [Google Scholar]
- Negut C. C.; van Stefan R.; van Staden J. Porphyrins - as active materials in the design of sensors. An overview. ECS J. Solid State Sci. Technol. 2020, 9, 051005 10.1149/2162-8777/ab9a5d. [DOI] [Google Scholar]
- Ding Y.; Tang Y.; Zhu W.; Xie Y. Fluorescent and colorimetric ion probes based on conjugated oligopyrroles. Chem. Soc. Rev. 2015, 44, 1101–1112. 10.1039/C4CS00436A. [DOI] [PubMed] [Google Scholar]
- Senge M. O.; Sergeeva N.; Hale K. Classic highlights in porphyrin and porphyrinoid total synthesis and biosynthesis. Chem. Soc. Rev. 2021, 50, 4730–4789. 10.1039/C7CS00719A. [DOI] [PubMed] [Google Scholar]
- Cornforth J.; Hitchcock P.; Rozos P. Isatin chloride: a phantom. reactions of 2-(2,2-dichloro-2,3-dihydro-3-oxoindol-1-yl)-3H-indol-3-one. J. Chem. Soc., Perkin Trans. 1 1996, 23, 2787–2792. 10.1039/p19960002787. [DOI] [Google Scholar]
- Katritzky A. R.; Fan W.; Koziol A.; Palenik G. 2-chloro-3H-indol-3-one and its reactions with nucleophiles. J. Heterocycl. Chem. 1989, 26, 821–828. 10.1002/jhet.5570260358. [DOI] [Google Scholar]
- Campagna F.; Palluotto F.; Mascia M.; Maciocco E.; Marra C.; Carotti A.; Carrieri A. Synthesis and biological evaluation of pyridazino[4,3-b]indoles and indeno[1,2-c]pyridazines as new ligands of central and peripheral benzodiazepine receptors. Il Farmaco 2003, 58, 129–140. 10.1016/S0014-827X(02)00017-4. [DOI] [PubMed] [Google Scholar]
- Kuleshova O.; Shcherban V.; Khilya O.; Keda T.; Zaporozhets Z.; Volovenko Y.. 2-Hetaryl-2-(5-R-3-oxoindolin-2-ylidene)acetonitriles, method of their synthesis and application for spectrophotometric 3d-metals determination, UKR Patent 120127, 2019.
- Kuleshova O. A.; Khilya O.; Volovenko Y. New method for the synthesis of 2-hetaryl-2-(1-R-pyrrolidin-2-ylidene)acetonitriles. Chem. Heterocycl. Compd. 2018, 54, 83–85. 10.1007/s10593-018-2234-x. [DOI] [Google Scholar]
- Kovalska N.; Kariaka N.; Litsis O.; Kuleshova O.; Khilya O.; Slyva T.; Amirkhanov V. Spectral properties of transition metal coordination compounds with heterocyclic enaminonitriles. Bull. Taras Shevchenko Natl. Univ. Kyiv, Chem. 2015, 1, 16–19. [Google Scholar]
- Bent H. E.; French C. The structure of ferric thiocyanate and its dissociation in aqueous solution. J. Am. Chem. Soc. 1941, 63, 568–572. 10.1021/ja01847a059. [DOI] [Google Scholar]
- Baranyai E.; Tóth C.; Fábián I. Elemental analysis of human blood serum by microwave plasma—investigation of the matrix effects caused by sodium using model solutions. Biol. Trace Elem. Res. 2020, 194, 13–23. 10.1007/s12011-019-01743-1. [DOI] [PMC free article] [PubMed] [Google Scholar]
- Kuleshova O.Cyclic 2-Azahetaryl-3-Enaminonitriles: Toward Synthesis of Functionalized Azaheterocycles, Metal Complexation and Probes Design. Ph.D. Dissertation; Université Paul Sabatier: Toulouse III, 2018. [Google Scholar]
- Kuleshova O.; Khilya O.; Volovenko Yu.; Mallet-Ladeira S.; Dyakonenko V.; Gras E. Expedited route to fully substituted amino-pyrazole building blocks and their further transformations. ACS Omega 2017, 2, 8911–8927. 10.1021/acsomega.7b01419. [DOI] [PMC free article] [PubMed] [Google Scholar]
- McCall J. M.; Ursprung J. J.. N,2-Dicyanoacetimidates. U.S. Patent US4032559 A1, 1977.
- Albert A.; Serjeant E.. The Determination of lonization Constants, 3rd ed.; Springer: Dordrecht, 1984; pp 70–75. [Google Scholar]
- Zaporozhets O. A.; Paustovska A.; Zinko L.; Davydov V. Formation of the intensively fluorescent mixed-ligand complex of Zr(OH)3+ with 3,5,7,2′,4′-pentahydroxyflavone in the presence of fluoride. J. Fluorine Chem. 2015, 170, 52–56. 10.1016/j.jfluchem.2014.12.009. [DOI] [Google Scholar]
- Molland J. Inner complex salts of the 8-hydroxyquinoline-5-sulfonic acid. J. Am. Chem. Soc. 1940, 62, 541–542. 10.1021/ja01860a024. [DOI] [Google Scholar]
Associated Data
This section collects any data citations, data availability statements, or supplementary materials included in this article.