

Abstract

The basic configuration of glucocorticoid consists of four-fused rings associated with one cyclohexadienone ring, two cyclohexane rings, and one cyclopentane ring. The ways the structure and dynamics of five glucocorticoids (prednisone, prednisolone, prednisolone acetate, methylprednisolone, and methylprednisolone acetate) are altered because of the substitution of various functional groups with these four-fused rings are studied thoroughly by applying sophisticated solid-state nuclear magnetic resonance (NMR) methodologies. The biological activities of these glucocorticoids are also changed because of the attachment of various functional groups with these four-fused rings. The substitution of the hydroxyl group (with the C11 atom of the cyclohexane ring) in place of the keto group enhances the potential of the glucocorticoid to cross the cellular membrane. As a result, the bioavailability of prednisolone (the hydroxyl group is attached with the C11 atom of the cyclohexane ring) is increased compared to prednisone (the keto group is attached with the C11 atom of cyclohexane rings). Another notable point is that the spin–lattice relaxation rate at crystallographically distinct carbon nuclei sites of prednisolone is increased compared to that of the prednisone, which implies that the motional degrees of freedom of glucocorticoid is increased because of the substitution of the hydroxyl group in place of the keto group of the cyclohexane ring. The attachment of the methyl group with the C6 atom of cyclohexane rings further reduces the spin–lattice relaxation time at crystallographically distinct carbon nuclei sites of glucocorticoid and its bioactivity is also increased. By comparing the spin–lattice relaxation time and the local correlation time at crystallographically different carbon nuclei sites of three steroids prednisone, prednisolone, and methylprednisolone, it is observed that both the spin–lattice relaxation time and the local correlation time gradually decrease at each crystallographically distinct carbon nuclei sites when we move from prednisone to prednisolone to methyl-prednisolone. On the other hand, if we compare the same for prednisolone, prednisolone acetate, and methylprednisolone acetate, then we also observe that both the spin–lattice relaxation time and the local-correlation time gradually decrease from prednisolone to prednisolone acetate to methylprednisolone acetate for all chemically different carbon nuclei. It is also noticeable that both the spin–lattice relaxation time and the local-correlation time gradually decrease from prednisone to prednisolone to prednisolone acetate to methylprednisolone to methylprednisolone acetate for most of the carbon nuclei sites. From in silico analysis, it is also revealed that the bioavailability and efficacy of the glucocorticoid increase from prednisone to prednisolone to prednisolone acetate to methylprednisolone to methylprednisolone acetate. Hence, it can be concluded that the biological activity and the motional degrees of freedom of the glucocorticoids are highly correlated. These types of studies provide a clear picture of the structure–activity relationship of the drug molecules, which will enlighten the path of developing highly potent glucocorticoids with minimum side effects. Another important aspect of these types of studies is to provide information about the electronics configuration and nuclear spin dynamics at crystallographically different carbon nuclei sites of five glucocorticoids, which will enrich the field of “NMR crystallography”.
1. Introduction
Glucocorticoids are widely used for the treatment of inflammation and autoimmune diseases. These drugs bind with the glucocorticoid receptor (GR), which is a ligand-activated transcription factor of the nuclear receptor superfamily. While binding with the GR, glucocorticoid brings a conformational change in the GR, and as a result, the GR exerts transcriptional activity to the nucleus by transactivation or transrepression. Glucocorticoids act as anti-inflammatory agents through the transrepression mechanism. On the contrary, glucocorticoids have many adverse consequences like diabetes, hypertension, obesity, and osteoporosis because of the transactivation of the GR.1−8
Potency and efficacy are two main pharmacokinetic parameters of glucocorticoids. Efficacy measures the activity of a drug at maximum concentration and the required concentration of the drug to achieve the half-maximal activity known as potency. A highly potent glucocorticoid has the same efficacy as that of the other, but the same treatment effect can be achieved by using a lower dose of that glucocorticoid compared to the other.9−12 The unwanted side effects can be reduced by using a lower dose of a highly potent and selective glucocorticoid.
The molecular conformation of the corticosteroid is not influenced by the crystal packing forces. The intramolecular forces control the orientation of various functional groups of corticosteroids. The ability of the corticosteroid hormones to interact with protein molecules depends on the conformation. Some steroids have greater flexibility because of the particular orientation of side chains and substituent groups. The flexibility of the saturated steroid nucleus is very low, and it has a rigid conformation. However, most biologically active corticosteroid hormones possess an unsaturated nucleus. The flexibility is greatly affected by the substitution of the side chain at the C17 atom.13,14 The function of the steroid depends on the molecular conformation, constitution, composition, and configuration. The fundamental configuration of corticosteroid is composed of four fused rings associated with one cyclohexadienone ring (referred to as the “A” ring), two cyclohexane rings (referred to as “B” and “C” rings), and one cyclopentane ring (referred to as the “D” ring). The cyclohexadienone ring (“A” ring) may take 2β-sofa; 1α,2β-half chair; and 1α-sofa conformations. The conformation is described as a sofa conformation when all the five atoms of the “A” ring reside on the same plane, but the sixth one resides out of the plane. When the sixth atom resides on the α-side of the plane, it is described as 1α-sofa conformation, and when the sixth atom resides on the β-side of the plane, it is described as 2β-sofa conformation. When four contiguous atoms reside in the same plane but the other two are placed along two opposite sides of the plane at the same distance, it is known as the 1α,2β-half chair conformation.14 The cyclohexadienone ring possesses a mirror symmetry perpendicular to the plane of the ring when it takes a sofa conformation. On the other hand, the cyclohexadienone ring with a half-chair conformation possesses a rotational symmetry with respect to the axis which bisects the bond between the out-of-plane atoms.14 “B” and “C” rings possess semi-rigid chairs conformation, and the conformation does not get influenced by the substituent groups. On the contrary, the conformation of the “D” ring depends on the environment of substituent groups. It can form a 13 β-envelope to a 13β, 14α-half-chair conformation depending on the substituent groups.19 How the dynamics of various corticosteroids are influenced by the association of different functional groups with this four-fused ring is studied thoroughly by solid-state NMR measurements.
Chemical shift arises because of the secondary magnetic field, generated by the rotation of the electron around the nucleus. This secondary magnetic field depends on the direction. As a consequence, the magnetic field experienced by the nucleus (Beff = B0 ± σB0) is influenced by the orientation of the molecule and its electronic surroundings. σ has nine components, and it is a second-rank tensor. It is known as the chemical shift (CS) tensor. In the principal axis system (PAS), only the diagonal components of the CS tensor survive and these are called the principal components of the CS tensor. The information about the structure and dynamics of a molecule resides on these parameters.27−29 These parameters can be calculated by Density Functional Theory (DFT) and these can also be extracted by applying sophisticated NMR methodologies like ROCSA (recoupling of chemical shift anisotropy),29 2DMAF (two-dimensional magic angle flipping),30−32 SUPER (separation of undistorted powder patterns by effortless recoupling),33 2DMAT (two-dimensional magic angle turning),34 2D MAS/CSA NMR experiment,35 RNCSA (γ-encoded RNnν-symmetry-based chemical shift anisotropy),36 and 2D phase-adjusted spinning side-band (2DPASS) magic angle spinning (MAS).37,38 Previously, we had determined the principal components of the CS-tensor of carbon nuclei of biopolymers,39−44 biomedicine,45−54 and charge transfer co-crystal55 by applying 13C 2DPASS CP-MAS ssNMR experiments. The principal components of the CS tensor of prednisone, prednisolone, prednisolone acetate, methylprednisolone, and methylprednisolone acetate are determined by the 2D phase-adjusted spinning sideband (2DPASS) cross-polarization (CP) magic angle spinning (MAS) solid-state NMR experiment. The site-specific spin–lattice relaxation time of these four corticosteroids is determined by the method outlined by Torchia.56
2. Experimental Section
The 13C CP-MAS SSNMR experiment, the Torchia CP experiment,56 and the 2DPASS CP-MAS SSNMR experiments37,38 were performed on a JEOL ECX 500 NMR spectrometer associated with a 3.2 mm JEOL double-resonance MAS probe. The 2DPASS CP-MAS SSNMR experiments were conducted at two different MAS frequencies of 600 Hz and 2 kHz. The 13C CP-MAS SSNMR and Torchia CP experiments were conducted at a MAS frequency 10 kHz (Figures 123). The SPINAL-64 1H decoupling was applied in the Torchia CP, 13C CP-MAS, and 13C 2DPASS CP-MAS experiments. The condition of cross-polarization was maintained at a contact time of 2 ms.
Figure 1.

(a) Structure of prednisolone, (b) 13C CP-MAS SSNMR spectrum of prednisolone at an MAS frequency of 10 kHz, (c) structure of prednisone, (d) 13C CP-MAS SSNMR spectrum of prednisone at an MAS frequency of 10 kHz.
Figure 2.

(a) Structure of methylprednisolone, (b) 13C CP-MAS SSNMR spectrum of methylprednisolone at an MAS frequency of 10 kHz, (c) structure of prednisone acetate, and (d) 13C CP-MAS SSNMR spectrum of prednisone acetate at an MAS frequency of 10 kHz.
Figure 3.
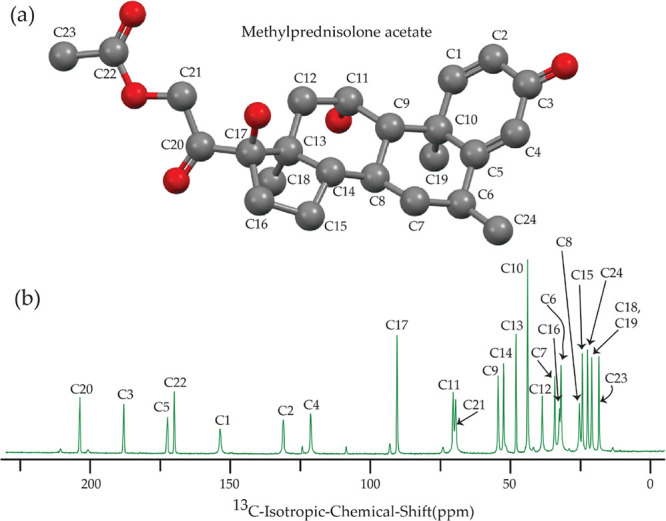
(a) Structure of methylprednisolone acetate and (b) the 13C CP-MAS SSNMR spectrum of methylprednisolone acetate.
The pulse sequence for the 2DPASS experiment is associated with a π/2 pulse followed by five π pulses.37,38 The time interval among the five π pulses are determined by PASS equations.38 For the 13C nucleus 90°, the pulse length was 3.3 μs. The relaxation delay was 15 s. The 2DPASS experiment was performed by applying thirteen steps cogwheel phase cycling COG13 (0, 1, 0, 1, 0, 1, 6).57,58 The number of scans for the 13C 2D PASS CP-MAS SSNMR experiment was 3900 (integral multiple of 13). The principal components of CSA tensor are extracted by using the intensity of the sidebands with the help of the graphical method.59 The side-band intensities are not modulated by the dipole–dipole interaction because we have applied the SPINAL64 pulse sequence to decoupled 1H–13C heteronuclear dipole–dipole interactions, and the contribution of 13C–13C homonuclear dipole–dipole coupling is negligibly small because of low natural abundance of 13C nuclei (∼1.1 % ). The 31C CP-MAS SSNMR spectra were referenced by using tetramethylsilane with isotropic chemical shift at 0 ppm. The 2DPASS experiment data were analyzed in RMN (www.physyapps.com/rmn-intuitive-signal-processing-physical-sciences) and HBA (http://anorganik.uni-tuebingen.de/klaus/soft/index.php?p=hba/hba) software. The spin–lattice relaxation time at crystallographically different carbon nuclei sites of five glucocorticoids prednisone, prednisolone, prednisolone acetate, methylprednisolone, and methylprednisolone acetate are determined by the method reported by Torchia.56
3. Results and Discussion
3.1. 13C CP-MAS SSNMR Spectrum of Glucocorticoids
The isotropic chemical shift of carbonyl group carbon is the largest
for all five glucocorticoids. The large value of anisotropy of carbonyl
group carbon is because of the shielding/deshielding effect of magnetic
anisotropy. The carbonyl group has no symmetry axis, so there arise
three different magnetic susceptibilities  along three different directions of the
principal axes system (PAS). Because this two anisotropic susceptibilities
are originated one parallel to the magnetic field
along three different directions of the
principal axes system (PAS). Because this two anisotropic susceptibilities
are originated one parallel to the magnetic field  and another perpendicular to the magnetic
field
and another perpendicular to the magnetic
field  . The McConnell equation21 of magnetic anisotropy for the nonsymmetric carbonyl group
is
. The McConnell equation21 of magnetic anisotropy for the nonsymmetric carbonyl group
is
| 1 |
where θ1 is the angle between the radius vector and the x-axis and θ2 is the angle between the radius vector and the z-axis.22 A large amount of directional dependent magnetic field is generated because of this highly anisotropic magnetic susceptibility. This demonstrates as large anisotropic chemical shift at the carbonyl site. The electrostatic effect plays a significant role for the carbonyl group-containing polar bond with nonspherical distribution of charges. The electrostatic interaction between the central molecule and other molecules generates significant polarization on the electronic density of the central molecule. The strength of the induced magnetic field is modified by the polarization of the electron density surrounding the nucleus, when the molecule is placed in the presence of an external magnetic field. This is also another reason behind the large anisotropy of carbonyl group carbon.60 It is revealed by 13C-CP-MAS spectral analysis61 of carbonyl-group carbon resonance line that this group is associated with two varieties of hydrogen bonding intermolecular and intramolecular hydrogen bonding, which describe the interaction between donor and acceptor atoms and take main role to change molecular conformation and/or molecular electronic density. The presence of hydrogen bonding is one of the important reasons for the high value of chemical shift anisotropy of carbonyl-group carbon.
The isotropic chemical shift as well as the anisotropic chemical shift of the C1=C2 double bond of the cyclohexadienone ring are substantially large. The double bond C1=C2 leads to the ketone group of C3 to be in plane with the cyclohexadienone ring. Consequently, the ketone group interacts with R611 and Q570 and increase the binding affinity of the glucocorticoids.6
3.2. Determination of Chemical Shift Anisotropy Tensor
Figures 4 and 5 show the 13C 2DPASS CP-MAS SSNMR spectrum of prednisolone, prednisolone acetate, methylprednisolone, and methylprednisolone acetate. The direct dimension shows a purely isotropic spectrum with zero sidebands, which is known as the infinite spinning frequency spectrum. Table 1 shows that the isotropic chemical shift, as well as the anisotropic chemical shift of C20 and C3 nuclei, are the largest among all the carbon nuclei of these five glucocorticoids because of the presence of the polar bond (C=O) and magnetic anisotropy.21,22 The chemical shift of carbon nuclei, which reside on the cyclohexadienone ring (“A” ring) is higher than those of carbon nuclei residing on two cyclohexane rings and one cyclopentane ring because it contains unsaturated bonds. A secondary magnetic field is generated along the direction of the external magnetic field when the π electrons of the cyclohexadienone ring revolve in the clockwise direction. Consequently, the effective magnetic field experienced by the nucleus increases, which is known as the magnetic deshielding effect. On the other hand, the secondary magnetic field is induced in the opposite direction of the external magnetic field because of the rotation of the π electrons in the counter clockwise direction. In this case, the effective magnetic field experienced by the nucleus is reduced, known as the magnetic shielding effect. These magnetic shielding and deshielding effects are the source of the large values of the isotropic as well as the anisotropic chemical shift for the carbon nuclei residing on the cyclohexadienone ring. The unsaturated bonds of glucocorticoid hormones are the reason for the conformational flexibility.1
Figure 4.
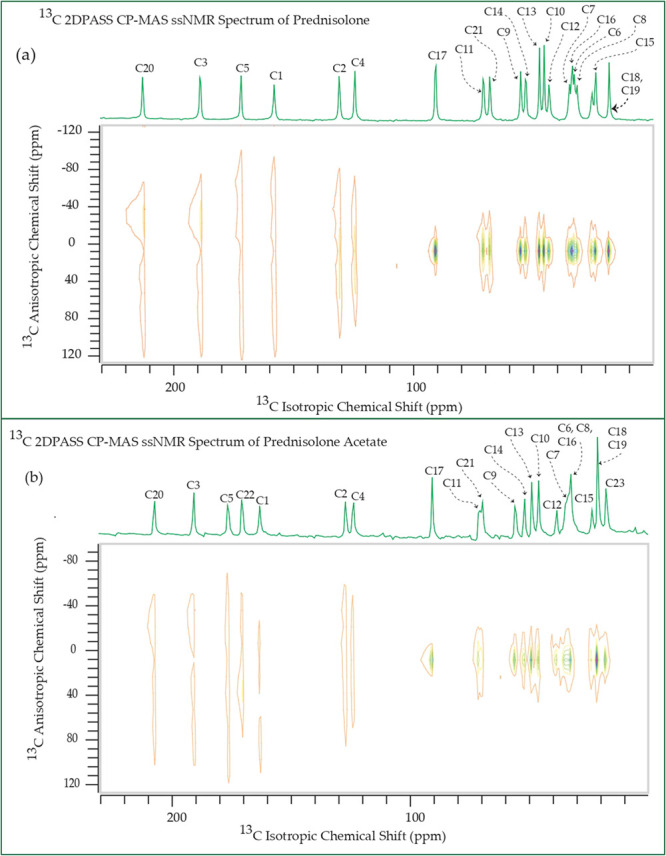
13C 2DPASS CP-MAS SSNMR spectrum of (a) prednisolone and (b) prednisolone acetate.
Figure 5.

13C CP-MAS SSNMR spectrum of (a) methylprednisolone and (b) methylprednisolone acetate.
Table 1. Values of the Principal Components of CSA Parameters for Prednisone, Prednisolone, Prednisolone Acetate, Methylprednisolone, and Methylprednisolone Acetatea.
| corticosteroid | carbon nuclei | isotropic chemical shift (δiso) (ppm) | δ11 (ppm) | δ22 (ppm) | δ33 (ppm) | span (ppm) | anisotropy (ppm) | asymmetry | skew |
|---|---|---|---|---|---|---|---|---|---|
| prednisone | C20 | 210.5 | 324.3 ± 1.6 | 177.9 ± 1.4 | 129.2 ± 2.9 | 195.0 ± 1.3 | 170.7 ± 1.9 | 0.4 | –0.5 |
| prednisolone | C20 | 212 | 329.7 ± 2.6 | 167.5 ± 2.1 | 138.8 ± 1.5 | 190.8 ± 2.0 | 176.5 ± 3.9 | 0.2 | –0.7 |
| prednisolone acetate | C20 | 206.6 | 315.3 ± 3.1 | 175.1 ± 2.0 | 129.5 ± 2.3 | 185.7 ± 2.1 | 162.9 ± 4.7 | 0.4 | –0.5 |
| methylprednisolone | C20 | 211 | 320.8 ± 2.6 | 167.4 ± 1.7 | 144.7 ± 1.9 | 176.1 ± 1.8 | 164.8 ± 3.9 | 0.2 | –0.7 |
| methylprednisolone acetate | C20 | 203.8 | 313.7 ± 1.0 | 168.6 ± 0.7 | 129.1 ± 0.8 | 184.6 ± 0.7 | 164.8 ± 1.6 | 0.3 | –0.6 |
| prednisone | C3 | 189.0 | 300.4 ± 1.0 | 145.2 ± 0.7 | 121.3 ± 0.8 | 179.1 ± 0.7 | 167.1 ± 1.6 | 0.2 | –0.7 |
| prednisolone | C3 | 188.2 | 305.9 ± 1.7 | 143.7 ± 1.4 | 115.0 ± 0.9 | 190.8 ± 1.2 | 176.5 ± 2.5 | 0.2 | –0.7 |
| prednisolone acetate | C3 | 190.2 | 305.1 ± 2.4 | 144.3 ± 1.6 | 121.2 ± 1.8 | 183.9 ± 1.6 | 172.3 ± 3.6 | 0.2 | –0.7 |
| methylprednisolone | C3 | 191.0 | 309.7 ± 2.4 | 254.4 ± 2.6 | 8.9 ± 1.8 | 300.8 ± 1.4 | –273.2 ± 1.6 | 0.3 | 0.6 |
| methylprednisolone acetate | C3 | 188.5 | 305.1 ± 1.2 | 142.2 ± 0.8 | 118.2 ± 0.9 | 186.9 ± 0.8 | 174.9 ± 1.8 | 0.2 | –0.7 |
| prednisone | C5 | 167.7 | 293.0 ± 4.1 | 145.9 ± 2.8 | 64.2 ± 3.0 | 228.8 ± 2.4 | 187.9 ± 6.1 | 0.6 | –0.3 |
| prednisolone | C5 | 171.3 | 293.8 ± 2.4 | 149.0 ± 2.0 | 71.2 ± 1.4 | 222.6 ± 1.9 | 183.7 ± 3.6 | 0.6 | –0.3 |
| prednisolone acetate | C5 | 178.5 | 314.6 ± 2.6 | 142.9 ± 2.2 | 78.0 ± 1.6 | 236.5 ± 1.2 | 204.1 ± 2.6 | 0.5 | –0.4 |
| methylprednisolone | C5 | 178.2 | 319.4 ± 1.9 | 146.5 ± 2.6 | 68.7 ± 2.9 | 250.7 ± 2.1 | 211.8 ± 1.9 | 0.5 | –0.4 |
| methylpredniaolone acetate | C5 | 172.0 | 308.8 ± 1.2 | 142.5 ± 2.2 | 64.6 ± 2.3 | 244.2 ± 1.8 | 205.2 ± 1.8 | 0.6 | –0.3 |
| prednisolone acetate | C22 | 169.7 | 218.4 ± 2.4 | 214.8 ± 2.5 | 75.8 ± 1.4 | 142.6 ± 3.6 | –140.8 ± 1.7 | 0.04 | 0.9 |
| methylprednisolone acetate | C22 | 170.1 | 222.0 ± 3.2 | 209.8 ± 2.0 | 78.4 ± 2.4 | 143.6 ± 2.5 | –137.5 ± 3.6 | 0.1 | 0.8 |
| prednisone | C1 | 155.6 | 273.8 ± 3.4 | 146.9 ± 2.3 | 46.0 ± 2.5 | 227.8 ± 2.0 | 177.4 ± 5.1 | 0.8 | –0.1 |
| prednisolone | C1 | 157.6 | 274.4 ± 4.8 | 159.1 ± 3.2 | 39.2 ± 3.5 | 235.2 ± 2.6 | –177.5 ± 4.8 | 1.0 | 0.02 |
| prednisolone acetate | C1 | 162.5 | 279.4 ± 2.2 | 165.0 ± 4.2 | 43.1 ± 4.6 | 236.3 ± 3.4 | –179.1 ± 2.9 | 0.9 | 0.03 |
| methylprednisolone | C1 | 164.0 | 290.2 ± 4.7 | 158.6 ± 3.1 | 43.2 ± 3.4 | 247.0 ± 2.4 | 189.3 ± 7.0 | 0.9 | –0.06 |
| methylprednisolone acetate | C1 | 153.3 | 269.5 ± 4.7 | 158.8 ± 3.2 | 31.5 ± 3.5 | 238.0 ± 2.6 | –182.7 ± 5.2 | 0.9 | 0.07 |
| prednisone | C2 | 130.0 | 213.1 ± 2.2 | 136.1 ± 1.4 | 40.8 ± 1.6 | 172.3 ± 1.6 | 133.8 ± 2.5 | 0.9 | –0.1 |
| prednisolone | C2 | 130.3 | 214.8 ± 1.0 | 136.1 ± 0.9 | 39.9 ± 0.7 | 174.9 ± 1.0 | –135.6 ± 1.0 | 0.9 | 0.1 |
| prednisolone acetate | C2 | 125.9 | 204.1 ± 2.5 | 131.0 ± 1.6 | 42.5 ± 1.9 | 161.6 ± 1.9 | –125.0 ± 2.9 | 0.9 | 0.09 |
| methylprednisolone | C2 | 125.9 | 206.5 ± 1.9 | 131.0 ± 1.2 | 40.1 ± 1.4 | 166.4 ± 1.5 | –128.7 ± 2.2 | 0.9 | 0.09 |
| methylprednisolone acetate | C2 | 131.0 | 221.8 ± 2.6 | 135.5 ± 1.7 | 35.6 ± 2.0 | 186.1 ± 1.8 | –143.0 ± 3.0 | 0.9 | 0.07 |
| prednisone | C4 | 125.6 | 196.9 ± 2.9 | 139.4 ± 1.9 | 40.4 ± 2.3 | 156.4 ± 2.4 | –127.7 ± 3.4 | 0.7 | 0.2 |
| prednisolone | C4 | 124.0 | 193.2 ± 0.4 | 128.8 ± 0.2 | 50.0 ± 0.3 | 143.1 ± 0.5 | –110.9 ± 0.4 | 0.9 | 0.1 |
| prednisolone acetate | C4 | 123.4 | 191.4 ± 1.6 | 128.9 ± 1.0 | 49.9 ± 1.2 | 141.5 ± 1.4 | –110.2 ± 1.8 | 0.8 | 0.1 |
| methylprednisolone | C4 | 121.0 | 201.3 ± 0.7 | 115.3 ± 0.4 | 46.3 ± 0.5 | 155.0 ± 0.7 | 120.5 ± 1.1 | 0.8 | –0.1 |
| methylprednisolone acetate | C4 | 121.0 | 202.2 ± 2.9 | 117.8 ± 1.9 | 42.9 ± 2.2 | 159.3 ± 2.3 | 121.8 ± 4.1 | 0.9 | –0.06 |
| prednisone | C17 | 88.4 | 91.9 ± 0.07 | 91.9 ± 0.04 | 81.4 ± 0.06 | 10.5 ± 0.08 | –10.5 ± 0.09 | 0.0 | 1.0 |
| prednisolone | C17 | 90.4 | 95.2 ± 0.5 | 95.2 ± 0.2 | 80.9 ± 0.4 | 14.3 ± 0.7 | –14.3 ± 0.6 | 0.0 | 1.0 |
| prednisolone acetate | C17 | 90.5 | 93.4 ± 0.05 | 93.3 ± 0.03 | 84.8 ± 0.04 | 8.5 ± 0.05 | –8.5 ± 0.06 | 0.01 | 1.0 |
| methylprednisolone | C17 | 90 | 94.9 ± 0.05 | 93.1 ± 0.04 | 81.9 ± 0.04 | 13.0 ± 0.02 | –12.1 ± 0.06 | 0.2 | 0.7 |
| methylprednisolone acetate | C17 | 90.4 | 94.0 ± 0.05 | 94.0 ± 0.03 | 83.1 ± 0.04 | 10.9 ± 0.05 | 10.9 ± 0.06 | 0.0 | 1.0 |
| prednisone | C11 | 210.2 | 323.5 ± 3.1 | 170.0 ± 2.1 | 137.1 ± 2.3 | 186.4 ± 2.1 | 169.9 ± 4.7 | 0.3 | –0.6 |
| prednisolone | C11 | 70.5 | 100.2 ± 0.3 | 63.5 ± 0.2 | 47.8 ± 0.2 | 52.5 ± 0.4 | 44.6 ± 0.4 | 0.5 | –0.4 |
| prednisolone acetate | C11 | 70.6 | 102.4 ± 0.6 | 59.7 ± 0.4 | 49.7 ± 0.4 | 52.7 ± 0.4 | 47.7 ± 0.9 | 0.3 | –0.6 |
| methylprednisolone | C11 | 69.8 | 98.7 ± 0.2 | 62.6 ± 0.2 | 48.0 ± 0.2 | 50.7 ± 0.2 | 43.4 ± 0.4 | 0.5 | –0.4 |
| methylprednisolone acetate | C11 | 70.3 | 104.0 ± 0.2 | 57.9 ± 0.1 | 49.0 ± 0.1 | 55.0 ± 0.1 | 50.6 ± 0.3 | 0.2 | –0.7 |
| prednisone | C21 | 67 | 100.5 ± 0.3 | 58.5 ± 0.2 | 42.0 ± 0.2 | 58.5 ± 0.2 | 50.2 ± 0.5 | 0.5 | –0.4 |
| prednisolone | C21 | 67.7 | 101.8 ± 0.3 | 61.5 ± 0.2 | 39.8 ± 0.2 | 62.0 ± 0.2 | 51.2 ± 0.4 | 0.6 | –0.3 |
| prednisolone acetate | C21 | 69.4 | 99.7 ± 0.8 | 61.8 ± 0.5 | 46.7 ± 0.6 | 53.0 ± 0.2 | 45.4 ± 1.2 | 0.6 | –0.4 |
| methylprednisolone | C21 | 68.3 | 99.3 ± 0.6 | 67.8 ± 0.4 | 37.8 ± 0.5 | 61.5 ± 0.4 | 46.5 ± 1.0 | 0.97 | –0.02 |
| methylprednisolone acetate | C21 | 69.4 | 104.6 ± 0.5 | 51.8 ± 0.3 | 51.8 ± 0.3 | 52.8 ± 0.3 | 52.8 ± 0.7 | 0.0 | –1.0 |
| prednisone | C9 | 62.6 | 74.2 ± 0.1 | 65.0 ± 0.06 | 48.5 ± 0.08 | 25.7 ± 0.1 | –21.1 ± 0.1 | 0.6 | 0.3 |
| prednisolone | C9 | 54.8 | 63.4 ± 0.09 | 56.7 ± 0.05 | 44.3 ± 0.07 | 19.0 ± 0.1 | –15.7 ± 0.1 | 0.6 | 0.3 |
| prednisolone acetate | C9 | 55.5 | 63.9 ± 0.09 | 56.5 ± 0.05 | 46.0 ± 0.07 | 17.9 ± 0.1 | –14.2 ± 0.1 | 0.8 | 0.2 |
| methylprednisolone | C9 | 53.3 | 60.7 ± 0.1 | 53.9 ± 0.06 | 45.2 ± 0.1 | 15.4 ± 0.1 | –12.0 ± 0.1 | 0.8 | 0.1 |
| methylprednisolone acetate | C9 | 54.3 | 64.5 ± 0.1 | 54.2 ± 0.09 | 44.2 ± 0.1 | 20.2 ± 0.2 | 15.2 ± 0.1 | 1.0 | –0.01 |
| prednisone | C14 | 52.2 | 69.5 ± 0.2 | 55.0 ± 0.1 | 32.1 ± 0.2 | 37.4 ± 0.2 | –30.2 ± 0.3 | 0.7 | 0.2 |
| prednisolone | C14 | 52.8 | 76.4 ± 1.2 | 48.5 ± 0.9 | 33.5 ± 0.7 | 42.9 ± 1.2 | 35.4 ± 1.8 | 0.6 | –0.3 |
| prednisolone acetate | C14 | 51.7 | 67.8 ± 0.3 | 55.6 ± 0.2 | 31.6 ± 0.2 | 36.2 ± 0.3 | –30.0 ± 0.4 | 0.6 | 0.3 |
| methylprednisolone | C14 | 52.1 | 68.7 ± 0.08 | 52.7 ± 0.05 | 34.9 ± 0.07 | 33.8 ± 0.1 | –25.8 ± 0.1 | 0.9 | 0.05 |
| methylprednisolone acetate | C14 | 52.3 | 69.6 ± 0.06 | 53.7 ± 0.03 | 33.6 ± 0.05 | 35.9 ± 0.07 | –28.0 ± 0.08 | 0.8 | 0.1 |
| prednisone | C13 | 51.2 | 69.0 ± 0.3 | 49.3 ± 0.2 | 35.3 ± 0.2 | 33.7 ± 0.3 | 26.7 ± 0.5 | 0.8 | –0.2 |
| prednisolone | C13 | 47.4 | 63.9 ± 0.4 | 52.5 ± 0.3 | 25.8 ± 0.02 | 38.2 ± 0.4 | –32.4 ± 0.4 | 0.5 | 0.4 |
| prednisolone acetate | C13 | 48.6 | 62.6 ± 0.2 | 54.0 ± 0.1 | 29.1 ± 0.2 | 33.4 ± 0.3 | –29.2 ± 0.2 | 0.4 | 0.5 |
| methylprednisolone | C13 | 47.8 | 63.4 ± 0.2 | 52.8 ± 0.1 | 27.1 ± 0.1 | 36.3 ± 0.2 | –31.0 ± 0.2 | 0.5 | 0.4 |
| methylprednisolone acetate | C13 | 47.9 | 62.3 ± 0.1 | 52.5 ± 0.06 | 28.8 ± 0.08 | 33.5 ± 0.1 | –28.6 ± 0.1 | 0.5 | 0.4 |
| prednisone | C10 | 42.4 | 65.1 ± 0.1 | 39.1 ± 0.1 | 23.0 ± 0.1 | 42.0 ± 0.1 | 34.0 ± 0.3 | 0.7 | –0.2 |
| prednisolone | C10 | 45.0 | 69.3 ± 0.2 | 39.3 ± 0.2 | 26.4 ± 0.1 | 42.9 ± 0.2 | 36.5 ± 0.3 | 0.5 | –0.4 |
| prednisolone acetate | C10 | 45.9 | 70.7 ± 0.4 | 41.1 ± 0.2 | 25.9 ± 0.3 | 44.7 ± 0.3 | 37.1 ± 0.6 | 0.6 | –0.3 |
| methylprednisolone | C10 | 46.3 | 72.9 ± 0.3 | 38.9 ± 0.2 | 27.1 ± 0.2 | 45.8 ± 0.2 | 39.8 ± 0.4 | 0.4 | –0.5 |
| methylprednisolone acetate | C10 | 43.7 | 65.9 ± 0.1 | 39.4 ± 0.09 | 25.8 ± 0.1 | 40.0 ± 0.1 | 33.3 ± 0.2 | 0.6 | –0.3 |
| prednisone | C12 | 37.7 | 47.3 ± 0.04 | 35.9 ± 0.03 | 29.8 ± 0.03 | 17.4 ± 0.03 | 14.4 ± 0.07 | 0.6 | –0.3 |
| prednisolone | C12 | 43.0 | 49.4 ± 0.1 | 39.8 ± 0.07 | 39.8 ± 0.1 | 9.5 ± 0.2 | 9.5 ± 0.2 | 0.0 | –1.0 |
| prednisolone acetate | C12 | 38.3 | 41.5 ± 0.08 | 41.5 ± 0.04 | 31.8 ± 0.06 | 9.7 ± 0.09 | –9.7 ± 0.09 | 0.0 | 1.0 |
| methylprednisolone | C12 | 42.3 | 65.1 ± 0.8 | 41.1 ± 0.5 | 20.7 ± 0.6 | 44.4 ± 0.7 | 34.1 ± 1.3 | 0.9 | –0.07 |
| methylprednisolone acetate | C12 | 38.4 | 42.0 ± 0.09 | 42.0 ± 0.05 | 31.1 ± 0.08 | 10.9 ± 0.1 | –10.9 ± 0.1 | 0.0 | 1.0 |
| prednisone | C7 | 37.7 | 47.3 ± 0.04 | 35.9 ± 0.03 | 29.8 ± 0.03 | 17.4 ± 0.03 | 14.4 ± 0.07 | 0.6 | –0.3 |
| prednisolone | C7 | 34.7 | 47.4 ± 0.08 | 28.3 ± 0.06 | 28.3 ± 0.05 | 19.0 ± 0.1 | 19.0 ± 0.1 | 0.0 | –1.0 |
| prednisolone acetate | C7 | 34.7 | 41.7 ± 0.07 | 34.6 ± 0.04 | 27.8 ± 0.06 | 13.9 ± 0.07 | 10.5 ± 0.1 | 1.0 | –0.02 |
| methylprednisolone | C7 | 39.5 | 45.7 ± 0.2 | 40.1 ± 0.08 | 32.6 ± 0.1 | 13.1 ± 0.3 | –10.3 ± 0.2 | 0.8 | 0.1 |
| methylprednisolone acetate | C7 | 34.0 | 40.1 ± 0.1 | 32.2 ± 0.05 | 29.6 ± 0.09 | 10.5 ± 0.1 | 9.2 ± 0.1 | 0.4 | –0.5 |
| prednisone | C16 | 35.2 | 52.0 ± 0.8 | 34.8 ± 0.4 | 18.8 ± 0.6 | 33.3 ± 0.8 | 25.3 ± 1.2 | 0.9 | –0.04 |
| prednisolone | C16 | 33.5 | 42.8 ± 0.05 | 29.2 ± 0.03 | 28.5 ± 0.04 | 14.3 ± 0.07 | 13.9 ± 0.08 | 0.07 | –0.9 |
| prednisolone acetate | C16 | 33.6 | 47.1 ± 0.6 | 32.1 ± 0.3 | 21.5 ± 0.4 | 25.6 ± 0.7 | 20.3 ± 0.8 | 0.8 | –0.2 |
| methylprednisolone | C16 | 35.2 | 58.1 ± 2.1 | 32.2 ± 1.3 | 15.2 ± 1.6 | 42.9 ± 1.8 | 34.4 ± 3.2 | 0.7 | –0.2 |
| methylprednisolone acetate | C16 | 32.3 | 46.9 ± 0.6 | 30.0 ± 0.3 | 20.0 ± 0.5 | 26.8 ± 0.7 | 21.8 ± 0.9 | 0.7 | –0.2 |
| prednisone | C6 | 32.5 | 41.5 ± 0.08 | 30.7 ± 0.04 | 25.2 ± 0.06 | 16.2 ± 0.07 | 13.5 ± 0.09 | 0.6 | –0.3 |
| prednisolone | C6 | 32.5 | 54.7 ± 0.8 | 31.1 ± 0.6 | 11.7 ± 0.5 | 42.9 ± 0.8 | 33.3 ± 1.2 | 0.9 | –0.1 |
| prednisolone acetate | C6 | 33.1 | 46.1 ± 0.3 | 30.1 ± 0.1 | 23.1 ± 0.3 | 22.9 ± 0.4 | 19.5 ± 0.5 | 0.5 | –0.4 |
| methylprednisolone | C6 | 33.9 | 41.1 ± 0.1 | 34.0 ± 0.06 | 26.6 ± 0.1 | 14.5 ± 0.1 | –10.9 ± 0.1 | 1.0 | 0.02 |
| methylprednisolone acetate | C6 | 31.8 | 42.8 ± 0.2 | 29.4 ± 0.1 | 23.1 ± 0.2 | 19.7 ± 0.3 | 16.6 ± 0.3 | 0.5 | –0.4 |
| prednisone | C8 | 32.5 | 41.5 ± 0.08 | 30.7 ± 0.04 | 25.2 ± 0.06 | 16.2 ± 0.07 | 13.5 ± 0.09 | 0.6 | –0.3 |
| prednisolone | C8 | 31.4 | 40.9 ± 0.06 | 26.6 ± 0.04 | 26.6 ± 0.04 | 14.3 ± 0.07 | 14.3 ± 0.09 | 0.0 | –1.0 |
| prednisolone acetate | C8 | 32.3 | 43.3 ± 0.09 | 28.7 ± 0.06 | 24.9 ± 0.07 | 18.4 ± 0.09 | 16.5 ± 0.1 | 0.3 | –0.6 |
| methylprednisolone | C8 | 32.1 | 42.3 ± 0.08 | 27.06 ± 0.05 | 27.06 ± 0.06 | 15.2 ± 0.07 | 15.2 ± 0.1 | 0.0 | –1.0 |
| methylprednisolone acetate | C8 | 25.2 | 43.0 ± 0.3 | 23.4 ± 0.2 | 9.0 ± 0.2 | 34.0 ± 0.3 | 26.8 ± 0.5 | 0.8 | –0.1 |
| prednisone | C15 | 25.0 | 40.2 ± 0.4 | 27.0 ± 0.2 | 7.7 ± 0.3 | 32.5 ± 0.4 | –25.9 ± 0.4 | 0.7 | 0.2 |
| prednisolone | C15 | 23.9 | 39.4 ± 0.09 | 16.7 ± 0.06 | 15.5 ± 0.07 | 23.8 ± 0.1 | 23.2 ± 0.1 | 0.07 | –0.9 |
| prednisolone acetate | C15 | 23.4 | 39.0 ± 0.6 | 27.0 ± 0.4 | 4.1 ± 0.5 | 34.9 ± 0.6 | –28.8 ± 0.8 | 0.6 | 0.3 |
| methylprednisolone | C15 | 24.6 | 42.5 ± 0.6 | 25.4 ± 0.4 | 5.8 ± 0.3 | 36.7 ± 0.6 | –28.1 ± 0.7 | 0.9 | 0.07 |
| methylprednisolone acetate | C15 | 24.2 | 41.1 ± 0.1 | 17.1 ± 0.07 | 14.2 ± 0.08 | 26.9 ± 0.08 | 25.4 ± 0.1 | 0.2 | –0.8 |
| prednisone | C18C19 | 17.2 | 28.9 ± 0.1 | 14.2 ± 0.06 | 8.5 ± 0.07 | 20.4 ± 0.1 | 17.6 ± 0.1 | 0.5 | –0.4 |
| prednisolone | C18C19 | 18.0 | 27.3 ± 0.04 | 13.7 ± 0.03 | 13.0 ± 0.03 | 14.3 ± 0.05 | 13.9 ± 0.07 | 0.07 | –0.9 |
| prednisolone acetate | C18C19 | 20.7 | 39.7 ± 0.3 | 11.2 ± 0.1 | 11.2 ± 0.2 | 28.5 ± 0.2 | 28.5 ± 0.4 | 0.0 | –1.0 |
| methylprednisolone | C18C19 | 20.4 | 31.9 ± 0.1 | 14.9 ± 0.09 | 14.4 ± 0.1 | 17.5 ± 0.1 | 17.2 ± 0.2 | 0.04 | –0.9 |
| methylprednisolone acetate | C18C19 | 20.8 | 32.5 ± 0.1 | 17.1 ± 0.08 | 12.7 ± 0.1 | 19.8 ± 0.1 | 17.6 ± 0.2 | 0.3 | –0.5 |
| methylprednisolone | C22 | 18.7 | 30.7 ± 0.3 | 12.9 ± 0.1 | 12.3 ± 0.3 | 18.4 ± 0.4 | 18.0 ± 0.5 | 0.05 | –0.9 |
| prednisolone acetate | C23 | 18.0 | 27.6 ± 0.09 | 13.2 ± 0.05 | 13.2 ± 0.07 | 14.5 ± 0.09 | 14.5 ± 0.1 | 0.0 | –1.0 |
| methylprednisolone acetate | C23 | 18.1 | 33.1 ± 0.1 | 14.7 ± 0.08 | 6.5 ± 0.1 | 26.6 ± 0.1 | 22.5 ± 0.2 | 0.5 | –0.4 |
| methylprednisolone acetate | C24 | 22.3 | 43.5 ± 0.1 | 15.9 ± 0.1 | 7.5 ± 0.1 | 36.0 ± 0.1 | 31.8 ± 0.2 | 0.4 | –0.5 |
Span (Ω = δ11 – δ33); isotropic chemical shift  ; asymmetry
  ; skew
 ; anisotropy
  }.
}.
From Table 1, Figures 678910, it is noticeable that the values of “asymmetry” and “span” of C17 nuclei are substantially lower than those of other carbon nuclei on the cyclopentane ring, although the value of its isotropic chemical shift is large, which is because of the hyperconjugation.24−26 The electron density is transferred from the carbon–carbon (C–C) σ-orbital to the adjacent carbon–oxygen (C–O) antibonding σ* orbital because of the hyperconjugation. As oxygen is more electronegative than carbon, the carbon–carbon σ-orbital acts like an electron donor, and the carbon–oxygen σ* orbital acts like an electron acceptor. Because of the delocalization of electrons, electron density surrounding the C17 nucleus is increased, and as a consequence, the nuclear shielding effect is also increased.
Figure 6.

Prednisone: the spinning CSA sideband pattern at crystallographically different carbon nuclei sites. The values of asymmetry and span of C17 nuclei are substantially lower than those of other carbon nuclei on the cyclopentane ring because of the hyperconjugation.
Figure 7.

Prednisolone: the spinning the CSA sideband pattern at crystallographically different carbon nuclei sites.
Figure 8.

Methylprednisolone: the spinning CSA sideband pattern at crystallographically different carbon nuclei sites.
Figure 9.

Prednisolone acetate: the spinning CSA sideband pattern at crystallographically different carbon nuclei sites.
Figure 10.

Methylprednisolone acetate: the spinning CSA sideband pattern at crystallographically different carbon nuclei sites.
Table 1 and Figure 8 show that the “span
(Ω = δ11 – δ33)”
and “anisotropy  ” of the C3 nuclei of methylprednisolone
are larger than those of prednisone, prednisolone, prednisolone acetate,
and methylprednisolone acetate. The magnitude of the “anisotropy
parameter”, which measures the largest separation of the spinning
CSA sideband pattern from the center of gravity (δiso = (δ11 + δ22 + δ33)/3), and the sign of the “anisotropy parameter
” of the C3 nuclei of methylprednisolone
are larger than those of prednisone, prednisolone, prednisolone acetate,
and methylprednisolone acetate. The magnitude of the “anisotropy
parameter”, which measures the largest separation of the spinning
CSA sideband pattern from the center of gravity (δiso = (δ11 + δ22 + δ33)/3), and the sign of the “anisotropy parameter  ” represents in which direction
of
the center of gravity the largest separation resides. The sign of
the anisotropy parameter for C3 carbon nuclei is negative for methylprednisolone,
while for the other four glucocorticoids, the sign of the anisotropy
parameter is positive. These imply that the electron distribution
surrounding the C3 nuclei of methylprednisolone is hugely altered
compared to the other four glucocorticoids.
” represents in which direction
of
the center of gravity the largest separation resides. The sign of
the anisotropy parameter for C3 carbon nuclei is negative for methylprednisolone,
while for the other four glucocorticoids, the sign of the anisotropy
parameter is positive. These imply that the electron distribution
surrounding the C3 nuclei of methylprednisolone is hugely altered
compared to the other four glucocorticoids.
The principal component of CSA parameter δ22 of the carbonyl group carbon reflects the strength of the hydrogen bonding associated with the group. Its value shifted toward the higher frequency side when the strength of the hydrogen bonding is decreased.20,23Table 1 shows that the values of δ22 of C3 carbon nuclei are the largest for methylprednisolone compared to prednisone, prednisolone, and prednisolone acetate, which signify that the strength of the intermolecular hydrogen bonding (which connect two other molecules via hydrogen bonds) is lowered in methylprednisolone.
The spinning CSA sideband pattern of C12 nuclei is highly asymmetric for methylprednisolone, where the same is axially symmetric for other four glucocorticoids. Figure 8 shows that the “span” of C12 nuclei is also higher for methylprednisolone than the “span” of C12 nuclei for other four glucocorticoids (see Figures 6, 7, 9, and 10).
As the keto-group is attached with the C11 atom of cyclohexane rings of prednisone, from Table 1 and Figure 6, it is clear that the isotropic as well as anisotropic CSA parameters are higher for the C11 nuclei of prednisone compared to other four glucocorticoids because of the existence of polar bond and magnetic anisotropy.20−22 For other four glucocorticoids, the keto group is replaced by the hydroxyl group. There is an intramolecular hydrogen bonding between the oxygen atom of the keto group bonded with C11 and the hydrogen atom of C19, as it is shown in Figure S12a of the Supporting Information. This intramolecular hydrogen bond can also be considered as a source for the higher value of the principal components of the CSA parameters of the C11 atom. The “span” and “anisotropy” at the C16 nuclei site of methylprednisolone are higher than those parameters at C16 nuclei sites of prednisolone. The “span” of C6 nuclei of prednisolone is substantially higher than that for other four glucocorticoids. The spinning CSA sideband patterns of C8 nuclei are axially symmetric for prednisolone and methylprednisolone, but it is highly asymmetric for methylprednisolone acetate. The spinning CSA sideband pattern for C15 nuclei is axially symmetric for prednisolone, but it is highly asymmetric for methylprednisolone.
3.3. Determination of Spin–Lattice Relaxation Time and Calculation of Local Correlation Time at Crystallographically Inequivalent Carbon Nuclei Sites of Five Glucocorticoids
It can be observed by comparing the chemical structure of prednisone and prednisolone (Figure 1a,c) that the C11 atom is bonded with the keto group in prednisone, where it is bonded with the hydroxyl group in prednisolone. This small change in the substitution group brings huge difference in the motional dynamics of the glucocorticoids. Table 2 and Figure 11 show that the spin–lattice relaxation time of all carbon nuclei (except methyl groups C18, C19 carbon nuclei) of prednisone is longer than that of prednisolone. Hence, it can be said that prednisolone is more flexible than prednisone. The activity of the prednisolone is more than prednisone. Prednisolone is the active metabolite of prednisone. Within the liver, prednisone is transformed to prednisolone, which is capable to cross the cellular membrane. Within the cell, prednisolone inhibits the infiltration of inflammation and it acts as the immune response marker.14 That’s why, prednisolone is prescribed for the inflammatory and autoimmune disorders like rheumatic, respiratory, allergic, endocrine, collagen, hematologic, gastrointestinal, and ophthalmic disorders. Hence, the ability of prednisolone to cross the cellular membrane is correlated with the increase of the spin–lattice relaxation rate compared to prednisone. The attachment of the hydroxyl group in place of the keto group with the C11 atom of the glucocorticoids increases the capability of the drug to cross the cellular membrane and it also increases the motional degrees of freedom of the glucocorticoids. Further observation says that the spin–lattice relaxation time at each crystallographically distinct carbon nuclei sites of methylprednisolone is less than that of prednisolone. The bioactivity of methylprednisolone is more than that of prednisolone (it is observed by in silico analysis, which will be discussed in the next section), and methylprednisolone has greater anti-inflammatory potency than prednisolone.15 Hence, the attachment of a methyl group with the C6 carbon atom of the “B” ring of prednisolone increases the spin–lattice relaxation rate and also increases the potency of the glucocorticoid as an anti-inflammatory hormone. It is revealed by these comparative data that the dynamics of the glucocorticoids can be correlated with the potency of the anti-inflammatory hormone. Hence, in terms of motional degrees of freedom, methylprednisolone >prednisolone > prednisone. Hence, the structure–activity relationship of drug molecules can be established by NMR relaxometry measurements.
Table 2. Spin–Lattice Relaxation Time at Crystallographically Inequivalent Carbon Nuclei Sites of Prednisone, Prednisolone, Prednisolone Acetate, Methylprednisolone, and Methylprednisolone Acetate.
| prednisone |
prednisolone |
prednisolone
acetate |
methylprednisolone |
methylprednisolone
acetate |
|||||
|---|---|---|---|---|---|---|---|---|---|
| carbon nuclei | relaxation time (s) | carbon nuclei | relaxation time (s) | carbon nuclei | relaxation time (s) | carbon nuclei | relaxation time (s) | carbon nuclei | relaxation time (s) |
| C20 | 388 ± 20 | C20 | 211 ± 10 | C20 | 192 ± 10 | C20 | 180 ± 5 | C20 | 118 ± 5 |
| C3 | 600 ± 30 | C3 | 355 ± 20 | C3 | 306 ± 10 | C3 | 170 ± 5 | C3 | 164 ± 10 |
| C5 | 397 ± 20 | C5 | 262 ± 12 | C5 | 172 ± 10 | C5 | 70 ± 2 | C5 | 68 ± 5 |
| C1 | 422 ± 20 | C1 | 255 ± 14 | C1 | 212 ± 10 | C1 | 170 ± 5 | C1 | 162 ± 10 |
| C2 | 357 ± 20 | C2 | 285 ± 20 | C2 | 252 ± 10 | C2 | 165 ± 5 | C2 | 166 ± 10 |
| C4 | 418 ± 20 | C4 | 282 ± 20 | C4 | 210 ± 10 | C4 | 80 ± 2 | C4 | 72 ± 5 |
| C17 | 337 ± 20 | C17 | 200 ± 20 | C17 | 157 ± 10 | C17 | 116 ± 5 | C17 | 105 ± 5 |
| C11 | 388 ± 20 | C11 | 265 ± 20 | C11 | 233 ± 10 | C11 | 145 ± 5 | C11 | 133 ± 5 |
| C21 | 422 ± 20 | C21 | 190 ± 10 | C21 | 205 ± 10 | C21 | 145 ± 5 | C21 | 78 ± 5 |
| C9 | 264 ± 20 | C9 | 246 ± 10 | C9 | 214 ± 10 | C9 | 160 ± 5 | C9 | 146 ± 5 |
| C14 | 338 ± 20 | C14 | 246 ± 10 | C14 | 170 ± 10 | C14 | 120 ± 5 | C14 | 134 ± 5 |
| C13 | 187 ± 10 | C13 | 115 ± 10 | C13 | 50 ± 3 | C13 | 37 ± 2 | C13 | 45 ± 5 |
| C10 | 187 ± 10 | C10 | 135 ± 10 | C10 | 85 ± 5 | C10 | 110 ± 5 | C10 | 70 ± 5 |
| C12 | 400 ± 20 | C12 | 210 ± 12 | C12 | 170 ± 10 | C12 | 90 ± 2 | C12 | 109 ± 5 |
| C7 | 400 ± 20 | C7 | 270 ± 10 | C7 | 209 ± 10 | C7 | 115 ± 5 | C7 | 17 ± 2 |
| C16 | 408 ± 20 | C16 | 217 ± 10 | C16 | 230 ± 10 | C16 | 116 ± 5 | C16 | 96 ± 5 |
| C6 | 420 ± 20 | C6 | 236 ± 10 | C6 | 176 ± 10 | C6 | 30 ± 2 | C6 | 120 ± 5 |
| C8 | 420 ± 20 | C8 | 285 ± 10 | C8 | 185 ± 10 | C8 | 120 ± 5 | C8 | 120 ± 5 |
| C15 | 387 ± 20 | C15 | 242 ± 10 | C15 | 184 ± 10 | C15 | 120 ± 5 | C15 | 100 ± 5 |
| C18, C19 | 5 ± 2 | C18, C19 | 5 ± 1 | C18, C19 | 5 ± 2 | C18, C19 | 5 ± 1 | C18C19 | 10 ± 2 |
| C23 | 10 ± 2 | C22 | 5 ± 1 | C23 | 10 ± 2 | ||||
| C22 | 206 ± 10 | C22 | 83 ± 5 | ||||||
| C24 | 10 ± 2 | ||||||||
Figure 11.

(a) Magnetization decay curve of C3 nucleus of prednisone, prednisolone, and methylprednisolone. (b) Magnetization decay curve of the C5 nucleus of prednisone, prednisolone, and methylprednisolone. (c) Bar diagram of spin–lattice relaxation time of prednisone, prednisolone, and methylprednisolone. It is clear from the bar diagram that the nuclear spin–lattice relaxation time gradually decreases for all carbon nuclei sites (which reflects the motional degrees of freedom of methylprednisolone >prednisolone > prednisone) from prednisone to prednisolone to methylprednisolone. (d) Local correlation times of prednisone, prednisolone, and methylprednisolone at crystallographically inequivalent carbon nuclei sites.
The local correlation time at each crystallographically distinct carbon nuclei sites is also calculated by using the following relation:61−64
| 2 |
The first term represents
the role of chemical shift anisotropy interaction in the relaxation
mechanism of 13C nuclei, where τc = 3τ2 is the local-correlation time, B is the
applied magnetic field, and S2 = (Δδ)2(1 + η2/3), and
and  .
.
The second term represents the role of heteronuclear dipole–dipole interactions in the relaxation mechanism.63
| 3 |
by keeping the first term only,
| 4 |
where X represents 1H. The rCX is the bond distance. Larmour precession frequency ω = 2πf = 2 × 3.14 × 125.758 MHz = 789.76024 MHz; B = 11.74 T, γC = 10.7084 MHz/T, γH = 42.577 MHz/T, ℏ = 1.054 × 10⁻³⁴ J s. The relaxation rate, dominated by chemical shift anisotropy interactions, is proportional to the square of the external-magnetic field. Hence, at a very high value of the magnetic field (at 11.74 T), the relaxation mechanism is mainly dominated by the CSA interaction.
Figure 11d shows that the local correlation time gradually decreases from prednisone to prednisolone to methylprednisolone. Figure 12 and Tables 2 and 3 show that the spin–lattice relaxation time and local correlation time of prednisolone, prednisolone acetate, and methylprednisolone acetate. The spin–lattice relaxation time and local correlation time gradually decrease from prednisolone to prednisolone acetate to methylprednisolone acetate. The biological activity also gradually increases (it will be discussed in in silico analysis).
Figure 12.

(a) Magnetization decay curve of the C3 nucleus of prednisolone, prednisolone acetate, and methylprednisolone acetate. (b) Magnetization decay curve of the C5 nucleus of prednisolone, prednisolone acetate, and methylprednisolone acetate. Bar diagram of (c) spin–lattice relaxation time and (d) local correlation time of prednisolone, prednisolone acetate, and methylprednisolone acetate. It is clear from the bar diagram that both the spin–lattice relaxation time and the local correlation time gradually decrease from prednisolone to prednisolone acetate to methyl prednisolone acetate.
Table 3. Local Correlation Time at Various Carbon Nuclei Sites of Prednisone, Prednisolone, Prednisolone Acetate, Methyl Prednisolone, and Methyl Prednisolone Acetate.
| prednisone |
prednisolone |
prednisolone
acetate |
methyl
prednisolone |
methyl
prednisolone acetate |
|||||
|---|---|---|---|---|---|---|---|---|---|
| carbon nuclei | local correlation time (s) | carbon nuclei | local correlation time (s) | carbon nuclei | local correlation time (s) | carbon nuclei | local correlation time (s) | carbon nuclei | local correlation time (s) |
| C20 | 9.5 × 10⁻⁴ | C20 | 5.3 × 10⁻⁴ | C20 | 4.3 × 10⁻⁴ | C20 | 3.9 × 10⁻⁴ | C20 | 2.6 × 10⁻⁴ |
| C3 | 1.3 × 10⁻³ | C3 | 8.9 × 10⁻⁴ | C3 | 7.4 × 10⁻⁴ | C3 | 1.0 × 10⁻³ | C3 | 4.1 × 10⁻⁴ |
| C5 | 1.2 × 10⁻³ | C5 | 9.3 × 10⁻⁴ | C5 | 6.2 × 10⁻⁴ | C5 | 2.7 × 10⁻⁴ | C5 | 2.5 × 10⁻⁴ |
| C1 | 1.3 × 10⁻³ | C1 | 8.6 × 10⁻⁴ | C1 | 6.9 × 10⁻⁴ | C1 | 6.2 × 10⁻⁴ | C22 | 1.7 × 10⁻⁴ |
| C2 | 6.5 × 10⁻⁴ | C2 | 4.8 × 10⁻⁴ | C2 | 3.9 × 10⁻⁴ | C2 | 2.8 × 10⁻⁴ | C1 | 5.5 × 10⁻⁴ |
| C4 | 6.3 × 10⁻⁴ | C4 | 3.5 × 10⁻⁴ | C4 | 2.5 × 10⁻⁴ | C4 | 1.1 × 10⁻⁴ | C2 | 3.4 × 10⁻⁴ |
| C17 | 2.9 × 10⁻⁶ | C17 | 3.8 × 10⁻⁶ | C17 | 9.1 × 10⁻⁷ | C17 | 1.4 × 10⁻⁶ | C4 | 1.1 × 10⁻⁴ |
| C11 | 9.5 × 10⁻⁴ | C11 | 4.5 × 10⁻⁵ | C11 | 4.4 × 10⁻⁵ | C11 | 2.4 × 10⁻⁵ | C17 | 9.9 × 10⁻⁷ |
| C21 | 8.8 × 10⁻⁵ | C21 | 4.5 × 10⁻⁵ | C21 | 3.7 × 10⁻⁵ | C21 | 3.3 × 10⁻⁵ | C11 | 1.8 × 10⁻⁵ |
| C9 | 1.7 × 10⁻⁵ | C9 | 5.8 × 10⁻⁶ | C9 | 4.2 × 10⁻⁶ | C9 | 2.2 × 10⁻⁶ | C21 | 1.7 × 10⁻⁵ |
| C14 | 2.2 × 10⁻⁵ | C14 | 2.8 × 10⁻⁵ | C14 | 1.4 × 10⁻⁵ | C14 | 8.1 × 10⁻⁶ | C9 | 3.6 × 10⁻⁶ |
| C13 | 2.2 × 10⁻⁵ | C13 | 1.0 × 10⁻⁵ | C13 | 3.6 × 10⁻⁶ | C13 | 3.1 × 10⁻⁶ | C14 | 1.0 × 10⁻⁵ |
| C10 | 2.0 × 10⁻⁵ | C10 | 1.5 × 10⁻⁵ | C10 | 1.0 × 10⁻⁵ | C10 | 1.5 × 10⁻⁵ | C13 | 3.2 × 10⁻⁶ |
| C12 | 7.4 × 10⁻⁶ | C12 | 1.5 × 10⁻⁶ | C12 | 1.3 × 10⁻⁶ | C12 | 1.0 × 10⁻⁵ | C10 | 6.9 × 10⁻⁶ |
| C7 | 7.4 × 10⁻⁶ | C7 | 7.9 × 10⁻⁶ | C7 | 2.4 × 10⁻⁶ | C7 | 1.2 × 10⁻⁶ | C12 | 1.0 × 10⁻⁶ |
| C16 | 2.6 × 10⁻⁵ | C16 | 3.3 × 10⁻⁶ | C16 | 7.6 × 10⁻⁶ | C16 | 1.3 × 10⁻⁵ | C7 | 1.2 × 10⁻⁷ |
| C6 | 6.8 × 10⁻⁶ | C6 | 2.6 × 10⁻⁵ | C6 | 5.8 × 10⁻⁶ | C6 | 3.7 × 10⁻⁷ | C16 | 4.2 × 10⁻⁶ |
| C8 | 6.8 × 10⁻⁶ | C8 | 4.7 × 10⁻⁶ | C8 | 4.0 × 10⁻⁶ | C8 | 2.2 × 10⁻⁶ | C6 | 2.8 × 10⁻⁶ |
| C15 | 2.4 × 10⁻⁵ | C15 | 1.0 × 10⁻⁵ | C15 | 1.4 × 10⁻⁵ | C15 | 9.6 × 10⁻⁶ | C8 | 8.4 × 10⁻⁶ |
| C18, C19 | 1.3 × 10⁻⁷ | C18, C19 | 7.8 × 10⁻⁸ | C18, C19 | 6.5 × 10⁻⁷ | C19 | 1.2 × 10⁻⁷ | C15 | 5.2 × 10⁻⁶ |
| C23 | 1.7 × 10⁻⁷ | C18 | 2.3 × 10⁻⁷ | C24 | 8.5 × 10⁻⁷ | ||||
| C22 | 3.3 × 10⁻⁴ | C22 | 1.3 × 10⁻⁷ | C18, C19 | 2.5 × 10⁻⁷ | ||||
| C23 | 4.4 × 10⁻⁷ | ||||||||
As we have mentioned in the previous section, the values of δ22 at C3 carbon nuclei is the largest for methylprednisolone compared to prednisone and prednisolone, which implies the strength of the inter-molecular hydrogen bonding is decreased in methylprednisolone. This is one of the reasons for the faster relaxation rate of methylprednisolone compared to prednisolone and prednisone.
The spin–lattice relaxation time of most of the carbon nuclei of prednisolone acetate is lower than that of prednisolone. The intramolecular hydrogen bonding between C21-hydroxyl and C20-keto groups in prednisolone is absent in prednisolone acetate (C21 is attached to the anionic acetate group). This is the origin of the faster relaxation rate of prednisolone acetate compared to prednisolone. The efficacy of a glucocorticoid depends on its potency as anti-inflammatory hormones, its concentration, and its penetrability. Prednisolone acetate (1%) is considered the most effective intraocular anti-inflammatory drug. It can penetrate the cornea and persists for a longer duration. Hence, it has the highest intraocular concentration and it is prescribed to treat uveitis-inflammation inside the eye.16
It is noticeable from Table 2 that the spin–lattice relaxation time of all the carbon nuclei (except methyl group carbons) of these five glucocorticoids is long because molecules are connected by intermolecular and intramolecular hydrogen bonds. The polarized cyclohexadienone carbonyl oxygen atom connected with C3 acts as an acceptor of two hydrogen bonds, while the hydroxyl groups connected with C11 and C17 atoms act as hydrogen-bond donors to the cyclohexadienone carbonyl oxygen of two different neighboring molecules. In this way, each steroid molecule is assembled with four other molecules via hydrogen bonding (as it is shown in Figure S11 of the Supporting Information). The carbonyl oxygen connected with the C20 atom also acts as an acceptor of intramolecular hydrogen bonds (see Figure S12 of Supporting Information).19 The spin–lattice relaxation time of C3 nuclei is the longest among all other carbon nuclei. It is 600 s for prednisone, 355 s for prednisolone, 306 s for prednisolone acetate, 170 s for methylprednisolone, and 164 s for methylprednisolone acetate. The ketone group is attached to the C3 atom of the cyclohexadienone ring, and it can form intermolecular hydrogen bonding (see Figure S12 of the Supporting Information). This is the reason for the largest relaxation time of C3 nuclei. The double bond between C1 and C2 of these five glucocorticoids makes this cyclohexadienone ring (“A”-ring) and the C3-ketone group reside in the same plane, which allows the C3-ketone group to interact with R611 and Q570 and increase the binding affinity of these five glucocorticoids.17,18
The local-correlation time of C17 nuclei is also faster than other nuclei in the cyclopentane ring. Hence, not only the CSA parameters but also the motional dynamics are also affected for C17 nuclei by the action of hyperconjugation. Figure 13 shows the bar diagram of (a) spin–lattice relaxation time and (b) local correlation time of five glucocorticoids. The spin–lattice relaxation time gradually decreases from prednisone to prednisolone to prednisolone acetate to methylprednisolone to methylprednisolone acetate for most of the carbon nuclei sites except C6, C10, and C12. For C6, and C12 carbon nuclei sites, the spin–lattice relaxation time of methylprednisolone acetate is slightly longer than methylprednisolone. The local correlation times at C20, C5, C1, C4, C11, and C21 carbon nuclei sites gradually decrease from prednisone to prednisolone to prednisolone acetate to methylprednisolone to methylprednisolone acetate, but the trend is not followed at other carbon nuclei sites.
Figure 13.

Bar diagram of (a) spin–lattice relaxation time and (b) local-correlation time of five steroids: prednisone, prednisolone, prednisolone acetate, methylprednisolone, and methylprednisolone acetate. It is noticeable that the local correlation time is very low at C17 nuclei sites for five steroids.
3.4. Comparison of Three Steroids: Prednisone, Prednisolone, and Prednisolone Acetate by Analyzing the XRD Data
The 2D fingerprint plot of the Hirshfeld surface of prednisone,65 prednisolone,66 and prednisolone acetate67 by using crystal Explorer 21.5 software68 are shown, respectively, in Figures S8–S10 of the Supporting Information. These 2D fingerprint plots exhibit the occurrence of each combination of the distance between the nearest neighbor to the exterior of the Hirshfeld surface (de) and the distance between the nearest neighbor to the interior of the Hirshfeld surface (di). Hence, it represents the intermolecular interactions as well as the comparative surface area of each interaction. Each point on the 2D fingerprint plot corresponds to a unique (de, di) pair, and the color of each point corresponds to the relative surface area with that (de, di) pair. The surface area is colorless (gray), where there is an absence of a particular type of interaction, as shown in Figures S10f and S8f. C···C interaction is 0% and the surface area appears gray. The green to red region of the Hirshfeld surface indicates the presence of the strongest interaction of a particular type, as shown in Figures S8b, S9b, and S10b. The H···H interaction strength varies from 60.2 to 66.6%. The green region indicates the intermediate interactions. Among these three molecules, the relative percentage of the O···H interaction (hydrogen-bonding interaction) is the strongest (32%) for prednisone compared to that of prednisolone (26.6%) and prednisolone acetate (28.7%). This result is consistent with the NMR relaxometry data (Section 3.2), where it was observed that the spin–lattice relaxation time (see Figure 13a) for each chemically distinct carbon nuclei site of prednisone is larger than that for prednisolone and prednisolone acetate. The motional degrees of freedom of prednisolone and prednisolone acetate increase because of the decrement of the strength of the hydrogen bonding. The lattice energy of these three glucocorticoids is calculated by using Crystal Explorer 21.5 software with the B3LYP/6-31G (d, p) interaction energy model. The energy framework representations of three glucocorticoids prednisone, prednisolone, and prednisolone acetate are shown in Figure 14.
Figure 14.

Energy framework representations of three glucocorticoids prednisone, prednisolone, and prednisolone acetate. Prednisone: decomposition components of (a) Coulomb energy (red color) = −119.929 kJ/mole, (b) dispersion energy (green color) = −171.561 kJ/mole, (c) total energy (blue color) = −197.453 kJ/mole. Prednisolone: (d) Coulomb energy = −104.335 kJ/mole, (e) dispersion energy = −184.718 kJ/mole, (f) total energy = −207.292 kJ/mole. Prednisolone acetate: (g) Coulomb energy = −123.14 kJ/mole, (h) dispersion energy = −185.143 kJ/mole, (i) total energy = −193.946 kJ/mole.
The 3D framework of interaction is fabricated by the interaction energy values among the nearest neighbor molecules. The cylinder represents interaction energy in the pairwise joined molecule, and the radii of the cylinder are proportional to the intermolecular interaction strength. The related table (Tables S1–S3) and figures (Figures S5–S7) regarding energy calculation are shown in the Supporting Information.
It is observed that the electrostatic and the dispersion energy are slightly more negative in prednisolone acetate compared to the prednisone and prednisolone, suggesting that prednisolone acetate is a more stable molecule. The lattice energies of prednisone, prednisolone, and prednisolone acetate are, respectively, −98.72, −103.64, and −96.97 kJ/mol. The lattice energy of prednisolone shows a more negative value (−103.64 kJ/mol) compared to prednisone and prednisolone acetate. This may be due to the highest H···H interaction strength of prednisolone (66.6%) and a symmetric arrangement (head to tail arrangement, as shown in Figure S11b) of the molecule in the crystal lattice, while in the other two molecules, prednisone and prednisolone acetate arrange in an asymmetric fashion (head to head/tail to tail connection in an opposite manner, as shown in Figure S11a,c). The carbonyl oxygen at C11 in prednisone shows an intramolecular hydrogen bonding (−C=O···H) with C19 methyl hydrogen, but this type of hydrogen bonding does not present in prednisolone and prednisolone acetate (as shown in Figure S12b,c) as the keto group is replaced by the hydroxyl group at the position of the C11 atom in prednisolone and prednisolone acetate. The carbonyl oxygen of C20 formed intermolecular hydrogen bonding (as shown in dotted red color in Figure S12a) with neighboring molecules in prednisone, while in prednisolone acetate, C20 carbonyl oxygen forms intramolecular hydrogen bonding (as shown in dotted sky blue in Figure S12c) with C18 methyl hydrogen. In these three glucocorticoids, the carbonyl oxygen at C3 formed an intermolecular hydrogen bonding with the nearest neighboring molecule, as shown in Figure S12 in the Supporting Information. Because of the presence of strong intramolecular and intermolecular interactions, the spin–lattice relaxation times of these glucocorticoids are substantially large.
Figure S11 of the Supporting Information shows the head to head packing arrangement along the molecule’s major axis for prednisone, which is the indication of long-range molecular ordering.69,70 We have observed by site-specific spin–lattice relaxation time measurement that spin–lattice relaxation time of all the carbon nuclei of prednisone is larger than that of other four glucocorticoids (see Figure 11 and Tables 2 and 3). For prednisolone and prednisolone acetate, we observed (Figure S11 of the Supporting Information) head to tail molecular packing. Figure 11 and Table 2 show that the spin–lattice relaxation times of all carbon nuclei of prednisolone and prednisolone acetate are shorter than that for prednisone. Site-specific spin–lattice relaxation time measurements and CSA measurements have been demonstrated as powerful techniques for probing the details of the biomolecules at atomic-scale resolution in a nondisruptive and noninvasive manner.
4. Conclusions
The structure and dynamics of five glucocorticoids prednisone, prednisolone, prednisolone acetate, methylprednisolone, and methylprednisolone acetate were studied by measuring principal components of chemical shift anisotropy tensor and site-specific spin–lattice relaxation time. It is shown by in silico analysis that the bioavailability and efficacy of the glucocorticoid increase from prednisone to prednisolone to prednisolone acetate to methylprednisolone to methylprednisolone acetate. It is revealed by spin–lattice relaxation time measurements and local correlation time calculation at crystallographically inequivalent carbon nuclei sites of five glucocorticoids that the spin dynamic is changing with the addition of various functional groups with the backbone of the glucocorticoid. The motional dynamics of methylprednisolone acetate are higher than prednisolone acetate and prednisolone. The spin–lattice relaxation time at each carbon nuclei of methylprednisolone acetate is lower than that of prednisolone and prednisone. Hence, the increase in the bioavailability and efficacy of the drug is highly correlated with the increase in nuclear spin dynamics. The addition of the methyl group with C6 carbon of the cyclohexane ring increases the nuclear spin dynamics of prednisolone, which leads to an increase in the efficacy of the drug. Similarly, the addition of the acetate group with the C21 carbon nuclei of prednisolone increases the spin dynamics as well as the bioavailability of the drug molecules. The nuclear spin–lattice relaxation rate is the highest when both methyl and acetate groups are added with prednisolone. Hence, it can be concluded that the bioavailability increases with the increase of the overall nuclear spin dynamics of the drug molecules. These types of detailed analyses of five glucocorticoids at atomic-scale resolution will definitely enlighten the path of developing highly potent glucocorticoids and it will also add great impact on “NMR crystallography”.
Acknowledgments
The author Manasi Ghosh is grateful to Science and Engineering Research Board (SERB)-POWER research grant (file no. SPG/2021/000303), Department of Science and Technology (DST), Government of India, IoE-BHU Seed Grant-II (Dev. Scheme No. 6031(B), and DST sponsored SATHI-BHU scheme No. 6025 for financial support. The authors are thankful to Prof. Philip Grandinetti for RMN software.
Supporting Information Available
The Supporting Information is available free of charge at https://pubs.acs.org/doi/10.1021/acsomega.2c05892.
In silico analysis of five glucocorticoids prednisone, prednisolone, prednisolone acetate, methylprednisolone and methylprednisolone acetate; comparative chart of various interactions among three glucocorticoids prednisone, prednisolone, and prednisolone acetate through the analysis of single crystal XRD data by using Crystal Explorer 21.5 software (PDF)
The authors declare no competing financial interest.
Supplementary Material
References
- Duax W. L.; Weeks C. M.; Rohrer D. C.. Crystal structure of steroids: molecular conformation and biological function. Recent Progress in Hormone Research: Proceeding of the 1975 Laurentian Hormone Conference, 1976, vol 32; pp 81–116. [DOI] [PubMed]
- Barnes P. J. Anti-inflammatory actions of glucocorticoids: molecular mechanisms. Clin. Sci. 1998, 94, 557–572. 10.1042/cs0940557. [DOI] [PubMed] [Google Scholar]
- De Bosscher K.; Vanden Berghe W.; Haegeman G. The interplay between the glucocorticoid receptor and nuclear factor kappa Bor activator protein-1: molecular mechanisms forgene repression. Endocr. Rev. 2003, 24, 488–522. 10.1210/er.2002-0006. [DOI] [PubMed] [Google Scholar]
- Lefstin J. A.; Yamamoto K. R. Allosteric effects of DNA on transcriptional regulators. Nature 1998, 392, 885–888. 10.1038/31860. [DOI] [PubMed] [Google Scholar]
- Heck S.; Kullmann M.; Gast A.; Ponta H.; Rahmsdorf H. J.; Herrlich P.; Cato A. C. A distinct modulating domain in glucocorticoid receptor monomers in the repression of activity of the transcription factor AP-1. EMBO J. 1994, 13, 4087–4095. 10.1002/j.1460-2075.1994.tb06726.x. [DOI] [PMC free article] [PubMed] [Google Scholar]
- Reichardt H. M.; Kaestner K. H.; Tuckermann J.; Kretz O.; Wessely O.; Bock R.; Gass P.; Schmid W.; Herrlich P.; Angel P.; Schutz G. DNA binding of the glucocorticoid receptor is not essential for survival. Cell 1998, 93, 531–541. 10.1016/S0092-8674(00)81183-6. [DOI] [PubMed] [Google Scholar]
- Vardanyan R.; Hruby V.. Chapter 29-Immunopharmacological Drugs. Synthesis of Best-Seller Drugs, 2016; pp 549–572.
- Hoes J. N.; Jacobs J. W.; Buttgereit F.; Bijlsma J. W. Current view of glucocorticoid co-therapy with DMARDs in rheumatoid arthritis. Nat. Rev. Rheumatol. 2010, 6, 693–702. 10.1038/nrrheum.2010.179. [DOI] [PubMed] [Google Scholar]
- Frey F. J.; Odermatt A.; Frey B. M. Glucocorticoid-mediated mineralocorticoid receptor activation and hypertension. Curr. Opin. Nephrol. Hypertens. 2004, 13, 451–458. 10.1097/01.mnh.0000133976.32559.b0. [DOI] [PubMed] [Google Scholar]
- Simons S. S. Jr. What goes on behind closed doors: physiological versus pharmacological steroid hormone actions. BioEssays 2008, 30, 744–756. 10.1002/bies.20792. [DOI] [PMC free article] [PubMed] [Google Scholar]
- Wei P.; Ahn Y. I.; Housley P. R.; Alam J.; Vedeckis W. V. Modulationof hormone-dependent glucocorticoid receptor function using a tetracycline-regulated expression system. J. Steroid Biochem. Mol. Biol. 1998, 64, 1–12. 10.1016/S0022-1759(97)89907-3. [DOI] [PubMed] [Google Scholar]
- Adcock I. M.; Nasuhara Y.; Stevens D. A.; Barnes P. J. Ligand induced differentiation of glucocorticoid receptor (GR) transrepression and transactivation: preferential targeting of NF kappa Band lack of I-kappa B involvement. Br. J. Pharmacol. 1999, 127, 1003–1011. 10.1038/sj.bjp.0702613. [DOI] [PMC free article] [PubMed] [Google Scholar] [Retracted]
- Duax W. L.; Weeks C. M.; Rohrer D. C.; Osawa Y. Conformational studies of steroids: correlations with biological data. J. Steroid Biochem. 1975, 6, 195–200. 10.1016/0022-4731(75)90132-6. [DOI] [PubMed] [Google Scholar]
- Kiningham K. K.Prednisolone. xPharm: The Comprehensive Pharmacology Reference, 2007; pp 1–6.
- Furman B. L.Methylprednisolone. Reference Module in Biomedical Sciences, 2019.
- Stanley R. G.Ocular Clinical pharmacology. Small Animal Clinical Pharmacology, 2nd ed., 2008; pp 557–573.
- He Y.; Yi W.; Suino-Powell K.; Zhou X. E.; Tolbert W. D.; Tang X.; Yang J.; Yang H.; Shi J.; Hou L.; Jiang H.; Melcher K.; Xu H. E. Structures and mechanism for the design of highly potent glucocorticoids. Cell Res. 2014, 24, 713–726. 10.1038/cr.2014.52. [DOI] [PMC free article] [PubMed] [Google Scholar]
- Schmit J. P.; Rousseau G. G. Structure-activity relationship for glucocorticoids-III. Structural and Conformational study of the rings and side-chain of steroids which bind to the glucocorticoid receptor. J. Steroid Biochem. 1978, 9, 909–920. 10.1016/0022-4731(78)90051-1. [DOI] [PubMed] [Google Scholar]
- Shahid A.; Noureen S.; Choudhary M. I.; Yousuf S.; Ahmed M. Crystal structure and electrostatic properties of prednisolone acetate studied using a transferred multipolar atom model. Acta Crystallogr. 2017, C73, 430–436. 10.1107/S2053229617006556. [DOI] [PubMed] [Google Scholar]
- Saito H.; Ando I.; Ramamoorthy A. Chemical shift tensor-the heart of NMR: Insight into biological aspects of proteins. Prog. Nucl. Magn. Reson. Spectrosc. 2010, 57, 181–228. 10.1016/j.pnmrs.2010.04.005. [DOI] [PMC free article] [PubMed] [Google Scholar]
- McConnell H. M. Theory of Nuclear Magnetic Shielding in Molecules: Long-Range Dipolar Shielding of protons. J. Chem. Phys. 1957, 27, 226. 10.1063/1.1743676. [DOI] [Google Scholar]
- Abraham R. J.; Mobli M.; Smith R. J. 1H chemical shifts in NMR: Carbonyl anisotropies and steric effect in aromatic aldehydes and ketones. Magn. Reson. Chem. 2003, 41, 26–36. 10.1002/mrc.1125. [DOI] [Google Scholar]
- Asakawa N.; Kameda T.; Kuroki S.; Kurosu H.; Ando S.; Ando I.; Shoji A. Structural Studies of Hydrogen-bonded Peptides and Polypeptides by Solid-state NMR. Annu. Rep. NMR Spectrosc. 1998, 35, 55–137. 10.1016/S0066-4103(08)60112-X. [DOI] [Google Scholar]
- Weinhold F. In The Encyclopedia of Computational Chemistry; Schleyer P. V. R., Allinger N. L., Clark T., Gasteiger J., Kollman P. A., Schaefer H. F. III, Schreiner P. R., Eds.; John Wiley & Sons: Chichester, U.K., 1998; pp 1792–1811. [Google Scholar]
- Wiberg K. B.; Murcko M. A.; Laidig K. E.; MacDougall P. J. Origin of the “Gauche Effect” in substituted ethanes and ethenes. J. Phys. Chem. 1990, 94, 6956–6959. 10.1021/j100381a008. [DOI] [Google Scholar]
- Sen S. Dynamics in Inorganic Glass-forming Liquids by NMR Spectroscopy. Prog. Nucl. Magn. Reson. Spectrosc. 2019, 116, 155–176. 10.1016/j.pnmrs.2019.11.001. [DOI] [PubMed] [Google Scholar]
- Veeman W. S. Carbon-13 Chemical shift anisotropy. Prog. Nucl. Magn. Reson. Spectrosc. 1984, 16, 193–235. 10.1016/0079-6565(84)80006-0. [DOI] [Google Scholar]
- Wylie B. J.; Rienstra C. M. Multidimensional solid state NMR of anisotropic interactions in peptides and proteins. J. Chem. Phys. 2008, 128, 052207 10.1063/1.2834735. [DOI] [PubMed] [Google Scholar]
- Chan J. C. C.; Tycko R. Recoupling of chemical shift anisotropies in solid state NMR under high speed magic angle spinning and in uniformly 13C labelled systems. J. Chem. Phys. 2003, 118, 8378–8389. 10.1063/1.1565109. [DOI] [Google Scholar]
- Bax A. D.; Szeverenyi N. M.; Maciel G. E. Correlation of isotropic shifts and chemical shift anisotropies by two-dimensional Fourier-transform magic angle hopping NMR spectroscopy. J. Magn. Reson. 1983, 52, 147–152. 10.1016/0022-2364(83)90267-6. [DOI] [Google Scholar]
- Bax A. D.; Szeverenyi N. M.; Maciel G. E. Chemical shift anisotropy in powdered solids studied by 2D FT NMR with flipping of the spinning axis. J. Magn. Reson. 1983, 55, 494–497. 10.1016/0022-2364(83)90134-8. [DOI] [Google Scholar]
- Tjandra N.; Szabo A.; Bax A. D. Protein backbone dynamics and 15B chemical shift anisotropy from quantitative measurement of relaxation interference effects. J. Am. Chem. Soc. 1996, 118, 6986–6991. 10.1021/ja960510m. [DOI] [Google Scholar]
- Liu S. F.; Mao J. D.; Schmidt-Rohr K. A robust technique for two-dimensional separation of undistorted chemical shift anisotropy powder patterns in magic angle spinning NMR. J. Magn. Reson. 2002, 155, 15–28. 10.1006/jmre.2002.2503. [DOI] [PubMed] [Google Scholar]
- Gan Z. High-resolution chemical shift and chemical shift anisotropy correlation in solids using slow magic angle spinning. J. Am. Chem. Soc. 1992, 114, 8307–8309. 10.1021/ja00047a062. [DOI] [Google Scholar]
- Tycko R.; Dabbagh G.; Mirau P. A. Determination of chemical shift anisotropy lineshapes in a two-dimensional magic angle spinning NMR experiment. J. Magn. Reson. 1989, 85, 265–274. 10.1016/0022-2364(89)90142-X. [DOI] [Google Scholar]
- Hou G.; Byeon I.-J. L.; Ahn J.; Gronenborn A. M.; Polenova T. Recoupling of chemical shift anisotropy by R-symmetry sequences in magic angle spinning NMR spectroscopy. J. Chem. Phys. 2012, 137, 134201–134210. 10.1063/1.4754149. [DOI] [PMC free article] [PubMed] [Google Scholar]
- Dixon W. T. Spinning-sideband-free and spinning-sideband-only NMR spectra in spinning samples. J. Chem. Phys. 1982, 77, 1800–1809. 10.1063/1.444076. [DOI] [Google Scholar]
- Antzutkin O. N.; Shekar S. C.; Levitt M. H. Two-dimensional sideband separation in magic angle spinning NMR. J. Magn. Reson. A 1995, 115, 7–19. 10.1006/jmra.1995.1142. [DOI] [Google Scholar]
- Ghosh M.; Sadhukhan S.; Dey K. K. Elucidating the internal structure and dynamics of α-chitin by 2DPASS-MAS-NMR and spin-lattice relaxation measurements. Solid State Nucl. Magn. Reson. 2019, 97, 7–16. 10.1016/j.ssnmr.2018.11.001. [DOI] [PubMed] [Google Scholar]
- Ghosh M.; Prajapati B. P.; Kango N.; Dey K. K. A comprehensive and comparative study of the internal structure and dynamics of natural β-keratin and regenerated β-keratin by solid state NMR spectroscopy. Solid State Nucl. Magn. Reson. 2019, 101, 1–11. 10.1016/j.ssnmr.2019.04.007. [DOI] [PubMed] [Google Scholar]
- Ghosh M.; Kango N.; Dey K. K. Investigation of the internal structure and dynamics of cellulose by 13C-NMR relaxometry and 2DPASS-MAS-NMR measurements. J. Biomol. NMR 2019, 73, 601–616. 10.1007/s10858-019-00272-2. [DOI] [PubMed] [Google Scholar]
- Dey K. K.; Ghosh M. Understanding the effect of an anionic side-chain on the nuclear spin dynamics of a polysaccharide. Cellulose 2022, 29, 1381–1392. 10.1007/s10570-021-04394-5. [DOI] [Google Scholar]
- Dey K. K.; Ghosh M. Understanding the effect of deacetylation on chitin by measuring chemical shift anisotropy tensor and spin lattice relaxation time. Chem. Phys. Lett. 2020, 738, 136782 10.1016/j.cplett.2019.136782. [DOI] [Google Scholar]
- Dey K. K.; Gayen S.; Ghosh M. Structure and dynamics of sodium alginate as elucidated by chemical shift anisotropy and site-specific spin–lattice relaxation time measurements. Eur. Biophys. J. 2021, 50, 963–977. 10.1007/s00249-021-01559-9. [DOI] [PubMed] [Google Scholar]
- Dey K. K.; Deshmukh M.; Ghosh M. A Description of the Local Structure and Dynamics of Ketoconazole Molecule by Solid-State NMR Measurements and DFT Calculations: Proposition for NMR Crystallography. ChemistrySelect 2021, 6, 10208–10220. 10.1002/slct.202102622. [DOI] [Google Scholar]
- Dey K. K.; Lodhi L.; Ghosh M. Study of the Variation of the Electronic Distribution and Motional Dynamics of Two Independent Molecules of an Asymmetric Unit of Atorvastatin Calcium by Solid-State NMR Measurements. ACS Omega 2021, 6, 22752–22764. 10.1021/acsomega.1c03095. [DOI] [PMC free article] [PubMed] [Google Scholar]
- Dey K. K.; Ghosh M. Study of the Structure and Dynamics at Various Parts of the Antibacterial Drug Molecule Cefpodoxime proxetil. Solid State Nucl. Magn. Reson. 2021, 115, 101752 10.1016/j.ssnmr.2021.101752. [DOI] [PubMed] [Google Scholar]
- Dey K. K.; Ghosh M. Investigation of the Structure and Dynamics of Antiviral Drug Adefovir Dipivoxil by Site-Specific Spin–Lattice Relaxation Time Measurements and Chemical Shift Anisotropy Tensor Measurements. ACS Omega 2020, 5, 29373. 10.1021/acsomega.0c04205. [DOI] [PMC free article] [PubMed] [Google Scholar]
- Dey K. K.; Ghosh M. Determination of Chemical Shift Anisotropy Tensor and Molecular Correlation Time of Proton Pump Inhibitor Omeprazole by Solid State NMR Measurements. New J. Chem. 2020, 44, 19393. 10.1039/D0NJ01827A. [DOI] [Google Scholar]
- Dey K. K.; Ghosh M. Determination of the Correlation between the Structure and Dynamics of Deflazacort by solid state NMR measurements. New J. Chem. 2020, 44, 18419. 10.1039/D0NJ03418E. [DOI] [Google Scholar]
- Dey K. K.; Ghosh M. Understanding the Structure and Dynamics of Anti-inflammatory Corticosteroid Dexamethasone by solid state NMR Spectroscopy. RSC Adv. 2020, 10, 37564. 10.1039/D0RA05474G. [DOI] [PMC free article] [PubMed] [Google Scholar]
- Dey K. K.; Gayen S.; Ghosh M. Understanding the correlation between structure and dynamics of clocortolone pivalate by solid state NMR measurement. RSC Adv. 2020, 10, 4310. 10.1039/C9RA09866F. [DOI] [PMC free article] [PubMed] [Google Scholar]
- Dey K. K.; Gayen S.; Ghosh M. An atomic resolution description of folic acid using solid state NMR measurements. RSC Adv. 2020, 10, 24973. 10.1039/D0RA03772A. [DOI] [PMC free article] [PubMed] [Google Scholar]
- Dey K. K.; Gayen S.; Ghosh M. Investigation of the Detailed Internal Structure and Dynamics of Itraconazole by Solid-State NMR Measurements. ACS Omega 2019, 4, 21627–21635. 10.1021/acsomega.9b03558. [DOI] [PMC free article] [PubMed] [Google Scholar]
- Bhowal R.; Balaraman A.; Ghosh M.; Dutta S.; Dey K. K.; Chopra D. Probing Atomistic Behavior to Unravel Dielectric Phenomena in Charge Transfer Cocrystals. J. Am. Chem. Soc. 2021, 143, 1024–1037. 10.1021/jacs.0c11459. [DOI] [PubMed] [Google Scholar]
- Torchia D. A. The measurement of proton-enhanced carbon-13 T1 values by method which suppresses artifacts. J. Magn. Reson. 1978, 30, 613–616. 10.1016/0022-2364(78)90288-3. [DOI] [Google Scholar]
- Levitt M. H.; Madhu P. K.; Hughes C. E. Cogwheel phase cycling. J. Magn. Reson. 2002, 155, 300–306. 10.1006/jmre.2002.2520. [DOI] [PubMed] [Google Scholar]
- Ivchenko N.; Hughes C. E.; Levitt M. H. Application of cogwheel phase cycling to sideband manipulation experiments in solid-state NMR. J. Magn. Reson. 2003, 164, 286–293. 10.1016/S1090-7807(03)00206-4. [DOI] [PubMed] [Google Scholar]
- Herzfeld J.; Berger A. E. Sideband intensities in NMR spectra of samples spinning at the magic angle. J. Chem. Phys. 1980, 73, 6021–6030. 10.1063/1.440136. [DOI] [Google Scholar]
- Kameda T.; Miyazawa M.; Ono H.; Yoshida M. Hydrogen Bonding Structure and Stability of α-chitin studied by 13C Solid-state NMR. Macromol. Biosci. 2005, 5, 103–106. 10.1002/mabi.200400142. [DOI] [PubMed] [Google Scholar]
- Nicholas M. P.; Eryilmaz E.; Ferrage F.; Cowburn D.; Ghose R. Nuclear spin relaxation in isotropic and anisotropic media. Prog. Nucl. Magn. Reson. Spectrosc. 2010, 57, 111–158. 10.1016/j.pnmrs.2010.04.003. [DOI] [PMC free article] [PubMed] [Google Scholar]
- Anet F. A. L.; O’Leary D. J. The shielding tensor Part II: Understanding its strange effect on relaxation. Concepts Magn. Reson. 1992, 4, 35–52. 10.1002/cmr.1820040103. [DOI] [Google Scholar]
- Orendt A. M.; Facelli J. C. Solid state effects on NMR chemical shifts. Annu. Rep. NMR Spectrosc. 2007, 62, 115–178. 10.1016/S0066-4103(07)62003-1. [DOI] [Google Scholar]
- Dais P.; Spyros A. 13C nuclear magnetic relaxation and local dynamics of synthetic polymers in dilute solution and in the bulk state. Prog. Nucl. Magn. Reson. Spectrosc. 1995, 27, 555–633. 10.1016/0079-6565(95)01014-9. [DOI] [Google Scholar]
- Suitchmezian V.; Jess I.; Nather C. Structural, thermodynamics, and kinetic aspects of the trimorphism of hydrocortisone. J. Pharm. Sci. 2008, 97, 4516–4527. 10.1002/jps.21334. [DOI] [PubMed] [Google Scholar]
- Suitchmezian V.; Jess I.; Sehnert J.; Seyfarth L.; Senker J.; Näther C. Structural, thermodynamic, and kinetic aspects of the polymorphism and pseudopolymorphism of prednisolone (11, 17α, 21-trihydroxy-1, 4-pregnadien-3, 20-dion). Cryst. Growth Des. 2008, 8, 98–107. 10.1021/cg700866f. [DOI] [Google Scholar]
- Shikii K.; Seki H.; Sakamoto S.; Sei Y.; Utsumi H.; Yamaguchi K. Intermolecular hydrogen bonding of steroid compounds: PFG NMR diffusion study, cold-spray ionization (CSI)-MS and X-Ray analysis. Chem. Pharm. Bull. 2005, 53, 792–795. 10.1248/cpb.53.792. [DOI] [PubMed] [Google Scholar]
- Spackman M. A.; Jayatilaka D. Hirshfeld surface analysis. Cryst. Eng. Comm. 2009, 11, 19–32. 10.1039/B818330A. [DOI] [Google Scholar]
- Lu X.; Huang C.; Li M.; Skomski D.; Xu W.; Yu L.; Byrn S. R.; Templeton A. C.; Su Y. Molecular Mechanism of Crystalline-to-Amorphous Conversion of Pharmaceutical Solids from 19F Magic Angle Spinning NMR. J. Phys. Chem. B 2020, 124, 5271–5283. 10.1021/acs.jpcb.0c02131. [DOI] [PubMed] [Google Scholar]
- Li M.; Xu W.; Su Y. Solid-state NMR spectroscopy in pharmaceutical sciences. TrAC, Trends Anal. Chem. 2021, 135, 116152-1–116152-20. 10.1016/j.trac.2020.116152. [DOI] [Google Scholar]
Associated Data
This section collects any data citations, data availability statements, or supplementary materials included in this article.