

Abstract

Diindolylmethane (DIM) is a key metabolite of indole-3-carbinol found in cruciferous vegetables such as broccoli, cauliflower, and cabbage. DIM has been known for its anti-cancerous activity through various mechanisms. Most cancer cells, including triple-negative breast cancer (TNBC), adapt distinct metabolic reprogramming for rapid growth and proliferation. Hence, targeting metabolic dysregulation may provide a favorable therapeutic condition for the treatment of TNBC. Earlier, we found that DIM increases the intracellular accumulation of Centchroman (CC), a potential anticancer agent, thereby enhancing the therapeutic potential of CC against breast cancer. However, the role of DIM in regulating TNBC cellular metabolism remains unknown. In the current study, we investigated the potential therapeutic interventions of DIM in TNBC and its metabolic reprogramming in enhancing the efficacy of CC. We found that DIM induced metabolic catastrophe in TNBC cells by regulating aerobic glycolysis and intermediate metabolism. Further, the DIM and CC combination significantly inhibited the TNBC tumor growth in the 4T1-syngeneic model. The inhibition of tumor growth was associated with the downregulation of key aerobic glycolysis mediators such as PKM2, GLUT1, and hypoxia-inducible factor 1α (HIF-1α). This is a first-of-a-kind investigation linking DIM with aerobic glycolysis regulation and enhancing the treatment efficacy of CC against TNBC. Therefore, these findings suggest that DIM-based nutraceuticals and functional foods can be developed as adjuvant therapy for treating metabolically dysregulated TNBC.
Introduction
Cancer cells adapt distinct metabolic phenotypes to ensure adequate nutrient consumption to sustain rapid growth and proliferation.1 Triple-negative breast cancer (TNBC) is a heterogeneous molecular breast cancer subtype with a high histological grade due to intrinsically aggressive clinical behavior and a relatively poorer prognosis.2 Nevertheless, TNBC patients get an advantage with standard chemotherapy; they still encounter early chemoresistance and a high relapse rate. Hence, a constant drive for suitable therapeutic strategies is indispensable to facilitate the clinical outcome of TNBC patients. TNBC cells possess distinct metabolic signatures from other breast cancer subtypes for aggressive growth and metastasis.3 Therefore, targeting metabolic dysregulation may provide a favorable therapeutic milieu for the treatment of TNBC.
Cancer cells exhibit higher glucose consumption than normal cells and utilize less for complete glucose oxidation but more for macromolecules and lactate synthesis, even under normoxic conditions. This classical phenomenon is called aerobic glycolysis or the Warburg effect.4,5 Increased aerobic glycolysis provides tumor growth advantages by efficiently converting glycolytic intermediate metabolites into the biosynthesis of amino acids, nucleotides, and lipids, which are required for early tumor growth and progression. Pyruvate kinase (PK) is an important enzyme involved in the final rate-limiting or irreversible step of glycolysis. Cancer cells predominantly express the pyruvate kinase M2 (PKM2) isoform but not PKM1, which has been reported to promote aerobic glycolysis.6 PKM2 is highly expressed in TNBC and crucial for maintaining glycolytic phenotype and tumor growth.6,7 In addition to its entrenched metabolic function, PKM2 acts as a transcriptional activator and directly regulates gene expression, which is essential for tumorigenesis.8,9
Glucose transporter 1 (GLUT1) is a vital glucose transporter upregulated in TNBC cells compared to non-TNBC cells or normal cells. Overexpression of GLUT1 promotes the glucose influx across the plasma membrane and aids in aerobic glycolysis.10 Therefore, PKM2 and GLUT1 are crucial for reprogramming energy metabolism in TNBC cells. The hypoxia-inducible factor 1 (HIF-1), a transcription factor, has been shown to regulate many tumor-promoting genes, including genes involved in aerobic glycolysis such as PKM2 and GLUT1. Further, elevated glycine and alanine levels were also attributed to the high rate of aerobic glycolysis11 and were involved in many anabolic pathways in cancer cells. Glycine is a critical amino acid derived from 3-phosphoglycerate, an intermediate metabolite of glycolysis. Glycine involves de novo purine metabolism by contributing two carbon and nitrogen atoms for inosine monophosphate synthesis. Alanine is another key amino acid produced during aerobic glycolysis. Alanine is derived from pyruvate and is involved in tumor cell growth and proliferation.11
Dietary bioactives are known to maintain cellular homeostasis by regulating their metabolism. Many natural bioactives have been shown to regulate cancer cell metabolism by regulating the expression of several key metabolic regulators.12−14 Diindolylmethane (DIM), a bioactive compound abundant in cruciferous vegetables, has been investigated as a potential anticancer compound for various cancers.15,16 Centchroman (CC) was designed and approved as a non-steroidal oral contraceptive drug for women. Besides contraception, CC has been known to have promising therapeutic potential against many cancers, including breast, ovarian, and prostate cancers.17,18 Earlier, we demonstrated that CC inhibits tumor growth, metastasis, and angiogenesis in breast cancer by regulating multiple mechanisms.19−21 Recently, we found that DIM enhances the therapeutic potential of CC by regulating drug efflux transporters in breast cancer cells.22 However, the role of DIM in regulating the TNBC cellular metabolism, a hallmark of cancer, remains unknown. Therefore, in the current study, we investigated the effect of DIM on metabolic dysregulation in enhancing the therapeutic efficacy of CC in TNBC using the preclinical models.
Results
DIM Regulates the Aerobic Glycolysis and Intermediate Metabolism in TNBC Cells
To assess the effect of DIM on metabolic rewiring, we performed a 1H NMR-based metabolomics analysis on aqueous metabolic extracts isolated from DIM-treated TNBC cells. The 1H NMR spectra obtained from polar metabolites of DIM-treated TNBC cells are shown in Figure 1A. The principal component analysis (PCA) indicates the relationship of 1H NMR metabolic profile features between control and DIM-treated TNBC cells. As shown in Figure 1B, the principal components PC1 and PC2 explained 79 and 7% variations in the spectra, respectively. Interestingly, clear segregation between control and DIM-treated cells was observed along PC1, highlighting distinct metabolic differences between control and DIM-treated groups. We also observed that at a 100 μM concentration of DIM, there was an accumulation of glucose and other carbohydrates. This might be due to the higher cytotoxicity at this dose of DIM.22
Figure 1.

DIM treatment alters global metabolic changes in the TNBC cells. (A) Representative 500 MHz 1H NMR spectrum acquired on the aqueous fraction of DIM-treated MDA-MB-231 cells. The vertical scales were retained the same in all the 1H NMR spectra. (B) 2D PCA score plot produced from PCA of NMR spectra of aqueous fraction metabolites showing separate groups for DIM-treated (different concentrations) and control samples. (C) Chemical structure of DIM.
The detected metabolites include the BCAA (branched-chain amino acids: leucine, isoleucine, and valine) region, lactate, alanine, acetate, N-acetyl groups, acetone, succinate, dimethylamine, dimethylglycine, glutamine, aspartate, creatine, phosphocreatine, choline, phosphocholine, glycine, trimethylamine oxide, taurine, nicotinamide adenine dinucleotide, and AXP (Figure 1A). Out of these, 10 metabolites for which at least one signal was not overlapping with other metabolites were integrated and represented in a heat map. Interestingly, the identified metabolites belong to the intermediate glycolysis metabolism and TCA cycle metabolites, such as succinate and glutamine, persistently decreased in DIM-treated cells compared to control cells (Figure 2A). Aerobic glycolysis, a hallmark of tumor cells, consumes more glucose and releases lactate. We found that DIM treatment did not alter the intracellular lactate levels in TNBC cells (Figures 2A and S1A). In contrast, DIM treatment significantly inhibited the glucose uptake and lactate releases from the TNBC cells similar to dichloroacetate (DCA), a known glycolysis inhibitor (Figure 2B–D). Therefore, DIM-treated TNBC cells exhibited a considerable reduction of aerobic glycolysis, as reflected by the decrease in glucose influx and lactate release rate.
Figure 2.
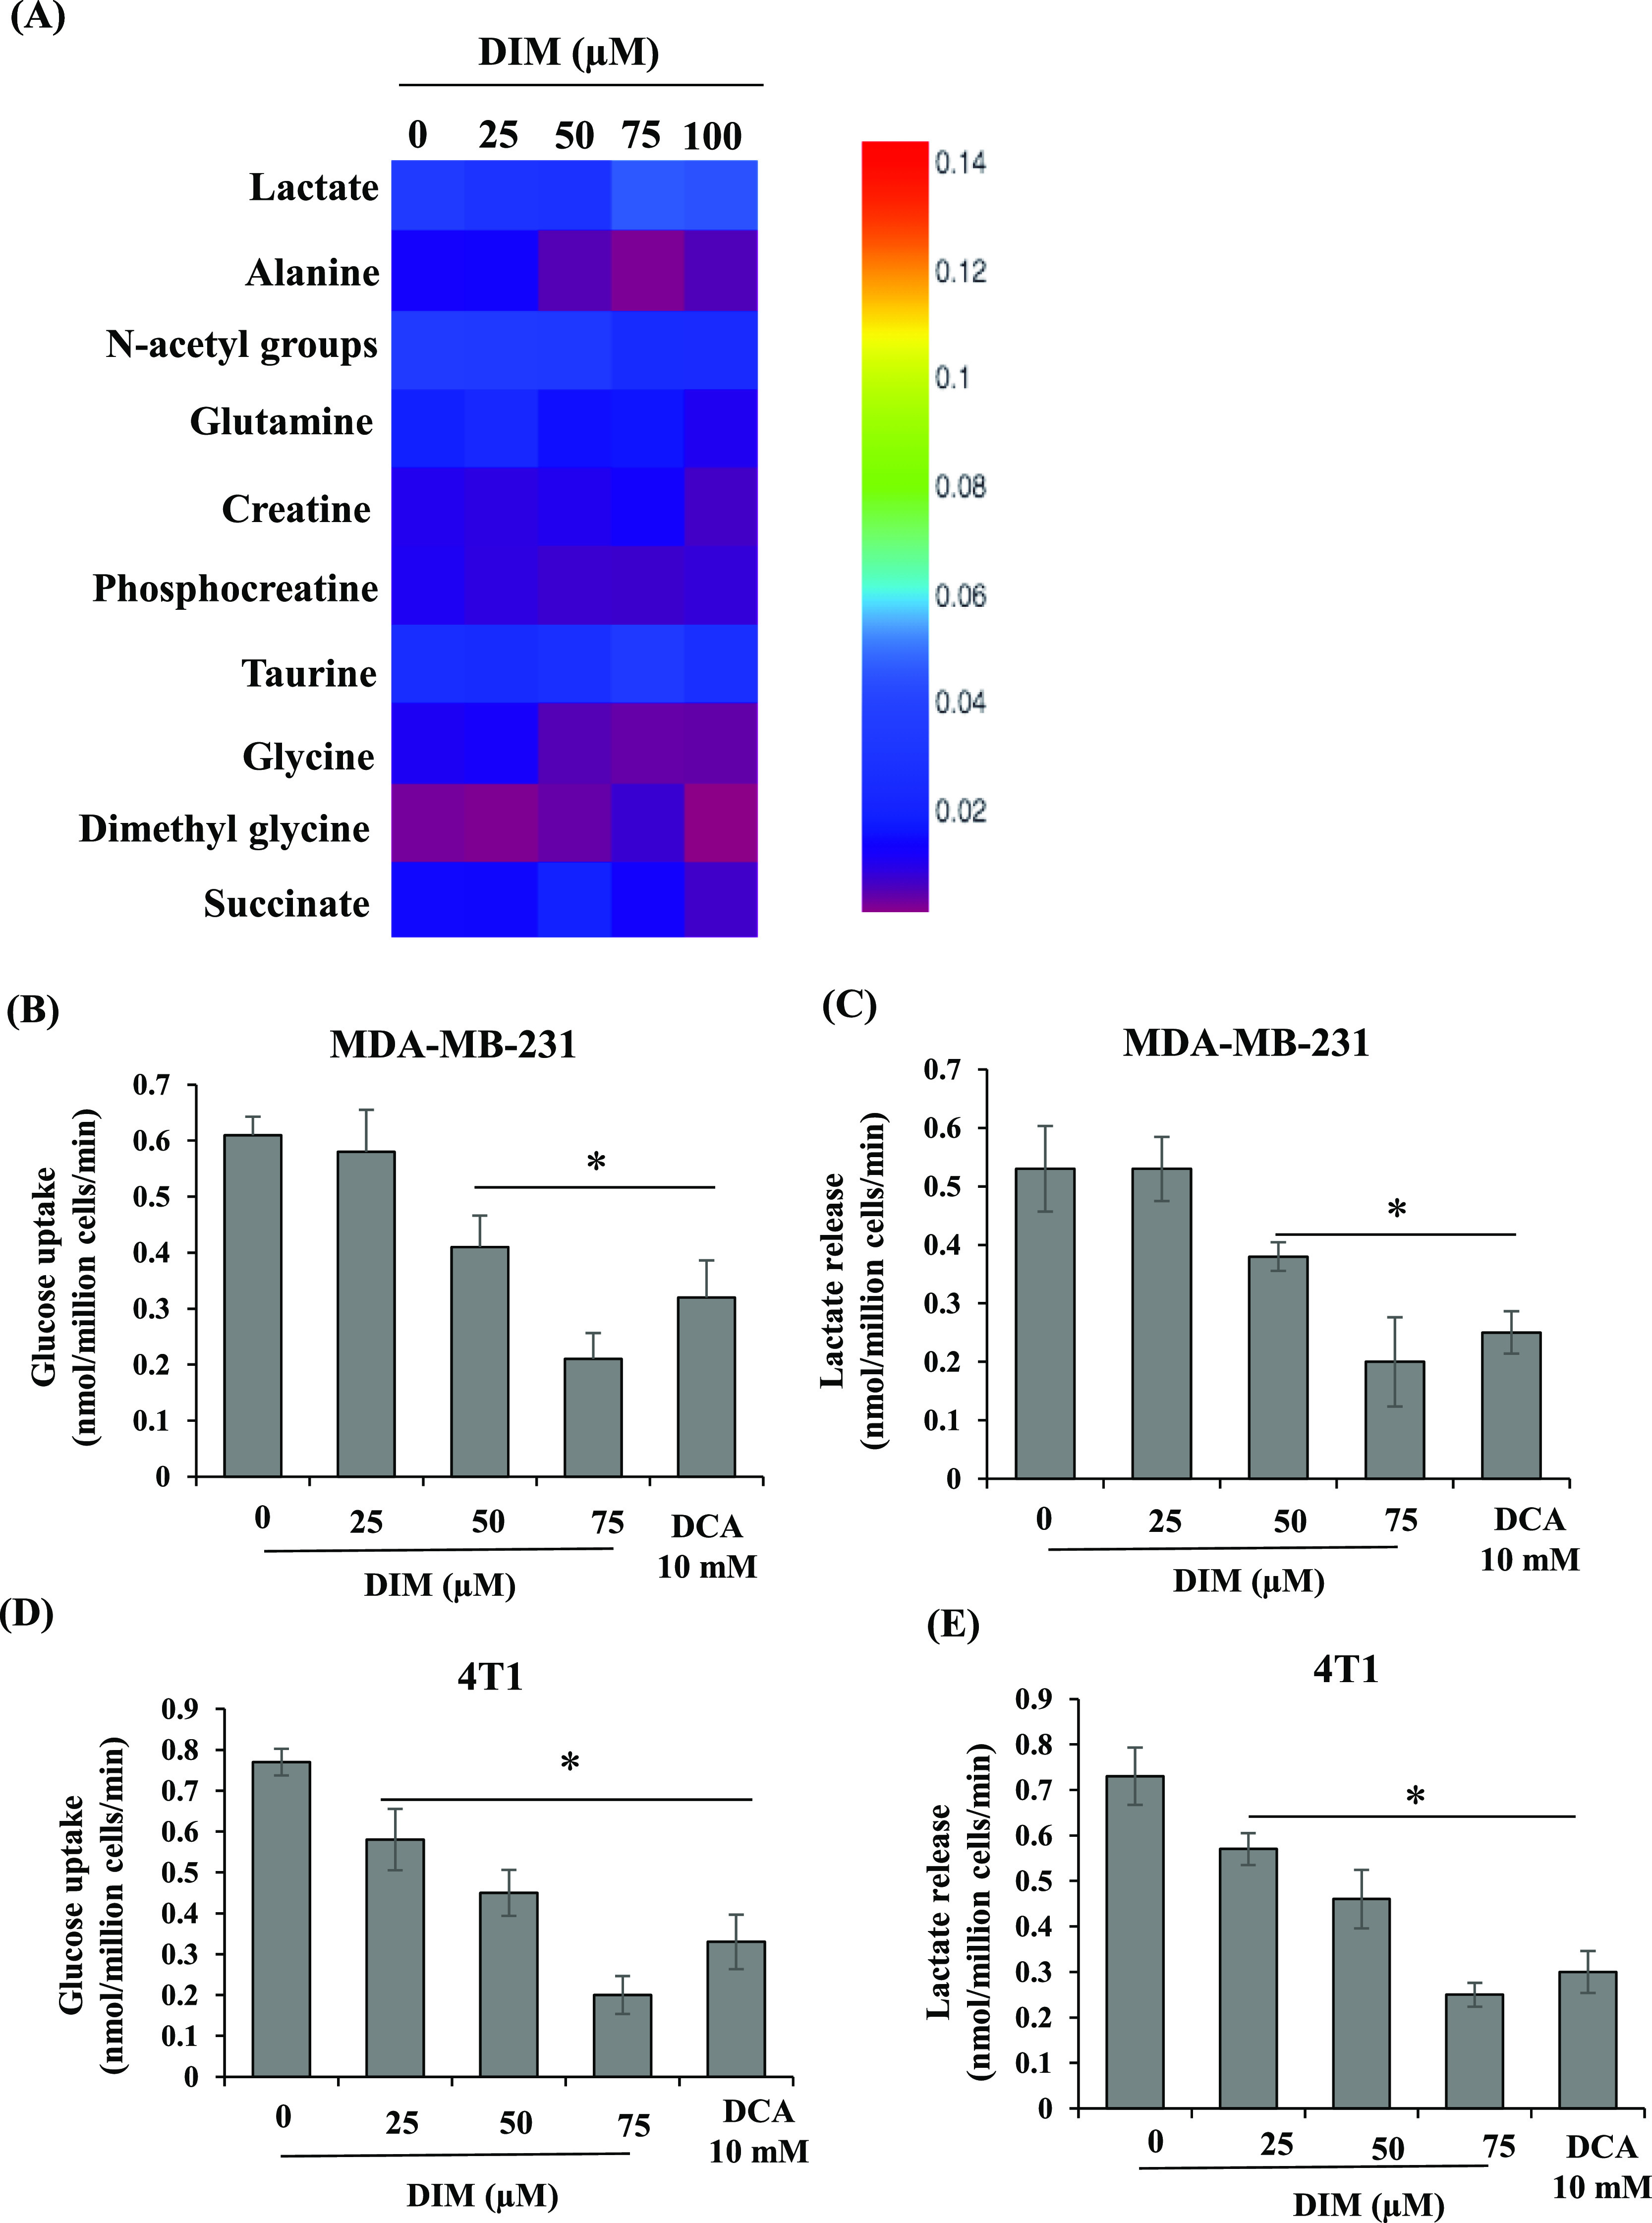
DIM treatment alters the aerobic glycolysis in TNBC cells. (A) Heat map representing the intensities of 10 quantified metabolites in area-normalized 1H NMR spectral data for control cells and cells treated with different concentrations of DIM. DIM treatment inhibits glucose uptake and lactate release from the TNBC cells. MDA-MB-231 (B,C) and 4T1 (D,E) cells were exposed to various doses of DIM for 24 h, spent media was collected, and the rate of glucose influx and lactate release was measured and represented as nmol/million cells/min. *P < 0.05, vs control.
Elevated glycine and alanine levels were attributed to the high rate of aerobic glycolysis.11 Interestingly, our results showed that DIM treatment significantly decreased glycine (Figures 2A and S1B) and alanine (Figures 2A and S1C) levels compared to the control. Together, our results indicate that DIM treatment significantly altered the aerobic glycolysis and intermediate metabolism, which are essential features of the TNBC subtype. Therefore, we have chosen mouse TNBC 4T1 cells for further in vivo studies.
DIM Inhibited Mammary Tumor Growth and Increased the Therapeutic Sensitivity of CC
Aerobic glycolysis primarily promotes tumor growth advantages. We sought to investigate whether oral administration of DIM can inhibit mammary tumor growth by regulating aerobic glycolysis in vivo. Many studies have shown that inhibition of aerobic glycolysis enhances the therapeutic efficacy of drugs. For example, lactate production inhibition by regulating LDH could sensitize immune checkpoint anti-PD-1 immunotherapy in TNBCs.23 Earlier, we found that DIM enhances the therapeutic efficacy of CC by regulating ABCB1/P-gp drug efflux transporters in TNBC cells.22 We have also analyzed and compared the effect of CC as well as cisplatin, a standard chemotherapeutic drug used to treat TNBC patients, on breast cancer cell proliferation at 48 h. As shown in Figure S4A,B, similar to cisplatin, CC at a 10 μM concentration significantly inhibited cell proliferation. The IC50 value of CC (10.80 ± 0.89 μM) was quite comparable to that of cisplatin (9.5 ± 0.91 μM) on 4T1 cells. Hence, in the current study, we assessed the combinatorial efficacy of DIM and CC on TNBC tumor growth. We have not observed any difference in diet and water intake by the mice among the individual experimental groups. Also, mice that received DIM and CC did not exhibit any physical indication of toxicity as we found no significant bodyweight decline in these mice (Figure 3C). Regular evaluation of the tumor volume revealed that the tumor growth was reduced significantly in 10 mg/kg b.w. DIM-treated mice compared to the control mice. Interestingly, the mice fed with both combinations of DIM and CC had significantly reduced tumor growth compared to individual-fed mice (Figure 3D,E). Further, the wet weight of the tumor was reduced in the DIM at 10 mg/kg b.w. administered mice than in untreated and CC-treated groups (Figure 3F). The mice in which CC alone was administered did not show significant regression in the tumor size compared to the control. In contrast, the pre-treated DIM at both 5 and 10 mg/kg b.w. doses and CC-treated mice showed a substantial reduction in tumor weight. These results collectively indicate that DIM administration inhibits tumor growth and enhances the therapeutic efficacy of CC against 4T1 TNBC tumors.
Figure 3.

DIM and CC inhibit in vivo tumor growth in the 4T1-syngeneic model. (A) Chemical structure of CC. (B) Schematic representation of the in vivo study design. (C) Mice body weight was measured every week, and the average body weight of each group was plotted against the treatment day, average body weight ± SEM. (D) At the end of treatment, animals from each group bearing tumors were photographed, and the average tumor volume of each group was plotted against treatment days, average tumor volume ± SEM. (E) At the termination of the experiment, mice bearing tumors from each group were photographed and shown. (F) At the end of the treatment, tumors were removed from animals, and wet weight was measured. The representative tumor images were organized according to treatment doses and captured. The results were illustrated as the average wet weight of the tumor for each group, mean ± SEM. *P < 0.05, vs control; aP < 0.05 vs corresponding DIM-dose; bP < 0.05 vs corresponding CC-dose.
DIM and CC Treatment Alters the Proliferation Markers in 4T1 Tumor Tissue
Unregulated cell proliferation is an essential feature of cancer, and, therefore, we evaluated the anti-proliferative effect of DIM and CC on in vivo breast tumors. Ki-67 and proliferating cell nuclear antigen (PCNA) are the key markers for cell proliferation. As shown in Figure 4A, PCNA and Ki-67 were significantly downregulated in DIM (10 mg/kg b.w.) and DIM and CC combined-treated mice tumors than those from the untreated mice tumors. Further, we performed immunohistochemistry to verify the significance of Ki-67 expression in tumor tissues. As shown in Figure 4B, Ki-67-positive cells were high as the staining intensity was more in control, followed by CC- and DIM-alone treatments. In contrast, Ki-67-positive cells were decreased in the combination of the DIM 10 mg/kg b.w. and CC 2.5 mg/kg b.w. treatment group, which might be the reason for reduced primary tumor growth.
Figure 4.

DIM and CC administration alters the expression of proliferation markers. (A) The protein was extracted from tumor samples and subjected to immunoblot analysis. The membranes were incubated with Ki-67 and PCNA. The Ki-67 and PCNA band intensities were shown after normalization with β-actin. Bars, mean ± SEM; *P < 0.05, vs control; aP < 0.05 vs corresponding DIM-dose; bP < 0.05 vs corresponding CC-dose. (B) Immunohistochemistry staining for Ki-67 in paraffin-embedded tumor sections. A representative image of each group was depicted. The average number of Ki-67-positive cells were represented in each of the above images, PC = positive cells. DIM and CC administration induce histopathological changes and apoptosis. (C) Hematoxylin and eosin staining images of tumor sections; yellow dotted circles specified the areas of necrosis.
DIM and CC Treatment Causes Histopathological Changes and Induces Apoptosis in 4T1 Primary Tumor
Figure 4C shows histopathological images of tumor tissue sections. Tumors from the control group showed pleomorphic cells characterized by large and hyperchromatic nuclei. The combination of DIM- and CC-treated tumors has shown areas of extensive tissue necrosis, as highlighted in the yellow circle. Caspase-3, an apoptotic marker, was analyzed in the tumor section by immunohistochemistry. The results indicated that DIM treatment showed marginal detection of cleaved caspase-3 staining; whereas, in the DIM and CC combination groups, the cleaved caspase-3 staining intensity was high compared to the control and the DIM and CC doses alone (Figure S4C). Overall, increased accumulation of cleaved caspase-3 in the cytoplasm supports in vivo induction of apoptosis by DIM and CC combination treatment.
PKM2 and GLUT1 Upregulated in Human Breast Tumors
PKM2 and GLUT1 are highly expressed in cancer cells and promote aerobic glycolysis. Hence, we analyzed the expression of PKM2 and GLUT1 in clinical samples of healthy and breast tumors using Breast Cancer Gene-Expression Miner v4.8 (bc-GenExMiner v4.8). We observed that breast tumors had higher expression of both PKM2 and GLUT1 than healthy breast tissues as well as tumor-adjacent sites (Figure 5A,B). Later, we compared the expression of PKM2 and GLUT1 in different breast cancer subtypes. Among other subtypes, basal-like breast cancer subtypes showed higher expression, followed by HER2, luminal B, and luminal A (Figure S2A). We also compared these two glycolytic gene expressions between TNBC and non-TNBC molecular subtypes. As shown in Figure S2B, the TNBC molecular subtype showed higher expression than that of non-TNBC. Further, we demonstrated the protein expression by immunohistochemical analysis of PKM2 and GLUT1 in clinical samples. The protein expression levels were substantially higher as the staining intensities were stronger in breast cancer tissue than in healthy breast tissue (Figure 5C,D). Also, we performed a co-expression correlation between PKM2, GLUT1, and HIF-1α genes. Interestingly, we observed a positive co-expression correlation between these genes in basal-like TNBC subtype patients. As shown in Figures 5E and S3A–C, a perfect positive correlation was observed in PKM2 with lactate solute carrier family 2 member 1 (SLC2A1) (GLUT1), followed by HIF-1α with PKM2 and SLC2A1 in the basal-like TNBC subtype. In contrast, in healthy breast tissue, we observed a weak positive or no correlation between these genes (Figures 5F and S3D–F).
Figure 5.

PKM2 and GLUT1 were upregulated in breast cancer patients. Box plots of PKM2 (A) and GLUT1 (B) mRNA expressions have been shown for healthy vs breast tumor tissue. Immunohistochemical protein expression of PKM2 (C) and SLC2A1 (D) in breast cancer and healthy breast tissue was retrieved from the Human Protein Atlas database. Co-expression correlation map of HIF-1α, PKM2, and SLC2A1 corresponding to analysis among the patients with basal-like TNBC subtypes (E) and healthy subjects (F) in bc-GenExMiner v4.0.
DIM and CC Modulate the Expression of Key Aerobic Glycolytic Modulators in 4T1 Tumors
To understand the effect of DIM and CC on aerobic glycolysis, we analyzed the expression levels of PKM2 and GLUT1 in tumor tissue. As shown in Figure 6A, DIM at 10 mg/kg b.w. or in a combination of DIM at 10 mg/kg b.w. with CC at 2.5 mg/kg b.w. treatment significantly downregulated the expression of PKM2. In contrast, GLUT1 expression was downregulated even in DIM at 10 mg/kg b.w. and CC at 2.5 mg/kg b.w. alone. However, the combination showed significant downregulation of GLUT1 compared to the control as well as DIM and CC alone (Figure 6A).
Figure 6.

DIM and CC alter the expression of key aerobic glycolysis regulators in 4T1 tumor tissue. (A) Fold change mRNA expression level of PKM2 and GLUT1. *P < 0.05, vs control; bP < 0.05 vs respective CC-dose. (B,C) Western blots of PKM2, GLUT1, HIF-1α, and p300 in tumor samples. The band intensities were quantified and normalized with the β-actin using ImageJ software. Bars, mean ± SEM; *P < 0.05, vs control; aP < 0.05 vs corresponding DIM-dose; bP < 0.05 vs corresponding CC-dose. Representative images show IHC analysis of PKM2 (D) and GLUT1 (E) levels in paraffin-embedded tumor sections.
Further, we analyzed the expression of these two metabolic regulatory proteins in the tumor samples by immunoblot analysis. As shown in Figure 6B, the expression of PKM2 was significantly downregulated in the DIM and CC combination compared to the control and the individual DIM and CC concentrations. Corresponding to the GLUT1 mRNA expression, GLUT1 protein expression was also significantly downregulated by DIM and CC alone as well as their combinatorial dose (Figure 6B). These results were further confirmed by the immunohistochemical staining of PKM2 and GLUT1 in the tumor tissue. As shown in Figure 6D, the PKM2-positive cells were low as the staining intensity was less in the DIM and CC combination treatment group. The GLUT1 immunostaining results were consistent with immunoblot analysis of GLUT1 expression (Figure 6E).
DIM and CC Combinations Downregulate HIF-1α in 4T1 Tumors
The HIF-1 transcription factor supports adaptation to hypoxia and promotes the growth of many cancers, including TNBC. The HIF-1 complex contains the oxygen-regulated HIF-1α subunit and stably expresses the HIF-1β subunit. These HIF-1α subunits contribute primary means of regulating HIF-1 complex activity. Activation of the HIF-1 complex occurs in most solid tumors and acts as a driving force in cancer progression by regulating many aspects of cancer cell events. The HIF-1 complex facilitates the induction of genes encoding proteins involved in aerobic glycolysis, including GLUT1, PKM2, LDHA, and PDK1.9 Therefore, to further understand the possible mechanism behind the downregulation of PKM2 and GLUT1 mediated by DIM and CC, we performed HIF-1α expression analysis in tumor samples. As shown in Figure 6C, DIM and CC treatment significantly downregulated the HIF-1α expression levels in tumor tissue. GLUT1 is one of the direct targets of HIF-1. CC has been known to inhibit HIF-1 in breast cancer cells.24 Hence, the CC-mediated inhibition of HIF-1 might influence the expression of GLUT1. This might be one of the reasons that CC alone mediated the inhibition of GLUT1 expression in the 4T1 tumors. Besides, DIM and CC treatment also downregulated the expression of p300, which acts as a coactivator of the HIF-1 complex and promotes HIF-1-dependent gene expressions. These results indicated that DIM and CC downregulated the expression of PKM2 and GLUT1, at least in part, through the downregulation of the HIF-1 complex in breast tumors.
Knockdown of PKM2 Inhibits the Aerobic Glycolysis and GLUT1 Expression
To further investigate the role of PKM2 on aerobic glycolysis and the expression of GLUT1, we transiently transfected PKM2 short-hairpin RNA (shRNA) in the TNBC cells. As shown in Figure 7A, transfection of PKM2 shRNA transiently inhibited PKM2 expression in TNBC cells. We found that the downregulations of PKM2 significantly inhibited glucose uptake and lactate release from the cells (Figure 7B,C).
Figure 7.

Knockdown of PKM2 regulates aerobic glycolysis and GLUT1 expression. (A) 4T1 cells were subjected to treatment with 20 μg of shPKM2. The effect of shPKM2 interference with the PKM2 expression was analyzed by western blots analysis. The band intensities were quantified and normalized with the β-actin using ImageJ software. *P < 0.05, vs control shRNA. 4T1 cells were transfected with shPKM2 and exposed with DIM (50 μM) for 48 h, spent media was collected, and the rate of glucose influx (B) and lactate release (C) was measured and represented as nmol/million cells/min. (D) Fold change mRNA expression level of GLUT1. *P < 0.05, vs control; aP < 0.05 vs respective shPKM2-transfected; bP < 0.05 vs respective DIM-dose.
Further, we also analyzed the role of PKM2 downregulation in the expression of GLUT1 in the TNBC cells. As shown in Figure 7D, we observed that the knockdown of PKM2 significantly downregulated the expression of GLUT1. These results indicate that PKM2 is a critical regulatory factor required for GLUT1 expression. Interestingly, the cells transfected with shPKM2 and treated with DIM showed a pronounced effect on the aerobic glycolysis and GLUT1 expression compared with shPKM2 transfected alone and DIM-only-treated cells.
Discussion
Most cancer cells reprogram energy metabolism to accomplish their ATP and anabolic demands. Among breast cancer cells, TNBC cells probably show the most comprehensive reprogramming of energy metabolism. Dysregulated cellular metabolism has been reported to correlate with clinical outcomes and responses to therapeutic agents. Therefore, many drugs are being tested to target cancer cell metabolism. In recent years, natural bioactives have attracted more recognition for their potential to regulate cancer cell metabolism by targeting crucial enzymes involved in cellular energy metabolism.12−14 DIM is an extensively studied natural anti-cancer compound. However, its role in the regulation of cancer metabolism remains poorly understood. Riby et al. demonstrate that DIM reduces HIF-1α in hypoxic tumor cell lines, thereby inhibiting the expression of HIF-1-responsive endogenous genes, including VEGF, furin, ENO2, GLUT1, and PFKP.25 However, these findings do not explore the role of DIM in aerobic glycolysis, especially when connected to PKM2 expression. In previous studies, CC has also been reported to inhibit HIF-1 in breast cancer cells.24 Recently, we found that DIM enhances the intracellular accumulation of CC by regulating drug efflux transporters, thereby increasing CC treatment efficacy against breast cancer cells. In the current study, we reported the role of DIM in regulating TNBC metabolism and enhancing the therapeutic efficacy of CC against TNBC tumor growth.
To determine the effect of DIM on the TNBC energy metabolism, we treated TNBC cells with different concentrations of DIM. We found a clear segregation of metabolic profiles in control and DIM-treated TNBC cells. These results indicated that DIM treatment alters the metabolic landscape of TNBC cells. Surprisingly, we observed that the intracellular lactate levels were not altered; instead, they slightly increased in DIM-treated groups than in the control ones. In contrast, the extracellular release of lactate in the culture media was significantly declined in DIM-treated TNBC cells. Overexpression of lactate transporters (SLC16A1/MCT1) is a typical feature of most cancer cells, including breast cancer cells. These lactate transporters help in the efflux of the excessive lactate produced during aerobic glycolysis. As a result, cancer cells escape intracellular milieu acidosis-mediated glycolysis inhibition and apoptosis. Inhibition of lactate transporter MCT1 or MCT4 in renal carcinoma, breast cancer, and pancreatic cancer has been associated with a significant tumor growth reduction.26
Glycine and alanine are nonessential amino acids mainly produced from glycolytic intermediate metabolites such as 3-phosphoglycerate and pyruvate, respectively. As shown in Figure S5A, the TNBC subtype upregulates the enzymes involved in the intermediate metabolism of serine and glycine metabolism. 1H NMR metabolomics showed that DIM treatment significantly decreased the accumulation of glycine and alanine amino acids. This might be due to the reduced availability of glycolytic intermediate metabolites for the biosynthesis of glycine and alanine. Together, metabolomics and metabolic assays revealed that DIM treatment showed an inhibitory effect on aerobic glycolysis.
Further, to evaluate the direct relation between glycolysis and cell proliferation, we analyzed the effect of 2-deoxy-D-glucose (2-DG), a standard glycolysis inhibitor, on TNBC cell proliferation. We found that the 2-DG treatment significantly inhibited TNBC cell proliferation (Figure S5B). These results show that targeting glycolysis could markedly decrease cell proliferation of TNBC cells. Based on these results, we hypothesized that the DIM concentration suppressing aerobic glycolysis would also inhibit TNBC cell proliferation. We found that DIM significantly inhibited TNBC cell proliferation (Figure S5C). These results indicate that DIM-mediated inhibition of cell proliferation was associated, at least partially, with regulating aerobic glycolysis.
To validate our in vitro observation, we developed a 4T1-syngeneic TNBC in vivo model. Low bioavailability remains a challenging factor with most dietary phytochemicals, including DIM. Various DIM formulations have been made to address this potential problem to increase bioavailability. Therefore, in the current study, we mixed DIM in corn oil to improve the bioavailability of DIM. Our results showed that oral administration of DIM suppressed tumor growth in these mice. Earlier, we have demonstrated that CC alone (5 and 10 mg/kg b.w.) inhibits tumor growth, metastasis, and angiogenesis in breast cancer by regulating multiple mechanisms.19,20 Therefore, here, we selected a low therapeutic dose of CC (2.5 mg/kg b.w.) to demonstrate the therapeutic efficacy when combined with metabolic regulation of DIM. Our results indicate that DIM at 10 mg/kg b.w. inhibits 4T1-breast tumor growth and also enhances the therapeutic efficacy of CC. In accordance, we also previously found that the combination of DIM and CC significantly inhibited 4T1 cell proliferation compared to the individual treatments.22
The inhibition of energy metabolism may hinder the proliferation of highly proliferative TNBC cells. We found that the DIM and CC combination reduced the tumor volume and size in 4T1 syngeneic TNBC tumors. The inhibition of tumor volume and size was accompanied by the inhibition of proliferative markers and induction of cellular apoptosis. The downregulation of PKM2 and GLUT1 expression in the DIM and CC treatment demonstrates aerobic glycolysis inhibition. Typically, increased lactate secretion by cancer cells suppresses the T and NK cell-mediated immunosurveillance and supports tumor growth.27 High-level lactate secretion creates acidosis in the tumor microenvironment (TME) and also promotes angiogenesis and metastasis. The combination of DIM- and CC-mediated inhibition of aerobic glycolysis may result in low lactate release into the TME, which might provide an advantage with immune function against tumor cells.
Succinate acts as an oncometabolite and is involved in several nonmetabolic functions, thereby regulating cancer development. Massive accumulation of succinate occurs in most cancer cells and inhibits HIF-1α prolyl hydroxylase (PDH) activity, thereby enhancing the stability of the HIF-1α in the cytosol. Activated HIF-1α translocates into the nucleus and induces transcriptional activation of aerobic glycolysis, angiogenesis, and metastasis genes. Our results showed that DIM and CC treatment downregulated the HIF-1α expression in tumor tissue. Metabolomics results showed that DIM treatment decreased the small metabolite succinate levels (Figures 1A and 2A). A low level of succinate likely leads to the activation of PDH and promotes ubiquitination and proteasomal degradation of HIF-1α in the cytosol. A large body of data demonstrated that in addition to its classical metabolic function, PKM2 also promotes the transactivation of the HIF-1 complex and reprograms energy metabolism in a positive feedback mechanism. Inhibition of PKM2 expression could significantly reduce the transcriptional activity of HIF-1. PKM2 interacts directly with HIF-1α and allows the recruitment of p300 to the hypoxia-responsive elements of HIF-1, including GLUT1, PDK1, and LDHA in cancer cells.9 In accordance, we observed that the knockdown of PKM2 also downregulates the expression of GLUT1 in the TNBC cells. In addition, we also observed that PKM2 knockdown decreases glucose uptake and lactate release in TNBC cells. Our results have established that the downregulation of PKM2 expression upon DIM treatment provides insights into the molecular basis of DIM action on the metabolic reprogramming of cancer cells.
Results of the current study, along with our previous investigation, suggest that DIM has a chemopreventive role and also enhances the therapeutic potential of chemotherapeutic drugs, making it a potent plant-based anti-cancer compound. We found that DIM enhances the therapeutic efficacy of CC by regulating drug efflux transporters as well as aerobic glycolysis. We observed that DIM enhancing the therapeutic efficacy of CC was predominant due to the regulation of drug efflux transporters because most chemotherapeutic agents, such as CC, are effectively pumped out by the drug efflux transporters. The inhibition of drug efflux transporters by DIM enhanced the intracellular accumulation of CC. The intracellular retaining of CC increased its efficacy against breast cancer. DIM treatment alone can cause substantial tumor growth regression because of its proven activities, such as anti-oxidation and induction of apoptosis. However, our results demonstrated the clinical correlations of the therapeutic enhancement of chemotherapy taken along with dietary metabolic regulators such as DIM. Cruciferous vegetables are the primary source of DIM in the human diet. On average, 100 g of raw cruciferous vegetables consists of around 30 mg of glucobrassicin, which is considered to convert up to 2 mg of DIM. To achieve a physiologically effective concentration of DIM, consuming 600 g/d of cruciferous vegetables is recommended.15 Intake of this quantity through diet is not a desirable approach; hence, the development of bioactive-enriched cruciferous vegetable products is warranted. DIM-based supplements have not been indicating any major side effects. The recommended tolerable dose of DIM is 200 mg. DIM at 300 mg has been reported to cause mild headache, nausea, and vomiting.28
Conclusions
Our study demonstrated that dietary bioactive DIM effectively reduces aerobic glycolysis in TNBC cells. Upregulation of these metabolic adaptations is a critical feature of the aggressive TNBC subtype associated with worse clinical characteristics. Notably, the preclinical efficacy of DIM, combined with CC toward TNBC tumors, is further justified as a potential therapeutic strategy in TNBC treatment. Our results pave the way for the dietary metabolic dysregulation of TNBC and its therapeutic implications with available drugs. Therefore, DIM can enhance the therapeutic potential of CC at a minimal dose with lesser side effects. Further elaborated clinical studies are required to strengthen the DIM and CC combinatorial effect on aggressive TNBC.
Materials and Methods
Cell Culture, Compounds, and Chemicals
TNBC MDA-MB-231 and 4T1 cells were obtained from American Type Culture Collection Manassas, VA. The cells were cultured in a complete growth medium described previously.19,29 The revived MDA-MB-231 and 4T1 cells were utilized within 15–17 and 12–15 passages, respectively. DIM was obtained from TCI Co. Ltd., Tokyo, Japan (CAS no. 1968-05-4, purity = 98.0%). CC was obtained as CC hydrochloride from Hindustan Latex Limited, Thiruvananthapuram, India (purity = 99.8%; IP grade). The chemical structures of DIM and CC are shown in Figures 1C and 3A, respectively. The cells and tissue samples were extracted for NMR experiments using HPLC-grade chloroform and methanol. Sodium salts to prepare the buffer were obtained from Merck Chemicals. Deuterated solvents such as deuterated water (D2O) to record NMR spectra were obtained from Sigma-Aldrich.
NMR Sample Preparation
Extraction of aqueous metabolites from the cells and tissue samples for NMR experiments was carried out as described earlier.30 MDA-MB-231 cells were cultured and treated with indicated concentrations of DIM for 24 h. After treatment, cells were scraped off from the flask, collected into a tube, and washed with cold 1×PBS to remove media traces. Further, 600 μL of chilled methanol was added to the cells and mixed using a roto-spin rotary mixer overnight at 4 °C. Later, 600 μL of distilled water and chloroform were added to the cell suspension and then vortexed for 30 s and centrifuged at 150×g for 5 min. The upper aqueous fraction was collected into a new tube and dried by a vacuum evaporator (Eppendorf, Hamburg, Germany). Before analysis, the extracts were reconstituted in 55 μL of PBS prepared in D2O (100 mM concentration) and 495 μL of D2O.
NMR Experiments
1H NMR spectra for the isolated samples were recorded using a Bruker AVANCE 500 MHz spectrometer using D2O as a solvent. 1D-NOESY experiment was recorded at 25 °C with water suppression.31 The 1H NMR data were processed using Topspin 2.1 software. 1H NMR data were multiplied with exponential function and zero-filled to 32 K data points before Fourier transformation. All the spectra were manually phased and corrected for their baseline. After that, we performed area normalization as performed earlier.30 The 1H chemical shift was referenced to the NMR chemical shift of the lactate CH3 signal at 1.33 ppm. For the assignment of the peaks of respective metabolites, chemical shift values, J-coupling values, line shape, and multiplicity information were taken into consideration along with the databases such as Human Metabolome Database and Biological Magnetic Resonance Bank. After recognition of the metabolites, the respective peaks were manually chosen and integrated. The relative intensities of distinct metabolites were calculated independently for control and DIM-treated cells using total area normalized spectra and represented as mean ± SEM.
Glucose Uptake and Lactate Release Estimation
Glucose uptake and extracellular lactate release estimation were performed as described previously.14 Briefly, MDA-MB-231 and 4T1 cells were exposed to indicated doses of DIM and DCA, a known glycolysis inhibitor, for 24 h. Spent media was collected, and cell debris was removed by centrifugation. According to the manufacturer’s instructions, the media was processed to estimate glucose uptake and lactate release using assay kits (Bio Vision, USA).
Cell Proliferation Assay
Cell proliferation assay was conducted as previously described by us.19,29 Briefly, cells were seeded using optimal density in a 96-well plate and allowed to adhere overnight. The following day, the cells were treated with corresponding doses of DIM, CC, 2-DG(SRL, India) and cisplatin (Sigma, St Louis, USA) for 48 h. At the end of the treatment, cell proliferation was assessed by MTT assay. The absorbance was measured at 570 nm using a Spark 10M multimode microplate reader (Tecan, Switzerland).
Animal Experiments
Animal experiments were approved and conducted in compliance with the Institutional Animal Ethics Committee (IAEC) of the Council of Scientific and Industrial Research (CSIR)-Central Food Technological Research Institute (CFTRI), Mysore (Approval number: CFT/IAEC/105/2017, dated: December 13, 2017). The 4T1-syngeneic orthotopic tumor was developed in female BALB/c mice as detailed previously.19,21 About 4–5-week-old mice were randomly divided into six groups containing nine mice per group. The study plan is shown in Figure 3B. DIM was administered orally 6 days per week 3 weeks before the injection of the 4T1 cells and continued until the experiment was completed. For the tumor development, approximately 7 × 10⁵ 4T1 cells were injected subcutaneously into the second right mammary fat pad of the BALB/c mice. The oral administration of CC (3 times per week) was started once the palpable tumor appeared.
The groups were as mentioned: group (1). Vehicle control; group (2). Mice administered with 5 mg/kg b.w DIM; group (3). Mice administered with 10 mg/kg b.w DIM; group (4). Mice were fed with 2.5 mg/kg b.w CC; group (5) mice administered with 5 mg/kg b.w DIM +2.5 mg/kg b.w CC; and group (6). Mice administered with 10 mg/kg b.w DIM +2.5 mg/kg b.w CC.
Tumor Parameters
The body weight of the mice was measured throughout the experiments. Tumor volumes were measured weekly using the formula: tumor volume (cm3) = (length × width2) × 0.523.19 At the end of the treatment, mice were sacrificed by CO2 asphyxiation to collect tumors and other vital organs. A portion of the tumor was fixed in 10% buffered formalin for histopathology and immunohistochemical analysis. A small portion of tumor tissues was snap-frozen in liquid nitrogen for protein and RNA extraction.
Histopathology
Histopathological analysis was performed as described earlier.19,20 Briefly, formalin-fixed tumors were subjected to histopathological analysis. For pathology assessment, sections (5 μm) were stained with Harris-hematoxylin and eosin.
Immunohistochemistry
Immunohistochemical analysis was performed as described earlier.21 Briefly, paraffin-embedded tumor tissue sections were dewaxed and dehydrated with xylene and gradient alcohol, respectively. The sections were washed with PBS and dH2O and allowed to retrieve antigens using citrate buffer (10 mM sodium citrate, 0.1% Tween 20, pH 6.0). Subsequently, the sections were exposed to 0.3% H2O2 for 20 min, followed by blocking with serum for 30 min. Then, the sections were probed with Ki-67 (Cat#AB9260; Millipore), PKM2 (Cat# PAA588Hu02; Cloud-clone Corp), GLUT1 (Cat#ab115730; Abcam), and cleaved caspase-3 (Cat#9664; CST) primary antibodies overnight at 4 °C in a humidified chamber. Next, the sections were incubated with secondary antibodies (HRP-conjugated) for 1 h at RT. The sections were exposed with DAB (Sigma) for 5–10 min and counterstained with hematoxylin for 2 s. The sections were DPX-mounted, and images were captured under a microscope (Olympus, Tokyo, Japan).
Quantitative Real-Time Polymerase Chain Reaction
Quantitative real-time polymerase chain reaction (qRT-PCR) was conducted as described.29,32 Total RNA was extracted from tumor tissue samples using the TRIzol reagent (Sigma). Reverse transcription was performed using high capacity cDNA synthesis kit as per the manufacturer’s instructions (Applied Biosystems, Foster City, CA, USA). Then, cDNA was subjected to qRT-PCR using SYBR Green RT-PCR (Bio-Rad). The gene-specific primers were used as follows: PKM2; forward 5′-GCCTGCTGTGTCGGAGAAG-3′, reverse 5′-CAGATGCCTTGCGGATGAATG-3′. GLUT1; forward 5′-CGGGCCAAGAGTGTGCTAAA-3′, reverse 5′-TGACGATACCGGAGCCAATG-3′. GAPDH; forward 5′-TGCACCACCAACTGCTTAG-3′, reverse 5′-GGATGCAGGGATGATGTTC-3′. The expression of GAPDH was used as an internal control.
Western Blotting
Immunoblotting was conducted as reported earlier.19,29 Tumor tissues were lysed with RIPA-lysis buffer containing a protease inhibitor cocktail (Millipore, Billerica, MA). Equal amounts of protein samples were electrophoresed by SDS-PAGE and transferred to the poly(vinylidene difluoride) membrane. After blocking with 5% blocking buffer for 1 h, the membranes were probed with primary antibodies overnight at 4 °C. Then, the membranes were washed and treated with HRP-conjugated anti-rabbit and anti-mouse secondary antibodies for 1 h. Finally, the proteins were visualized by a chemiluminescent procedure using an ECL detection kit (Bio-Rad). The antibodies used are as follows: Ki-67 (Millipore), PCNA (Santa Cruz Biotechnology), PKM2 (Cloud-Clone Corp), GLUT1 (Abcam), HIF-1α (Cloud-Clone Corp), p300 (CST), and β-actin (Sigma).
shRNA Knockdown of PKM2
Approximately 2.5 × 10⁵ cells were seeded in a 60 mm dish and allowed to adhere overnight in the CO2 incubator. A 20 μg of PKM2 shRNA (5′-GGAAAGAACATCAAGATTA-3′) was transfected to the cells using Lipofectamine 2000 (Invitrogen) as per the instructions. After 48 h of post-transfection, cells were harvested and checked for knockdown efficiency using immunoblot analysis. ShPKM2-transfected and DIM-treated cells were used to extract RNA for qRT-PCR analysis of key aerobic glycolysis regulator GLUT1. RNA extraction and qRT-PCR procedures are explained in the previous section.
Breast Cancer Gene-Expression Miner v4.4
The RNA-seq data of important metabolic enzymes altered in breast cancer patient were analyzed using a gene expression data set of TCGA (n = 1034) cohorts in Breast Cancer Gene-Expression Miner v4.4 (http://bcgenex.ico.unicancer.fr) as described previously.33,34 We analyzed the expressions of PKM2, SLC2A1, phosphoglycerate dehydrogenase, phosphoserine aminotransferase 1, and phosphoserine phosphatase with normal versus tumor samples, different clinical breast cancer subtypes. In addition, we analyzed the pairwise co-expression correlation of HIF-1α, PKM2, and SLC2A1 genes using Breast Cancer Gene-Expression Miner v4.4.
Human Protein Atlas
The protein expression of PKM2 and GLUT1 in healthy and breast cancer tissue was demonstrated by immunohistochemistry staining using the Human Protein Atlas database (http://www.proteinatlas.org).
Statistical Analysis
Statistical significance was analyzed between the control versus treated groups using one-way ANOVA with Dunnett’s posthoc test. One-way ANOVA with Tukey’s posthoc test determined the statistical significance of the difference between control and different treatment groups using GraphPad Prism version 3.00. P < 0.05 was considered statistically significant. For performing the PCA, the spectral regions were converted to ASCII-files and the regions below 0.5 ppm to spectral regions of residual H2O (4.45–5.9 ppm) and residual CH3OH region (3.345–3.371 ppm), and regions higher than 9.5 ppm were separated. Spectral regions were normalized by the sum of all intensities over the entire sub-spectrum. PCA was performed with mean-centered scaling and full cross-validation (The Unscrambler V10.1, CAMO, Oslo, Norway). The results were presented as a two-dimensional (2D) PC scores plot where each point represents a separate sample.
Acknowledgments
Funds supported this work from the CSIR-FIRST grant (MLP-0299) (S.M.M.). D.J. and P.M. acknowledge SRF from UGC, Govt. of India, D.R. acknowledges SRF from CSIR, Govt. of India, J.N. acknowledges DBT, Govt. of India, and P.T. acknowledges women scientist fellowship from DST, Govt. of India.
Supporting Information Available
The Supporting Information is available free of charge at https://pubs.acs.org/doi/10.1021/acsomega.2c05832.
Effect of DIM treatment on glycolysis metabolism in TNBC subtype cells; DIM treatment alters the aerobic glycolysis in TNBC subtype cells; Pearson’s correlation between HIF-1α, PKM2, and GLUT1 in basal-like TNBC subtype and normal breast tissue; cisplatin and CC effect on TNBC cell proliferation; and serine and glycine intermediate metabolic genes expression in basal-like TNBC subtypes and effect of DIM treatment on cell proliferation in TNBC cells (PDF)
The authors declare no competing financial interest.
Notes
All experimental protocols were conducted according to the guidelines for the maintenance and use of laboratory animals from the CSIR-CFTRI, Mysore, and with the approval of the IAEC at CFTRI Mysore (Ref. CFT/IAEC/105/2017), India.
Supplementary Material
References
- Vander Heiden M. G. V.; Cantley L. C.; Thompson C. B. Understanding the Warburg Effect: The Metabolic Requirements of Cell Proliferation. Science 2009, 324, 1029. 10.1126/science.1160809. [DOI] [PMC free article] [PubMed] [Google Scholar]
- Denkert C.; Liedtke C.; Tutt A.; von Minckwitz G. Molecular alterations in triple-negative breast cancer-the road to new treatment strategies. Lancet 2017, 389, 2430–2442. 10.1016/s0140-6736(16)32454-0. [DOI] [PubMed] [Google Scholar]
- Lanning N. J.; Castle J. P.; Singh S. J.; Leon A. N.; Tovar E. A.; Sanghera A.; MacKeigan J. P.; Filipp F. V.; Graveel C. R. Metabolic Profiling of Triple-Negative Breast Cancer Cells Reveals Metabolic Vulnerabilities. Cancer Metabol. 2017, 5, 1–14. 10.1186/s40170-017-0168-x. [DOI] [PMC free article] [PubMed] [Google Scholar]
- Christofk H. R.; Vander Heiden M. G.; Wu N.; Asara J. M.; Cantley L. C. Pyruvate Kinase M2 Is a Phosphotyrosine-Binding Protein. Nature 2008, 452, 181–186. 10.1038/nature06667. [DOI] [PubMed] [Google Scholar]
- Warburg O. On the Origin of Cancer Cells. Science 1956, 123, 309–314. 10.1126/science.123.3191.309. [DOI] [PubMed] [Google Scholar]
- Christofk H. R.; Vander Heiden M. G.; Harris M. H.; Ramanathan A.; Gerszten R. E.; Wei R.; Fleming M. D.; Schreiber S. L.; Cantley L. C. The M2 Splice Isoform of Pyruvate Kinase Is Important for Cancer Metabolism and Tumour Growth. Nature 2008, 452, 230–233. 10.1038/nature06734. [DOI] [PubMed] [Google Scholar]
- Ma C.; Zu X.; Liu K.; Bode A. M.; Dong Z.; Liu Z.; Kim D. J. Knockdown of Pyruvate Kinase M Inhibits Cell Growth and Migration by Reducing NF-kB Activity in Triple-Negative Breast Cancer Cells. Mol. Cells 2019, 42, 628. 10.14348/molcells.2019.0038. [DOI] [PMC free article] [PubMed] [Google Scholar]
- Yang W.; Xia Y.; Ji H.; Zheng Y.; Liang J.; Huang W.; Gao X.; Aldape K.; Lu Z. Nuclear PKM2 regulates β-catenin transactivation upon EGFR activation. Nature 2011, 480, 118–122. 10.1038/nature10598. [DOI] [PMC free article] [PubMed] [Google Scholar]
- Luo W.; Hu H.; Chang R.; Zhong J.; Knabel M.; O’Meally R.; Cole R. N.; Pandey A.; Semenza G. L. Pyruvate Kinase M2 Is a PHD3-Stimulated Coactivator for Hypoxia-Inducible Factor 1. Cell 2011, 145, 732–744. 10.1016/j.cell.2011.03.054. [DOI] [PMC free article] [PubMed] [Google Scholar]
- Adekola K.; Rosen S. T.; Shanmugam M. Glucose Transporters in Cancer Metabolism. Curr. Opin. Oncol. 2012, 24, 650. 10.1097/cco.0b013e328356da72. [DOI] [PMC free article] [PubMed] [Google Scholar]
- Somashekar B. S.; Kamarajan P.; Danciu T.; Kapila Y. L.; Chinnaiyan A. M.; Rajendiran T. M.; Ramamoorthy A. Magic Angle Spinning NMR-Based Metabolic Profiling of Head and Neck Squamous Cell Carcinoma Tissues. J. Proteome Res. 2011, 10, 5232–5241. 10.1021/pr200800w. [DOI] [PMC free article] [PubMed] [Google Scholar]
- Gao J.-L.; Chen Y.-G. Natural Compounds Regulate Glycolysis in Hypoxic Tumor Microenvironment. BioMed Res. Int. 2015, 2015, 354143. 10.1155/2015/354143. [DOI] [PMC free article] [PubMed] [Google Scholar]
- Iqbal M. A.; Chattopadhyay S.; Siddiqui F. A.; Ur Rehman A.; Siddiqui S.; Prakasam G.; Khan A.; Sultana S.; Bamezai R. N. K. Silibinin induces metabolic crisis in triple-negative breast cancer cells by modulating EGFR-MYC-TXNIP axis: potential therapeutic implications. FEBS J. 2021, 288, 471–485. 10.1111/febs.15353. [DOI] [PubMed] [Google Scholar]
- Siddiqui F. A.; Prakasam G.; Chattopadhyay S.; Rehman A. U.; Padder R. A.; Ansari M. A.; Irshad R.; Mangalhara K.; Bamezai R. N. K.; Husain M.; Ali S. M.; Iqbal M. A. Curcumin decreases Warburg effect in cancer cells by down-regulating pyruvate kinase M2 via mTOR-HIF1α inhibition. Sci. Rep. 2018, 8, 8323–9. 10.1038/s41598-018-25524-3. [DOI] [PMC free article] [PubMed] [Google Scholar]
- Thomson C. A.; Ho E.; Strom M. B. Chemopreventive properties of 3,3′-diindolylmethane in breast cancer: evidence from experimental and human studies. Nutr. Rev. 2016, 74, 432–443. 10.1093/nutrit/nuw010. [DOI] [PMC free article] [PubMed] [Google Scholar]
- Lanza-Jacoby S.; Cheng G. 3,3′-Diindolylmethane enhances apoptosis in docetaxel-treated breast cancer cells by generation of reactive oxygen species. Pharm. Biol. 2018, 56, 407–414. 10.1080/13880209.2018.1495747. [DOI] [PMC free article] [PubMed] [Google Scholar]
- Misra N. C.; Nigam P. K.; Gupta R.; Agarwal A. K.; Kamboj V. P. Centchroman-a non-steroidal anti-cancer agent for advanced breast cancer: Phase-II study. Int. J. Cancer 1989, 43, 781–783. 10.1002/ijc.2910430506. [DOI] [PubMed] [Google Scholar]
- Gara R.; Sundram V.; Chauhan S.; Jaggi M. Anti-Cancer Potential of a Novel SERM Ormeloxifene. Curr. Med. Chem. 2013, 20, 4177–4184. 10.2174/09298673113209990197. [DOI] [PMC free article] [PubMed] [Google Scholar]
- Khan S.; Shukla S.; Sinha S.; Lakra A. D.; Bora H. K.; Meeran S. M. Centchroman Suppresses Breast Cancer Metastasis by Reversing Epithelial-Mesenchymal Transition via Downregulation of HER2/ERK1/2/MMP-9 Signaling. Int. J. Biochem. Cell Biol. 2015, 58, 1–16. 10.1016/j.biocel.2014.10.028. [DOI] [PubMed] [Google Scholar]
- Khan S.; Shukla S.; Sinha S.; Meeran S. M. Centchroman Altered the Expressions of Tumor-Related Genes through Active Chromatin Modifications in Mammary Cancer. Mol. Carcinog. 2016, 55, 1747–1760. 10.1002/mc.22424. [DOI] [PubMed] [Google Scholar]
- Khan S.; Shukla S.; Farhan M.; Sinha S.; Lakra A. D.; Penta D.; Kannan A.; Meeran S. M. Centchroman prevents metastatic colonization of breast cancer cells and disrupts angiogenesis via inhibition of RAC1/PAK1/β-catenin signaling axis. Life Sci. 2020, 256, 117976. 10.1016/j.lfs.2020.117976. [DOI] [PubMed] [Google Scholar]
- Penta D.; Mondal P.; Natesh J.; Meeran S. M. Dietary Bioactive Diindolylmethane Enhances the Therapeutic Efficacy of Centchroman in Breast Cancer Cells by Regulating ABCB1/P-Gp Efflux Transporter. J. Nutr. Biochem. 2021, 94, 108749. 10.1016/j.jnutbio.2021.108749. [DOI] [PubMed] [Google Scholar]
- Gong Y.; Ji P.; Yang Y.-S.; Xie S.; Yu T.-J.; Xiao Y.; Jin M.-L.; Ma D.; Guo L.-W.; Pei Y.-C.; Chai W.-J.; Li D.-Q.; Bai F.; Bertucci F.; Hu X.; Jiang Y.-Z.; Shao Z.-M. Metabolic-Pathway-Based Subtyping of Triple-Negative Breast Cancer Reveals Potential Therapeutic Targets. Cell Metab. 2021, 33, 51–64. 10.1016/j.cmet.2020.10.012. [DOI] [PubMed] [Google Scholar]
- Dewangan J.; Kaushik S.; Rath S. K.; Balapure A. K. Centchroman regulates breast cancer angiogenesis via inhibition of HIF-1α/VEGFR2 signalling axis. Life Sci. 2018, 193, 9–19. 10.1016/j.lfs.2017.11.045. [DOI] [PubMed] [Google Scholar]
- Riby J. E.; Firestone G. L.; Bjeldanes L. F. 3,3′-Diindolylmethane reduces levels of HIF-1α and HIF-1 activity in hypoxic cultured human cancer cells. Biochem. Pharmacol. 2008, 75, 1858–1867. 10.1016/j.bcp.2008.01.017. [DOI] [PMC free article] [PubMed] [Google Scholar]
- de la Cruz-López K. G.; Castro-Muñoz L. J.; Reyes-Hernández D. O.; García-Carrancá A.; Manzo-Merino J. Lactate in the Regulation of Tumor Microenvironment and Therapeutic Approaches. Front. Oncol. 2019, 9, 1143. 10.3389/fonc.2019.01143. [DOI] [PMC free article] [PubMed] [Google Scholar]
- Brand A.; Singer K.; Koehl G. E.; Kolitzus M.; Schoenhammer G.; Thiel A.; Matos C.; Bruss C.; Klobuch S.; Peter K.; Kastenberger M.; Bogdan C.; Schleicher U.; Mackensen A.; Ullrich E.; Fichtner-Feigl S.; Kesselring R.; Mack M.; Ritter U.; Schmid M.; Blank C.; Dettmer K.; Oefner P. J.; Hoffmann P.; Walenta S.; Geissler E. K.; Pouyssegur J.; Villunger A.; Steven A.; Seliger B.; Schreml S.; Haferkamp S.; Kohl E.; Karrer S.; Berneburg M.; Herr W.; Mueller-Klieser W.; Renner K.; Kreutz M. LDHA-Associated Lactic Acid Production Blunts Tumor Immunosurveillance by T and NK Cells. Cell Metab. 2016, 24, 657–671. 10.1016/j.cmet.2016.08.011. [DOI] [PubMed] [Google Scholar]
- Reed G. A.; Sunega J. M.; Sullivan D. K.; Gray J. C.; Mayo M. S.; Crowell J. A.; Hurwitz A. Single-Dose Pharmacokinetics and Tolerability of Absorption-Enhanced 3,3′-Diindolylmethane in Healthy Subjects. Cancer Epidemiol. Biomarkers Prev. 2008, 17, 2619–2624. 10.1158/1055-9965.EPI-08-0520. [DOI] [PMC free article] [PubMed] [Google Scholar]
- Meeran S. M.; Patel S. N.; Li Y.; Shukla S.; Tollefsbol T. O. Bioactive Dietary Supplements Reactivate ER Expression in ER-Negative Breast Cancer Cells by Active Chromatin Modifications. PLoS One 2012, 7, e37748 10.1371/journal.pone.0037748. [DOI] [PMC free article] [PubMed] [Google Scholar]
- Tripathi P.; Kamarajan P.; Somashekar B. S.; MacKinnon N.; Chinnaiyan A. M.; Kapila Y. L.; Rajendiran T. M.; Ramamoorthy A. Delineating Metabolic Signatures of Head and Neck Squamous Cell Carcinoma: Phospholipase A2, a Potential Therapeutic Target. Int. J. Biochem. Cell Biol. 2012, 44, 1852–1861. 10.1016/j.biocel.2012.06.025. [DOI] [PMC free article] [PubMed] [Google Scholar]
- Mckay R. T. How the 1D-NOESY suppresses solvent signal in metabonomics NMR spectroscopy: An examination of the pulse sequence components and evolution. Concepts Magn. Reson., Part A 2011, 38A, 197–220. 10.1002/cmr.a.20223. [DOI] [Google Scholar]
- Meeran S. M.; Patel S. N.; Tollefsbol T. O. Sulforaphane Causes Epigenetic Repression of HTERT Expression in Human Breast Cancer Cell Lines. PLoS One 2010, 5, e11457 10.1371/journal.pone.0011457. [DOI] [PMC free article] [PubMed] [Google Scholar]
- Jézéquel P.; Campone M.; Gouraud W.; Guérin-Charbonnel C.; Leux C.; Ricolleau G.; Campion L. Bc-GenExMiner: An Easy-to-Use Online Platform for Gene Prognostic Analyses in Breast Cancer. Breast Cancer Res. Treat. 2012, 131, 765–775. 10.1007/s10549-011-1457-7. [DOI] [PubMed] [Google Scholar]
- Jézéquel P.; Frénel J.-S.; Campion L.; Guérin-Charbonnel C.; Gouraud W.; Ricolleau G.; Campone M. Bc-GenExMiner 3.0: New Mining Module Computes Breast Cancer Gene Expression Correlation Analyses. Database 2013, 2013, 1. 10.1093/database/bas060. [DOI] [PMC free article] [PubMed] [Google Scholar]
Associated Data
This section collects any data citations, data availability statements, or supplementary materials included in this article.