Abstract
Technology that translates neural activity into speech would be transformative for people unable to communicate as a result of neurological impairment. Decoding speech from neural activity is challenging because speaking requires such precise and rapid multi-dimensional control of vocal tract articulators. Here, we designed a neural decoder that explicitly leverages kinematic and sound representations encoded in human cortical activity to synthesize audible speech. Recurrent neural networks first decoded directly recorded cortical activity into articulatory movement representations, and then transformed those representations into speech acoustics. In closed vocabulary tests, listeners could readily identify and transcribe neurally synthesized speech. Intermediate articulatory dynamics enhanced performance even with limited data. Decoded articulatory representations were highly conserved across speakers, enabling a component of the decoder be transferrable across participants. Furthermore, the decoder could synthesize speech when a participant silently mimed sentences. These findings advance the clinical viability of speech neuroprosthetic technology to restore spoken communication.
Neurological conditions that result in the loss of communication are devastating. Many patients rely on alternative communication devices that measure residual nonverbal movements of the head or eyes1, or now brain-computer interfaces (BCIs)2,3 to control a cursor to select letters one-by-one to spell out words. While these systems can enhance a patient’s quality of life, most users struggle to transmit more than 10 words/minute3, a rate far slower than the average of 150 words/min in natural speech. A major hurdle is how to overcome the constraints of current spelling-based approaches to enable far higher or even natural communication rates.
A promising alternative is to directly synthesize speech from brain activity4,5. Spelling is a sequential concatenation of discrete letters, whereas speech is a highly efficient form of communication produced from a fluid stream of overlapping, multi-articulator vocal tract movements6. For this reason, a biomimetic approach that focuses on vocal tract movements and the sounds they produce may be the only means to achieve the high communication rates of natural speech, and also likely the most intuitive for users to learn7,8. In patients with paralysis, for example from ALS or brainstem stroke, high fidelity speech control signals may only be accessed by directly recording from intact cortical networks.
Our goal was to demonstrate the feasibility of a neural speech prosthetic by translating brain signals into intelligible synthesized speech at the rate of a fluent speaker. To accomplish this, we recorded high-density electrocorticography (ECoG) signals from five participants undergoing intracranial monitoring for epilepsy treatment as they spoke several hundred sentences aloud. We designed a recurrent neural network that decoded cortical signals with an explicit intermediate representation of the articulatory dynamics to synthesize audible speech.
Speech decoder design
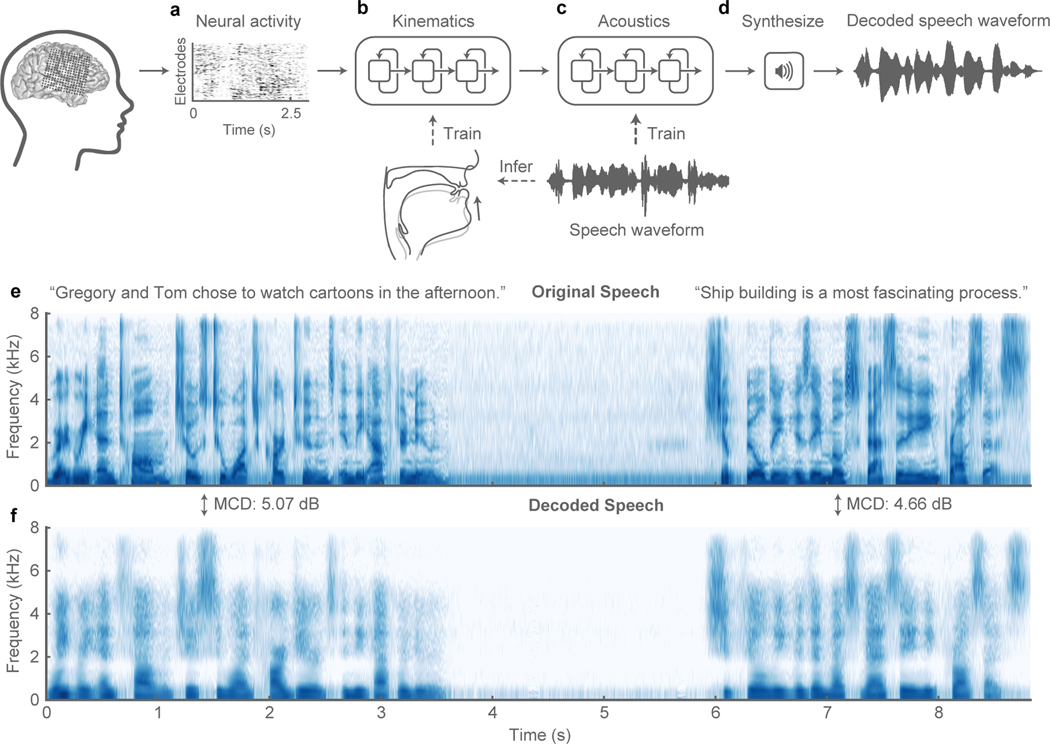
The two-stage decoder approach is shown in Figure 1a–d. Stage 1: a bidirectional long short-term memory (bLSTM) recurrent neural network9 decodes articulatory kinematic features from continuous neural activity (high-gamma amplitude envelope10 and low frequency component11,12, see methods) recorded from ventral sensorimotor cortex (vSMC)13, superior temporal gyrus (STG)14, and inferior frontal gyrus (IFG)15 (Figure 1a, b). Stage 2: a separate bLSTM decodes acoustic features (F0, mel-frequency cepstral coefficients (MFCCs), voicing and glottal excitation strengths) from the decoded articulatory features from Stage 1 (Figure 1c). The audio signal is then synthesized from the decoded acoustic features (Figure 1d). To integrate the two stages of the decoder, Stage 2 (articulation-to-acoustics) was trained directly on output of Stage 1 (brain-to-articulation) so that it not only learns the transformation from kinematics to sound, but can correct articulatory estimation errors made in Stage 1.
Figure 1: Speech synthesis from neurally decoded spoken sentences.
a, The neural decoding process begins by extracting relevant signal features from high-density cortical activity. b, A bi-directional long short-term memory (bLSTM) neural network decodes kinematic representations of articulation from ECoG signals. c, An additional bLSTM decodes acoustics from the previously decoded kinematics. Acoustics are spectral features (e.g. Mel-frequency cepstral coefficients (MFCCs)) extracted from the speech waveform. d, Decoded signals are synthesized into an acoustic waveform. e, Spectrogram shows the frequency content of two sentences spoken by a participant. f, Spectrogram of synthesized speech from brain signals recorded simultaneously with the speech in e(repeated 5 times with similar results). Mel-cepstral distortion (MCD) was computed for each sentence between the original and decoded audio. 5-fold cross-validation used to find consistent decoding.
A key component of our decoder is the intermediate articulatory representation between neural activity and acoustics (Figure 1b). This step is crucial because the vSMC exhibits robust neural activations during speech production that predominantly encode articulatory kinematics16,17. Because articulatory tracking of continuous speech was not feasible in our clinical setting, we used a statistical approach to estimate vocal tract kinematic trajectories (movements of the lips, tongue, and jaw) and other physiological features (e.g. manner of articulation) from audio recordings. These features initialized the bottleneck layer within a speech encoder-decoder that was trained to reconstruct a participant’s produced speech acoustics (see methods). The encoder was then used to infer the intermediate articulatory representation used to train the neural decoder. With this decoding strategy, it was possible to accurately reconstruct the speech spectrogram.
Synthesis performance
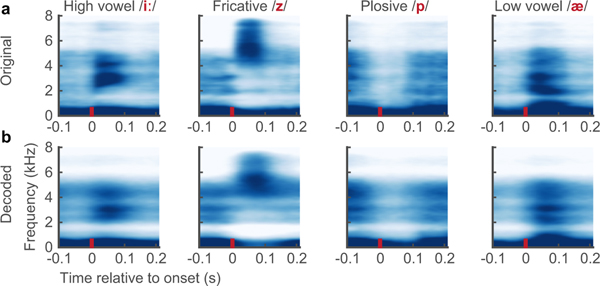
Overall, we observed detailed reconstructions of speech synthesized from neural activity alone (See Supplemental Video). Figure 1e,f, shows the audio spectrograms from two original spoken sentences plotted above those decoded from brain activity. The decoded spectrogram retained salient energy patterns present in the original spectrogram and correctly reconstructed the silence in between the sentences when the participant was not speaking. Extended Data Figure 1a,b, illustrates the quality of reconstruction at the phonetic level. Median spectrograms of original and synthesized phonemes showed that the typical spectrotemporal patterns were preserved in the decoded exemplars (e.g. formants F1-F3 in vowels /iː/ and /æ/; and key spectral patterns of mid-band energy and broadband burst for consonants /z/ and /p/, respectively).
To understand to what degree the synthesized speech was perceptually intelligible to naïve listeners, we conducted two listening tasks that involved single-word identification and sentence-level transcription, respectively. The tasks were run on Amazon Mechanical Turk (see methods), using all 101 synthesized sentences from the test set for participant P1.
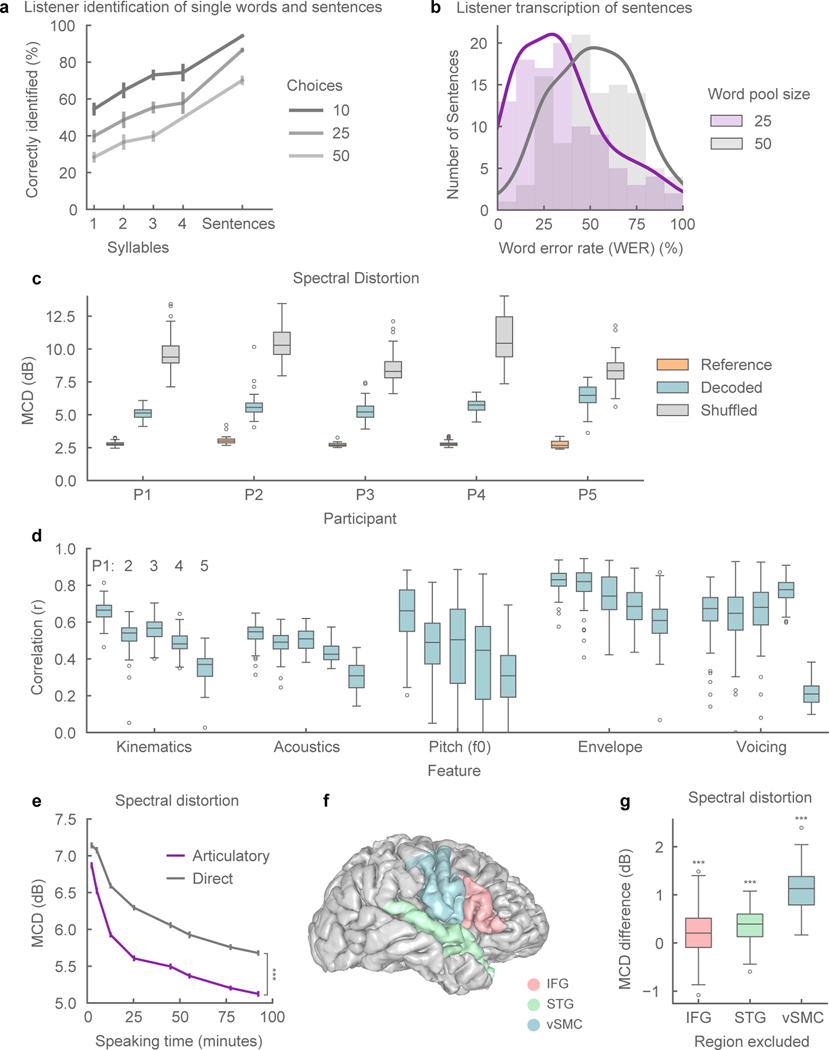
For the single-word identification task, we evaluated 325 words that were spliced from the synthesized sentences. We quantified the effect of word length (number of syllables) and the number of choices (10, 25, and 50 words) on speech intelligibility, since these factors inform optimal design of speech interfaces18. Overall, we found listeners were more successful at word identification as syllable length increased, and number of word choices decreased (Figure 2a), consistent with natural speech perception19.
Figure 2: Synthesized speech intelligibility and feature-specific performance.
a, Listening tests for identification of excerpted single words (n=325) and full sentences (n=101) for synthesized speech from participant P1. Points represent mean word identification rate. Words were grouped by syllable length (n=75, 158, 68, 24). Listeners identified speech by selecting from a set of choices (10, 25, 50). b, Listening tests for closed vocabulary transcription of synthesized sentences (n=101). Responses were constrained in word choice (25, 50), but not in sequence length. Outlines are kernel density estimates of the distributions. c, Spectral distortion, measured by Mel-Cepstral Distortion (MCD) (lower values are better), between original spoken sentences and neurally decoded sentences (n=101, 100, 93, 81, 44, respectively). Reference MCD refers to the synthesis of original (inferred) kinematics without neural decoding. d, Correlation of original and decoded kinematic and acoustic features (n=101, 100, 93, 81, 44 sentences, respectively). Kinematic and acoustic values represent mean correlation of 33 and 32 features, respectively. e, Mean MCD of sentences (n=101) decoded from models trained on varying amounts of training data. The neural decoder with an articulatory intermediate stage (purple) performed better than direct ECoG to acoustics decoder (grey) (all data sizes: p < 1e-5, n = 101 sentences; WSRT). f, Anatomical reconstruction of a single participant’s brain (P1) with the following regions used for neural decoding: ventral sensorimotor cortex (vSMC), superior temporal gyrus (STG), and inferior frontal gyrus (IFG). g, Difference in median MCD of sentences (n=101) between decoder trained on all regions and decoders trained on all-but-one region. Exclusion of any region resulted in decreased performance (p < 3e-4, n = 101 sentences; WSRT). All box plots depict median (horizontal line inside box), 25th and 75th percentiles (box), 25/75th percentiles ±1.5× interquartile range (whiskers), and outliers (circles). Distributions were compared with each as other as indicated or with chance-level distributions using two-tailed Wilcoxon signed-rank tests (WSRT). *** indicates p<0.001. All error bars are SEM.
For sentence-level intelligibility, we designed a closed vocabulary, free transcription task. Listeners heard the entire synthesized sentence and transcribed what they heard by selecting words from a defined pool (of either 25 or 50 words) that included the target words and random words from the test set. The closed vocabulary setting was necessary because the test set was a subset of sentences from MOCHA-TIMIT20 which was primarily designed to optimize articulatory coverage of English but contains highly unpredictable sentence constructions and low frequency words.
Listeners were able to transcribe synthesized speech well. Of the 101 synthesized trials, at least one listener was able to provide a perfect transcription for 82 sentences with a 25-word pool and 60 sentences with a 50-word pool. Of all submitted responses, listeners transcribed 43% and 21% of the total trials perfectly, respectively (Extended Data Figure 2). In Figure 2b, the distributions of mean word error rates (WER) of each sentence are shown. Transcribed sentences had a median 31% WER with a 25-word pool size and 53% WER with a 50-word pool size. Table 1 shows listener transcriptions for a range of WERs. Median level transcriptions still provided a fairly accurate, and in some cases legitimate transcription (eg., “mum” transcribed as “mom” etc.). The errors suggest that the acoustic phonetic properties of the phonemes are still present in the synthesized speech, albeit to the lesser degree (eg., “rabbits” transcribed as “rodents”). This level of intelligibility for neurally synthesized speech would already be immediately meaningful and practical for real world application.
Table 1. Listener transcriptions of neurally synthesized speech.
Examples shown at several word error rate levels. The original text is indicated by “o” and the listener transcriptions are indicated by “t”.
| Word Error Rate | Original sentences (o) and transcriptions of synthesized speech (t) |
|---|---|
| 0% | o: is this seesaw safe t: is this seesaw safe |
| ~10% | o: bob bandaged both wounds with the skill of a doctor t: bob bandaged full wounds with the skill of a doctor |
| ~20% | o: those thieves stole thirty jewels t: thirty thieves stole thirty jewels |
| o: help celebrate brother’s success t: help celebrate his brother’s success | |
| ~30% | o: get a calico cat to keep the rodents away t: the calico cat to keep the rabbits away |
| o: carl lives in a lively home t: carl has a lively home | |
| ~50% | o: mum strongly dislikes appetizers t: mom often dislikes appetizers |
| o: etiquette mandates compliance with existing regulations t: etiquette can be made with existing regulations | |
| >70% | o: at twilight on the twelfth day we’ll have Chablis t: i was walking through chablis |
We then quantified the decoding performance at a feature level for all participants. In speech synthesis, the spectral distortion of synthesized speech from ground-truth is commonly reported using the mean Mel-Cepstral Distortion (MCD) 21. Mel-Frequency bands emphasize the distortion of perceptually relevant frequency bands of the audio spectrogram22. In Figure 2c, the MCD of neurally synthesized speech was compared to a reference synthesis from articulatory kinematics and chance-level decoding (lower MCD is better). The reference synthesis simulates perfect neural decoding of the kinematics. For our five participants (P1–5), the median MCD scores of decoding speech ranged from 5.14 dB to 6.58 dB (p<1e-18, Wilcoxon signed-rank test (WSRT), for each participant).
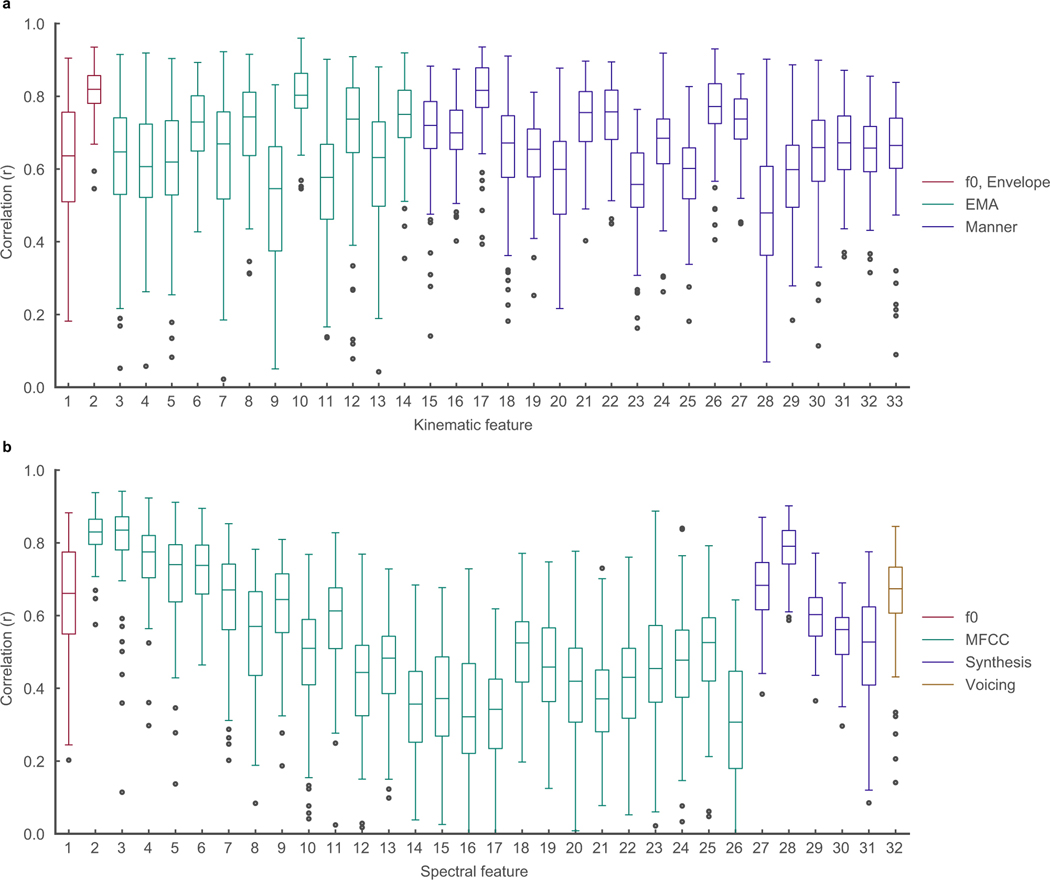
We also computed the correlations between original and decoded acoustic features. For each sentence and feature, the Pearson’s correlation coefficient was computed using every sample (at 200 Hz) for that feature. The sentence correlation of the mean decoded acoustic features (intensity + MFCCs + excitation strengths + voicing) and inferred kinematics across participants are plotted in Figure 2d. Prosodic features such as pitch (F0), speech envelope, and voicing were decoded well above chance-level (r > 0.6, except F0 for P2: r= 0.49 and all features for P5, p<1e-10, WSRT, for all participants and features in Figure 2d). Correlation decoding performance for all other features is shown in Extended Data Figure 4a,b.
Decoder characteristics
The following analyses were performed on data from P1. In designing a neural decoder for clinical applications, there are several key considerations that determine model performance. First, in patients with severe paralysis or limited speech ability, training data may be very difficult to obtain. Therefore, we assessed the amount of data necessary to achieve a high level of performance. We found a clear advantage in explicitly modeling articulatory kinematics as an intermediate step over decoding acoustics directly from the ECoG signals. The “direct” decoder was a bLSTM recurrent neural network optimized for decoding acoustics (MFCCs) directly from same ECoG signals as employed in articulatory decoder. We found robust performance could be achieved with as little as 25 minutes of speech, but performance continued to improve with the addition of data (Figure 2e). Without the articulatory intermediate step, the direct ECoG to acoustic decoding MCD was offset by 0.54 dB (0.2 dB is perceptually noticeable21) using the full data set (Figure 3a) (p=1e-17, n=101, WSRT).
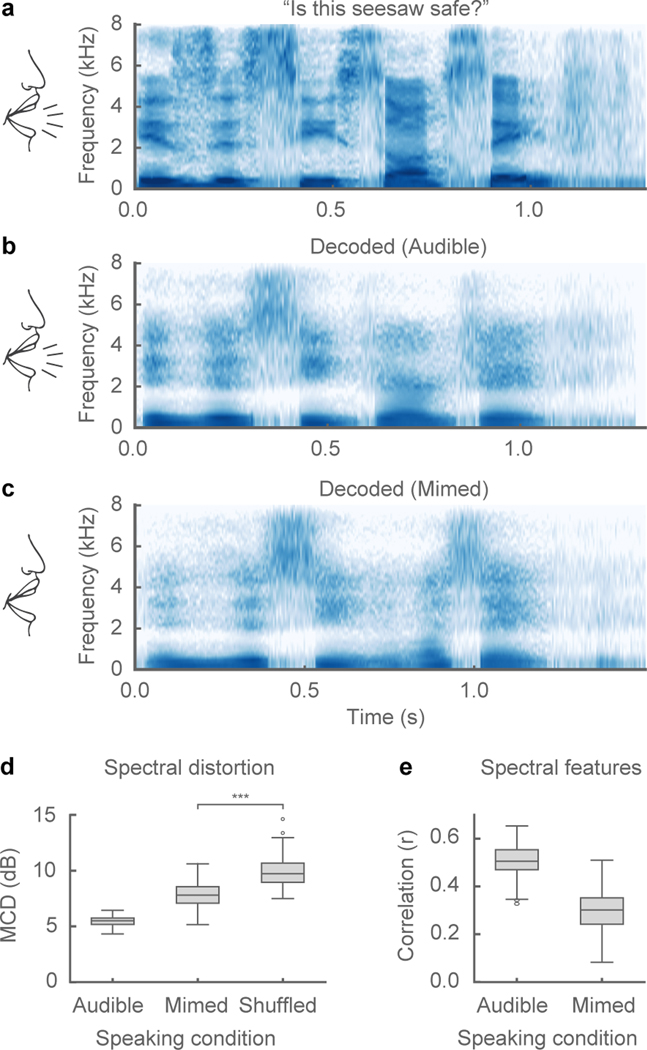
Figure 3: Speech synthesis from neural decoding of silently mimed speech.
a-c, Spectrograms of original spoken sentence (a), neural decoding from audible production (b), and neural decoding from silently mimed production (c) (repeated 5 times with similar results). d, e, Median spectral distortion (MCD) (d) and correlation of original and decoded spectral features (e) for audibly and silently produced speech (n=58 sentences). Decoded sentences were significantly better than chance-level decoding for both speaking conditions (audible: p=3e-11, mimed: p=5e-11, n = 58; Wilcoxon signed-rank test). Box plots as described in Figure 2. *** indicates p<0.001.
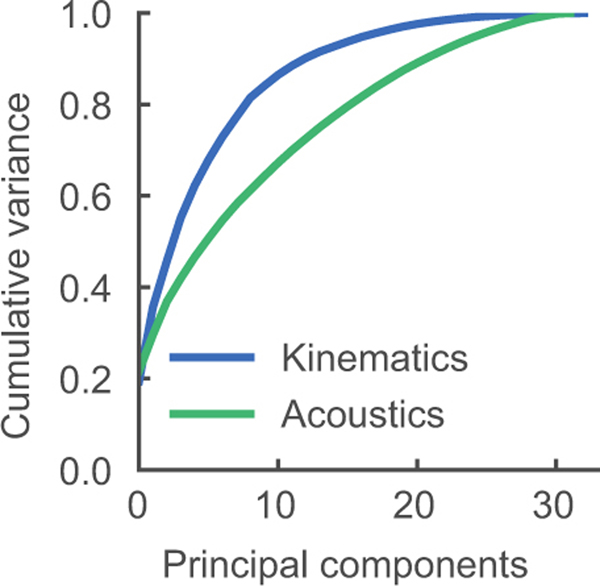
This performance gap between the two approaches persisted with increasing data sizes. One interpretation is that aspects of kinematics are more preferentially represented by cortical activity than acoustics16, and thereby learned more quickly with limited data. Another aspect that may underlie this difference is that articulatory kinematics lie on a low-dimensional manifold that constrain the potential high-dimensionality of acoustic signals (Extended Data Figure 5)6,7,23. Hence, separating out the high-dimensional translation of articulation to speech, as done Stage 2 of our decoder may be critical for performance. It is possible that with sufficiently large data both decoding approaches would converge with one another.
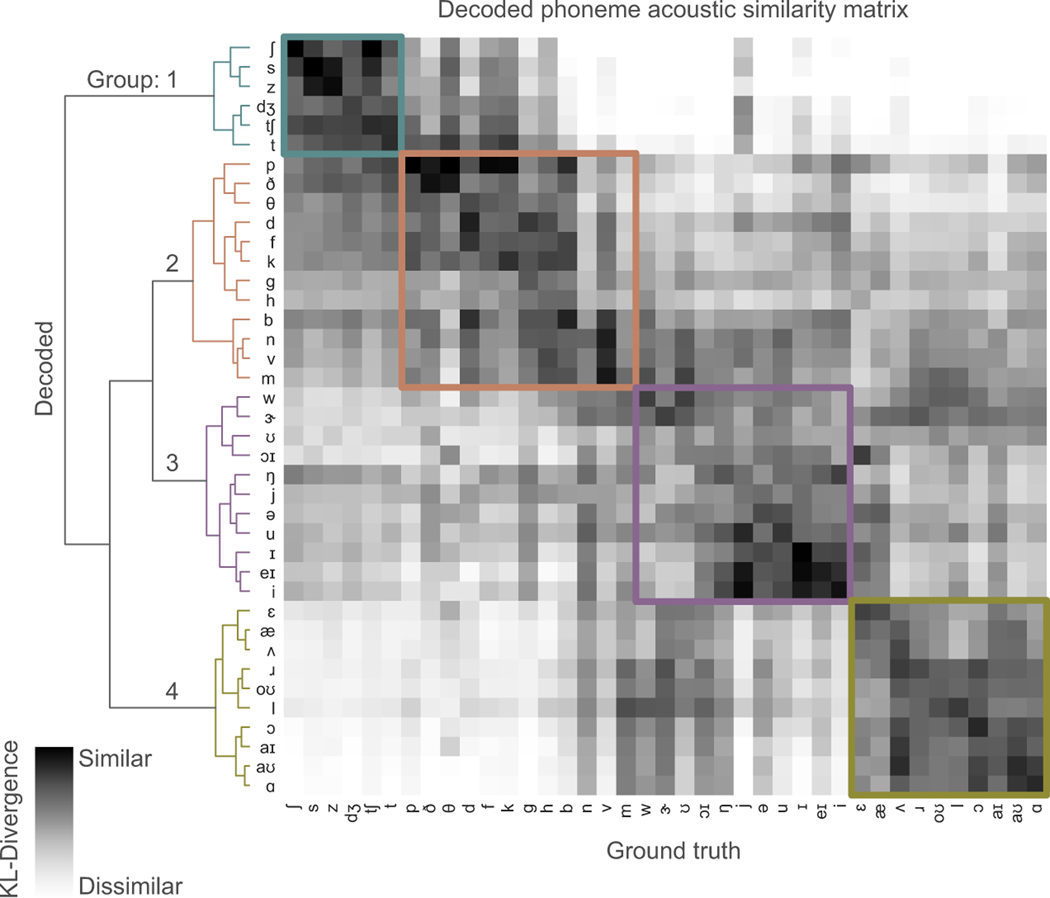
Second, we wanted to understand the phonetic properties that were preserved in synthesized speech. We used Kullback-Leibler (KL) divergence to compare the distribution of spectral features of each decoded phoneme to those of each ground-truth phoneme to determine how similar they were (Extended Data Figure 6). We expected that, in addition to the same decoded and ground-truth phoneme being similar to one another, phonemes with shared acoustic properties would also be characterized as similar to one another.
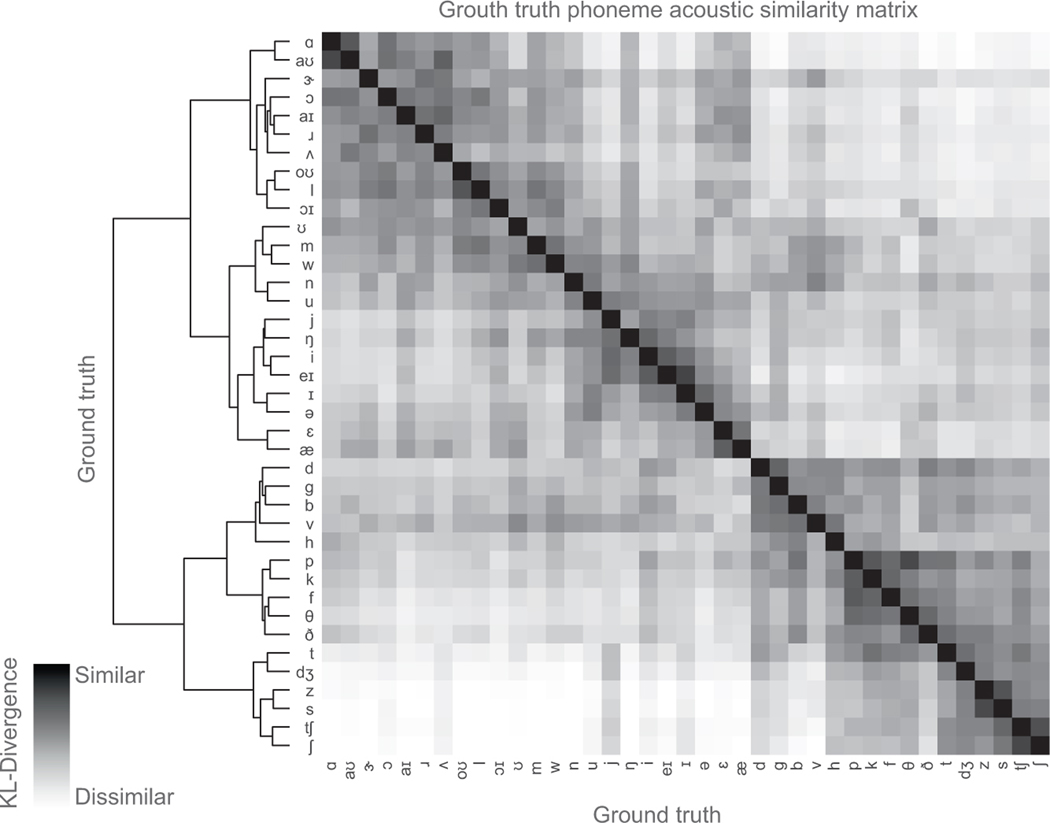
Hierarchical clustering on the KL-divergence of each phoneme pair demonstrated that phonemes were clustered into four main groups. Group 1 contained consonants with an alveolar place of constriction. Group 2 contained almost all other consonants. Group 3 contained mostly high vowels. Group 4 contained mostly mid and low vowels. The difference between groups tended to correspond to variations along acoustically significant dimensions (frequency range of spectral energy for consonants, and formants for vowels). Indeed, these groupings explain some of the confusions reflected in listener transcriptions of these stimuli. This hierarchical clustering was also consistent with the acoustic similarity matrix of only ground-truth phoneme-pairs (Extended Data Figure 7) (cophenetic correlation24 = 0.71, p=1e10).
Third, since the success of the decoder depends on the initial electrode placement, we quantified the contribution of several anatomical regions (vSMC, STG, and IFG) that are involved in continuous speech production25. Decoders were trained in a leave-one-region-out fashion where all electrodes from a particular region were held out (Figure 2f). Removing any region led to some decreased decoder performance (Figure 2g) (p=3e-4, n=101, WSRT). However, excluding vSMC resulted in the largest decrease in performance (1.13 dB MCD increase).
Fourth, we investigated whether the decoder generalized to novel sentences that were never seen in the training data. Since P1 produced some sentences multiple times, we compared two decoders: one that was trained on all sentences (not the particular instances in the test set), and one that was trained excluding every instance of the sentences in the testing set. We found no significant difference in decoding performance of the sentences for both MCD and correlations of spectral features (p=0.36, p=0.75, n=51, WSRT, Extended Data Figure 8). Importantly, this suggests that the decoder can generalize to arbitrary words and sentences that the decoder was never trained on.
Synthesizing mimed speech
To rule out the possibility that the decoder is relying on the auditory feedback of participants’ vocalization, and to simulate a setting where subjects do not overtly vocalize, we tested our decoder on silently mimed speech. We tested a held-out set of 58 sentences in which the participant (P1) audibly produced each sentence and then mimed the same sentence, making the same articulatory movements but without making sound. Even though the decoder was not trained on mimed sentences, the spectrograms of synthesized silent speech demonstrated similar spectral patterns to synthesized audible speech of the same sentence (Figure 3a–c). With no original audio to compare, we quantified performance of the synthesized mimed sentences with the audio from the trials with spoken sentences. We calculated the spectral distortion and correlation of the spectral features by first dynamically time-warping the spectrogram of the synthesized mimed speech to match the temporal profile of the audible sentence (Figure 3d,e) and then comparing performance. While synthesis performance on mimed speech was inferior to that of audible speech (likely due to absence of phonation signals during mime), this demonstrates that it is possible to decode important spectral features of speech that were never audibly uttered (p < 1e-11, compared to chance, n = 58; Wilcoxon signed-rank test) and that the decoder did not rely on auditory feedback.
State-space of decoded speech articulation
Our findings suggest that modeling the underlying kinematics enhances the decoding performance, so we next wanted to better understand the nature of the decoded kinematics from population neural activity. We examined low-dimensional kinematic state-space trajectories, by computing the state-space projection via principal components analysis (PCA) on the articulatory kinematic features. The first ten principal components (PCs) (of 33 total) captured 85% of the variance and the first two PCs captured 35% (Extended Data Figure 5).
In Figures 4a,b, the kinematic trajectory of an example sentence is projected onto the first two PCs. These trajectories were well decoded, as seen in the example (r=0.91, r=0.91, Figure 4a,b), and summarized across all test sentences and participants (median r>0.72 for all participants except P5, r represents mean r of first 2 PCs, Figure 4e). Furthermore, state-space trajectories of mimed speech were well decoded (median r=0.6, p=1e-5, n=38, WSRT, Figure 4e).
Figure 4. Kinematic state-space representation of speech production.
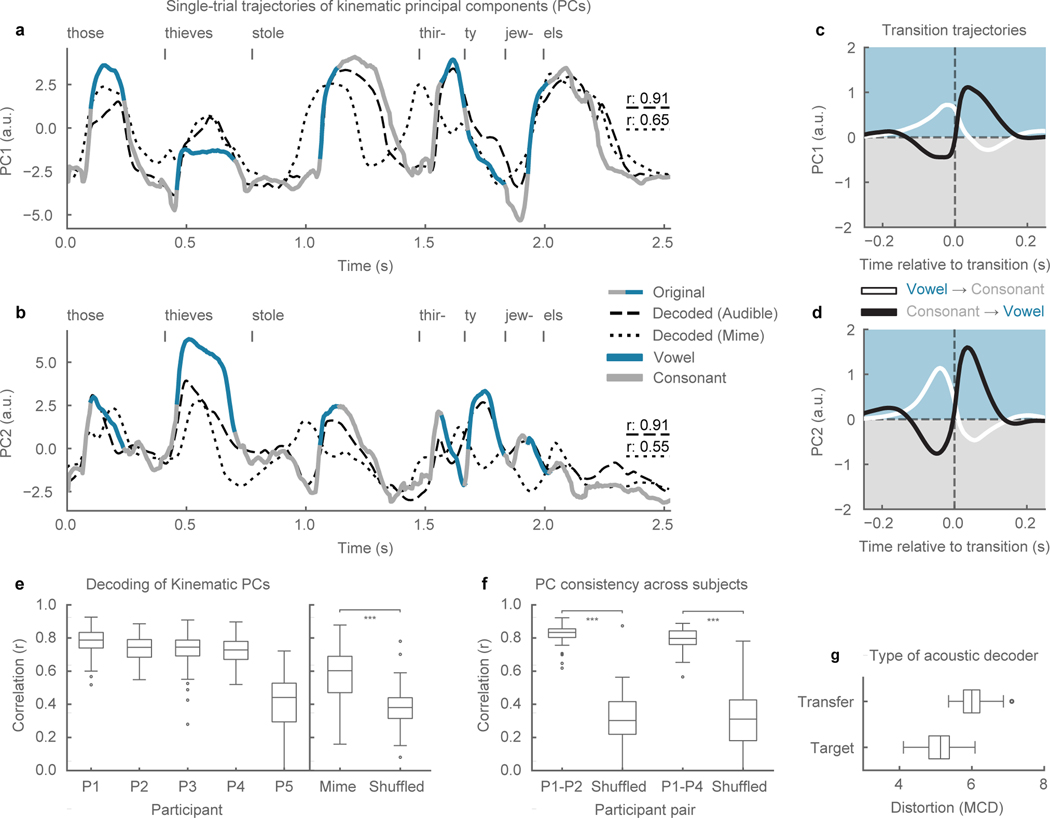
a, b, A kinematic trajectory (grey-blue) from a single trial (P1) projected onto the first two principal components—PC1 (a) and PC2 (b)—of the kinematic state-space. Decoded audible (dashed) and mimed (dotted) kinematic trajectories also plotted (Pearson’s r, n=510 time samples). The trajectory for mimed speech was uniformly stretched to align with the audible speech trajectory for visualization as it occurred at a faster time scale. c, d, Average trajectories for PC1 (a) and PC2 (b) for transitions from a vowel to a consonant (black, n=22453) and from a consonant to a vowel (white, n=22453). Time courses are 500 ms. e, Distributions of correlations between original and decoded kinematic state-space trajectories (averaged across PC1 and PC2) (n=101, 100, 93, 81, 44 sentences, respectively).. Pearson’s correlations for mimed trajectories were calculated by dynamically time warping (DTW) to the audible production the same sentence and then compared to correlations to DTW of a randomly selected sentence trajectory (p=1e-5, n=58 sentences, Wilcoxon signed-rank test). f, Distributions of correlations for state-space trajectories of the same sentence across participants. Alignment between participants done via DTW and compared to correlations from DTW on unmatched sentence pairs (p=1e-16, n=92; p=1e-8, n=44, respectively, WSRT). g, Comparison between acoustic decoders (Stage 2) (n=101 sentences). “Target” refers to an acoustic decoder trained on data from the same participant that kinematic decoder (stage 1) is trained on (P1). “Transfer” refers to acoustic decoder trained on kinematics and acoustics from a different participant (P2). Box plots as described in Figure 2. *** indicates p<0.001.
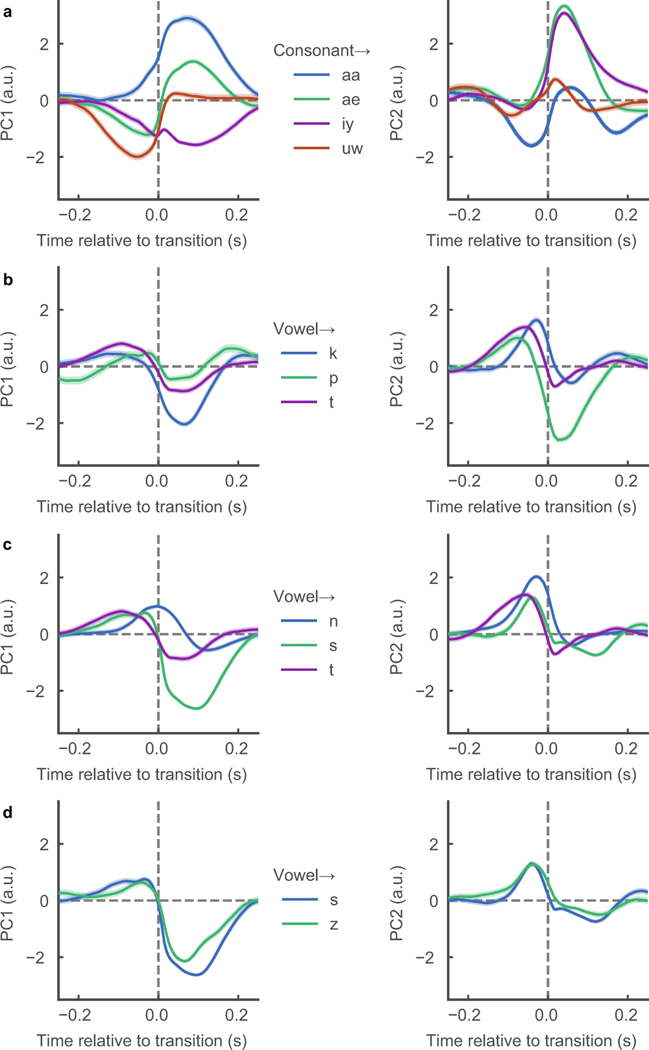
The state-space trajectories appeared to manifest the dynamics of syllabic patterns in continuous speech. The time courses of consonants (grey) and vowels (blue) were plotted on the state-space trajectories and tended to correspond with the troughs and peaks of the trajectories, respectively (Figures 4a,b). In Figures 4c,d, we sampled from every vowel-to-consonant transition (n=22453) and consonant-to-vowel transition (n=22453), and plotted 500 ms traces of the average trajectories for PC1 and PC2 centered at the time of transition. Both types of trajectories were biphasic in nature, transitioning from the “high” state during the vowel to the “low” state during the consonant (white), and vice versa (black). When examining transitions of specific phonemes, we found that PC1 and PC2 retained their biphasic trajectories of vowel/consonant states, but showed specificity toward particular phonemes indicating that PC1 and PC2 are not necessarily just describing jaw opening and closing, but rather global opening and closing configurations of the vocal tract (Extended Data Figure 9). These findings are consistent with theoretical accounts of human speaking behavior, which postulate that high-dimensional speech acoustics lie on a low-dimensional articulatory state-space6.
To evaluate the similarity of the decoded state-space trajectories, we correlated productions of the same sentence across participants that were projected into their respective kinematic state-spaces (only P1, P2, and P4 had comparable sentences). The state-space trajectories were highly similar (r>0.8, Figure 4f), suggesting that the decoder is likely relying upon a shared representation across speakers, a critical basis for generalization.
A shared kinematic representation across speakers could be very advantageous for someone who cannot speak as it may be more intuitive and faster to first learn to use the kinematics decoder (Stage 1), while using an existing kinematics-to-acoustics decoder (stage 2) trained on speech data collected independently. In Figure 4g, we show synthesis performance from transferring Stage 2 from a source participant (P1) to a target participant (P2). The acoustic transfer performed well, although less than when both stage 1 and stage 2 were trained on the target (P2), likely because the MCD metric is sensitive to speaker identity.
Discussion
In this paper, we demonstrate speech synthesis using high-density, direct cortical recordings from human speech cortex. Previous strategies for neural decoding of speech production focused on reconstructing spectrotemporal auditory representations26 or direct classification of speech segments like phonemes or words27,28,29 but were limited in their ability to scale to larger vocabulary sizes and communication rates. Meanwhile, decoding of auditory cortex responses has been more successful for speech sounds30,31 in part because of the direct relationship between the auditory encoding of spectrotemporal information and the reconstructed spectrogram. An outstanding question has been whether decoding vocal tract movements from the speech motor cortex could be used for generating high-fidelity acoustic speech output.
Previous work focused on understanding movement encoding at single electrodes16, however, the fundamentally different challenge for speech synthesis is decoding the population activity that addresses the complex mapping between vocal tract movements and sounds. Natural speech production involves over 100 muscles and the mapping from movement to sounds is not one-to-one. Our decoder explicitly incorporated this knowledge to simplify the translation of neural activity to sound by first decoding the primary physiological correlate of neural activity and then transforming to speech acoustics. This statistical mapping permits generalization with limited amounts of training.
Direct speech synthesis has several major advantages over spelling-based approaches. In addition to the capability to communicate at a natural speaking rate, it captures prosodic elements of speech that are not available with text output, for example pitch intonation32. Furthermore, a practical limitation for current alternative communication devices is the cognitive effort required to learn and use them. For patients in whom the cortical processing of articulation is still intact, a speech-based BCI decoder may be far more intuitive and easier to learn to use7,8.
BCIs are rapidly becoming a clinically viable means to restore lost function. Neural prosthetic control was first demonstrated in participants without disabilities33,34,35 before translating the technology to participants with tetraplegia36,37,38,39. Our findings represent one step forward for addressing a major challenge posed by paralyzed patients who cannot speak. The generalization results here demonstrate that speakers share a similar kinematic state-space representation (speaker-independent), and it is possible to transfer model knowledge about the mapping of kinematics to sound across subjects. Tapping into this emergent, low-dimensional representation from coordinated population neural activity in the intact cortex may be a critical for bootstrapping a decoder23, as well facilitating BCI learning7. Our results may be an important next step in realizing speech restoration for patients with paralysis.
Methods
Participants and experimental task.
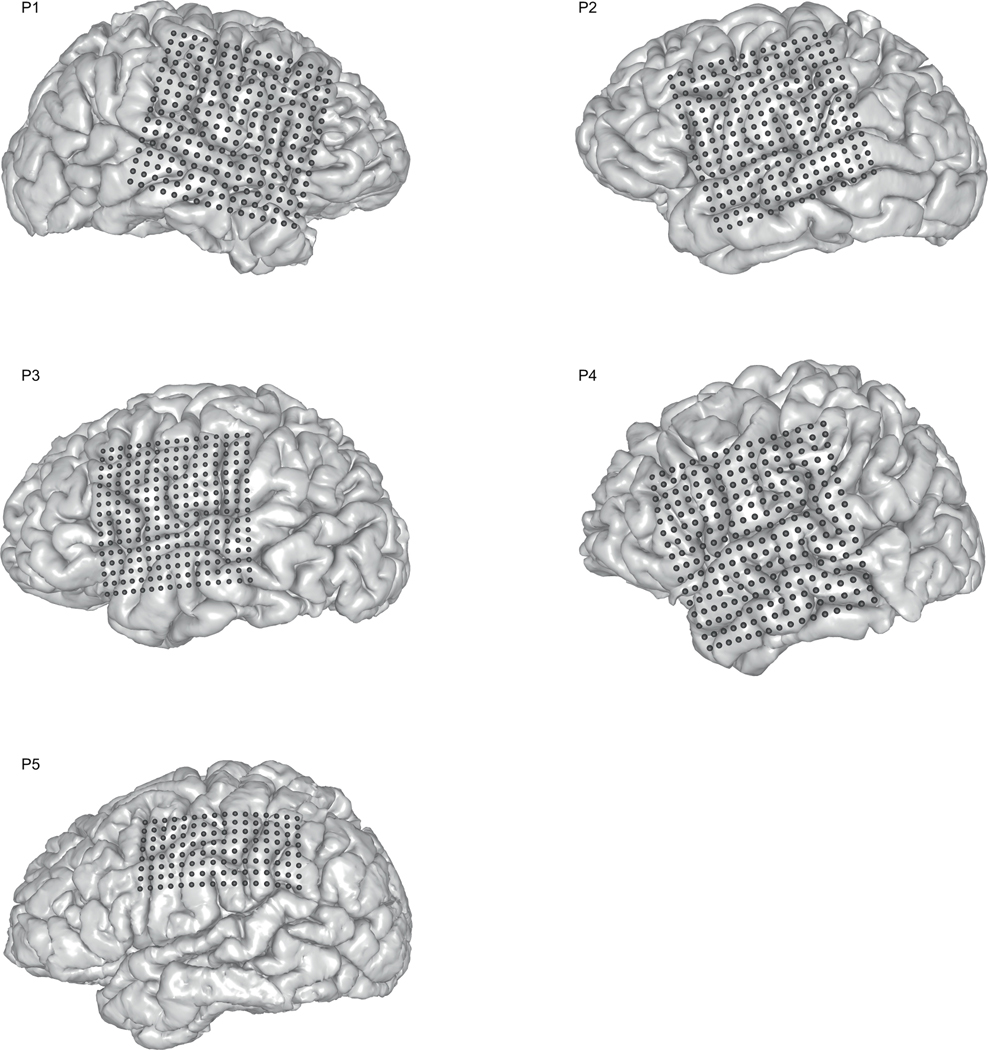
Five human participants (30 F, 31 F, 34 M, 49 F, 29 F) underwent chronic implantation of high-density, subdural electrode array over the lateral surface of the brain as part of their clinical treatment of epilepsy (right, left, left, left, left) hemisphere grids, respectively, Extended Data Figure 3). Participants gave their written informed consent before the day of the surgery. All participants were fluent in English. All protocols were approved by the Committee on Human Research at UCSF and experiments/data in this study complied with all relevant ethical regulations. Each participant read and/or freely spoke a variety of sentences. P1 read aloud two complete sets of 460 sentences from the MOCHA-TIMIT20 database. Additionally, P1 also read aloud passages from the following stories: Sleeping Beauty, Frog Prince, Hare and the Tortoise, The Princess and the Pea, and Alice in Wonderland. P2 read aloud one full set of 460 sentences from the MOCHA-TIMIT database and further read a subset of 50 sentences an additional 9 times each. P3 read 596 sentences describing three picture scenes and then freely described the scene resulting in another 254 sentences. P3 also spoke 743 sentences during free response interviews. P4 read two complete sets of MOCHA-TIMIT sentences, 465 sentences drawn of scene descriptions and 399 sentences during free response interviews. P5 read one set of MOCHA-TIMIT sentences and 360 sentences of scene descriptions. In addition to audible speech, P1 also read 10 sentences 12 times each alternating between audible and silently mimed (i.e. making the necessary mouth movements) speech. Microphone recordings were obtained synchronously with the ECoG recordings.
Data acquisition and signal processing.
Electrocorticography was recorded with a multi-channel amplifier optically connected to a digital signal processor (Tucker-Davis Technologies). Speech was amplified digitally and recorded with a microphone simultaneously with the cortical recordings. The grid placements were decided upon purely by clinical considerations. ECoG signals were recorded at a sampling rate of 3,052 Hz. Each channel was visually and quantitatively inspected for artifacts or excessive noise (typically 60 Hz line noise). The analytic amplitude of the high-gamma frequency component of the local field potentials (70 – 200 Hz) was extracted with the Hilbert transform and down-sampled to 200 Hz. The low frequency component (1–30 Hz) was also extracted with a 5th order Butterworth bandpass filter, down-sampled to 200 Hz and parallelly aligned with the high-gamma amplitude. Finally, the signals were z-scored relative to a 30 second window of running mean and standard deviation, so as to normalize the data across different recording sessions. We studied high-gamma amplitude because it has been shown to correlate well with multi-unit firing rates and has the temporal resolution to resolve fine articulatory movements10. We also included a low frequency signal component due to the decoding performance improvements note for reconstructing perceived speech from auditory cortex11,12. Decoding models were constructed using all electrodes from vSMC, STG, and IFG except for electrodes with bad signal quality as determined by visual inspection. We removed 8 electrodes for P1, 7 electrodes for P2, and 16 electrodes for P3. No electrodes were removed for P4 or P5. The decoder uses both high-gamma amplitude and raw low-frequency signals together as input to the model. For instance, n electrodes will result as n * 2 input features.
Phonetic and phonological transcription.
For the collected speech acoustic recordings, transcriptions were corrected manually at the word level so that the transcript reflected the vocalization that the participant actually produced. Given sentence level transcriptions and acoustic utterances chunked at the sentence level, hidden Markov model based acoustic models were built for each participant so as to perform sub-phonetic alignment40 within the Festvox41 framework. Phonological context features were also generated from the phonetic labels, given their phonetic, syllabic and word contexts.
Cortical surface extraction and electrode visualization.
We localized electrodes on each individual’s brain by co-registering the preoperative T1 MRI with a postoperative CT scan containing the electrode locations, using a normalized mutual information routine in SPM12. Pial surface reconstructions were created using Freesurfer. Final anatomical labeling and plotting was performed using the img_pipe python package42.
Inference of articulatory kinematics.
Among the most accurate methods to record vocal tract kinematics is called Electromagnetic Midsagittal Articulography (EMA). The process involves gluing small sensors to the articulators, generally 3 sensors on the tongue, 1 on each lip, 1 on each incisor. A magnetic field is projected at the participant’s head and as the participant speaks, each sensor can be precisely tracked as it moves through the magnetic field. Each sensor has a wire leading out of the participant’s mouth and connected to a receiver to record measurements.
Because of the above requirements, we did not pursue using EMA in the setting of our ECoG recordings because potential disruption of medical instruments by the magnetic field, long setup time conflicted with limited recording session time with patients, the setup procedure was too uncomfortable. Instead, we developed a model to infer articulatory kinematics from audio recordings. The articulatory data used to build the articulatory inference models was from MOCHA-TIMIT20 and MNGU0 corpora43.
The articulatory kinematics inference model comprises a stacked deep encoder-decoder, where the encoder combines phonological (linguistic and contextual features, resulting from the phonetic segmentation process) and acoustic representations (25 dimensional MFCC vectors sampled at 200 Hz) into a latent articulatory representation (also sampled at 200 Hz) that is then decoded to reconstruct the original acoustic signal. The latent representation is initialized with inferred articulatory movement and appropriate manner features.
We performed statistical subject-independent acoustic-to-articulatory inversion16 to estimate 12 dimensional articulatory kinematic trajectories (x and y displacements of tongue dorsum, tongue blade, tongue tip, jaw, upper lip and lower lip, as would be measured by EMA) using only the produced acoustics and phonetic transcriptions. Since EMA features do not describe all acoustically consequential movements of the vocal tract, we append complementary speech features that improve reconstruction of original speech. First, to approximate laryngeal function, we add pitch, voicing (binary value indicating if a frame is voiced or not), and speech envelope, i.e., the frame level intensity computed as the sum total power within all the Mel scale frequencies within a 25 millisecond analysis window, computed at a shift of 5 milliseconds. Next, we added place-manner tuples (represented as continuous [0–1] valued features) to bootstrap the EMA with what we determined were missing physiological aspects in EMA. There were 18 additional values to capture the following place-manner feature tuples (palatal approximant, labial stop etc., see Supplemental Information (a) for the complete list). We used an existing annotated speech database (Wall Street Journal Corpus44) and trained speaker independent deep recurrent network regression models to predict continuous valued place-manner vectors only from the acoustics features, the phonetic labels were used to determine the ground truth values for these labels (e.g., the dimension “labial stop” would be 1 for all frames of speech that belong to the phonemes /p/, /b/ and so forth). However, with a regression output layer, predicted values were not constrained to the binary nature of the input features. The network architecture was 3 feedforward layers followed by one bLSTM layer to predict each time point of these manner descriptors from a 100 millisecond window of acoustic features. Combined with the EMA trajectories, these 33 feature vectors form the initial articulatory feature estimates.
To ensure that the articulatory representation has the potential to reliably reconstruct speech for the target subject, we designed a stacked encoder-decoder network to optimize these initial estimates for these values. Specifically, a recurrent neural network encoder is trained to convert phonological and acoustic features to the articulatory representation and then a decoder that converts the articulatory representation back to the acoustic features (original MFCC). The encoder is implemented as 2 feedforward layers followed by 2 bLSTM layers. The decoder is implemented as 3 feedforward layers. Software implementation was done using Keras Functional API within Tensorflow45. The stacked network is re-trained optimizing the joint mean squared error loss on acoustic and EMA parameters using the ADAM optimizer, with an initial learning rate set at 0.001. For regularization 40% dropout was allowed in all feedforward layers. After convergence, the trained encoder is used to estimate the final articulatory kinematic features that act as the articulatory intermediate to decode acoustic features from ECoG.
Neural decoder.
The decoder maps ECoG recordings to MFCCs via a two stage process by learning intermediate mappings between ECoG recordings and articulatory kinematic features, and between articulatory kinematic features and acoustic features. All data (ECoG, kinematics, and acoustics) are sampled and processed by the model at 200 Hz. We implemented this model using TensorFlow in python. In the first stage, a stacked 3-layer bLSTM9 learns the mapping between 300 ms (60 time points) sequences of high-gamma and LFP signals and a corresponding single time point (sampled at 200 Hz) of the 33 articulatory features. In the second stage, an additional stacked 3-layer bLSTM learns the mapping between the output of the first stage (decoded articulatory features) and 32 acoustic parameters (200 Hz) for full sentences sequences. These parameters are 25 dimensional MFCCs, 5 sub-band voicing strengths for glottal excitation modelling, log(F0), voicing.
During testing, a full sentence sequence of neural activity (high-gamma and low-frequency components) is processed by the decoder. The first stage processes 300 ms of data at a time, sliding over the sequence sample by sample, until it has returned a sequence of kinematics that is equal length to the neural data. The neural data is padded with an additional 150 ms of data before and after the sequence to ensure the result is the correct length. The second stage processes the entire sequence at once, returning an equal length sequence of acoustic features. These features are then synthesized into an audio signal.
At each stage, the model is trained using the Adam optimizer to minimize mean-squared error. The optimizer was initialized with learning rate=0.001,beta1=0.9, beta2=0.999, epsilon=1e-8. Models were stopped from training after the validation loss no longer decreased. Dropout rate is set to 50% in stage 1 and 25% in stage 2 to suppress overfitting tendencies of the models. There are 100 hidden units for each LSTM cell. Each model employed 3 stacked bLSTMs with an additional linear layer for regression. We use a bLSTM because of their ability to retain temporally distant dependencies when decoding a sequence46.
In the first stage, the batch size for training is 256, and in the second stage the batch size is 25. Training and testing data were randomly split based off of recording sessions, meaning that the test set was collected during separate recording sessions from the training set. The training and testing splits in terms of total speaking time (minutes:seconds) are as follows: P1 – training: 92:15, testing: 4:46 (n=101); P2 – training: 36:57, testing: 3:50 (n=100); P3 – training: 107:42, testing: 4:44 (n=98); P4 – training: 27:39, testing 3:12 (n=82).; P5 – training 44:31, testing 2:51 (n=44). n=number of sentences in test set.
For shuffling the data to test for significance, we shuffled the order of the electrodes that were fed into the decoder. This method of shuffling preserved the temporal structure of the neural activity.
The “direct” ECoG to acoustics decoder described in Figure 2e a similar architecture as the stage 1 articulatory bLSTM except with an MFCC output. Originally we trained the direct acoustic decoder as a 6-layer bLSTM that mimics the architecture of the 2 stage decoder with MFCCs as the “intermediate layer” and as the output. However, we found performance was better with a 4-layer bLSTM (no intermediate layer) with 100 hidden units for each layer, 50% dropout and 0.005 learning rate using Adam optimizer for minimizing mean-squared error. Models were coded using Python’s version 1.9 of Tensorflow.
Speech synthesis from acoustic features.
We used an implementation of the Mel-log spectral approximation algorithm with mixed excitation47 within Festvox to generate the speech waveforms from estimates of the acoustic features from the neural decoder.
Mel-Cepstral Distortion (MCD).
To examine the quality of synthesized speech, we calculated the Mel-Cepstral Distortion (MCD) of the synthesized speech when compared the original ground-truth audio. MCD is an objective measure of error determined from MFCCs and is correlated to subjective perceptual judgments of acoustic quality21. For reference acoustic features and decoded features ,
Intelligibility Assessment.
Listening tests using crowdsourcing are a standard way of evaluating the perceptual quality of synthetic speech48. To comprehensively assess the intelligibility of the neurally synthesized speech, we conducted a series of identification and transcription tasks on the Amazon Mechanical Turk. The unseen test set from P1 (101 trials of 101 unique sentences, shown in Supplemental Information (b)) was used as the stimuli for listener judgments. For the word level identification tasks, we created several cohorts of words grouped by the number of syllables within. Using the time boundaries from the ground truth phonetic labelling, we extracted audio from the neurally synthesized speech into four classes of 1-syllable, 2-syllable, 3-syllable and 4-syllable words. We conducted tests on each of these groups of words that involve identification of the synthesized audio from a group of i) 10 choices, ii) 25 choices, and iii) 50 choices of what they think the word is. The presented options included the true word and the remaining choices randomly drawn from the other words within the class (see Supplemental Information (c) for class sizes across these conditions). All words within the word groups were judged for intelligibility without any further sub-selection.
Since the content words in the MOCHA-TIMIT data are largely low frequency words to assess sentence-level intelligibility, along with the neurally synthesized audio file, we presented the listeners a pool of words that may be in the sentence. This makes it task a limited vocabulary free response transcription. We conducted two experiments where the transcriber is presented with pool of i) 25 word choices, and ii) 50 word choices that may be used the sentence (a sample interface is shown in Supplemental Information (d)). The true words that make up the sentence are included along with randomly drawn words from the entire test set and displayed in alphabetical order. Given that the median sentence is only 7 words long (std=21., min=4, max=13), this task design allows for reliable assessment of intelligibility. Each trial was judged by 10–20 different listeners. Each intelligibility task was performed by 47–187 unique listeners (a total of 1755 listeners across 16 intelligibility tasks, see supplemental information (e) for breakdown per task) making all reported analyses statistically reliable. All sentences from the test set were sent for intelligibility assessment without any further selection. The listeners were required to be English speakers located in the United States, with good ratings(>98% rating from prior tasks on the platform). For the sentence transcription tasks, an automatic spell checker was employed to correct misspellings. No further spam detection, or response rejection was done in all analyses reported. Word Error Rate (WER) metric computed on listener transcriptions is used to judge the intelligibility of the neurally synthesized speech. Where I is the number of word insertions, D is the number of word deletions and S is the number of word substitutions for a reference sentence with N words, WER is computed as
Data limitation analysis.
To assess the amount of training data affects decoder performance, we partitioned the data by recording blocks and trained a separate model for an allotted number of blocks. In total, 8 models were trained, each with one of the following block allotments: [1, 2, 5, 10, 15, 20, 25, 28]. Each block comprised an average of 50 sentences recorded in one continuous session.
Quantification of silent speech synthesis.
By definition, there was no acoustic signal to compare the decoded silent speech. In order to assess decoding performance, we evaluated decoded silent speech in regards to the audible speech of the same sentence uttered immediately prior to the silent trial. We did so by dynamically time-warping49 the decoded silent speech MFCCs to the MFCCs of the audible condition and computing Pearson’s correlation coefficient and Mel-cepstral distortion.
Phoneme acoustic similarity analysis.
We compared the acoustic properties of decoded phonemes to ground-truth to better understand the performance of our decoder. To do this, we sliced all time points for which a given phoneme was being uttered and used the corresponding time slices to estimate its distribution of spectral properties. With principal components analysis (PCA), the 32 spectral features were projected onto the first 4 principal components before fitting the gaussian kernel density estimate (KDE) model. This process was repeated so that each phoneme had two KDEs representing either its decoded and or ground-truth spectral properties. Using Kullback-Leibler divergence (KL divergence), we compared each decoded phoneme KDE to every ground-truth phoneme KDE, creating an analog to a confusion matrix used in discrete classification decoders. KL divergence provides a metric of how similar two distributions are to one another by calculating how much information is lost when we approximate one distribution with another. Lastly, we used Ward’s method for agglomerative hierarchical clustering to organize the phoneme similarity matrix.
To understand whether the clustering of the decoded phonemes was similar to the clustering of ground-truth phoneme pairs (Extended Data Figure 7), we used the cophenetic correlation (CC) to assess how well the hierarchical clustering determined from decoded phonemes preserved the pairwise distance between original phonemes, and vice versa24. For the decoded phoneme dendrogram, the CC for preserving original phoneme distances was 0.71 as compared to 0.80 for preserving decoded phoneme distances. For the original phoneme dendrogram, the CC for preserving decoded phoneme distances was 0.64 as compared to 0.71 for preserving original phoneme distances. p<1e-10 for all correlations.
State-space kinematic trajectories.
For state-space analysis of kinematic trajectories, principal components analysis (PCA) was performed on the 33 kinematic features using the training data set from P1. Figure 4a,b shows kinematic trajectories (original, decoded (audible and mimed) projected onto the first two principal components (PCs). The example decoded mimed trajectory occurred faster in time by a factor of 1.15 than the audible trajectory so we uniformly temporally stretched the trajectory for visualization. The peaks and troughs of the decoded mimed trajectories were similar to the audible speech trajectory (r=0.65, r=0.55) although the temporal locations are shifted relative to one another, likely because the temporal evolution of a production, whether audible or mimed, is inconsistent across repeated productions. To quantify the decoding performance of mimed trajectories, we used the dynamic time-warping approach described above, although in this case, temporally warping with respect to the inferred kinematics (not the state-space) (Figure 4e).
For analysis of state-space trajectories across participants (Figure 4f), we measured the correlations of productions of the same sentence, but across participants. Since the sentences were produced at different speeds, we dynamically time-warped them to match and compared against correlations of dynamically time-warped mismatched sentences.
Code Availability.
All code may be freely obtained for non-commercial use by contacting the corresponding authors.
Extended Data
Extended Data Figure 1:
a,b Median spectrograms, time-locked to the acoustic onset of phonemes from original (a) and decoded (b) audio (n: /i/ = 112, /z/ = 115, /p/ 69, /ae/ = 86). These phonemes represent the diversity of spectral features. Original and decoded median phoneme spectrograms were well correlated (Pearson’s r > 0.9 for all phonemes, p=1e-18)
Extended Data Figure 2: Transcription word error rate for individual trials.
Word error rates (WER) for individually transcribed trials for 25 (a) and 50 (b) word pool size. Listeners transcribed synthesized sentences by selecting words from a defined pool of words. Word pools included correct words in synthesized sentence and random words from the test set. One trial is one listener transcription of one synthesized sentence.
Extended Data Figure 3: Electrode array locations for participants.
MRI reconstructions of participants’ brains with overlay of electrocorticographic electrode (ECoG) array locations.
Extended Data Figure 4: Decoding performance of kinematic and spectral features.
Data from P1. a, Correlations of all 33 decoded articulatory kinematic features with ground-truth (n=101 sentences). EMA features represent X and Y coordinate traces of articulators (lips, jaw, and three points of the tongue) along the midsagittal plane of the vocal tract. Manner features represent complementary kinematic features to EMA that further describe acoustically consequential movements. b, Correlations of all 32 decoded spectral features with ground-truth (n=101 sentences). MFCC features are 25 mel-frequency cepstral coefficients that describe power in perceptually relevant frequency bands. Synthesis features describe glottal excitation weights necessary for speech synthesis. Box plots as described in Figure 2.
Extended Data Figure 5: Comparison of cumulative variance explained in kinematic and acoustic state-spaces.
For each representation of speech—kinematics and acoustics—principal components analysis (PCA) was computed and variance explained for each additional principal component was cumulatively summed. Kinematic and acoustic representations had 33 and 32 features, respectively.
Extended Data Figure 6: Decoded phoneme acoustic similarity matrix.
Acoustic similarity matrix compares acoustic properties of decoded phonemes and originally spoken phonemes. Similarity is computed by first estimating a gaussian kernel density for each phoneme (both decoded and original) and then computing the Kullback-Leibler (KL) divergence between a pair of decoded and original phoneme distributions. Each row compares the acoustic properties of a decoded phoneme with originally spoken phonemes (columns). Hierarchical clustering was performed on the resulting similarity matrix. Data from P1.
Extended Data Figure 7: Ground-truth acoustic similarity matrix.
Compares acoustic properties of ground-truth spoken phonemes with one another. Similarity is computed by first estimating a gaussian kernel density for each phoneme and then computing the Kullback-Leibler (KL) divergence between a pair of a phoneme distributions. Each row compares the acoustic properties of a two ground-truth spoken phonemes. Hierarchical clustering was performed on the resulting similarity matrix. Data from P1.
Extended Data Figure 8: Comparison between decoding novel and repeated sentences.
Comparison metrics were spectral distortion (a) and correlation between decoded and original spectral features (b). Decoder performance for these two types of sentences was compared to find no difference (p=0.36, p=0.75, n=51 sentences, Wilcoxon signed-rank test). A novel sentence consists of words and/or a word sequence not present in the training data. A repeated sentence is a sentence that has at least one matching word sequence in the training data, although unique production. Comparison was performed on P1 and sentences evaluated were the same across both cases with two decoders trained on differing datasets to either exclude or include unique repeats of sentences in the test set. ns indicates p>0.05. Box plots as described in Figure 2.
Extended Data Figure 9: Kinematic state-space trajectories for phoneme-specific vowel-consonant transitions.
Average trajectories of PC1 and PC2 for transitions from a either a consonant or vowel to a specific phonemes. Trajectories are 500 ms and centered at transition between phonemes. a, Consonant -> corner vowels (n=1387, 1964, 2259, 894, respectively). PC1 shows separation of all corner vowels and PC2 delineates between front vowels (iy, ae) and back vowels (uw, aa). b, vowel -> unvoiced plosives (n=2071, 4107, 1441, respectively). PC1 was more selective for velar constriction (k) and PC2 for bilabial constriction (p). c Vowel -> alveolars (n=3919, 3010, 4107, respectively). PC1 shows separation by manner of articulation (nasal, plosive, fricative) while PC2 is less discriminative. d, PC1 and PC2 show little, if at all, delineation between voiced and unvoiced alveolar fricatives (n=3010, 1855, respectively).
Supplementary Material
Acknowledgments
We thank Matthew Leonard, Neal Fox, David Moses for their helpful comments on the manuscript. We also thank Ben Speidel for his work reconstructing MRI images of patients’ brains. This work was supported by grants from the NIH (DP2 OD008627 and U01 NS098971-01). E.F.C is a New York Stem Cell Foundation- Robertson Investigator. This research was also supported by The New York Stem Cell Foundation, the Howard Hughes Medical Institute, The McKnight Foundation, The Shurl and Kay Curci Foundation, and The William K. Bowes Foundation.
The data that support the findings of this study are available from the corresponding author upon request. All code may be freely obtained for non-commercial use by contacting the corresponding author.
Footnotes
The authors declare no competing interests.
References:
- 1.Fager SK, Fried-Oken M, Jakobs T, & Beukelman DR (2019). New and emerging access technologies for adults with complex communication needs and severe motor impairments: State of the science, Augmentative and Alternative Communication, DOI: 10.1080/07434618.2018.1556730 [DOI] [PMC free article] [PubMed] [Google Scholar]
- 2.Brumberg JS, Pitt KM, Mantie-Kozlowski A, & Burnison JD (2018). Brain–computer interfaces for augmentative and alternative communication: A tutorial. American Journal of Speech-Language Pathology, 27, 1–12. doi: 10.1044/2017_AJSLP-16-0244 [DOI] [PMC free article] [PubMed] [Google Scholar]
- 3.Pandarinath C, Nuyujukian P, Blabe CH, Sorice BL, Saab J, Willett FR, … Henderson JM (2017). High performance communication by people with paralysis using an intracortical brain-computer interface. ELife, 6, 1–27. doi: 10.7554/eLife.18554 [DOI] [PMC free article] [PubMed] [Google Scholar]
- 4.Guenther FH, Brumberg JS, Joseph Wright E, Nieto-Castanon A, Tourville JA, Panko M, … Kennedy PR (2009). A wireless brain-machine interface for real-time speech synthesis. PLoS ONE, 4(12). 10.1371/journal.pone.0008218 [DOI] [PMC free article] [PubMed] [Google Scholar]
- 5.Bocquelet F, Hueber T, Girin L, Savariaux C, & Yvert B. (2016). Real-time control of an articulatory-based speech synthesizer for brain computer interfaces. PLoS computational biology, 12(11), e1005119. [DOI] [PMC free article] [PubMed] [Google Scholar]
- 6.Browman CP, & Goldstein L. (1992). Articulatory phonology: An overview. Phonetica, 49(3–4), 155–180. [DOI] [PubMed] [Google Scholar]
- 7.Sadtler PT, Quick KM, Golub MD, Chase SM, Ryu SI, Tyler-Kabara EC, … & Batista AP (2014). Neural constraints on learning. Nature, 512(7515), 423. [DOI] [PMC free article] [PubMed] [Google Scholar]
- 8.Golub MD, Sadtler PT, Oby ER, Quick KM, Ryu SI, Tyler-Kabara EC, … & Yu BM (2018). Learning by neural reassociation. Nat. Neurosci, 21. [DOI] [PMC free article] [PubMed] [Google Scholar]
- 9.Graves A, & Schmidhuber J. (2005). Framewise phoneme classification with bidirectional LSTM and other neural network architectures. Neural Networks, 18(5–6), 602–610. [DOI] [PubMed] [Google Scholar]
- 10.Crone NE, Hao L, Hart J Jr., Boatman D, Lesser RP, Irizarry R, and Gordon B. (2001). Electrocorticographic gamma activity during word production in spoken and sign language. Neurology 57, 2045–2053. [DOI] [PubMed] [Google Scholar]
- 11.Nourski KV, Steinschneider M, Rhone AE, Oya H, Kawasaki H, Howard III MA, & McMurray B. (2015). Sound identification in human auditory cortex: Differential contribution of local field potentials and high gamma power as revealed by direct intracranial recordings. Brain and language, 148, 37–50. [DOI] [PMC free article] [PubMed] [Google Scholar]
- 12.Pesaran B, Vinck M, Einevoll GT, Sirota A, Fries P, Siegel M, … & Srinivasan R. (2018). Investigating large-scale brain dynamics using field potential recordings: analysis and interpretation. Nature neuroscience. [DOI] [PMC free article] [PubMed] [Google Scholar]
- 13.Bouchard KE, Mesgarani N, Johnson K, and Chang EF (2013). Functional organization of human sensorimotor cortex for speech articulation. Nature 495, 327–332. [DOI] [PMC free article] [PubMed] [Google Scholar]
- 14.Mesgarani N, Cheung C, Johnson K, & Chang EF (2014). Phonetic feature encoding in human superior temporal gyrus. Science, 343(6174), 1006–1010. [DOI] [PMC free article] [PubMed] [Google Scholar]
- 15.Flinker A, Korzeniewska A, Shestyuk AY, Franaszczuk PJ, Dronkers NF, Knight RT, & Crone NE (2015). Redefining the role of Broca’s area in speech. Proceedings of the National Academy of Sciences, 112(9), 2871–2875. [DOI] [PMC free article] [PubMed] [Google Scholar]
- 16.Chartier J, Anumanchipalli GK, Johnson K, & Chang EF (2018). Encoding of Articulatory Kinematic Trajectories in Human Speech Sensorimotor Cortex. Neuron, 98(5), 1042–1054.e4. 10.1016/j.neuron.2018.04.031 [DOI] [PMC free article] [PubMed] [Google Scholar]
- 17.Mugler EM, Tate MC, Livescu K, Templer JW, Goldrick MA, & Slutzky MW (2018) Differential Representation of Articulatory Gestures and Phonemes in Precentral and Inferior Frontal Gyri. J Neurosci. 38(46):9803–9813. doi: 10.1523/JNEUROSCI. [DOI] [PMC free article] [PubMed] [Google Scholar]
- 18.Huggins JE, Wren PA, Gruis KL (2011) What would brain-computer interface users want? Opinions and priorities of potential users with amyotrophic lateral sclerosis. Amyotroph Lateral Scler. 2011 Sep;12(5):318–24. doi: 10.3109/17482968.2011.572978. [DOI] [PMC free article] [PubMed] [Google Scholar]
- 19.Luce PA & Pisoni DB Recognizing spoken words: the neighborhood activation model. Ear Hear. 19, 1–36 (1998). [DOI] [PMC free article] [PubMed] [Google Scholar]
- 20.Wrench A. (1999). MOCHA: multichannel articulatory database. http://www.cstr.ed.ac.uk/research/projects/artic/mocha.html.
- 21.Kominek J, Schultz T, and Black A. (2008). “Synthesizer voice quality of new languages calibrated with mean mel cepstral distortion”, In SLTU-2008, 63–68. [Google Scholar]
- 22.Davis SB, & Mermelstein P. (1990). Comparison of parametric representations for monosyllabic word recognition in continuously spoken sentences. In Readings in speech recognition (pp. 65–74). [Google Scholar]
- 23.Gallego JA, Perich MG, Miller L,E, Solla S,A, (2017) Neural manifolds for the control of movement., Neuron, 94(5), 978–984. [DOI] [PMC free article] [PubMed] [Google Scholar]
- 24.Sokal RR, & Rohlf FJ (1962). The comparison of dendrograms by objective methods. Taxon, 33–40. [Google Scholar]
- 25.Brumberg JS, Krusienski DJ, Chakrabarti S, Gunduz A, Brunner P, Ritaccio AL, & Schalk G. (2016). Spatio-Temporal Progression of Cortical Activity Related to Continuous Overt and Covert Speech Production in a Reading Task. PloS one, 11(11), e0166872. doi: 10.1371/journal.pone.0166872 [DOI] [PMC free article] [PubMed] [Google Scholar]
- 26.Martin S, Brunner P, Holdgraf C, Heinze H-J, Crone NE, Rieger J, Schalk G, Knight RT, Pasley BN (2014). Decoding spectrotemporal features of overt and covert speech from the human cortex. Front. Neuroeng 7:14. [DOI] [PMC free article] [PubMed] [Google Scholar]
- 27.Mugler EM, Patton JL, Flint RD, Wright ZA, Schuele SU, Rosenow J, Shih JJ, Krusienski DJ, and Slutzky MW (2014). Direct classification of all American English phonemes using signals from functional speech motor cortex. J. Neural Eng 11, 035015. [DOI] [PMC free article] [PubMed] [Google Scholar]
- 28.Herff C, Heger D, de Pesters A, Telaar D, Brunner P, Schalk G, and Schultz T. (2015). Brain-to-text: decoding spoken phrases from phone representations in the brain. [DOI] [PMC free article] [PubMed] [Google Scholar]
- 29.Moses DA, Mesgarani N, Leonard MK, & Chang EF (2016). Neural speech recognition: continuous phoneme decoding using spatiotemporal representations of human cortical activity. Journal of neural engineering, 13(5), 056004. [DOI] [PMC free article] [PubMed] [Google Scholar]
- 30.Pasley BN, David SV, Mesgarani N, Flinker A, & Shamma SA (2012). Reconstructing Speech from Human Auditory Cortex. PLoS Biol, 10(1), 1001251. 10.1371/journal.pbio.1001251 [DOI] [PMC free article] [PubMed] [Google Scholar]
- 31.Akbari H, Khalighinejad B, Herrero JL, Mehta AD, & Mesgarani N. (2019). Towards reconstructing intelligible speech from the human auditory cortex. Scientific reports, 9(1), 874. [DOI] [PMC free article] [PubMed] [Google Scholar]
- 32.Dichter BK, Breshears JD, Leonard MK, and Chang EF (2018) The Control of Vocal Pitch in Human Laryngeal Motor Cortex. Cell, 174, 21–31. [DOI] [PMC free article] [PubMed] [Google Scholar]
- 33.Wessberg J, Stambaugh CR, Kralik JD, Beck PD, Laubach M, et al. (2000) Real-time prediction of hand trajectory by ensembles of cortical neurons in primates. Nature 408: 361–365. [DOI] [PubMed] [Google Scholar]
- 34.Serruya MD, Hatsopoulos NG, Paninski L, Fellows MR, Donoghue JP (2002) Instant neural control of a movement signal. Nature 416: 141–142. [DOI] [PubMed] [Google Scholar]
- 35.Taylor DM, Tillery SI, Schwartz AB (2002) Direct cortical control of 3D neuroprosthetic devices. Science 296: 1829–1832. [DOI] [PubMed] [Google Scholar]
- 36.Hochberg LR, Serruya MD, Friehs GM, Mukand JA, Saleh M, Caplan AH, … & Donoghue JP (2006). Neuronal ensemble control of prosthetic devices by a human with tetraplegia. Nature, 442(7099), 164. [DOI] [PubMed] [Google Scholar]
- 37.Collinger JL, Wodlinger B, Downey JE, Wang W, Tyler-Kabara EC, Weber DJ, … & Schwartz AB (2013). High-performance neuroprosthetic control by an individual with tetraplegia. The Lancet, 381(9866), 557–564. [DOI] [PMC free article] [PubMed] [Google Scholar]
- 38.Aflalo T, Kellis S, Klaes C, Lee B, Shi Y, Pejsa K, … & Andersen RA (2015). Decoding motor imagery from the posterior parietal cortex of a tetraplegic human. Science, 348(6237), 906–910. [DOI] [PMC free article] [PubMed] [Google Scholar]
- 39.Ajiboye AB, Willett FR, Young DR, Memberg WD, Murphy BA, Miller JP, … & Peckham PH (2017). Restoration of reaching and grasping movements through brain-controlled muscle stimulation in a person with tetraplegia: a proof-of-concept demonstration. The Lancet, 389(10081), 1821–1830. [DOI] [PMC free article] [PubMed] [Google Scholar]
- 40.Prahallad K, Black AW, & Mosur R. (2006). Sub-phonetic modeling for capturing pronunciation variations for conversational speech synthesis. In Proceedings of the 2006 IEEE International Conference on Acoustics Speech and Signal Processing (ICASSP), pp. I–I. [Google Scholar]
- 41.Anumanchipalli GK, Prahallad K, & Black AW (2011). Festvox: Tools for creation and analyses of large speech corpora, Workshop on Very Large Scale Phonetics Research, UPenn, Philadelphia. http://www.festvox.org [Google Scholar]
- 42.Hamilton LS, Chang DL, Lee MB, & Chang EF (2017). Semi-automated Anatomical Labeling and Inter-subject Warping of High-Density Intracranial Recording Electrodes in Electrocorticography. Frontiers in Neuroinformatics, 11, 62. 10.3389/fninf.2017.00062 [DOI] [PMC free article] [PubMed] [Google Scholar]
- 43.Richmond K, Hoole P, & King S. (2011). Announcing the electromagnetic articulography (Day 1) subset of the mngu0 articulatory corpus Proceedings of Interspeech 2011, Florence, Italy [Google Scholar]
- 44.Paul BD, & Baker M,J (1992). The design for the wall street journal-based CSR corpus. In Proceedings of the workshop on Speech and Natural Language (HLT ‘91). Association for Computational Linguistics, Stroudsburg, PA, USA, 357–362. DOI: 10.3115/1075527.1075614 [DOI] [Google Scholar]
- 45.Abadi Martín, Agarwal Ashish, Barham Paul, Brevdo Eugene, Chen Zhifeng, et al. (2015). TensorFlow: Large-scale machine learning on heterogeneous systems. http://www.tensorflow.org
- 46.Hochreiter S, and Schmidhuber J. (1997). Long short-term memory. Neural Comput. 9, 1735–1780. [DOI] [PubMed] [Google Scholar]
- 47.Maia R, Toda T, Zen H, Nankaku Y, Tokuda K, 2007. An excitation model for HMM-based speech synthesis based on residual modeling. In: Proc. ISCA SSW6, pp. 131–136. [Google Scholar]
- 48.Wolters MK, Isaac, Renals S, Evaluating Speech Synthesis intelligibility using Amazon Mechanical Turk. (2010) In proceedings of ISCA speech synthesis workshop (SSW7), 2010. [Google Scholar]
- 49.Berndt DJ, & Clifford J. (1994). Us ing dynamic time warping to find patterns in time series. In KDD workshop (Vol. 10, No. 16, pp. 359–370). [Google Scholar]
Associated Data
This section collects any data citations, data availability statements, or supplementary materials included in this article.


