Abstract
One of the challenges of transcutaneous high intensity focused ultrasound (HIFU) therapies, especially ones relying heavily on shock formation such as boiling histotripsy (BH), is the loss of focusing from aberration induced by the heterogeneities of the body wall. Here, a methodology to execute aberration correction in vivo is proposed. A custom BH system consisting of a 1.5 MHz phased array of 256 elements connected to a Verasonics V1 system is used in pulse/echo mode on a porcine model under general anaesthesia. Estimation of the time shifts needed to correct for aberration in the liver and kidney is done by maximizing the value of the coherence factor on the acquired backscattered signals. As this process requires multiple pulse/echo sequences on a moving target in order to converge to a solution, tracking is also implemented to ensure that the same target is used between each iteration. The method was validated by comparing the acoustic power needed to generate a boiling bubble at one target with aberration correction and at another target within a 5 mm radius without aberration correction. Results show that aberration correction effectively lowers the acoustic power required to reach boiling by up to 45%, confirming that it indeed restored formation of the nonlinear shock front at the focus.
Keywords: Histotripsy, aberration correction
I. Introduction
Transcutaneous high intensity focused ultrasound (HIFU) therapies allow for noninvasive thermal or mechanical ablation of multiple abdominal targets, including tumors in the liver, kidney, and pancreas [1], [2]. On the way to the target, the HIFU beam typically propagates through multiple layers of tissue of different thickness and with varying sound speed. Due to the ensuing variation of relative time shifts along the HIFU wavefront, i.e. aberration, the focal waveform is distorted and decreased in amplitude, the focal area is widened and spatially shifted, and the side lobes are enhanced [3]–[7]. Perinephric and subcutaneous fat has the lowest sound speed of all soft tissues and as a consequence, the precision, efficacy, and safety of HIFU thermal treatment of targets such as kidney [5] and breast [8] are especially affected by aberration. For mechanical HIFU ablation approaches relying heavily on shock formation at the focus such as boiling histotripsy (BH) [9] and shock-scattering histotripsy [10], aberration is a major challenge that can prevent the formation of shock fronts of sufficient amplitude to generate the boiling bubble or bubble cloud required for the treatment [11].
The use of HIFU multi-element arrays may allow for compensation of aberrations by introducing appropriate time delays at different array elements, and several approaches to identify those delays have been proposed [12]–[18]. In one method, the phases on HIFU array elements are varied to maximize the acoustic radiation force [12]–[14]; however, this method was impractical to implement for arrays with a high number of elements, as it requires the emission of a large number of pulses (4N pulses for an array of N elements) for effective correction. To our knowledge, these methods were also never applied in vivo. Alternatively, aberration correction using a cavitation bubble nucleated in tissue at the focus as a reflective target for time reversal was also demonstrated [15]–[17]. However, those methods are destructive and also have high power requirements to the HIFU transducer to achieve necessary in situ negative pressures to reliably generate the cavitation bubble at the focus [19], [20].
Recently we have reported on an aberration correction approach adapted from ultrasound imaging [21] that relies on using the HIFU array in the pulse/echo mode with pulse inversion to detect the second harmonic of signal backscattered from the focus [18]. The algorithm used was a hybrid of two aberration correction methods, namely the nearest neighbor correlation [22] and beamsum correlation [23], where the beamsum is obtained by summing the backscatter signal received by each element of the array. The echo signals from diffuse scatterers received by the array elements were cross-correlated between the nearest neighbors or with the beamsum, and the lags corresponding to the maximum correlation were used to estimate the time delays resulting from aberrations. These estimated delays were then subtracted from the array elements, and the correction process was repeated iteratively until a convergence of the delays estimate was reached.
In the in vitro and ex vivo settings, this approach was found to reliably converge toward an estimation of the time delays required to restore the focus to almost non-aberrated level, hence with the shock necessary to BH treatment, with an average of 8 iterations and with time of at least 300 ms between each iteration needed for computation. Thus, the approach was shown to be very promising in tissue phantoms and ex vivo, but not without challenges that could be foreseen for its application in vivo. First, similarly to the case of tissue imaging, the algorithm relied on the harmonic backscatter from a group of diffuse random scatterers located within the focal area, and the method would refocus the beam toward the strongest scatterer which was not necessarily located at the focus [22]. Therefore, the result of the correction contained a beam steering component. While the resulting HIFU focus shift was typically quite small (under 1 mm transversely and 3 mm axially) and could be neglected in most cases, this translated into larger inter-element time delays and phase wraps during the correction, complicating the process. Second, the algorithm required acquiring backscatter signals from the same group of scatterers at each iteration in order to converge, so as to keep the steering component of the correction constant. This appeared problematic for in vivo implementation in the presence of respiratory and cardiac tissue motion. Interestingly, in the context of ultrasound imaging those challenges had lead to abandoning aberration correction approaches altogether in favor of tissue harmonic imaging (THI) that worked faster and was easier to implement while providing acceptable improvement in image quality [24].
The objective of this work was to address the aforementioned challenges in the context of HIFU treatment and demonstrate the feasibility of this aberration correction algorithm in vivo. First, a method to find an estimate of the HIFU beam steering component and remove it during the aberration correction was developed. Second, a target tracking method was implemented to gate the aberration correction pulses so as to acquire echoes from the same set of scatterers in the presence of cyclic movement in vivo. Finally, the performance of the method was tested in vivo by transcutaneously targeting porcine liver and kidney with a 256-element HIFU array. The correction quality was evaluated by comparing the transducer acoustic power required to generate a boiling bubble at the HIFU focus by a 10 ms pulse with and without aberration correction.
II. Materials and Methods
A. HIFU Apparatus
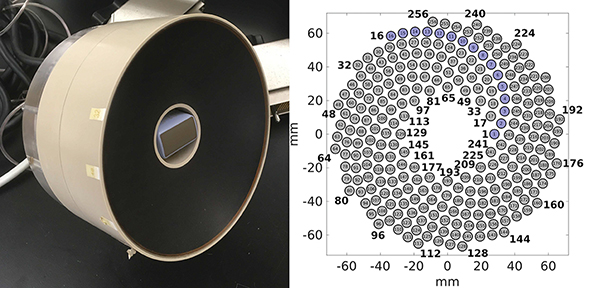
The HIFU transducer used in this study has been described in detail in previous publications from our group [25], [26]. Briefly, it was a 1.5 MHz, 256-element spiral array made of composite piezoelectric material (Imasonic, Voray sur l’Ognon, France), and is shown in Fig. 1. The outer diameter of the array was 144 mm, its nominal focal distance was 120 mm, and a coaxial ultrasound imaging probe (3PE, Humanscan, Gyeonggi-do, South Korea) was inserted in the central opening of 40 mm diameter. The circular elements had a 7 mm diameter, and were arranged in 16 spiral branches, each containing 16 elements as shown in Fig. 1(b). This HIFU array could deliver high amplitude shock fronts at the focus, up to 100 MPa in water.
Fig. 1:
(a) Photograph of the 256-element HIFU array with its inline imaging probe. (b) Layout of the array elements with one of the 16 spiral arms shown in blue.
The electrically matched HIFU array was connected to a modified 4-board V1 Verasonics (V-1 Ultrasound Acquisition platform, Verasonics Inc, Kirkland, WA, USA) with HIFU option consisting of the addition of an external 1200 W DC power supply (QPX600DP, Aim-TTI, Huntingdon, U.K.). The modification consisted of seven electrolytic capacitors identical to the internal DC supply capacitor of the system (B41560A9159M000, EPCOS, Munich, Germany) connected in parallel with the external DC power supply, allowing for the sustained delivery of 3.7 kW electric power for a duration of up to 10 ms with a maximum duty cycle of 2%.
The ultrasound phased array imaging probe was connected to a separate 2-board V1 Verasonics system, and operated in standard B-mode at 4.5 MHz, 128 scan lines at 30 fps. The position of the HIFU focus was pre-registered with the system and displayed on the image as a red cross for targeting. The imaging probe was only used for targeting and had no role in the aberration correction algorithm.
B. Signal Acquisition
The signals needed to perform aberration correction were acquired by sending pulse/echo sequences with the HIFU array. A single period of a square electrical input was sent to the array with a central frequency of 1.5 MHz and acoustic power equivalent to a continuous-wave excitation between 68 W to 1042 W, depending on the target depth and associated attenuation and aberration of the HIFU beam. At those acoustic power levels, the in situ waveform was nonlinearly distorted, facilitating the use of backscattered harmonics to reduce the size of the focal region and thus improve the precision and quality of aberration correction, as previously demonstrated [18]. Specifically, the second harmonic was chosen as the signal of interest, and as such at 68 W acoustic power the peak positive pressure at the focus was 12 MPa, the length of the focal region at −6 dB level was 4.6 mm and its width at the same level was 0.6 mm in free field in water [18].
In order to improve the signal-to-noise ratio of the second harmonic of the backscattered signal, a pulse-inversion scheme [27] was used similarly to our prior work [18]. Two imaging pulses with the same driving voltage, but opposite polarity (the second pulse was an inverted copy of the first one), were sent and received. The two signals were then directly summed in the buffer of the Verasonics system, resulting in its first and third harmonics canceling out, and its second harmonic doubling in value. The acquired signals were sampled at 45 MHz and filtered using a digital Gaussian filter with a center frequency of 3 MHz and a bandwidth of 1.25 MHz at −6 dB level. Only the signals arriving from the limited depth range of ±9 mm from the geometric focus of the array were acquired. Finally the signal was interpolated using a cubic spline interpolation with a factor 16 that was then used in the aberration correction procedure; these data will be referred to as ‘received backscattered signals si(t)’ or ‘RF signals’ throughout the manuscript.
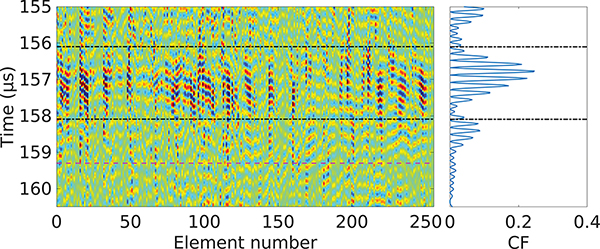
When a pulse/echo sequence was sent through an aberrative medium - such as a body wall - into the scattering target tissue, the received backscattered signals on each element of the array had varying delays between them, as visualized in Fig. 2. In order to quantitatively estimate the level of aberration of the received signal, we evaluated the coherence factor [28] around the focus of the transducer:
| (1) |
where CF(t) is the coherence factor, si(t) is the received backscatter signal of the element number i of the HIFU array, N = 256 is the number of elements of the array, and t is the time. The coherence factor gave a dimensionless measure of the aberration impact on focusing, and its value was independent from the amplitudes of the RF signals, thus making it reliable as a measure of aberration. The region of interest (ROI) [T0, T1] to be used in the aberration correction algorithm was centered around the maximum of CF, with length similar to the length of the imaging pulse sent, here 2μs. An example of the CF in the case of propagation through an inhomogeneous medium is shown in Fig. 2. The maximum possible value of the CF is defined by the van Cittert-Zernike theorem [29], which defines the maximum correlation possible between two elements of the array. Here, the HIFU array being spherically focused, a signal originating from the HIFU focus and without aberration would arrive synchronously at all elements of the array. This translates to the maximum value of the coherence factor being equal to 1.
Fig. 2:
RF signals si(t) of the array elements (vertical colored lines in the left diagram) and their corresponding coherence factor CF(t) (right plot) acquired from porcine liver in vivo. The area between the dash-dot black lines corresponds to the region of interest for the aberration correction, and the dashed line in magenta corresponds to the arrival time of the signals backscattered from the geometric focus of the HIFU array.
C. Aberration Correction Method
Aberration correction implies estimation of the time shift error on each element of the HIFU array in order to compensate for it. We previously adapted an aberration correction algorithm originally developed for ultrasound imaging to the same transducer array and tested it in vitro [18]. In this algorithm, the 3D transducer array elements were unwrapped into a 1D path in order to be able to use nearest neighbor cross correlation. However, the lower quality of the RF signals from in vivo conditions resulted in poor cross correlation on certain parts of the unwrapped path, sometimes leading to low correction quality and phase wraps. Therefore, a more reliable algorithm that accounted for the 2D spatial distribution of the elements, was implemented here.
As such, the algorithm for aberration correction used here has been adapted to the HIFU array from an algorithm developed for 2D ultrasound imaging array by Liu and Waag [30]. Since this aberration correction algorithm relies on cross correlation of the backscatter signals from neighboring elements, it refocuses toward the strongest scatterers [22]; which translates into maximizing the beamsum [23].
As the aberration correction algorithm naturally refocused, and thus steered, toward the strongest scatterer, before compensating for aberrations we estimated those steering delays and removed them from the RF signals to be used in the aberration correction algorithm. This would bring two benefits: the inter-element delays would be lower, reducing greatly the risk of phase wraps during the inter-element cross correlations; and also those estimated steering delays would be removed from the final aberration correction delays, minimizing the impact that aberration correction has on the targeting accuracy [18]. To estimate the (x, y, z) steering component of the scatterer, which was contained within the focal region of the second harmonic, we used an approximation that there were no aberrations, i.e., the scatterers were in a homogeneous medium with a known speed of sound c0. We could then, based on delay-and-sum procedure, determine (x, y, z) by solving the following optimization problem:
| (2) |
where the parameters to be optimized (x, y, z) correspond to the steered position of the HIFU array focus relative to the center of curvature of the transducer (i.e. the array’s geometric focus position of the array in water without aberrations, (0, 0, 0)), τs are the delays resulting from the steered focus position, (xi, yi, zi) are the coordinates of the center of the i-th element of the HIFU array relative to the center of curvature of the transducer, c0 is the sound speed in water chosen here as 1500 m/s, and T0 and T1 are the arrival times corresponding to the start and end of the region of interest, respectively. The objective function Φ(x, y, z) corresponds to the integral over the region of interest of the squared beamsum of the RF data accounting for the steering delays introduced. As presented earlier, the region of interest was chosen as centered on the area of RF signals presenting the highest value of coherence factor close to the geometric focus position, and its size was set as approximately the length of the pulse sent, which is here about 2 μs, as shown in Fig. 2. The optimization was also constrained to a space defined here by xm = ym = 1.2 mm and zm = 9 mm, which corresponds to twice the size of the unaberrated focal volume at the second harmonic of the HIFU transducer.
As there were only 3 parameters to be optimized - the estimated steering component coordinates (x, y, z) - this optimization problem could be solved quickly using various methods. Here, the objective function Φ was derivable with its gradient being:
| (3) |
where Ai is the distance between the i element of the array and the steered focus, i.e. , and the value of was determined numerically using the derivative of the cubic spline interpolation. Thus, a gradient-based optimization algorithm, SLSQP [31], [32] from the NLOpt [33] nonlinear optimization library, was run to find the resulting steering component estimation (x, y, z). For the first pulse/echo iteration, the initial guess of the parameters to be optimized was set as x = y = z = 0. As the same region of interest - and thus the same group of scatterers - is targeted at each iteration, the steering position value would vary by less than 5% relative to the previous iteration. Therefore, in subsequent iterations, the value of (x, y, z) of the previous iteration was used as the initial guess for the optimization problem for faster convergence.
Once the optimal parameters (x, y, z) were found, the delays τs corresponding to the steering component estimation were removed from the RF signals that the aberration correction algorithm used. The next step of the algorithm was cross-correlating of the RF signal of each element with the RF signals from their nearest neighbor elements. Due to the spiral arrangement of the HIFU array, selecting neighboring elements was not as straightforward as in the case of a 2D grid array originally presented in [30]. Therefore, we chose a radius value rc as the maximum distance between two center points of elements for them to be considered neighbors. The value of rc should be as low as possible in order to have the best signal correlation between the elements, while also including elements in all directions - specifically here, it should include at least one element from the closest spiral branches as well as elements from its own spiral branch. As such, the value was set to rc = 8 mm, resulting in most elements having 4 neighbors - with two neighbors belonging to other spiral branches - and the border elements having at least 2 neighbors. This led to a total of 448 unique pairs of elements where RF signals were to be cross correlated using the normalized cross-correlation function shown in Eq. 4:
| (4) |
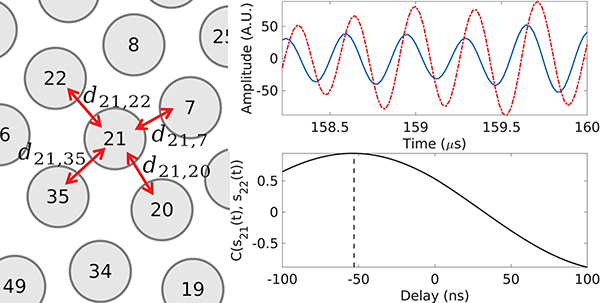
where i and j are the element numbers to be cross correlated. The maximum lag time of the cross correlation function was chosen as ±100 ns to avoid phase wraps. The relative delays dij between backscattered signals on two elements i and j backscattered signals was found as the lag at the peak value of the cross correlation , as illustrated in Fig. 3. In order to avoid errors from poorly correlated signals, the value of dij was set to 0 for cases where was less than 0.7.
Fig. 3:
Illustration of the calculation of the inter-element delay dij for the spiral array. The RF signals on elements 21 and 22 within the region of interest are plotted in blue and red, respectively. Their cross-correlation function is plotted in black, with the vertical dashed line corresponding to the value of delay d21,22 at the peak of the function.
Once all values of dij were found, the estimate of the correction time delays τc to be applied to each element in order to compensate for aberration could be calculated as by definition. However, the problem was overdetermined as we had 448 values for dij and only 256 values possible for τc. As such, the following least-mean-square cost function was solved instead to find the best fit:
| (5) |
where the value of the delay of element 1, , was set to 0 as to serve as a reference point. This problem can be easily solved using the ordinary least squares method, as in the original article [30]. Setting the value of arbitrarily did not impact the correction, as it was the relative time delays between the elements, imposed by difference in acoustic propagation path that impacted the focal waveform. As the Verasonics system required positive time delays input, the following operation was performed to impose , ∀k ∈ [1, 256]:
| (6) |
The sum of both the steering and aberration correction delays was then implemented on the HIFU array elements for the next pulse/echo iteration, and this process was repeated until the maximum of the coherence factor reached a plateau - the relevant criterion was a change of less than 2% from the previous iteration. Once the correction converged, the delays τc corresponding to the aberration correction were saved to be implemented for the HIFU treatment.
D. Tracking method
One of the main challenges of applying this aberration correction method in vivo was the need to acquire signals from the same set of scatterers at each pulse/echo iteration in the presence of tissue motion. Since the dominating tissue motions - respiratory and cardiac - are quasi-cyclic, it is possible to gate the aberration correction pulses at the same point of every cycle, and this requires a way to track the RF signals pattern within the ROI.
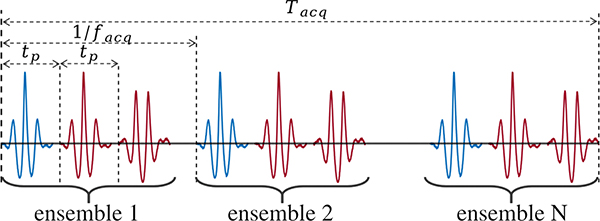
Therefore, a tracking pulse/echo sequence was introduced immediately preceding each aberration correction pulse/echo sequence at every iteration of the aberration correction process. The tracking pulses of the same amplitude as for the aberration correction were emitted by the HIFU transducer elements simultaneously at the fundamental frequency of 1.5 MHz without any time delays, and the backscattered echoes were acquired from the same region as that used in the aberration correction sequence, i.e. ± 9 mm axially around the geometric focus, with no filtering, as opposed to the previously described aberration correction procedure, where a pair of mutually inverted pulses is used with appropriate filtering of nonlinear harmonics by the pulse inversion algorithm. As presented in Fig. 4, following each tracking pulse the aberration correction imaging pulses were emitted with a time delay of tp = 220 μs to make sure that the pulses won’t interfere with each other, and the whole ensemble of pulses was repeated at a PRF of facq = 100 Hz for a total time Tacq = 4 s, with all the backscattered echoes from all ensembles saved for processing. The repetition period of 0.01 s corresponding to this PRF was short enough so that the movement of the body from pulse to pulse was negligible. The value of Tacq was chosen as slightly longer than the longest period of cyclic motion - the respiratory motion, which is 3–4 s in our case.
Fig. 4:
Acquisition sequence of the tracking ( ) and aberration correction with pulse inversion (
 ) pulses
The acquired backscattered echoes from the tracking pulse were used as a reference to find the same scatterers at each iteration of the aberration correction process. As cross correlation between the tracking echoes from each of the 256 elements would be computationally costly and slow, the beamsum was used instead:
| (7) |
where Si(t) is the unfiltered RF signal of the i-th element. For the first aberration correction iteration, a reference tracking signal was set as follows. We chose the set of scatterers that moved the least during the cyclic motion; this was done by cross-correlating the tracking beamsum signal within a small lag window of ± 120 ns with beamsums of a number of its preceding and following signals using the following cross correlation function:
| (8) |
The maxima of all resulting cross correlation functions were then summed to form a score :
| (9) |
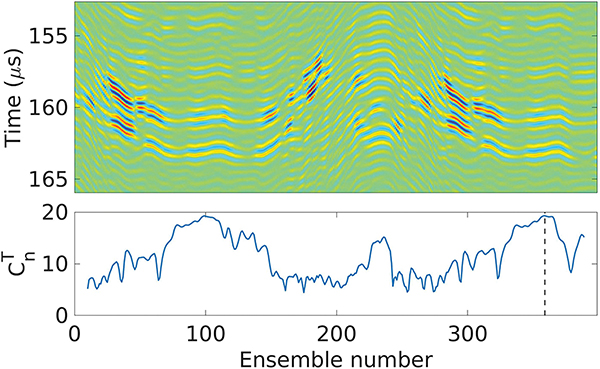
where n is the ensemble number and Np is the number of ensembles to consider for the scoring. Here we chose Np = 10, resulting in reaching a maximum for the group of scatterers that move the least during a 200 ms window, and thus its RF signals at that maximum were used for the first iteration of the aberration correction algorithm, and its tracking pulse/echo beamsum was saved as a reference for the following iterations. This process is illustrated in Fig. 5.
Fig. 5:
Top: tracking pulse/echo beamsums of each ensemble during one acquisition. Bottom: score calculated for each ensemble. The ensemble with the highest score - which tracking beamsum will serve as a reference for future iterations - is highlighted with a vertical dashed line.
For the remaining of the aberration correction iterations, the tracking pulse/echo beamsums of each ensemble were cross correlated only with the reference beamsum in Eq. 8, i.e.. The RF signals from the ensemble that yielded the maximum of cross correlation within a ± 120 ns window for t were used in the aberration correction algorithm for that iteration. If the maximum of the cross correlation was less that 0.9, a new acquisition was made, and if was less than 0.9 again the tracking was considered lost and the aberration correction process was canceled.
E. Experimental procedures
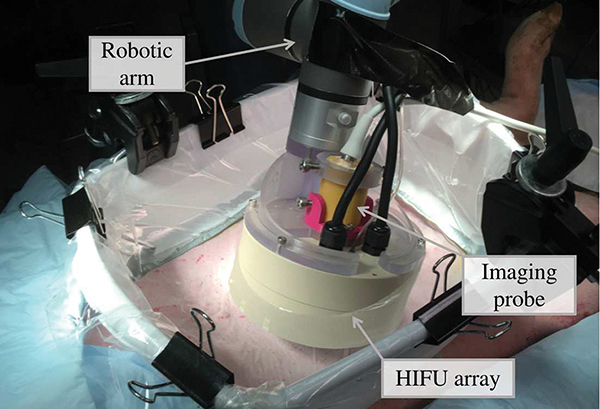
Aberration correction in vivo was performed when transcutaneously targeting the liver and kidneys of four female domestic swines weighting 43–47.3 kg. All procedures for the animal experiments followed the protocols approved by the Institutional Animal Care and Use Committee at the University of Washington. Before the experiment, the animal was pre-medicated with Telazol, then masked with isoflurane and intubated. Importantly, throughout the experiment the pigs were free-breathing, not ventilated. When targeting the liver, the pigs were placed on the surgical table in supine position, and when targeting of the kidney - in lateral position. The skin over the targeted organs was shaved, depilated, and cleaned. A thin plastic membrane supported by a solid plastic frame was filled with degassed water and coupled to the animal skin with ultrasound gel. The water was degassed below 10% oxygen saturation using a degassing and filtering system built in-house, and the gel was degassed via centrifugation. The HIFU transducer array and its inline ultrasound imaging were mounted on a robotic arm (UR3e, Universal Robots, Odense, Denmark) using a custom 3D-printed holder. A photograph of the setup of the experiment during the aberration correction is shown in Fig. 6.
Fig. 6:
Photograph of the experimental setup used for the in vivo aberration correction.
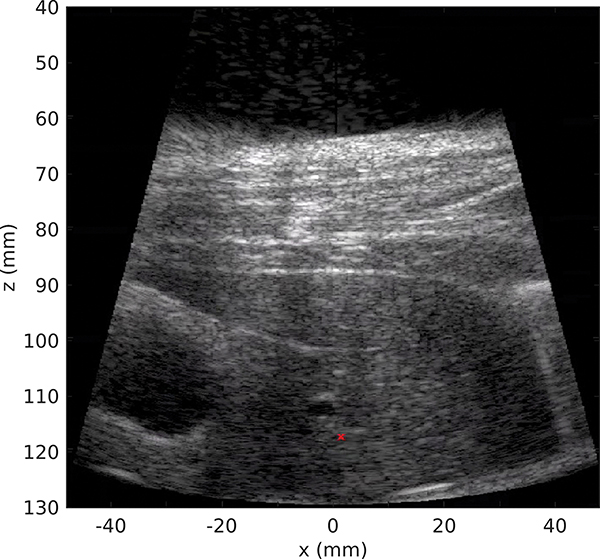
In this study both the liver and the kidney were targeted subcostally, i.e. in the areas that were unobstructed by the ribs. The thickness of the body wall ranged within 18–29 mm, and the depth of the targeted region ranged within 10–50 mm in the liver and around 10 mm in the kidney cortex. An example of the inline ultrasound image of the targeted area of the liver is shown in Fig 7. Throughout the duration of the experiment, the respiration rate ranged within 17 to 28 breaths/min and the heartbeat within 90 to 190 beats/min. Therefore, the longest period of tissue motion was about 3.5 seconds, which was shorter than the tracking acquisition time Tacq = 4 s.
Fig. 7:
B-mode ultrasound imaging of the bodywall and liver with the inline ultrasound probe of the HIFU transducer. The red cross represents the HIFU geometric focus position.
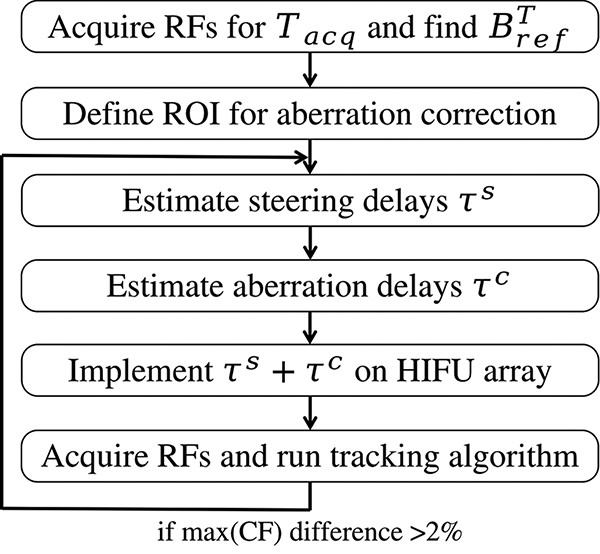
The aberration correction process is illustrated with a diagram in Fig. 8. First, the RF signals were selected within Tacq using the tracking algorithm as described in section II-D, also yielding a tracking reference beamsum for the following iterations of correction. The ROI for the aberration correction (the values of T0 and T1) was then selected, centered around the scatterers with the highest CF. The aberration correction process described in section II-C was then launched and ran iteratively until the convergence criterion was reached - difference of maximum of CF being lower than 2% between two iterations. The aberration correction algorithm and the tracking were implemented in MATLAB.
Fig. 8:
Flow diagram of the full aberration correction process during the experiments.
Overall, five areas in the liver and three areas in the kidney were targeted in this study, with at least 20 mm transversely between the areas located in the same organ, to ensure different levels of aberration. Once a target point was identified on inline ultrasound imaging, the aberration correction procedure described above was implemented, and the time delays τc for aberration correction were determined and applied to all elements of the HIFU array. The quality of correction was evaluated by measuring the HIFU transducer driving voltage sufficient for generating a boiling bubble at the focus with a 10 ms long pulse, i.e. the threshold of initiation of BH. As this HIFU array was fully characterized previously [25], the voltage threshold was converted to acoustic power when reporting the results. This threshold was then compared to the one without any aberration correction time delays implemented. The rationale for this metric of success is based on the boiling threshold being directly linked to the shock amplitude at the focus [34], which the correction procedure was meant to restore [18]. Thus, the boiling threshold was expected to be lower with correction than without it.
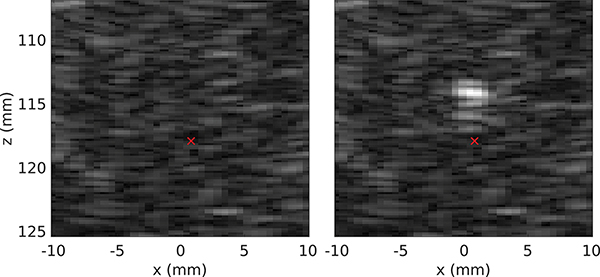
In the evaluation procedure, the 10 ms BH pulse was emitted at gradually (in steps of 1 V) increasing HIFU transducer driving voltage starting from 16 V, which corresponded to the minimum voltage needed to generate a boiling bubble with this HIFU transducer in ex vivo porcine liver without any aberration. The time between BH pulses was at least 5 seconds to avoid heat accumulation at the focus. The BH pulses were gated by ultrasound imaging based tracking of the respiration cycle described in detail in our previous publication [35] to ensure that the targeted region was the same as the one used for aberration correction. Initiation of boiling at the focus was confirmed by visually observing a hyperechoic region of at least 1 mm diameter appearing at the focus [36]. Specifically, one B-mode image was acquired 5 ms before the BH pulse and four B-mode images starting 10 ms after the end of the BH pulse at a framerate of 40 Hz. Those images were then viewed in a different window to facilitate and simplify the detection of the transient hyperechoic region corresponding to the boiling bubble. An example of two of such images is shown in Fig. 9.
Fig. 9:
B-mode imaging around the focus of the HIFU array, where (a) is the image 5 ms before the BH pulse and (b) is the image 10 ms after the pulse. The hyperechoic spot corresponds to a boiling bubble. The red cross represents the HIFU geometric focus position.
Once the BH threshold with aberration correction was found, the transducer was moved by 5 mm in the lateral direction using the robotic arm. This was done to avoid targeting an area that was affected by the previous BH pulses, thus potentially containing bubble nuclei, while keeping the same level of aberration. The aberration correction delays were then removed from the HIFU array elements, and the BH threshold was found using the same procedure.
III. Results
The procedure of aberration correction took between 40 to 80 seconds and 4 to 9 iterations. The first iteration was always the longest due to the additional time needed to identify the reference beamsum signal for tracking - about one second. In the following iterations, the time spent on tracking procedures was on the order of 100 ms. Similarly, the time spent on estimating the steering component within the aberration correction process was longer in the first iteration than in the following ones, as the initial value for steered coordinates was set to (0, 0, 0). It was highly variable, depending on the size of the window [T0, T1] and the identified steering value, and ranged within 0.1–1 second. As for the following iterations, because the initial guess of the position was set to the previously found value, and that this position was almost constant due to the tracking, the optimization convergence was quick and took less than 100 ms. The remainder of the aberration correction algorithm took between 200 and 400 ms, depending only on the size of the window [T0, T1].
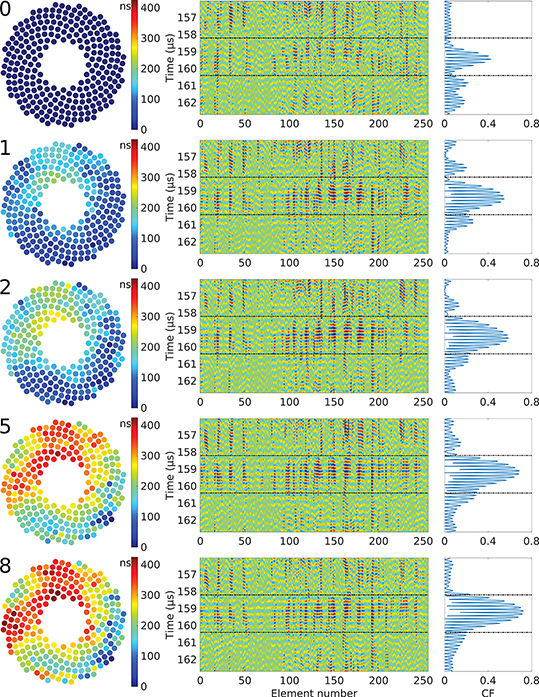
The results of the evaluation of aberration correction quality are presented in Table I, and an example of the output of aberration correction iterations are shown in Fig. 10. As seen, the effect of the aberration correction on BH initiation threshold was more noticeable for liver than for kidney and corresponded to 15%–45% decrease in acoustic power. In the case of kidneys, the difference in acoustic power between corrected and uncorrected cases was not as large, within 8% and 21%. This is consistent with prior observations that the level of aberration in porcine body wall overlaying the kidney is much lower than that overlying the liver due to the distribution of the fat layers primarily on the abdomen and not on the sides [11]. This was also reflected in the number of aberration correction iterations needed to converge, on average 5, which is lower than in the liver.
TABLE I:
Aberration correction results.
| Liver | Kidney | |||||||
|---|---|---|---|---|---|---|---|---|
|
| ||||||||
| Threshold no correction (W) | 1113 | >1854* | 1762 | 1261 | 973 | 663 | 780 | 842 |
|
| ||||||||
| Threshold with correction (W) | 842 | 1186 | 973 | 906 | 842 | 608 | 721 | 663 |
|
| ||||||||
| Theoretical threshold (W) | 817 | 986 | 893 | 697 | 768 | 592 | 592 | 619 |
|
| ||||||||
| Number of iterations | 9 | 8 | 7 | 8 | 7 | 5 | 6 | 4 |
|
| ||||||||
| Steering x | 0.5 | −0.4 | 0.9 | 0.8 | −0.3 | 0.2 | −0.9 | 0.4 |
| component y | −0.3 | 0.2 | −0.3 | 0 | −0.2 | 0.1 | 0.1 | 0.4 |
| estimate (mm) z | −0.7 | −0.3 | −1 | −0.6 | −0.9 | −1.2 | −1.6 | −1.3 |
The maximum acoustic power of the HIFU system for a 10 ms BH pulse being 1.8 kW, no boiling was obtained in that case.
Fig. 10:
Example of the evolution of the time delays τc (left), RF signals (center), and coherence factor (right) during the iterative aberration correction process in the liver. The iteration number appears on the top left corner of each step. The area between the dash-dot black lines corresponds to the region of interest used in the aberration correction algorithm.
Another observation was that the acoustic power required to reach boiling after aberration correction was consistent for different locations in the liver and kidney, at around 900 W and 660 W, respectively, whereas without correction it varied more widely. Therefore, an estimation of the theoretical acoustic power required to reach boiling where only the attenuation is accounted for was calculated and added to Table I using the following derating formula [37]:
| (10) |
where Ath is the theoretical acoustic power required to reach boiling only accounting for attenuation, A0 is the acoustic power to reach boiling in both ex vivo porcine liver and kidney tissue at the depth h0, αbw = 1.7 dB/cm is the attenuation of the body wall [11], αt is the attenuation of the targeted tissue - here we only use liver attenuation αt = 0.49 dB/cm [38] as only the liver was targeted at depth other that h0, and hbw and ht are the thickness of the body wall and the depth of the HIFU focus location within the targeted tissue, respectively. Previous ex vivo experiments indicated that the acoustic power required to reach boiling in liver and kidney cortex was A0 = 288 W at the depth of h0 = 10 mm [25]. The values of the threshold with correction are close to their estimated theoretical values only accounting for attenuation, meaning that the aberration correction effectively restored the shock close to non-aberrated level.
The estimated steering component is also given in Table I as an illustration of the extent of the focus displacement if this component was not removed. Its value in the transverse plane (xy) was small and variable, with an average of 0.6±0.26 mm. Its value in the propagation axis (z), however, was mostly dependent on the selection of the window [T0, T1] during the correction and had an average of −0.95±0.42 mm.
IV. Discussion and Conclusions
In this article, a method for aberration correction aimed toward in vivo transcutaneous HIFU treatment was proposed and tested in a porcine model. Using a multi-element HIFU array in tissue harmonic pulse/echo mode on the liver and kidney in an extracorporeal setup, time delays required to compensate for aberration were found. These delays were then applied to the HIFU array elements, and the quality of the correction was evaluated by looking at the acoustic power required to reach boiling at the focus within a 10 ms pulse typical for BH. The acoustic power was reduced by at least 45% - as in some cases boiling would not be possible without correction due to the electrical power limitation of the system - compared to the equivalent case without correction, confirming the feasibility and utility of the aberration correction procedure.
An algorithm for retrieving the time shifts due to aberration error on each element of the HIFU array was adapted from a method previously developed for ultrasound B-mode imaging with 2D arrays. As this algorithm requires multiple iterations of pulse/echo acquisitions of the exact same group of scatterers, and the body is under constant cyclic motion caused mainly by the heartbeat and breathing, a scatterer tracking scheme was introduced. While fairly simple, it proved to be fast and efficient as no tracking issues were encountered with the exception of cases where the targeted region was moved unexpectedly by motions other than cyclic. A failure of the tracking meant that the scatterers pattern at the focus had changed, which would result in either failure of the aberration correction, or an increased number of iteration required to reach convergence. Its main drawback was that it made the overall correction rather long due to the recording time it required - 4 s here, chosen as slightly longer than the slowest cyclic motion of the body. While it would seem attractive to implement more complex tracking methods, combined for example with active motion compensation with a robotic arm, another issue would arise: the aberrating layer - the body wall in this case - would then be in constant movement relative to the HIFU array, thus at each pulse/echo iteration the aberration pattern would vary, leading to failed convergence. Introducing breath hold would accelerate the process but will not remove the need for tracking as the heartbeat motion is non negligible, especially in highly perfused organs like the liver and the kidney. In that case, considering a minimum heartbeat rate of 60 beats/min, the value of tacq could be set to 1 s, thus almost dividing the entire correction process time by 4.
A method for estimating and removing the spatial beam steering component of the correction was also proposed and tested. It served multiple purposes. First, as this component could be large due to the topology of the targeted tissue and the spreading of the focus caused by the aberrations, removing it improves the accuracy of the treatment. However, the method only provides an estimation of that component, and therefore the final aberration correction time delays still contain a steering component, albeit greatly reduced. Theoretically, this could also have been done only once, after the entire aberration correction procedure has taken place, by simply finding the steering position that would minimize the sum of all the correction delays. The main advantage of assessing this component at each iteration was the minimization of the inter-element delays, and thus avoiding any error and phase wraps caused by cross correlation. In the results presented, the maximum time delays introduced by steering ranged between 30 ns up to 110 ns, more that the cross correlation lag of 100 ns. It is important to note here that this estimate does not include the spatial shift of the focus caused by the aberrative layer itself, as that shift does not result in time delays between the array elements.
The overall time to get the aberration compensating time shifts at one focus position was long - about a minute. It was observed previously [18] that the coherence factor increased dramatically within the first iterations (usually 2 or 3), while then progressing toward a plateau rather slowly. Depending on the needs of the treatment, and the impact those last iterations have on the refocusing of the array, using a lower requirement of the CF increase (2% here) or even a fixed number of iterations could greatly reduce the procedure time. The other limitation of this study was that the aberration correction was performed for only one HIFU focus location – the geometrical focus of the array, whereas the required correction may be different at the locations corresponding to the electronic focus steering limits used during treatment. This aspect is outside of the scope of present work.
In conclusion, this study demonstrated that the proposed aberration correction method is practical and applicable in vivo, and could be used to improve the precision and safety of in vivo transcutaneous HIFU treatments. While here it was applied in the context of boiling histotripsy, it could be used for any type of HIFU treatment that uses multi-element arrays with transmit-receive capabilities.
Acknowledgments
Work supported by NIH R01EB007643, R01GM122859, RO1EB025187, and RSF 20-12-00145.
Contributor Information
Gilles P.L. Thomas, Center for Industrial and Medical Ultrasound, Applied Physics Laboratory, University of Washington, Seattle, WA.
Tatiana D. Khokhlova, University of Washington School of Medicine, Division of Gastroenterology, Seattle, WA.
Oleg A. Sapozhnikov, Center for Industrial and Medical Ultrasound, Applied Physics Laboratory, University of Washington, Seattle, WA. Physics Faculty, Moscow State University, Moscow, Russia.
Yak-Nam Wang, Center for Industrial and Medical Ultrasound, Applied Physics Laboratory, University of Washington, Seattle, WA..
Stephanie Totten, Center for Industrial and Medical Ultrasound, Applied Physics Laboratory, University of Washington, Seattle, WA..
Vera A. Khokhlova, Center for Industrial and Medical Ultrasound, Applied Physics Laboratory, University of Washington, Seattle, WA. Physics Faculty, Moscow State University, Moscow, Russia.
References
- [1].Al-Bataineh O, Jenne J, and Huber P, “Clinical and future applications of high intensity focused ultrasound in cancer,” Cancer Treatment Reviews, vol. 38, no. 5, pp. 346–353, 2012. [DOI] [PubMed] [Google Scholar]
- [2].Khokhlova VA, Fowlkes JB, Roberts WW, Schade GR, Xu Z, Khokhlova TD, Hall TL, Maxwell AD, Wang Y-N, and Cain CA, “Histotripsy methods in mechanical disintegration of tissue: Towards clinical applications,” International Journal of Hyperthermia, vol. 31, no. 2, pp. 145–162, 2015. [DOI] [PMC free article] [PubMed] [Google Scholar]
- [3].Hinkelman LM, Mast TD, Metlay LA, and Waag RC, “The effect of abdominal wall morphology on ultrasonic pulse distortion. part i. measurements,” The Journal of the Acoustical Society of America, vol. 104, no. 6, pp. 3635–3649, 1998. [DOI] [PubMed] [Google Scholar]
- [4].Mast TD, Hinkelman LM, Orr MJ, and Waag RC, “The effect of abdominal wall morphology on ultrasonic pulse distortion. Part II Simulations,” The Journal of the Acoustical Society of America, vol. 104, no. 6, pp. 3651–3664, 1998. [DOI] [PubMed] [Google Scholar]
- [5].Ritchie R, Collin J, Coussios C, and Leslie T, “Attenuation and defocusing during high-intensity focused ultrasound therapy through perinephric fat,” Ultrasound in Medicine & Biology, vol. 39, no. 10, pp. 1785–1793, 2013. [DOI] [PubMed] [Google Scholar]
- [6].Amin V, Roberts R, Long T, Thompson RB, and Ryken T, “A study of effects of tissue inhomogeneity on HIFU beam,” vol. 829, no. 1. American Institute of Physics, 2006, pp. 201–205. [Google Scholar]
- [7].Liu Z, Guo X, Tu J, and Zhang D, “Variations in temperature distribution and tissue lesion formation induced by tissue inhomogeneity for therapeutic ultrasound,” Ultrasound in Medicine & Biology, vol. 40, no. 8, pp. 1857–1868, 2014. [DOI] [PubMed] [Google Scholar]
- [8].Hinkelman LM, Liu D-L, Waag RC, Zhu Q, and Steinberg BD, “Measurement and correction of ultrasonic pulse distortion produced by the human breast,” The Journal of the Acoustical Society of America, vol. 97, no. 3, pp. 1958–1969, 1995. [DOI] [PubMed] [Google Scholar]
- [9].Khokhlova TD, Canney MS, Khokhlova VA, Sapozhnikov OA, Crum LA, and Bailey MR, “Controlled tissue emulsification produced by high intensity focused ultrasound shock waves and millisecond boiling,” The Journal of the Acoustical Society of America, vol. 130, no. 5, pp. 3498–3510, 2011. [DOI] [PMC free article] [PubMed] [Google Scholar]
- [10].Maxwell AD, Wang T-Y, Cain CA, Fowlkes JB, Sapozhnikov OA, Bailey MR, and Xu Z, “Cavitation clouds created by shock scattering from bubbles during histotripsy,” The Journal of the Acoustical Society of America, vol. 130, no. 4, pp. 1888–1898, 2011. [DOI] [PMC free article] [PubMed] [Google Scholar]
- [11].Khokhlova TD, Schade GR, Wang Y-N, Buravkov SV, Chernikov VP, Simon JC, Starr F, Maxwell AD, Bailey MR, Kreider W, and Khokhlova VA, “Pilot in vivo studies on transcutaneous boiling histotripsy in porcine liver and kidney,” Scientific Reports, vol. 9, no. 1, pp. 1–12, 2019. [DOI] [PMC free article] [PubMed] [Google Scholar]
- [12].Herbert E, Pernot M, Montaldo G, Fink M, and Tanter M, “Energy-based adaptive focusing of waves: application to noninvasive aberration correction of ultrasonic wavefields,” IEEE Transactions on Ultrasonics, Ferroelectrics, and Frequency Control, vol. 56, no. 11, pp. 2388–2399, 2009. [DOI] [PMC free article] [PubMed] [Google Scholar]
- [13].Hertzberg Y, Volovick A, Zur Y, Medan Y, Vitek S, and Navon G, “Ultrasound focusing using magnetic resonance acoustic radiation force imaging: application to ultrasound transcranial therapy,” Medical Physics, vol. 37, no. 6, pp. 2934–2942, 2010. [DOI] [PubMed] [Google Scholar]
- [14].Marsac L, Chauvet D, Larrat B, Pernot M, Robert B, Fink M, Boch A-L, Aubry J-F, and Tanter M, “MR-guided adaptive focusing of therapeutic ultrasound beams in the human head,” Medical Physics, vol. 39, no. 2, pp. 1141–1149, 2012. [DOI] [PMC free article] [PubMed] [Google Scholar]
- [15].Pernot M, Montaldo G, Tanter M, and Fink M, “Ultrasonic stars for time-reversal focusing using induced cavitation bubbles,” Applied physics letters, vol. 88, no. 3, p. 034102, 2006. [Google Scholar]
- [16].Haworth KJ, Fowlkes JB, Carson PL, and Kripfgans OD, “Towards aberration correction of transcranial ultrasound using acoustic droplet vaporization,” Ultrasound in Medicine & Biology, vol. 34, no. 3, pp. 435–445, 2008. [DOI] [PMC free article] [PubMed] [Google Scholar]
- [17].Gâteau J, Marsac L, Pernot M, Aubry J-F, Tanter M, and Fink M, “Transcranial ultrasonic therapy based on time reversal of acoustically induced cavitation bubble signature,” IEEE Transactions on Biomedical Engineering, vol. 57, no. 1, pp. 134–144, 2009. [DOI] [PMC free article] [PubMed] [Google Scholar]
- [18].Thomas GP, Khokhlova TD, Bawiec CR, Peek AT, Sapozhnikov OA, ODonnell M, and Khokhlova VA, “Phase-aberration correction for hifu therapy using a multielement array and backscattering of nonlinear pulses,” IEEE Transactions on Ultrasonics, Ferroelectrics, and Frequency Control, vol. 68, no. 4, pp. 1040–1050, 2020. [DOI] [PMC free article] [PubMed] [Google Scholar]
- [19].Gateau J, Aubry J, Chauvet D, Boch A, Fink M, and Tanter M, “In vivo bubble nucleation probability in sheep brain tissue,” Physics in Medicine & Biology, vol. 56, no. 22, p. 7001, 2011. [DOI] [PubMed] [Google Scholar]
- [20].Maxwell AD, Cain CA, Hall TL, Fowlkes JB, and Xu Z, “Probability of cavitation for single ultrasound pulses applied to tissues and tissue-mimicking materials,” Ultrasound in medicine & biology, vol. 39, no. 3, pp. 449–465, 2013. [DOI] [PMC free article] [PubMed] [Google Scholar]
- [21].Krishnan S, Rigby K, and O’Donnell M, “Improved estimation of phase aberration profiles,” IEEE Transactions on Ultrasonics, Ferroelectrics, and Frequency Control, vol. 44, no. 3, pp. 701–713, 1997. [DOI] [PubMed] [Google Scholar]
- [22].O’Donnell M and Flax S, “Phase-aberration correction using signals from point reflectors and diffuse scatterers: Measurements,” IEEE Transactions on Ultrasonics, Ferroelectrics, and Frequency Control, vol. 35, no. 6, pp. 768–774, 1988. [DOI] [PubMed] [Google Scholar]
- [23].Liu D-L and Waag RC, “Correction of ultrasonic wavefront distortion using backpropagation and a reference waveform method for time-shift compensation,” The Journal of the Acoustical Society of America, vol. 96, no. 2, pp. 649–660, 1994. [DOI] [PubMed] [Google Scholar]
- [24].Tranquart F, Grenier N, Eder V, and Pourcelot L, “Clinical use of ultrasound tissue harmonic imaging,” Ultrasound in Medicine & Biology, vol. 25, no. 6, pp. 889–894, 1999. [DOI] [PubMed] [Google Scholar]
- [25].Bawiec CB, Khokhlova TD, Sapozhnikov OA, Rosnitsky PB, Cunitz BW, Ghanem MA, Hunter C, Kreider W, Shade GR, Yuldashev PV, and Khokhlova VA, “A prototype system for boiling histotripsy in abdominal targets based on a 256-element spiral array,” IEEE Transactions on Ultrasonics, Ferroelectrics, and Frequency Control, 2020. [DOI] [PMC free article] [PubMed] [Google Scholar]
- [26].Khokhlova VA, Yuldashev PV, Rosnitskiy PB, Maxwell AD, Kreider W, Bailey MR, and Sapozhnikov OA, “Design of hifu transducers to generate specific nonlinear ultrasound fields,” Physics Procedia, vol. 87, pp. 132–138, 2016. [DOI] [PMC free article] [PubMed] [Google Scholar]
- [27].Jiang P, Mao Z, and Lazenby J, “A new tissue harmonic imaging scheme with better fundamental frequency cancellation and higher signal-to-noise ratio,” vol. 2. IEEE, 1998, pp. 1589–1594. [Google Scholar]
- [28].Hollman K, Rigby K, and O’Donnell M, “Coherence factor of speckle from a multi-row probe,” in 1999 IEEE Ultrasonics Symposium. Proceedings. International Symposium (Cat. No. 99CH37027), vol. 2. IEEE, 1999, pp. 1257–1260. [Google Scholar]
- [29].Mallart R and Fink M, “The van Cittert–Zernike theorem in pulse echo measurements,” The Journal of the Acoustical Society of America, vol. 90, no. 5, pp. 2718–2727, 1991. [Google Scholar]
- [30].Liu D-L and Waag RC, “Time-shift compensation of ultrasonic pulse focus degradation using least-mean-square error estimates of arrival time,” The Journal of the Acoustical Society of America, vol. 95, no. 1, pp. 542–555, 1994. [DOI] [PubMed] [Google Scholar]
- [31].Kraft D et al. , “A software package for sequential quadratic programming,” 1988. [Google Scholar]
- [32].Kraft D, “Algorithm 733: Tomp–fortran modules for optimal control calculations,” ACM Transactions on Mathematical Software (TOMS), vol. 20, no. 3, pp. 262–281, 1994. [Google Scholar]
- [33].Johnson Steven G., “The nlopt nonlinear-optimization package,” http://github.com/stevengj/nlopt, accessed: 2021-12-10.
- [34].Canney MS, Khokhlova VA, Bessonova OV, Bailey MR, and Crum LA, “Shock-induced heating and millisecond boiling in gels and tissue due to high intensity focused ultrasound,” Ultrasound in Medicine & Biology, vol. 36, no. 2, pp. 250–267, 2010. [DOI] [PMC free article] [PubMed] [Google Scholar]
- [35].Thomas GP, Khokhlova TD, and Khokhlova VA, “Partial respiratory motion compensation for abdominal extracorporeal boiling histotripsy treatments with a robotic arm,” IEEE Transactions on Ultrasonics, Ferroelectrics, and Frequency Control, 2021. [DOI] [PMC free article] [PubMed] [Google Scholar]
- [36].Khokhlova TD, Wang Y-N, Simon JC, Cunitz BW, Starr F, Paun M, Crum LA, Bailey MR, and Khokhlova VA, “Ultrasound-guided tissue fractionation by high intensity focused ultrasound in an in vivo porcine liver model,” Proceedings of the National Academy of Sciences, vol. 111, no. 22, pp. 8161–8166, 2014. [DOI] [PMC free article] [PubMed] [Google Scholar]
- [37].Bessonova O, Khokhlova V, Canney M, Bailey M, and Crum L, “A derating method for therapeutic applications of high intensity focused ultrasound,” Acoustical Physics, vol. 56, no. 3, pp. 354–363, 2010. [DOI] [PMC free article] [PubMed] [Google Scholar]
- [38].Zderic V, Keshavarzi A, Andrew MA, Vaezy S, and Martin RW, “Attenuation of porcine tissues in vivo after high-intensity ultrasound treatment,” Ultrasound in Medicine & Biology, vol. 30, no. 1, pp. 61–66, 2004. [DOI] [PubMed] [Google Scholar]


