

Abstract
The hearing aid market is rapidly evolving with advancements in features and potential changes in service delivery models, including the new over-the-counter device category. Data from the MarkeTrak 2022 survey indicate most hearing aid owners report regular quality-of-life benefits from hearing aids, even more than in previous surveys. The increased likelihood of hearing aid benefits might be attributable to modern hearing aid features advancements, such as wireless connectivity and rechargeable batteries. Hearing aid satisfaction rates have been relatively stable over the years, indicating that more than 80% of hearing aid owners are satisfied with their devices. Hearing aid satisfaction rates do not appreciably vary by fitting channel; hearing aid owners fitted in person, fitted remotely, or self-fit are similarly likely to report high satisfaction with their device. However, only respondents in the in-person channel gave establishment ratings (reflecting their willingness to recommend) that resulted and reflected a positive net promoter score. Given the potential for net promoter scores to be related to brand growth and customer loyalty, this finding has implications for the development of over-the-counter hearing aid service-delivery models. Additional work is warranted to explore the factors that negatively affect hearing aid owners' satisfaction with the companies delivering limited services.
Keywords: hearing aid, benefit, satisfaction, implant, direct-to-consumer
Not all hearing aid users report hearing aid benefit or satisfaction, despite documented advantages of hearing aid use for speech recognition, 1 communication, 2 and quality of life. 3 4 There have been several recent publications on this subject, attempting to explain variability in hearing aid benefit and satisfaction. The results of these investigations generally support that benefit and satisfaction are distinct constructs, 5 with benefit reflecting how hearing aids make improvements in particular areas (e.g., speech understanding, self-reported well-being) and satisfaction reflecting an affective appraisal of overall performance with a hearing aid. 6 7 The results of numerous studies suggest hearing aid benefit is related to, among other things, pre-fitting expectations and perceived hearing ability without hearing aids. 8 9 10 11 Determinants of satisfaction also include perceived hearing ability without hearing aids 8 and pre-fitting expectations, 12 13 in addition to the physical appearance of the hearing aid, cost, and frequency of issues encountered with the device. 6
Extant literature also points at the importance of service-delivery–related factors for hearing aid outcomes. Specifically, hearing aid benefit has been related to service setting, 8 pre-fitting counseling, 14 and verification of prescriptive targets. 15 However, most of the aforementioned studies have focused on hearing aid benefit and satisfaction under traditional service delivery models, where a hearing care professional (e.g., an audiologist or dispenser) performs the fitting and counseling during an in-person appointment.
The roles of professionals and in-person appointments are evolving, due in part to regulatory changes. Based in part on the National Academies of Sciences, Engineering, and Medicine (NASEM) published report, 16 the Federal Drug Administration (FDA) Over the Counter Act of 2017 mandated the creation of an “over-the-counter” hearing aid category for adults with perceived mild to moderate hearing loss. At the time of this writing, the FDA issued the proposed guidelines and requested comments. The final regulations are expected late summer or fall 2022. The general premise is hearing aids should be available to consumers with no professional involvement to reduce costs and expand hearing health care access. The expectation of this regulatory hearing aid category has led professionals to prepare for hearing aid delivery models with limited or no hearing professional support by investigating direct-to-consumer models and by implementing alternative to traditional service models. Examples of alternatives to a traditional, in-person hearing aid fitting (e.g., a professional evaluates hearing and dispenses hearing aid(s) in person), include a fully direct-to-consumer service delivery model (e.g., a person buys a self-fitting hearing aid with no professional support) or a remote model where the person receives only limited support (e.g., remote support for hearing aid selection or troubleshooting).
In general, the existing evidence demonstrates that the use of direct-to-consumer or self-fitting hearing devices can result in similar speech recognition performance as conventionally fit hearing aids, especially for high-quality over-the-counter devices with broad bandwidths, advanced features, and appropriate gain. 17 18 19 20 21 In addition, differences between conventionally fit hearing aids (with full support of a hearing care professional) and self-fit hearing aids (with limited support of a hearing care professional) are evident in satisfaction ratings, where ratings of satisfaction are higher when people have the full support of a hearing care professional, despite similar ratings of benefit between the two groups. 18 22 23 Although some of the differences in satisfaction have been attributed to physical device differences, rather than purely the service delivery models, 23 others note differences in satisfaction perseverate even when the devices are physically identical. 18 22 Combined, these data point to the importance of high-quality instruments and adequate gain for speech understanding and perceived benefit, but suggest the hearing care professional might have an important influence on the overall experience from start to finish.
The current MarkeTrak 2022 survey results have the potential to offer insights into the role of the hearing care provider and its influence on satisfaction ratings and overall perceptions. The survey, whose methods are described in detail elsewhere (Powers et al, this issue), resulted in ratings of satisfaction for hearing aid owners in three different channels: traditionally fit (with in-person hearing care professional such as an audiologist or hearing instrument specialist), remote fit (with virtual or remote hearing care professional support via the Internet, video call, or app), or self-fit (with no professional support). Although the exact devices likely varied across channels, the devices in these categories are all officially “hearing aids,” meeting the FDA's requirements for labeling at the time of survey data collection. Examples of potential devices in the remote fitting channel include those sold by Lively and examples of those in the self-fit category include the Bose devices available at the time (currently distributed by Lexie). None of the devices in these channels reported to be “personal sound amplifiers,” designed for people with normal hearing and ordered directly online, nor were the devices with specific “hearing-improvement” features (e.g., Apple AirPods Pro or Nuheara earbuds with “conversation boost”), which were asked about separately in this survey.
In addition to satisfaction ratings by fitting channel, the MarkeTrak 2022 survey results offer indirect insights into hearing aid benefits and the use of hearing aid features. The hearing aid marketplace is rapidly evolving with the development and advancement of advanced features, especially wireless streaming, rechargeable batteries, and noise cleaning algorithms. 24 The survey respondents (hearing aid owners and non-owners) rated their ability to hear in many different situations, allowing for the comparison of people with hearing difficulties who do and do not use hearing aids and providing insights into where the devices are beneficial. Respondents also provided information about the features their hearing aids have and the frequency of use of some of the features (e.g., wireless streaming, smartphone apps, and microphone directionality).
Therefore, the purposes of this article were to (1) describe hearing aid benefits noted in the data and (2) describe current hearing aid satisfaction rates. Whenever possible, the satisfaction rates will be compared across the three channels queried in the MarkeTrak 2022 survey (in person, remote, or self-fit) to investigate the importance of the hearing care professional in the fitting of hearing aids. Hearing aid feature use will also be related to benefit whenever possible. The survey also included questions specific to the hearing aid owners' perception of the role of hearing care professionals; thus, a third purpose is to summarize hearing aid owners' views on the roles of hearing care professionals. To contextualize the findings, a descriptive sample of the hearing aids used by survey respondents is described first.
Descriptive Hearing Aid Sample
Most of the survey respondents reported being fit in person by a hearing health care professional (81%) and far fewer were fit remotely by a professional (12%) or self-fit (7%). The most popular style continues to be behind-the-ear (64%) and, among those, receiver in the canal is the most popular (54% of total respondents). The most popular in-the-ear style was full shell (12%), followed by half shell (9%), invisible in the canal (7%), and completely in the canal (5%). The median hearing aid age was 2.0 years ( M = 3.5 years). Hearing aid costs were mostly bundled, with 66% of respondents paying a single price for hearing aids and only 16% of respondents reporting unbundled services; the remaining were unsure of the cost structure.
The survey respondents consisted of both first-time and established hearing aid owners approximately equally represented (51% first-time owners), with slight variations in the percent of first-time owners by channel (in person [51%], remote [47%], or self-fit [53%]). Most of the hearing aid owners in the study have a pair of devices (67% of the sample). However, the number of bilateral fittings varied by service delivery model, with 71% of respondents reporting bilateral hearing aids when fitted in person, but fewer reporting bilateral solutions for the other fitting channels (self-fitting [66%], remote fitting [39%]). These bilateral adoption rates reflect people with hearing loss in one or both ears. For those with bilateral losses, 84% of respondents reported bilateral fitting. The high bilateral adoption rate is consistent with previous survey data, but also reflects that bilateral fittings are not the preferred solution for all people. 25 26 27
Device Benefits
Quality of Life
As indicated in Fig. 1 , quality-of-life benefits for hearing aid owners have increased over the last three cycles, with 64% of respondents reporting “regular” quality-of-life benefits with hearing aids in MarkeTrak 2022, but only 48 and 55% reporting similar benefits in MarkeTrak 2015 and MarkeTrak 2019, respectively. a These benefits are generally consistent with the established scientific literature demonstrating improvements in quality of life with hearing aid use. 3 4
Figure 1.
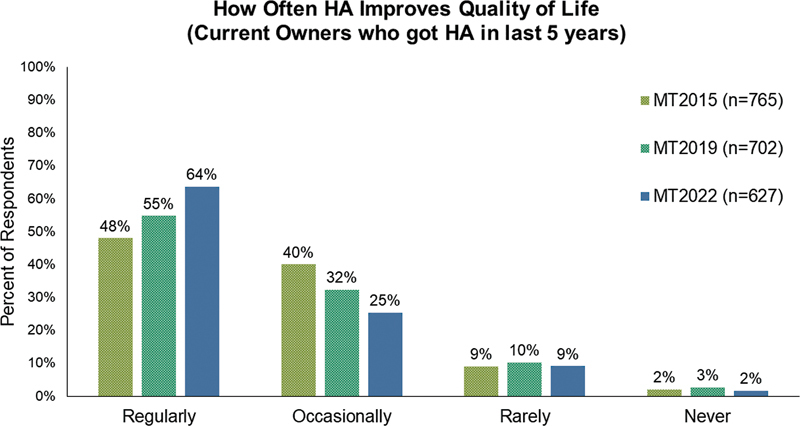
Percent of hearing aid owners who reported that hearing aids regularly, occasionally, rarely, or never improved their quality of life. Indicated by color are survey results from three MarkeTrak survey cycles.
It is not clear what is driving the increased quality-of-life improvements for hearing aid owners. One possibility is the improvements and advancements in hearing aid features since 2015. For example, Table 1 displays features, wireless capabilities, and accessories of respondents of the current survey, in addition to the two most recent MarkeTrak surveys. This table indicates the use of some features has increased dramatically over the last few years, including rechargeable hearing aids and batteries, wireless streaming, television streamers, companion microphones, and downloadable apps for smartphones.
Table 1. Percent of Hearing Aid (HA) Owners Who Reported Having Each Feature in the Last Three MarkeTrak Survey Cycles.
| Question: Below are some different HA features, capabilities, or accessories/apps. Please indicate whether your current HA has each one, as far as you know | Owners who got HA(s) in past 5 y | ||
|---|---|---|---|
| (% “Yes”) | |||
| MT 2022 | MT 2019 | MT 2015 | |
| ( n = 815) | ( n = 702) | ( n = 782) | |
| Features | |||
| Volume control | 72% | 67% | 65% |
| Program button | 53% | 41% | 49% |
| Rechargeable hearing aid | 52% | 15% | 16% |
| Directional, dual, twin, or multiple microphones | 39% | 28% | 35% |
| Rechargeable batteries | 35% | 14% | 18% |
| Telecoil | 33% | 20% | 23% |
| Tinnitus masker | 29% | 14% | 16% |
| Wireless capabilities | |||
| The ability to “link” volume or program changes | 47% | 43% | 36% |
| The ability to stream sound from a smartphone directly | 44% | 13% | 2% |
| The ability to stream sound using an additional accessory | 38% | 26% | 20% |
| NET: wireless HA (calculated) | 63% | 54% | 43% |
| Accessories/Apps | |||
| Downloadable “app” for smartphones | 44% | 17% | 6% |
| HA remote control | 39% | 21% | 22% |
| Body-worn Bluetooth device | 31% | 15% | 12% |
| TV streamer | 27% | 11% | 12% |
| Companion microphone | 25% | 7% | 9% |
Among those with the ability to adjust their hearing aids using an iPhone app ( n = 351 out of 815), the most common changes were adjusting the hearing aid volume (50% of respondents), followed by reducing the volume of sounds on the phone during a streamed call (42%), streaming audio or music directly to the hearing aid (37%), changing programs for different listening environments (35%), and saving or geo-tagging a physical location (23%). Only 15% of respondents with the capability to make changes or stream reported not using the feature yet. Most people who have apps (59%) or remotes (69%) use them regularly (at least weekly) and the satisfaction rates with a smartphone app or a remote control are high, with 83 and 89% of respondents reporting they were satisfied with their app or remote control, respectively. Combined, these data are favorable because people are moderately likely to actually use their technology. Additional work is warranted to determine if the increased use of advanced features is indeed driving the increased quality-of-life benefits or if there are additional unseen factors outside of this survey contributing to these positive changes.
Hearing Abilities
One factor that potentially supports quality of life is the ability to hear and communicate well in a variety of situations. As demonstrated in Table 2 , hearing aid owners are likely to benefit from hearing aids because they are more likely than their peers without hearing aids to be satisfied with their ability to hear in many different listening situations. The data reveal that across all listening situations, hearing aid owners are more likely to be satisfied with their hearing (78% of respondents) than are non-owners (36% of respondents). The columns in Table 2 are rank-ordered by difference between hearing aid owners and non-owners. The situations where the hearing aid owners show the biggest advantage over non-owners include following conversations in noise, conversations with large and small groups, and watching TV with others. These situations appear to be particularly problematic for non-owners, with just 25 to 39% of them reporting they are satisfied with their hearing ability, whereas a large majority of hearing aid owners are satisfied in the same situations. Fortunately, this finding demonstrates that hearing aids are helping many people in situations that are also important; following conversations in quiet or in noise are among the most important listening situations to many people with hearing loss. 28 29
Table 2. Percent of Hearing Aid (HA) Owners and HA Non-owners Who are Satisfied with their Ability to Hear in Each of the Listed Listening Situations.
| HA Owners |
All Non-owners |
Difference between HA users and non-owners | |
|---|---|---|---|
| ( n = 1,061) | ( n = 1,840) | ||
| When following conversations in the presence of noise | 72% | 25% | 47% |
| In conversations with large groups | 72% | 27% | 45% |
| In conversations with small groups | 78% | 38% | 40% |
| When watching TV with others | 78% | 39% | 39% |
| At home with family members | 83% | 44% | 39% |
| In the workplace | 82% | 44% | 38% |
| In a larger lecture hall | 72% | 34% | 38% |
| In a store, when shopping | 77% | 41% | 36% |
| In school or a classroom | 70% | 34% | 36% |
| When talking to children | 74% | 41% | 33% |
| When talking on a cell phone | 78% | 47% | 31% |
| When riding in a car | 76% | 45% | 31% |
| In conversations with 1 person | 83% | 52% | 31% |
| Outdoors | 77% | 47% | 30% |
| When talking on a traditional telephone | 75% | 46% | 29% |
| During leisure activities | 76% | 49% | 27% |
| When listening to music | 78% | 57% | 21% |
| At a movie theater | 70% | 49% | 21% |
| Overall, across all listening situations a | 78% | 36% | 42% |
Note: Overall satisfaction is listed in the bottom row. Calculated difference between owners and non-owners is also displayed.
Significant difference between HA and personal sound amplifier users.
Table 3 displays how feature ownership varies by fitting channel; hearing aid owners in the two more limited service fitting channels (remote and self-fit) are more likely to have all of the listed features, which likely reflects the availability of the specific devices in these channels. That is, hearing aids available in the remote or self-fit channels were likely devices that have program buttons and rechargeability by default. Perhaps more interesting are the ratings of which features have the most positive impact, as displayed in Table 4 . The table supports the hypothesis that streaming, rechargeable hearing aids/batteries, and apps positively impact hearing aid owners, especially those in the in-person fitting channel. The downloadable apps seem to be more impactful for people in the remote and self-fitted channels than in the in-person fitted channel. In addition, the volume control was especially important for the respondents in the self-fitting channel. Both of these features would be expected to be particularly important for these channels, as the hearing care professional does little (or no) programming of the hearing aids. Rather, the hearing aid owner would need flexibility in gain adjustments or programs to fit their individual listening needs. These adjustments, however, depend on access to a remote control/smartphone app for changing the gain shape, or minimally a volume control for changing the overall level.
Table 3. Percent of Hearing Aid (HA) Owners who Report Having Each of the Listed Features in Each Fitting Channel.
| HA features Question: Below are some different HA features. Please indicate whether your current HA has each feature, as far as you know. |
Got HA(s)
in past 5 y
by channel (% “Yes”) |
||
|---|---|---|---|
| In-person fitted ( n = 716) |
Remote fitted ( n = 51) |
Self-fitting ( n = 48) |
|
| • Volume control on the HA itself | 71% | 73% | 85% |
| • Program button or switch to change the HA response for different listening environments, like “Restaurant,” “Outdoors,” “Phone,” etc. | 50% | 67% | 62% |
| • Rechargeable HA which includes an integrated rechargeable battery that is never removed | 50% | 64% | 63% |
| • Directional, dual, twin, or multiple microphones for enhanced hearing in noisy situations | 36% | 53% | 47% |
| • Rechargeable batteries for hearing aids | 31% | 62% | 47% |
| • Telecoil for use with the telephone or for listening in public places that have a special “hearing loop” sound system designed to communicate wirelessly with some hearing aids | 29% | 59% | 43% |
| • Tinnitus masker , which masks or reduces the negative effects of tinnitus | 26% | 51% | 35% |
Table 4. Percent of Hearing Aid (HA) Owners Who Report Having a Feature also Report that the Feature has the Most Positive Impact on their Listening experience in Each Fitting Channel.
|
HA features
Question: Which of the following HA features, accessories, or apps have the most positive impact on your listening experience? (Customized to each owner's set—could select up to 3) |
Got HA(s)
in past 5 y
by channel (% “Yes”) |
||
|---|---|---|---|
|
In-person fitted
( n = 429) |
Remote fitted
( n = 45) |
Self-fitting
( n = 27) |
|
| Rechargeable hearing aid | 34% | 9% | 22% |
| Volume control | 32% | 26% | 44% |
| The ability to stream sound from a smartphone directly into your hearing aids | 23% | 13% | 7% |
| Program button | 17% | 13% | 19% |
| Downloadable “app” for smart phones | 16% | 24% | 27% |
| The ability to “link” volume or program changes | 15% | 25% | 9% |
| Rechargeable batteries | 12% | 18% | 27% |
| HA remote control | 12% | 12% | 8% |
| Body-worn Bluetooth device | 8% | 7% | 22% |
| TV streamer | 12% | 11% | 5% |
| Tinnitus masker | 9% | 21% | 2% |
| The ability to stream sound from a TV, cell phone, or computer using additional accessory | 9% | 10% | 25% |
| Directional, dual, twin, or multiple microphones | 7% | 9% | 13% |
| Telecoil | 6% | 6% | 3% |
| Companion microphone | 3% | 8% | 4% |
Telephone Use
There are two specific listening situations listed in Table 2 that warrant further consideration, specifically “talking on a cell phone” and “talking on a traditional telephone.” The ability to use and connect with others via telephone can be critically important for many adults for purposes such as scheduling medical appointments, 30 31 participating in telehealth, 32 33 or simply staying in contact with friends and family. 34 35 Table 2 demonstrates that about three-quarters of hearing aid owners are satisfied with their ability to talk on either type of telephone, while fewer than half of non-owners are satisfied. These data suggest that hearing aids can be beneficial on the telephone and that satisfaction with telephone conversation is substantially higher than it has been in the past. 36 Unfortunately, the current survey results also demonstrate continued difficulty on the telephone for about one quarter hearing aid owners.
Among the 83% of hearing aid owners who use their aid(s) on the phone, most hearing aid owners (51%) report at least occasional difficulties with the clarity of the speech or that the other person's speech was not loud enough (52% of hearing aid owners). Fortunately, buzzing or interfering noises were less common, with 36% of hearing aid owners reporting this happened “occasionally” or “regularly.” The use of the telephone is one example of a listening situation where the field has both simple and advanced technical solutions available. Yet, to maximize these solutions, patient training and counseling is often necessary; using the phone with a hearing aid is one of the skills hearing aid owners are less likely to acquire. 37 These data demonstrate that telephone use is an area that could generally be improved for hearing aid owners, either by counseling and training or with additional technological solutions.
One option for improving telephone communication, for those who do not already use it, would be a telecoil. Telecoils are relatively simple solutions for connecting to not only telephones but also looped rooms, which might also address the difficulties hearing aid owners continue to have in movie theaters and in leisure activities (see Table 2 ), such as religious services, theater outings, or group meetings. The current survey results demonstrate that more people who have telecoils (90% of hearing aid owners) are satisfied with their hearing aids than people without telecoils (82% of hearing aid owners), as shown in Fig. 2 .
Figure 2.
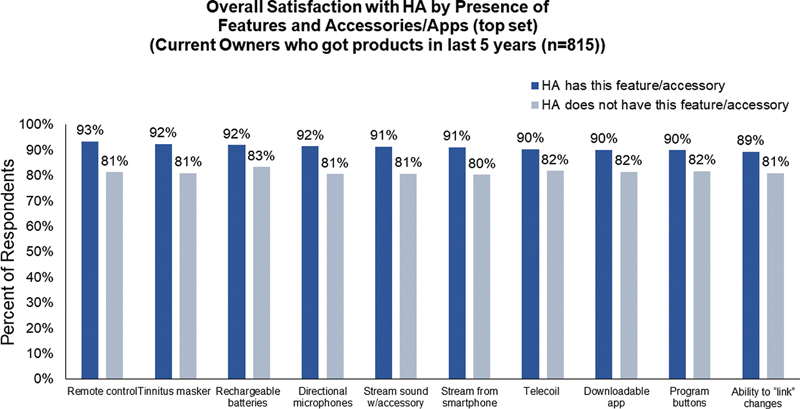
Percent of hearing aid owners who are satisfied with their devices based on whether they do or do not also have a particular feature (dark blue and light blue, respectively).
Interestingly, ownership of telecoils differs by acquisition channel (see Table 3 ), with owners in the in-person fitting channel less likely to report having telecoils. These data suggest that, when a hearing care professional is fully involved in the fitting, people are less likely to be fit with telecoils. It is not clear if this difference is due to the devices available in each channel or due to the decisions hearing care professionals made to not select telecoils in the in-person fitted channel. This effect warrants further investigation, given the robust potential benefits for telecoil use. 38 39 40 41
In some situations, telecoils could be replaced by wireless streaming, either from a smartphone or from a remote microphone system. As mentioned earlier, this technology is rapidly becoming more popular in hearing aid fittings, with almost half of hearing aid owners reporting they have that capability in the MarkeTrak 2022 survey (44% of hearing aid owners) and almost no owners reporting it in the MarkeTrak 2015 survey (2% of hearing aid owners). This streaming ability is also related to hearing aid satisfaction (see Fig. 2 ) and streaming is rated as one of the top features having a positive impact on listening ( Table 4 ), although it is not clear if the streaming is for the telephone, music, or other audio signals. Combined, these data demonstrate that some hearing aid owners continue to experience difficulty on the telephone and that telecoil and wireless streaming are both helpful solutions that positively impact hearing aid owners' satisfaction and listening experiences. Future work is warranted to further investigate causes of, and solutions to, the difficulty on the telephone that led to approximately one-quarter of hearing aid owners not being satisfied with telephone conversations.
Satisfaction
Hearing Aids
Survey respondents rated their hearing aid satisfaction on a scale of 1 to 7, where 1 indicates they were “very dissatisfied” and 7 indicates they were “very satisfied.” Scores of 1, 2, and 3 were combined to indicate general dissatisfaction (referred to as “bot-3 box scores”) and scores of 5, 6, and 7 were combined in some instances to indicate general satisfaction (referred to as “top-3 box scores”). The results of the current survey indicate 83% of hearing aid owners were satisfied with their devices, which is remarkably consistent with satisfaction rates over the last two previous cycles, where 83 and 81% of hearing aid owners reporting satisfaction in 2019 and 2015, respectively. b The overall satisfaction rates did not vary by fitting channel (see Fig. 3 ).
Figure 3.
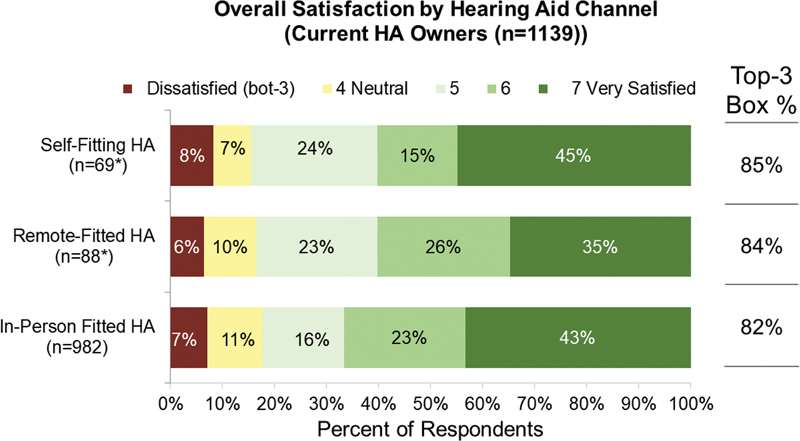
Percent of hearing aid owners in each fitting channel who reported each level of satisfaction. Also shown are the top-3 box satisfaction rates (combined scores of 5, 6, or 7) for hearing aid owners in each channel.
These high satisfaction rates are likely related to the hearing aid owners' met expectations. Most respondents reported that their devices met or exceed their expectations, with only 21% reporting hearing aids being somewhat worse (14%) or much worse (7%) than expected. The similarity of these two estimates (∼80% of people report they are satisfied and their expectations are met) is consistent with the previously established role of expectations in ratings of satisfaction in health care generally 42 43 and hearing aids specifically. 5 44
Figs. 4 to 6 display ratings of satisfaction with physical aspects, sound, and functional aspects and value of hearing aids, respectively. Overall, these figures are consistent with the high satisfaction rates, revealing lots of hearing aid owners are satisfied with most of the aspects of their hearing aids, especially the physical aspects of the hearing aid. Satisfaction rates for hearing aid sound are a little lower than the physical aspects, especially for the ability of the hearing aid to minimize background noise. While respondents are generally satisfied with the ease of use, they are less likely to be satisfied with the value and the price paid. These items were generally rated as less satisfactory in the MarkeTrak 2019 cycle as well, 45 demonstrating stability in the responses over time.
Figure 4.
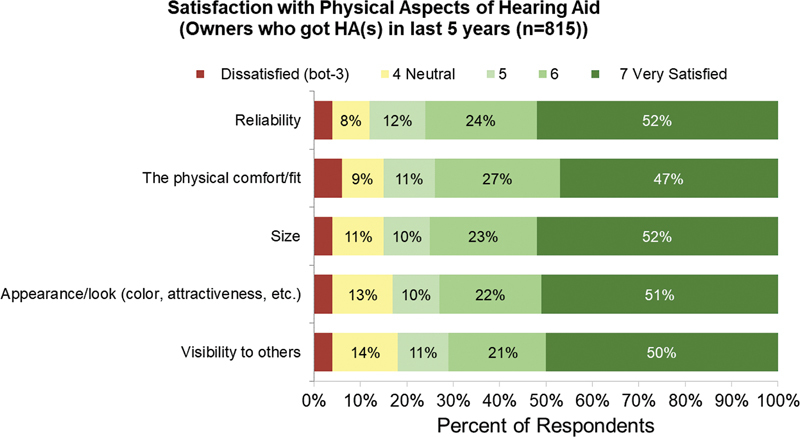
Percent of hearing aid owners who reported each level of satisfaction with physical aspects of their hearing aid(s).
Figure 6.
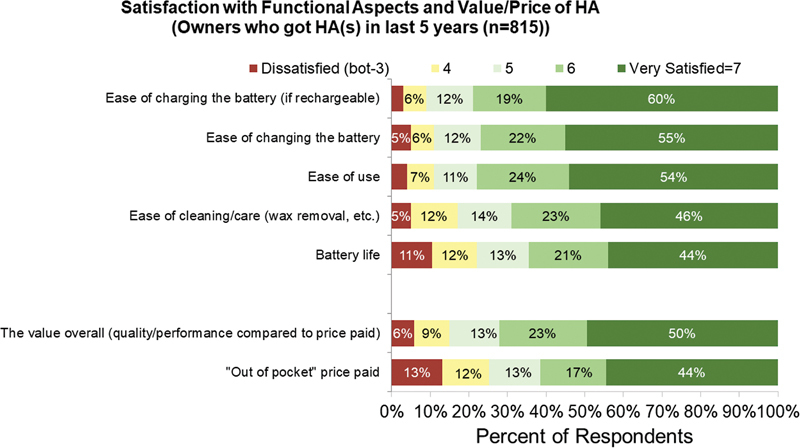
Percent of hearing aid owners who reported each level of satisfaction with the value/price of their hearing aid(s).
Figure 5.
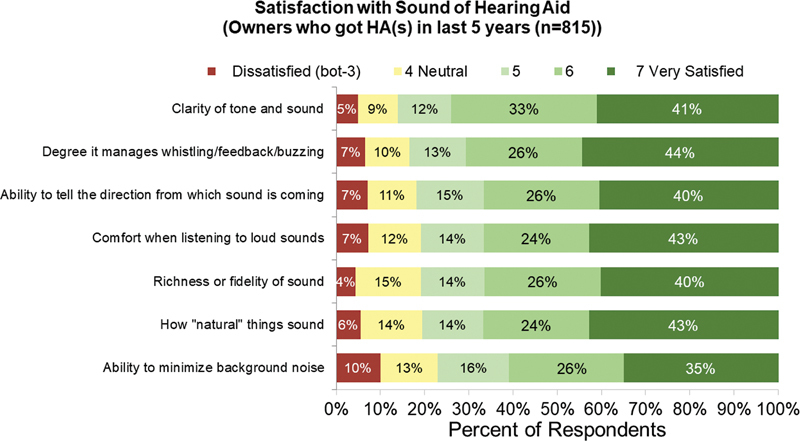
Percent of hearing aid owners who reported each level of satisfaction with the sound aspects of their hearing aid(s).
One area of change since the last cycle is the specific features that are associated with satisfaction. In MarkeTrak 2019, directional microphones, telecoils, and apps were associated with the largest satisfaction benefits, as evidenced by ratings of satisfaction from respondents with and without particular features. In MarkeTrak 2022, these features, while still influential, played a relatively smaller role than other features (see Fig. 2 ). Notably, remote controls, rechargeable batteries, and streaming from smartphone or with an accessory are all now more influential to satisfaction rates than they were in MarkeTrak 2019. These changes likely reflect the aforementioned rapid changes in wireless connectivity and battery rechargeability in the market in the interim years. 24
Hearing Care Professional Importance
The MarkeTrak 2022 survey results allow for a direct exploration of the hearing aid owners' perception of the importance of the professional. In the current survey, almost all hearing aid owners (91%) were satisfied with their fitting professional. Fig. 7 displays satisfaction rates for key areas of the hearing care practitioner and reveals most respondents are satisfied with all of the key areas. However, these data only apply to situations where a hearing care professional was involved (and includes hearing aid non-owners).
Figure 7.
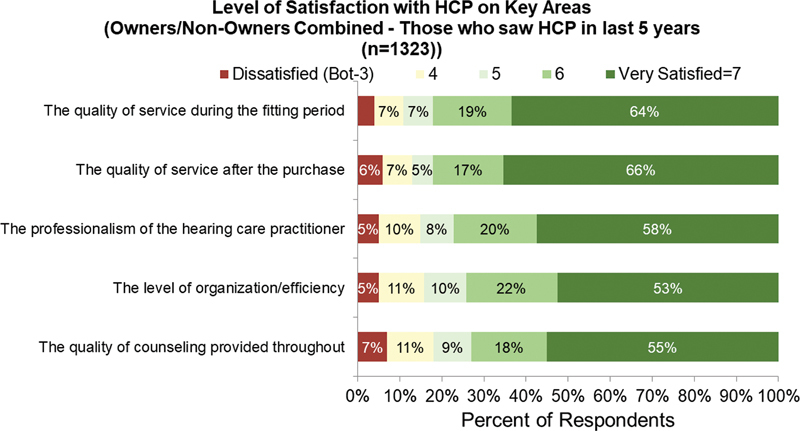
Percent of respondents (hearing aid owners and non-owners) who reported each level of satisfaction with their hearing care professional.
Some insight into the role of the hearing care professional can be seen in Fig. 8 , which displays ratings of professional helpfulness from respondents whose fitting was assisted by a hearing care professional (i.e., in-person or remote fit; left panel) or ratings of expected professional helpfulness from respondents who did not receive professional support (i.e., self-fit hearing aid or personal sound amplifier; Fig. 8 , right panel). The data reveal the majority of respondents in both groups thought a professional would provide a “moderately” or “a great deal” of help, highlighting the importance of a professional in the process. Even in the group who did not have professional assistance, a majority of people (71%) reported a professional would have been beneficial. These results speak directly to the experience of hearing aid owners and to the perceived importance of the hearing care professional in general to the fitting process.
Figure 8.
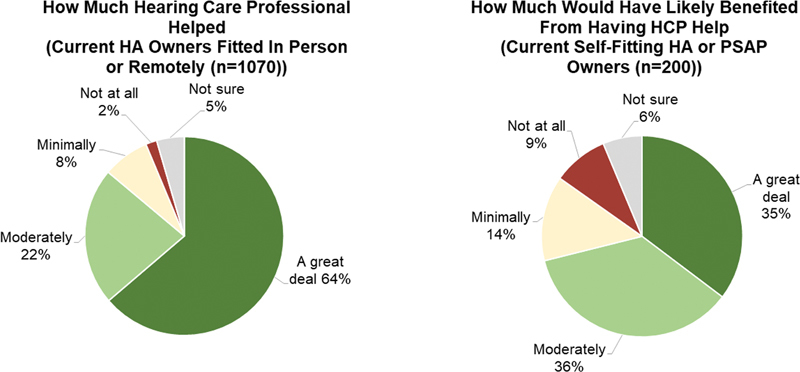
Percent of respondents who reported a hearing care professional was helpful (left panel) or would have been helpful (right panel).
The specific tasks that respondents felt comfortable with are displayed in Fig. 9 . In general, the figure displays that people who were fitted in person were less likely to feel comfortable performing tasks than people who were fitted remotely or were self-fit. That is, people in the in-person fitting channel felt less self-sufficient than in the channels where people were more responsible for handling tasks on their own. It is not possible from this dataset to determine if people self-selected into more limited-service fitting channels because they were more comfortable with these tasks, or if they were more comfortable with these tasks because they performed them on their own as part of the hearing aid fitting. Identifying the directionality of these effects might be important for understanding limited service delivery model candidacy, especially for clinics or distributors who offer a range of acquisition channels.
Figure 9.
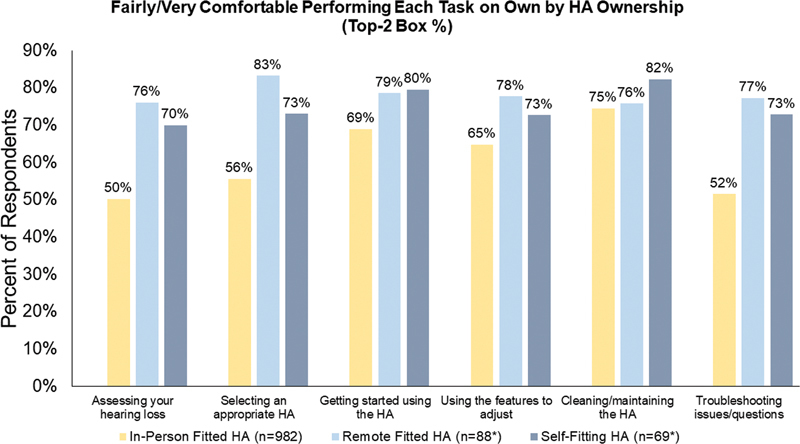
Percent of hearing aid owners who reported being “fairly” or “very” comfortable performing different tasks. Colors indicate participants in different fitting channels.
Fig. 9 also demonstrates that respondents generally felt least comfortable assessing their hearing loss or troubleshooting hearing aid issues. The majority of respondents felt comfortable using features to adjust the hearing aids, getting started using the hearing aid, and cleaning the hearing aid. These areas reflect tasks that could be specifically targeted for improvement under limited service delivery models, since they are tasks that people feel the least comfortable performing. Although the education materials were not evaluated in this survey, it is possible one of the reasons for lack of comfort by some hearing aid owners in the remote and self-fit acquisition channels is that the information was difficult to understand. The health care field has several examples of information being inaccessible to the typical patient, for example, due to readability or design issues. 46 47 To improve hearing aid owners' comfort in these tasks, it might be possible to create accessible, easily understood instructions, such as in the form of a modified hearing aid user guide, 48 or a multimedia educational program. 49
Finally, the MarkeTrak 2022 survey allows for direct measurement of satisfaction with the fitting process by evaluating the degree to which people recommend or promote a device or a company. 50 Fig. 10 displays the Net Promoter Score (NPS) for respondents who acquired hearing aids in each channel. The NPS is a score calculated based on responses to the question “How likely would you be to recommend this establishment/company?” Responses range from 10 to 0, with scores of 9 or 10 indicating someone is a “promoter,” scores of 8 or 7 indicate someone is “passive,” and scores of 6 or below indicate someone is a “detractor.” The NPS is calculated as the percent of people who are promoters minus the percent of people who are detractors, with higher NPS indicating a service or company is likely to be recommended and, by proxy, that someone is satisfied with that company. 51 In addition, although the relationships are imperfect, the NPS has been related to brand growth 52 53 and customer loyalty. 54 Therefore, NPSs could be important for not only indicating satisfaction but prediction of future trends either in terms of market growth or repeat business.
Figure 10.
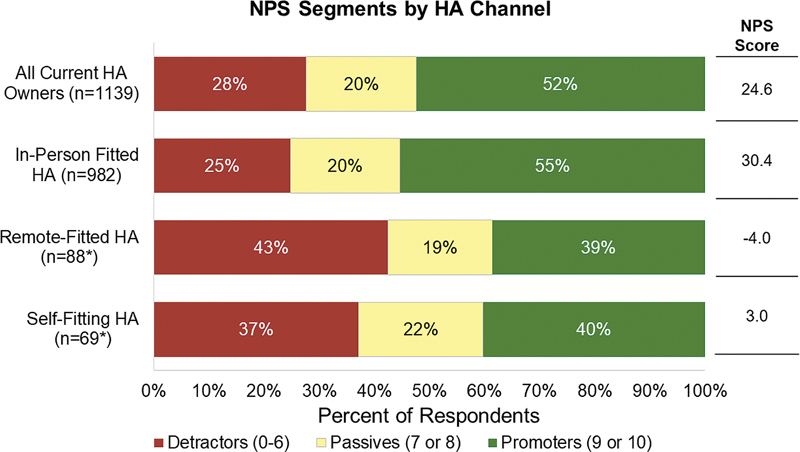
Percent of hearing aid owners who were promoters, passives, or detractors in each fitting channel. Also displayed is the Net Promoter Score (NPS) for each channel.
As shown in Fig. 10 , more hearing aid owners were promoters than detractors, with an NPS score of 24.6. However, that score is driven largely by the group of hearing aid owners who had an in-person fitting. The remote-fitted and self-fitted hearing aid channel NPSs were −4.0 and 3.0, respectively, suggesting approximately the same number of respondents were promoters as well as distractors when their hearing aids were not fit in person. Given the satisfaction rates are generally the same for hearing aids in all three channels ( Fig. 3 ), it is likely that the difference between the NPSs is related to the services received or the manufacturer overall, rather than the devices themselves. That is, respondents are satisfied with the hearing aids, but not their experience with the hearing aid acquisition and follow-up care, because they are less likely to recommend that manufacturer to others. These results are somewhat consistent with recent work looking at family-centered services, where traditional hearing health care services received an NPS of 22, but services where the family member was invited and involved in care received an NPS of 83. 55 Combined, these data demonstrate that in-person services (and family-centered care) currently contribute to a positive NPS. This conclusion has potentially important implications for brand growth and loyalty that should be considered within the context of historically low hearing aid adoption rates and the push for over-the-counter service delivery models. If the NPSs do not improve for brands with limited service delivery options, the over-the-counter service hearing aid options might not serve their intended purpose of expanding hearing aid access. Additional work is warranted to evaluate the factors contributing to the low NPS, especially in the remote and self-fit channels.
Conclusions
Hearing aids improve the quality of life for hearing aid owners and the likelihood that someone will report these benefits has increased since 2015. These increases might be attributable to changes in technology and the availability of advanced features. Specifically, more people in the current survey have rechargeable hearing aids and batteries, telecoils, wireless streaming, downloadable apps, and wireless streamers (for the television or companion microphone). Many of these advanced features could also contribute to high hearing aid satisfaction, although satisfaction rates have been stable over the last several MarkeTrak surveys at around 80% of hearing aid owners. Interestingly, satisfaction rates are similar for people who acquired hearing aids through the three different fitting channels (in person, remote, and self-fit). However, most people said the help of a professional was (or would be) helpful, regardless of which fitting channel they were in. People reported they were least comfortable with the idea of assessing their own hearing loss or troubleshooting hearing aid issues.
Interestingly, respondents in the remote and self-fit channels, which involved less support for a hearing care professional, were less likely to be satisfied with their hearing aid company, which has implications for market growth and customer loyalty. Because satisfaction rates were similar in all three fitting channels, it is possible the differences in brand satisfaction are related to the services or support they did receive. Patient satisfaction, and their willingness to speak well of or promote their experiences, is related to maintaining and attracting patients. 42 Therefore, one of the keys to improving the historically low hearing aid adoption rates (∼38% in the current survey) could be ensuring existing hearing aid owners are satisfied. MarkeTrak 2022 results indicate that most people are satisfied with their hearing aids, regardless of the acquisition channel, but those who were fit remotely or in person are not likely to promote the company that sold their devices. Therefore, the over-the-counter service delivery models, while resulting in high hearing aid satisfaction rates, will need to improve on the services rendered and the NPSs, which have the potential to affect market growth and customer loyalty. Future work is warranted to examine if these conclusions hold for devices that are not labeled as hearing aids, such as personal sound amplifiers, or for different devices fit under the new “over-the-counter” regulatory category.
Conflict of Interest None declared.
Financial Disclosures
None to report.
References
- 1.Humes L E, Wilson D L, Barlow N N, Garner C. Changes in hearing-aid benefit following 1 or 2 years of hearing-aid use by older adults. J Speech Lang Hear Res. 2002;45(04):772–782. doi: 10.1044/1092-4388(2002/062). [DOI] [PubMed] [Google Scholar]
- 2.Dornhoffer J R, Meyer T A, Dubno J R, McRackan T R. Assessment of hearing aid benefit using patient-reported outcomes and audiologic measures. Audiol Neurotol. 2020;25(04):215–223. doi: 10.1159/000506666. [DOI] [PMC free article] [PubMed] [Google Scholar]
- 3.Kitterick P T, Ferguson M A. Hearing aids and health-related quality of life in adults with hearing loss. JAMA. 2018;319(21):2225–2226. doi: 10.1001/jama.2018.5567. [DOI] [PubMed] [Google Scholar]
- 4.Brodie A, Smith B, Ray J. The impact of rehabilitation on quality of life after hearing loss: a systematic review. Eur Arch Otorhinolaryngol. 2018;275(10):2435–2440. doi: 10.1007/s00405-018-5100-7. [DOI] [PMC free article] [PubMed] [Google Scholar]
- 5.Wong L L, Hickson L, McPherson B. Hearing aid satisfaction: What does research from the past 20 years say? Trends Amplif. 2003;7(04):117–161. doi: 10.1177/108471380300700402. [DOI] [PMC free article] [PubMed] [Google Scholar]
- 6.Convery E, Keidser G, Hickson L, Meyer C. The relationship between hearing loss self-management and hearing aid benefit and satisfaction. Am J Audiol. 2019;28(02):274–284. doi: 10.1044/2018_AJA-18-0130. [DOI] [PubMed] [Google Scholar]
- 7.Cox R M, Alexander G C. Measuring satisfaction with amplification in daily life: The SADL scale. Ear Hear. 1999;20(04):306–320. doi: 10.1097/00003446-199908000-00004. [DOI] [PubMed] [Google Scholar]
- 8.Cox R M, Alexander G C, Gray G A. Personality, hearing problems, and amplification characteristics: contributions to self-report hearing aid outcomes. Ear Hear. 2007;28(02):141–162. doi: 10.1097/AUD.0b013e31803126a4. [DOI] [PubMed] [Google Scholar]
- 9.Ferguson M A, Woolley A, Munro K J. The impact of self-efficacy, expectations, and readiness on hearing aid outcomes. Int J Audiol. 2016;55 03:S34–S41. doi: 10.1080/14992027.2016.1177214. [DOI] [PubMed] [Google Scholar]
- 10.Hickson L, Hamilton L, Orange S. Factors associated with hearing aid use. Aust J Audiol. 1986;8(02):37–41. [Google Scholar]
- 11.Jerram J C, Purdy S C. Technology, expectations, and adjustment to hearing loss: predictors of hearing aid outcome. J Am Acad Audiol. 2001;12(02):64–79. [PubMed] [Google Scholar]
- 12.Gatehouse S. Components and determinants of hearing aid benefit. Ear Hear. 1994;15(01):30–49. doi: 10.1097/00003446-199402000-00005. [DOI] [PubMed] [Google Scholar]
- 13.Wilson C, Stephens D. Reasons for referral and attitudes toward hearing aids: do they affect outcome? Clin Otolaryngol Allied Sci. 2003;28(02):81–84. doi: 10.1046/j.1365-2273.2003.00669.x. [DOI] [PubMed] [Google Scholar]
- 14.Kemker B E, Holmes A E. Analysis of prefitting versus postfitting hearing aid orientation using the Glasgow Hearing Aid Benefit Profile (GHABP) J Am Acad Audiol. 2004;15(04):311–323. doi: 10.3766/jaaa.15.4.5. [DOI] [PubMed] [Google Scholar]
- 15.Abrams H B, Chisolm T H, McManus M, McArdle R. Initial-fit approach versus verified prescription: comparing self-perceived hearing aid benefit. J Am Acad Audiol. 2012;23(10):768–778. doi: 10.3766/jaaa.23.10.3. [DOI] [PubMed] [Google Scholar]
- 16.National Academies of Sciences Engineering and Medicine . Washington, DC: National Academies Press; 2016. Hearing Health Care for Adults: Priorities for Improving Access and Affordability. [PubMed] [Google Scholar]
- 17.Reed N S, Betz J, Kendig N, Korczak M, Lin F R. Personal sound amplification products vs a conventional hearing aid for speech understanding in noise. JAMA. 2017;318(01):89–90. doi: 10.1001/jama.2017.6905. [DOI] [PMC free article] [PubMed] [Google Scholar]
- 18.Humes L E, Rogers S E, Quigley T M, Main A K, Kinney D L, Herring C. The effects of service-delivery model and purchase price on hearing-aid outcomes in older adults: a randomized double-blind placebo-controlled clinical trial. Am J Audiol. 2017;26(01):53–79. doi: 10.1044/2017_AJA-16-0111. [DOI] [PMC free article] [PubMed] [Google Scholar]
- 19.Brody L, Wu YH, Stangl E. A comparison of personal sound amplification products and hearing aids in ecologically relevant test environments. Am J Audiol. 2018;27(04):581–593. doi: 10.1044/2018_AJA-18-0027. [DOI] [PMC free article] [PubMed] [Google Scholar]
- 20.Sabin A T, Van Tasell D J, Rabinowitz B, Dhar S. Validation of a self-fitting method for over-the-counter hearing aids. Trends Hear. 2020;24:2.331216519900589E15. doi: 10.1177/2331216519900589. [DOI] [PMC free article] [PubMed] [Google Scholar]
- 21.Chen C H, Huang C Y, Cheng H L. Comparison of personal sound amplification products and conventional hearing aids for patients with hearing loss: a systematic review with meta-analysis. EClinicalMedicine. 2022;46:101378. doi: 10.1016/j.eclinm.2022.101378. [DOI] [PMC free article] [PubMed] [Google Scholar]
- 22.Humes L E, Kinney D L, Main A K, Rogers S E. A follow-up clinical trial evaluating the consumer-decides service delivery model. Am J Audiol. 2019;28(01):69–84. doi: 10.1044/2018_AJA-18-0082. [DOI] [PMC free article] [PubMed] [Google Scholar]
- 23.Keidser G, Convery E. Outcomes with a self-fitting hearing aid. Trends Hear. 2018;22:2.331216518768958E15. doi: 10.1177/2331216518768958. [DOI] [PMC free article] [PubMed] [Google Scholar]
- 24.Groth J, Ruggles D, Ellison J.Sizing up hearing aids in the 21st century: is there still room for improvement. Audiology OnlineAccessed June 1, 2022 at:https://www.audiologyonline.com/articles/resound-21st-century-hearing-aids-27299?print=true
- 25.Picou E M, Roberts R A, Angley G, Ricketts T A. Applying the hearing aid fitting standard to selection for adults. Semin Hear. 2022;43(02):66–78. doi: 10.1055/s-0042-1748874. [DOI] [PMC free article] [PubMed] [Google Scholar]
- 26.Cox R M, Schwartz K S, Noe C M, Alexander G C. Preference for one or two hearing AIDS among adult patients. Ear Hear. 2011;32(02):181–197. doi: 10.1097/AUD.0b013e3181f8bf6c. [DOI] [PMC free article] [PubMed] [Google Scholar]
- 27.Glyde H, Dillon H, Young T, Seeto M, Roup C. Determining unilateral or bilateral hearing aid preference in adults: a prospective study. Int J Audiol. 2021;60(05):341–349. doi: 10.1080/14992027.2020.1828629. [DOI] [PubMed] [Google Scholar]
- 28.Manchaiah V, Picou E M, Bailey A, Rodrigo H. Consumer ratings of the most desirable hearing aid attributes. J Am Acad Audiol. 2021;32(08):537–546. doi: 10.1055/s-0041-1732442. [DOI] [PubMed] [Google Scholar]
- 29.Bridges J F, Lataille A T, Buttorff C, White S, Niparko J K. Consumer preferences for hearing aid attributes: a comparison of rating and conjoint analysis methods. Trends Amplif. 2012;16(01):40–48. doi: 10.1177/1084713811434617. [DOI] [PMC free article] [PubMed] [Google Scholar]
- 30.Zhang X, Yu P, Yan J. The Netherlands: IOS Press; 2014. Patients' adoption of the e-appointment scheduling service: a case study in primary healthcare; pp. 176–181. [PubMed] [Google Scholar]
- 31.Junod Perron N, Dao M D, Righini N C. Text-messaging versus telephone reminders to reduce missed appointments in an academic primary care clinic: a randomized controlled trial. BMC Health Serv Res. 2013;13(01):125. doi: 10.1186/1472-6963-13-125. [DOI] [PMC free article] [PubMed] [Google Scholar]
- 32.Rimmer J H, Wang E, Pellegrini C A, Lullo C, Gerber B S. Telehealth weight management intervention for adults with physical disabilities: a randomized controlled trial. Am J Phys Med Rehabil. 2013;92(12):1084–1094. doi: 10.1097/PHM.0b013e31829e780e. [DOI] [PubMed] [Google Scholar]
- 33.Ansell D, Crispo J AG, Simard B, Bjerre L M. Interventions to reduce wait times for primary care appointments: a systematic review. BMC Health Serv Res. 2017;17(01):295. doi: 10.1186/s12913-017-2219-y. [DOI] [PMC free article] [PubMed] [Google Scholar]
- 34.Moyal A. The feminine culture of the telephone. People, patterns and policy. Prometheus. 1989;7(01):5–31. [Google Scholar]
- 35.Aledavood T, López E, Roberts S G. Daily rhythms in mobile telephone communication. PLoS One. 2015;10(09):e0138098. doi: 10.1371/journal.pone.0138098. [DOI] [PMC free article] [PubMed] [Google Scholar]
- 36.Kochkin S.MarkeTrak VI: 10-year customer satisfaction trends in the US hearing instrument market Hearing Review. 200291014–25., 45 [Google Scholar]
- 37.Desjardins J L, Doherty K A. Do experienced hearing aid users know how to use their hearing AIDS correctly? Am J Audiol. 2009;18(01):69–76. doi: 10.1044/1059-0889(2009/08-0022). [DOI] [PubMed] [Google Scholar]
- 38.Cashman M Z, Rossman R N, Abel S M. A comparison of three modes of hearing aid-telephone coupling. J Otolaryngol. 1982;11(04):239–247. [PubMed] [Google Scholar]
- 39.Sorri M, Piiparinen P, Huttunen K. Hearing aid users benefit from induction loop when using digital cellular phones. Ear Hear. 2003;24(02):119–132. doi: 10.1097/01.AUD.0000058111.61435.53. [DOI] [PubMed] [Google Scholar]
- 40.Picou E M, Ricketts T A. Efficacy of hearing-aid based telephone strategies for listeners with moderate-to-severe hearing loss. J Am Acad Audiol. 2013;24(01):59–70. doi: 10.3766/jaaa.24.1.7. [DOI] [PubMed] [Google Scholar]
- 41.Kochkin S, Sterkens J, Compton-Conley C. Consumer perceptions of the impact of inductively looped venues on the utility of their hearing devices. The Hearing Review. 2014;35(05):16–26. [Google Scholar]
- 42.Ross C K, Frommelt G, Hazelwood L, Chang R W. The role of expectations in patient satisfaction with medical care. J Health Care Mark. 1987;7(04):16–26. [PubMed] [Google Scholar]
- 43.Baron-Epel O, Dushenat M, Friedman N. Evaluation of the consumer model: relationship between patients' expectations, perceptions and satisfaction with care. Int J Qual Health Care. 2001;13(04):317–323. doi: 10.1093/intqhc/13.4.317. [DOI] [PubMed] [Google Scholar]
- 44.Cox R M, Alexander G C.Expectations about hearing aids and their relationship to fitting outcome J Am Acad Audiol 20001107368–382., quiz 407 [PubMed] [Google Scholar]
- 45.Picou E M. MarkeTrak 10 (MT10) survey results demonstrate high satisfaction with and benefits from hearing aids. Semin Hear. 2020;41(01):21–36. doi: 10.1055/s-0040-1701243. [DOI] [PMC free article] [PubMed] [Google Scholar]
- 46.Manchaiah V, Kelly-Campbell R J, Bellon-Harn M L, Beukes E W. Quality, readability, and suitability of hearing health-related materials: a descriptive review. Am J Audiol. 2020;29(03):513–527. doi: 10.1044/2020_AJA-19-00040. [DOI] [PubMed] [Google Scholar]
- 47.Caposecco A, Hickson L, Meyer C. Hearing aid user guides: suitability for older adults. Int J Audiol. 2014;53 01:S43–S51. doi: 10.3109/14992027.2013.832417. [DOI] [PubMed] [Google Scholar]
- 48.McMullan A, Kelly-Campbell R J, Wise K. Improving hearing aid self-efficacy and utility through revising a hearing aid user guide: a pilot study. Am J Audiol. 2018;27(01):45–56. doi: 10.1044/2017_AJA-17-0035. [DOI] [PubMed] [Google Scholar]
- 49.Gomez R, Ferguson M. Improving self-efficacy for hearing aid self-management: the early delivery of a multimedia-based education programme in first-time hearing aid users. Int J Audiol. 2020;59(04):272–281. doi: 10.1080/14992027.2019.1677953. [DOI] [PubMed] [Google Scholar]
- 50.Hamilton D F, Lane J V, Gaston P. Assessing treatment outcomes using a single question: the net promoter score. Bone Joint J. 2014;96-B(05):622–628. doi: 10.1302/0301-620X.96B5.32434. [DOI] [PubMed] [Google Scholar]
- 51.Reichheld F. 2011. The Ultimate Question 2.0 (revised and expanded edition): How net Promoter Companies Thrive in a Customer-Driven World. Harvard Business Review Press. [Google Scholar]
- 52.Van Doorn J, Leeflang P S, Tijs M. Satisfaction as a predictor of future performance: a replication. Int J Res Mark. 2013;30(03):314–318. [Google Scholar]
- 53.Pingitore G, Morgan N A, Rego L L, Gigliotti A, Meyers J.The single-question trapMarketing Research 2007;19(02):
- 54.Fisher N I, Kordupleski R E. Good and bad market research: a critical review of Net Promoter Score. Appl Stochastic Models Bus Ind. 2019;35(01):138–151. [Google Scholar]
- 55.Ekberg K, Timmer B H, Francis A, Hickson L. Improving the implementation of family-centred care in adult audiology appointments: a feasibility intervention study. Int J Audiol. 2022 doi: 10.1080/14992027.2022.2095536. [DOI] [PubMed] [Google Scholar]