

Abstract
RNA modulation via small molecules is a novel approach in pharmacotherapies, where determination of structural properties of RNA motifs is considered a promising way to develop drugs capable of targeting RNA structures to control disease. However, due to the complexity and dynamic nature of RNA molecules, determination of RNA structures using experimental approaches is not always feasible, and computational models employing force fields can provide important insight. The quality of the force field will determine how well the predictions are compared to experimental observables. Stacking in nucleic acids is one such structural property, originating mainly from London dispersion forces, which are quantum mechanical, and are included in molecular mechanics force fields through non-bonded interactions. Geometric descriptions are utilized to decide if two residues are stacked or not, and hence to calculate the stacking free energies for RNA dinucleoside monophosphates (DNMP) through statistical mechanics for comparison with experimental thermodynamics data. Here we benchmark four different stacking definitions using molecular dynamics (MD) trajectories for 16 RNA DNMP produced by two different force fields (RNA-IL and ff99OL3) and show that our stacking definition better correlates with the experimental thermodynamics data. While predictions within an accuracy of 0.2 kcal/mol at 300 K were observed in RNA CC, CU, UC, AG, GA, and GG, stacked states of purine-pyrimidine and pyrimidine-purine DNMPs, respectively, were typically under-predicted and over-predicted. Additionally, population distributions of RNA UU DNMPs were poorly predicted by both force fields, implying a requirement for further force field revisions. We further discuss the differences predicted by each RNA force field. Finally, we show that discrete path sampling (DPS) calculations can provide valuable information and complement the MD simulations. We propose the use of experimental thermodynamic data for RNA DNMPs as benchmarks for testing RNA force fields.
Introduction.
In recent years, RNA-based therapeutics have emerged as a promising field for drug discovery endeavors. 1–3 In this respect, structure-based strategies are considered a rational choice for developing drugs capable of targeting different RNA motifs to control the mechanisms behind diseases.4 Due to the complexity and dynamic nature of RNA molecules, determination of RNA structures using experimental approaches is not always feasible. Approaches using computational methods provide tools that can fill this important gap. Nevertheless, accurate modeling of RNA depends on how well experimental results can be predicted with a force field using parameters to describe the bonded and non-bonded interactions observed in biomolecular systems.
The set of forces that control and maintain biomolecules require appropriate descriptions and rigorous testing to have realistic and accurate predictions for theoretical and computational work. In this set of forces, stacking interactions have particular importance in biomolecules, especially in nucleic acids. The stacking interactions originate mainly from London dispersion forces, which are quantum mechanical.5–6 These interactions, while not explicitly simulated, are included in molecular mechanics force fields through non-bonded interactions, such as electrostatic and Lennard–Jones (LJ) interactions between solute-solute and solute-solvent. However, the ability of force fields to correctly predict stacking interactions has been debated, where multiple studies indicate the widely used AMBER force field to overstabilize base-base stacking.7–8 The fact that stacking ↔ unstacking transformations in nucleic acids dictated by force fields play a significant role in the accuracy of structural predictions necessitates comprehensive testing of the ability to predict experimental results for this phenomenon. Methods based on quantum mechanical calculations, despite their shortcomings in excluding the solvent effects,9 can provide more accurate data regarding stacking interactions, however, high computational demands make them unfeasible for most biological systems. Instead, statistical methods must be used. These methods provide a relatively fast and fairly accurate, yet approximate, approach for assessing the ability of force fields to correctly represent stacking interactions, which can serve as a useful benchmark for further force field improvements.
Current computational methods require a geometrical definition for stacking, which should distinguish multiple different stacked states from unstacked ones. Different experimental approaches have been utilized to investigate stacking in nucleic acids. For example, ribose coupling constants measured by NMR spectroscopy is a sensitive tool to detect stacking and address issues such as the roles of base stacking in conformational flexibility and the extent of stacking for each nucleotide residue.10–13 Fast spectroscopy techniques utilize excimer detection technology to discuss the extent of changes observed in π-π stacking in adenosine dimers.14 Circular dichroism (CD) spectroscopy uses signal amplitude variations of spectral features, which are sensitive to changes in base pair distances.15–16 Fluorescence labeling can measure changes in intensity through quenching, which is sensitive to the geometry of the stacked bases.17–18 In this regard, experimental studies of single-stranded RNA DNMPs measuring thermodynamics of stacking ↔ unstacking can provide a benchmark to assess the accuracy of empirical force fields in producing correct stacked and unstacked states. Such experimental studies,19–21 despite their known shortcomings,22 are reliable sources for assessing the accuracy of currently available force fields for nucleic acids, especially RNA.
The inherent flexibility of RNA imposes extra difficulties in defining an already complicated concept such as base stacking. Because stacking is one of the main stabilizing forces in nucleic acids, it is common to define the population distribution of stacked and unstacked states in RNA DNMPs as a simple test system.23–24 The ability of current force fields to accurately describe stacking interactions is pivotal to properly investigating highly dynamic conformations of RNA. Theoretical studies on the geometrical descriptions of base stacking are as scarce as experimental studies of RNA DNMPs. The work by Gabb et al. is an early attempt to use spatial orientation of bases with some degree of overlap to define stacking.25 In other attempts, Norberg and Nilsson used a distance-based criterion to capture stacked configurations26–27 while Vokácová et al. added an extra term in their criteria to capture angular dependencies of planar bases.28 Jafilan et al. used a combination of distance and angle cutoffs in their reaction coordinate to analyze stacking.24 Brown et al. added a third ingredient to their recipe, which has two distance-based criteria and an angular term.23 Finally, Condon et al. have used three different criteria to measure stacking: (1) distance between the centers of masses based on X-ray data, (2) an angular parameter describing the degree of overlap between bases, and (3) a parameter describing the minimum angle between the normal vectors of the bases.29 Nevertheless, these definitions use the same cutoff values to investigate stacking in purine-purine, purine-pyrimidine, pyrimidine-purine, and pyrimidine-pyrimidine DNMPs. Furthermore, the distance and angle-based criteria used in these definitions are subjective and/or arbitrary, which can create flaws in the analyses. A better approach would be to combine all these three different terms to yield a stacking score, which is then compared to a stacking cutoff fit to experimental thermodynamics data (unstacking ↔ stacking) of the 16 RNA DNMPs to decide if a state is stacked or unstacked. This way, the flaws due to arbitrary selections of the cutoffs are by-passed and the deciding force on stacking is given to the experimental thermodynamics data of RNA DNMPs.
Molecular dynamics simulations along with experimental efforts can provide useful insights into the conformational ensemble an RNA molecule may exhibit, where the validity of predictions depend on the accuracy of the RNA force field. In the past few years there have been several attempts to increase the accuracy of currently available RNA force fields to improve the agreement of the equilibrium probability of conformations obtained from MD simulations with those observed experimentally.30–32 Despite all the flaws of available force fields, well-converged simulations can still provide useful information about the conformational ensemble of RNA systems. In this regard, RNA DNMPs are simple systems, which could be used as benchmarks for evaluating the quality of RNA force fields, while including all relevant backbone torsions.
In this study, we benchmarked four different stacking definitions denoted as Brown,23 Florian,24 Condon,29 and modified Condon (Condonmod), where Condonmod is our modified version of the original Condon definition of stacking created using a continuous scoring function, as opposed to the discontinuous method used in Condon, and extending the use of experimental thermodynamics data of RNA DNMPs in the stacking definition. Furthermore, we utilized the discrete path sampling (DPS) approach to predict the unbiased energy landscapes for all the 16 RNA DNMPs and to determine the preferred stable states. Additionally, we performed 10 μs long MD simulations in explicit solvent for each of the 16 RNA DNMPs using the amber ff14 force field (ff99OL3)33–34 and ff99 with revised χ32 and α/γ31 torsional parameters (abbreviated as RNA-IL) to predict the stacking free energies. MD trajectories are analyzed with each stacking definition to predict stacking free energies, which are compared to the experimental results of Frechet et al.20 We show that the stacking definition of Condonmod better explains the experimental thermodynamics data, and that the combination of either ff99OL3 or RNA-IL with the Condonmod definition of stacking follow similar trends, where both force fields produce comparable results. For example, RNA CC, CU, UC, AG, GA, and GG DNMPs described by both force fields produced almost perfect predictions, where |ΔΔG|, representing the difference between the experimental and predicted free energies for unstacking ↔ stacking (u↔s), were less than 0.3 kcal/mol. On the other hand, stacked states of purine-pyrimidine and pyrimidine-purine DNMPs, respectively, were typically under-predicted and over-predicted. Additionally, both force fields fail to correctly predict the population distributions of RNA UU DNMPs, which, based on several NMR studies, has the lowest tendency to stay in a stacked form, with an experimental unstacked population of 94% at 300 K.19–20 We propose the use of experimental thermodynamics data of RNA DNMPs as benchmarks for testing RNA force fields, which can expose additional problems in RNA force fields requiring revision.
Methods
Brown Stacking Definition.23
Three criteria are used in this definition to determine whether a structure is stacked or not. All three conditions must pass for any given RNA DNMP to be considered a stacked state, otherwise it is considered an unstacked state, and are defined as follows: 1) Distance between any pair of heavy atoms (C, O, N) from the two base residues must be less than 4 Å (Figure 1). 2) Distance between the center of mass (COM) of each base residue must be less than or equal to 5 Å. 3) Angle, θ, between the two planes representing the bases should be 0° ≤ θ ≤ 45° or 135° ≤ θ ≤ 180°.
Figure 1.

Depiction of the distance criteria used by Brown’s stacking definition on RNA AA DNMP. Base heavy atoms are displayed with black spheres, where distance between any pair of base heavy atoms on separate residues must be less than 4 Å. As an example, distance between :2@N9 and : 1@C6 is displayed with a black line. A total of 10×10=100 such distance checks are performed in Brown’s stacking definition because an adenosine residue has 10 base heavy atoms.
Florian Stacking Definition.24
In this definition, a stacking coordinate, ξ, (Eq. 1) is used to define stacking that is proportional to the vertical distance between the center of masses of two consecutive bases refined by an angular term including the angle between the two planes.
| Eq. 1 |
In eq. 1 RM (in Å) is the distance between the COM of each residue, and S(α) is an angular term defined as
| Eq. 2 |
In eq. 2, α is the angle between the planes of the two bases in radians yielding S(α) ~ 1 when −20° < α < 20° and 160° < α < 200°, S(α = 90°) = 0.1, and S(α = −90°) = 0.
Condon Stacking Definition.29
In this method, a total stacking score, S, is calculated using eq. 3.
| Eq. 3 |
In eq. 3, D, b, and a, represent individual scores calculated for the distance between the COM of each residue (d), the angle between the normal of 5′-base and the vector connecting the COM of each residue called ‘overlap angle’ (ω), and the normal angle between the two planes representing the base residues (Ξ) (Figure 2). X-ray-based cutoffs are utilized in calculating these individual scores, which are described below.
Figure 2.

Visualization of parameters used in Condon and Condonmod (d, ω, Ξ). The green and red vectors represent the normals of best-fit planes for base heavy atoms of 5’- and 3’- residues, respectively, in an RNA CC DNMP. The black arrow represents the vector connecting the center-of-masses of bases. Translated black and green vectors are highlighted in transparent forms to display the definitions of ω and Ξ.
Distance between COM of each residue, d (Å), (Figure 2) is calculated and then used in eq. 4 to get a distance-based score, D (Å).
| Eq. 4 |
If D = 0 Å, the DNMP is immediately considered unstacked. Note that according to eq. 4, if 3.5 Å ≤ d0 < 5.0 Å, the distance score is linearly reduced from 1 to 0.
2. In Figure 2, ω represents the angle between the normal of 5′-base and the vector connecting the COM of each base, and is used to calculate b using eq. 5.
| Eq. 5 |
If b = 0, the DNMP is immediately considered unstacked.
3. The angle between the normals of each base residue, Ξ, (Figure 2) is calculated to get a score, a, using eq. 6.
| Eq. 6 |
If the total stacking score, S, defined in eq. 3, is greater than 1, the structure is considered stacked. While the original definition is used for a qualitative measurement of stacking on an entire trajectory, we have applied it to individual structures to produce a stacking ratio.
Modified Condon Stacking Definition.
Condonmod is designed to yield a continuous functional form for stacking using the same set of angular and distance parameters as defined in Condon’s approach. In Condonmod, the stacking score is equal to the sum of all the components as follows.
| Eq. 7 |
In eq. 7, SMC is the stacking score using the modified Condon definition, d is the distance between COM of each base heavy atoms, ω is the angle between the normal of the 5′-base and the vector between COM of each residue, and Ξ is the angle between the two normal vectors representing each residue base (Figure 2). Each component of eq. 7 roughly replicates the criteria defined in the Condon stacking definition. The distance component in eq. 7, , will produce values of ∞, 1, and 0 at d equal to 0, 3.5, and 5 Å, respectively, and negative values beyond 5 Å. Eq. 7 uses to allow for an exponential change in values as the distance approaches zero, and scales the logarithmic function so that a distance d = 5 Å results in . In the denominator, again, scales the function so that a distance d = 3.5 Å will yield . The ω angle component in eq. 7 will give a score of 1 when ω = 0 radians (0°), and −1 when ω = π/4 radians (45°), behaving similarly to b in Condon′s stacking definition. The Ξ angle component in eq. 7 is identical to that of ω, which differs from a in the Condon’s stacking definition as the score is not a binary number (−1 or 1) but a continuous one with values between −1 and 1. Comparison of results for Condon and Condonmod is displayed in Figure 3.
Figure 3.

Comparison of Condon (a) and Condonmod (b). Visualization of “leniency” provided by Condonmod compared to Condon using distance vs ω with a heat map representing the stacking scores is displayed in the figure. The black lines on each figure represent the point at which a given structure is no longer considered stacked. Note that Condon’s stacking definition has distinct and “sharp” cutoffs causing some potentially stacked structures to be considered unstacked, while the Condonmod would consider said structures to be stacked.
If SMC ≥ SMCC, where SMCC is a cutoff, structures are considered to be stacked. If SMC ≥ 1.99 for RNA-IL and SMC ≥ 1.65 for ff99OL3, the given structure is considered stacked. These cutoffs, SMCC, were determined using experimental data to optimize the predictions for each force field, as described below.
Each SMCC cutoff (1.99 and 1.65) was determined using an average experimental ratio of unstacked states to the total number of states obtained from Frechet et al.20 The experimental data reported the enthalpy and entropy of the 16 RNA DNMPs, which were used to calculate the free energies at 300 K (Table 1). These free energy values were then converted into a ratio of stacked to unstacked states and used to determine each SMCC cutoff.
Table 1.
Listing of the stacking free energies (ΔG0) of unstacking → stacking transformations as predicted by RNA-IL and ff99OL3 and described by each geometric definition discussed. Root-mean-square error (RMSE) values with respect to the experimental values are listed in the final row. All calculations are done at 300 K. Values in parentheses correspond to calculated uncertainties.
| ΔG0 (kcal/mol)a | |||||||||
|---|---|---|---|---|---|---|---|---|---|
|
| |||||||||
| DNMPs | Experiment | Florian (RNA-IL) | Florian (ff99OL3) | Condon (RNA-IL) | Condon (ff99OL3) | Brown (RNA-IL) | Brown (ff99OL3) | Condonmod (RNA-IL) | Condonmod (ff99OL3) |
| AA | −0.21 (± 0.58) | −0.58 (± 0.05) | −0.51 (± 0.01) | −0.28 (± 0.05) | −0.22 (± 0.01) | −0.29 (± 0.05) | −0.23 (± 0.01) | 0.49 (± 0.04) | 0.21 (± 0.04) |
| AC | 0.19 (± 0.22) | −0.76 (± 0.03) | −0.30 (± 0.00) | −0.63 (± 0.02) | −0.14 (± 0.00) | −0.65 (± 0.03) | −0.16 (± 0.00) | −0.02 (± 0.01) | 0.15 (± 0.01) |
| AG | 0.09 (± 0.22) | −0.75 (± 0.02) | −0.67 (± 0.02) | −0.42 (± 0.02) | −0.37 (± 0.02) | −0.44 (± 0.02) | −0.39 (± 0.03) | 0.39 (± 0.01) | 0.12 (± 0.01) |
| AU | 0.32 (± 0.22) | −0.68 (± 0.03) | −0.32 (± 0.06) | −0.58 (± 0.02) | −0.21 (± 0.05) | −0.61 (± 0.04) | −0.24 (± 0.06) | −0.05 (± 0.03) | 0.05 (± 0.03) |
| CA | 0.27 (± 1.19) | −0.70 (± 0.02) | −0.36 (± 0.04) | −0.39 (± 0.01) | −0.04 (± 0.02) | −0.45 (± 0.03) | −0.06 (± 0.03) | 0.77 (± 0.03) | 0.64 (± 0.02) |
| CC | 0.42 (± 0.81) | −1.11 (± 0.04) | −0.38 (± 0.06) | −0.82 (± 0.03) | −0.16 (± 0.05) | −1.00 (± 0.03) | −0.23 (± 0.06) | 0.39 (± 0.01) | 0.38 (± 0.05) |
| CG | −0.01 (± 0.23) | −0.91 (± 0.01) | −0.70 (± 0.03) | −0.55 (± 0.06) | −0.35 (± 0.02) | −0.64 (± 0.08) | −0.39 (± 0.04) | 0.54 (± 0.02) | 0.26 (± 0.02) |
| CU | 0.22 (± 0.52) | −1.27 (± 0.03) | −0.40 (± 0.01) | −1.02 (± 0.01) | −0.24 (± 0.01) | −1.16 (± 0.01) | −0.29 (± 0.01) | 0.14 (± 0.00) | 0.20 (± 0.01) |
| GA | 0.09 (± 0.81) | −1.06 (± 0.01) | −0.84 (± 0.00) | −0.73 (± 0.02) | −0.54 (± 0.01) | −0.73 (± 0.04) | −0.54 (± 0.00) | 0.16 (± 0.03) | −0.04 (± 0.03) |
| GC | 0.11 (± 2.00) | −1.56 (± 0.10) | −0.78 (± 0.06) | −1.34 (± 0.01) | −0.59 (± 0.06) | −1.36 (± 0.02) | −0.60 (± 0.06) | −0.58 (± 0.01) | −0.27 (± 0.01) |
| GG | 0.02 (± 0.40) | −1.30 (± 0.19) | −1.06 (± 0.14) | −0.93 (± 0.10) | −0.76 (± 0.13) | −0.95 (± 0.10) | −0.77 (± 0.12) | 0.08 (± 0.06) | −0.16 (± 0.06) |
| GU | 0.39 (± 0.50) | −1.26 (± 0.03) | −0.62 (± 0.05) | −1.12 (± 0.17) | −0.49 (± 0.04) | −1.15 (± 0.17) | −0.51 (± 0.05) | −0.39 (± 0.09) | −0.08 (± 0.09) |
| UA | 0.12 (± 0.47) | −0.60 (± 0.01) | −0.49 (± 0.03) | −0.28 (± 0.04) | −0.17 (± 0.02) | −0.35 (± 0.04) | −0.20 (± 0.03) | 0.83 (± 0.03) | 0.60 (± 0.03) |
| UC | 0.56 (± 0.59) | −0.66 (± 0.01) | −0.09 (± 0.02) | −0.43 (± 0.01) | 0.14 (± 0.02) | −0.54 (± 0.01) | 0.10 (± 0.02) | 0.40 (± 0.01) | 0.67 (± 0.01) |
| UG | 0.44 (± 1.27) | −0.81 (± 0.04) | −0.53 (± 0.00) | −0.41 (± 0.03) | −0.11 (± 0.00) | −0.55 (± 0.04) | −0.19 (± 0.01) | 0.58 (± 0.01) | 0.64 (± 0.02) |
| UU | 1.60 (± 1.01) | −0.51 (± 0.00) | 0.05 (± 0.01) | −0.30 (± 0.01) | 0.28 (± 0.00) | −0.39 (± 0.00) | 0.23 (± 0.00) | 0.50 (± 0.00) | 0.95 (± 0.00) |
|
| |||||||||
| RMSE | 0.00 | 1.27 | 0.83 | 1.24 | 0.88 | 1.10 | 0.64 | 0.51 | 0.31 |
Experimental uncertainty was calculated using simple propagation of errors, assuming all variables were uncorrelated. This is likely not the case, however, there is no alternative method of calculation due to the lack of information from Frechet et al.20 Uncertainties for predictions were calculated by block averaging each simulation into two blocks of 5 μs, and calculating the standard deviation between the two resulting free energy values. Note that a positive ΔG0 value imply preference towards unstacked states.
The free energy of stacking, ,35 is defined as
| Eq. 8 |
where R is the gas constant, T is the temperature, and Si and Ui are the number of stacked, and unstacked states, respectively, for an RNA DNMP with i representing the dinucleotide steps of AA, AC, AG, AU, CA, CC, CG, CU, GA, GC, GG, GU, UA, UC, UG, UU. Assuming that the system can be described using these two states, Si and Ui, the total number of structures in a particular RNA DNMP simulation, Ni, can be written as
| Eq. 9 |
Solving for Si in eq.s 8 and 9, one can combine the results to get
| Eq. 10 |
which can be rewritten as
| Eq. 11 |
In eq. 11, the left-hand side represents the percentage of unstacked states predicted from MD simulations, which will depend on what the SMCC cutoff is. The right-hand side represents the experimental result of a specific RNA DNMP using the data of Frechet et al (Table 1),20 which will be used to optimize SMCC.
As noted above, eq. 11 defines the connection between the prediction and experimental result for a specific RNA DNMP, which can be rewritten as follows, by combining all the results for the 16 RNA DNMPs.
| Eq. 12 |
In our studies, each MD trajectory of RNA DNMP is 10 μsec long and has 500,200 snapshots. Thus, we can set Ni = N, and rewrite eq. 12 as
| Eq. 13 |
where Ui represents the total number of unstacked states observed in all the MD trajectories for the 16 DNMP simulations. As before, the right hand side of eq. 13 is determined by the values obtained from experimental data,20 while the left hand side corresponds to the predictions with respect to the cutoff SMCC. Because each MD trajectory has the same number of structures, N, eq. 13 can be rewritten as
| Eq. 14 |
where Ntotal = 16N, and the right-hand side is the average value of calculated using experimental stacking free energies, , for all the 16 RNA DNMPs. Figure 4 displays the frequency analyses of stacking scores, SMC, for all the combined MD trajectories. In the frequency distribution analysis, all the calculated stacking scores, SMC, for the structures extracted from the MD trajectories of all the 16 RNA DNMP systems were combined and utilized to optimize the SMCC cutoffs. SMCC for the Condonmod definition is optimized for the experimental data, by finding the point in the distribution where the ratio of structures considered unstacked to the total number of structures in the distribution equals the experimental value determined by the right-hand-side of eq. 14. Note that in Figure 4, the frequency distribution represents the total number of structures observed in the combined MD trajectories with respect to stacking score SMC. In Figure 4, the red and blue portions of the distribution represent the stacked and unstacked states, respectively. By varying the value of SMCC, the percentage unstacked states can be changed, and, therefore, the left-hand side of eq. 14, which was performed to optimize the stacking cutoffs, SMCC.
Figure 4:

Frequency distribution analysis of stacking scores determined by Condonmod for structures extracted from the MD trajectories of all the 16 RNA DNMPs to optimize SMCC for RNA-IL (left) and ff99OL3 (right) force fields. Red and blue portions of the distributions represent stacked and unstacked states, respectively, where the cutoffs were predicted using eq. 14. Note that MD simulations are performed at 300 K.
This optimization relies on the assumptions that structures produced by MD simulation using the respective RNA force fields are accurate enough for direct comparison to empirical data and that the experimental thermodynamic data are reliable enough for comparison to computational studies. Furthermore, optimization approach allows for the stacking cutoffs to be directly extracted from the experimental data, rather than being arbitrarily selected as done by the other definitions.
One of the shortcomings of the Condon definition is that structures are considered stacked only if the bases are nearly on top of each other and nearly parallel. For example, if a given DNMP conformation has its bases close to each other with an Ξ = 134° and ω = 0°, the conformation will be considered unstacked, despite there being partial π-π interactions between the bases. The criterion used in the Condon definition is based on the conformational analysis of X-ray derived structures of RNA and performs well for the purposes of their study. However, for our investigation a more lenient definition is required. If a DNMP has its bases in parallel-displaced configurations with d > 3.5 Å or in T-shaped configurations with d ≤ 3.5 Å, the structure is energetically favorable as a result of partial π-π interactions and the DNMP can be considered stacked based on the potential energy of the conformation.9, 36–38 The Condon definition, however, will immediately regard these structures as unstacked, and, thus, will consider them energetically unfavorable. Because of this choice, the modifications to the Condon definition were made to allow more freedom in what is considered to be stacked. The score considers all three aspects of a conformation defined in the Condon definition, with no cutoffs for the individual values, considering only the total score when determining whether a conformation is stacked or not. With this new approach, distance has the greatest influence on the stacking score, while the angles ω and Ξ will add or subtract at most a score of 1 from the total. The effects of this change are visualized in ω as conformations where the angle ω lies at the “extremes” of the definition will be included, given that the distance is small enough. Additionally, the modified version allows for the total cutoff to be based directly against the experimental thermodynamics data we are using for comparison. In the Condon definition, a stacking score cutoff of 1 is used to define the stacked states. The Condonmod definition, having no cutoffs for the specific angular and distance parameters as Condon does, allows for a directly comparable overall cutoff.
Explicit Solvent Molecular Dynamics (MD) Simulations.
The simulations were carried out with AMBER 1639 simulation package using the revised χ32 and α/γ31 torsional parameters, which we call RNA-IL. A second set of simulations were carried out using the ff99OL3 force field, which uses the ff99 force field40 with parmbsc0 α/γ41 and σOL330 modifications. The nucgen module of AMBER 16 was utilized to build the initial structures in A-form for each RNA DNMP (AA, AC, AG, AU, CA, CC, CG, CU, GA, GC, GG, GU, UA, UC, UG, UU). Each system was first neutralized with a single Na+ ion42, which then was solvated with 2000 TIP3P43 water molecules in a truncated octahedral box with periodic boundary conditions. Each system was then augmented with five Na+ and Cl− ions to mimic physiological conditions, where after equilibration each system had 0.162 M Na+ concentrations. The structures were first minimized and then equilibrated in two steps as described before.44 After minimization and equilibration, a 10 μs MD simulation with the RNA-IL and ff99OL3 force fields with a 2 fs time step was performed for each system using NPT dynamics with isotropic positional scaling and Berendsen barostat. The reference pressure was set to 1 atm with a pressure relaxation time of 2 ps. SHAKE45 was turned on for constraining bonds involving hydrogen atoms. An atom-based long-range cutoff of 8.0 Å was used in the production runs. The reference temperature was set to 300K. PME was used to handle the electrostatics.46 The Langevin thermostat47–48 was applied with a coupling constant γ = 1.0 ps−1.
Discrete Path Sampling (DPS) calculations.
We utilized the discrete path sampling (DPS) approach to explore the energy landscapes of all the RNA DNMPs studied.49 In this framework we build up a kinetic transition network based on local minima of the potential energy surface and the transition states that connect them. These stationary points are obtained using efficient geometry optimization tools, which enable us to treat high barriers and hence long-time scales. Thermodynamic and kinetic properties are extracted from the database using well established techniques of statistical mechanics and unimolecular rate theory. Full details are available in various reviews. 50–53 Because of the small size of the RNA DNMPs, DPS can be used for a global exploration of the conformational space, which should sample unbiased energy landscapes. Previously, we have successfully utilized the DPS approach to study 1×1 internal loops in RNA CAG and CUG repeat expansions, single-stranded RNA tetramers, RNA A-bulge,31, 54–56 and numerous other applications, which are summarized in the reviews. The RNA-IL force field was used to build the parameter and topology files for each system. The initial conformations for DPS calculations were created by running 1 microsecond MD simulations in implicit solvent. Cluster analyses were performed on each system with in-house scripts (Scripts S1 and S2). The backbone torsions connecting two residues (ε, ζ, α, β, γ) and the χ torsions of the two residues (χ1χ2) in the RNA DNMPs were analyzed, creating a clustering process with 7 parameters. The most populated 50 clusters were then selected, and average conformations for each cluster were then created. These 50 average structures were used as starting conformations for the DPS calculations. The initial database was built by first minimizing the starting conformations with a modified version of the LBFGS algorithm57 as implemented in the OPTIM program, and then attempting to make connections between each pair of minima in the initial phase. A convergence criterion of 10−6 kcal/mol was used for the root-mean-square gradient in defining all the stationary points. The database was then progressively refined by targeting minima with the highest values for the ratio of the barrier separating them from the global minimum to the corresponding energy difference for connection attempts. This scheme was designed to remove artificial frustration from the landscape, as described in detail elsewhere.58 Disconnectivity graphs59–61 were created to highlight the stable conformational states. At the end of the DPS calculations, almost all the minima were connected within the stationary point databases, and hence included in the disconnectivity graphs. We used the OPTIM and PATHSAMPLE codes (https://www-wales.ch.cam.ac.uk/software.html) for the DPS calculations. The harmonic superposition approximation50, 62–63 was employed for each database to estimate the free energies.
Analyses.
Analysis of the sugar pucker was performed using 3DNA.64 Cluster analyses were performed using the k-means algorithm implemented in the cpptraj module of AMBER16. Cpptraj was also used to calculate the average structures for each corresponding cluster. The number of target clusters were varied between 8 to 20 using all heavy atoms to capture different conformational ensembles experienced along the trajectory. In-house scripts were utilized for cluster analysis of MD trajectories (Script S3). A submodule of cpptraj, nastruct, was used to extract and analyze the torsions.
Results and Discussion.
To calculate stacking free energies, in-house scripts (Scripts S4-S10), which include all four definitions described in the Methods, were used to determine the populations of stacked and unstacked states. Estimated populations representing stacked and unstacked RNA DNMPs were used to predict the free energies of unstacking (u) → stacking (s) for each RNA DNMP, , using eq. 8, where i represents each of the 16 RNA DNMPs.
Comparison of free energies predicted for unstacking (u) → stacking (s) transformation to experimental thermodynamics data of RNA DNMPs.
Table 1 displays the stacking free energies predicted for all 16 RNA DNMPs using four stacking definitions for each of the RNA-IL and ff99OL3 force fields, where predictions are compared to experimental values reported by Frechet et al.20 and calculated from ΔH0 and ΔS0 values at 300 K (Figure 5). The stacking definition of Florian overall produced results in poor agreement with the experimental data, while the definitions proposed by Brown and Condon performed better (Figure 5). Condonmod produced the best agreement with experimental out of all the definitions for both forcefields, while still maintaining the general trends presented in other definitions (Figure 5). This trend was analyzed using root-mean-square error (RMSE) results to compare the accuracy of predictions to experimental thermodynamics data (Table 1). Condonmod had a considerably lower RMSE of 0.51 and 0.32 kcal/mol for RNA-IL and ff99OL3, respectively, compared to Florian, Brown, and Condon, which produced RMSE around 1.1-1.2 and 0.6-0.8 kcal/mol for RNA-IL and ff99OL3.
Figure 5.

Comparison of predicted stacking free energies (ΔG0) of unstacking ↔ stacking transformations to experimental (red) thermodynamics data for all 16 RNA DNMPs using four stacking definitions, highlighted in figure legends, for RNA-IL and ff99OL3 force fields. Condonmod is referred to revised Condon in the figure. The line of best fit is used to emphasize the correlation between the predicted and experimental data, where the more the overlap of lines of best fit the better the overall performance.
As described in the Methods section, the Condonmod definition gives flexibility while determining the state of the structure. Although few are observed, Condonmod can capture stacked structures overlooked by the other definitions such as T-shaped stacked states (Table S1). Previous studies reported T-shaped structures in the MD simulations of nucleic acids.65 Multiple ab initio studies performed on benzene indicate that parallel displaced and T-shaped configurations are essentially isoenergetic with an energy difference of 2.7 kcal mol−1.66–67 As a result, it is not unexpected to observe T-shaped structures in the MD simulations as they have comparable energetics as parallel displaced conformations. This improvement, along with the fact that Condonmod employs a cutoff value extracted from experimental thermodynamics data, results in better performance compared to other three definitions, enabling a more detailed comparison with experimental data. By comparing predictions to experimental data for the RNA DNMP sets, specifically using the Condonmod predictions, some trends for RNA DNMPs can be identified, which can be used in evaluating both the strengths and potential issues with RNA force fields. The 16 RNA DNMPs we investigated can be categorized as purine-purine (Pu-Pu), purine-pyrimidine (Pu-Py), pyrimidine-purine (Py-Pu), and pyrimidine-pyrimidine (Py-Py), where adenosine and guanosine represent the purine residues and cytidine and uridine represent the pyrimidine residues.
In RNA guanine–purine DNMPs, stacking properties are correctly predicted by both the RNA-IL and ff99OL3 force fields. The absolute value differences of experimental and predicted free energies for the unstacking (u) → stacking (s) transformation, , in RNA GA and GG DNMPs are less than 0.2 kcal/mol (Table S2). A less than 0.2 kcal/mol would signify an accurate prediction. For example, experimental measured for RNA GA DNMP is 0.09 kcal/mol, while the predicted values for RNA-IL and ff99OL3 are 0.17 and −0.05 kcal/mol, respectively (Table 1). Similar predictions are observed in RNA GG DNMP, where the experimental is 0.02 kcal/mol, while the predictions for RNA-IL and ff99OL3 are 0.08 and −0.16 kcal/mol, respectively (Table 1).
Analyses of the RNA AA DNMP show that both forcefields underpredict the stacked states, i.e., stacked states are not as stable as they should be. According to experimental thermodynamics data, RNA AA DNMP prefers stacked states with a measured of −0.21 kcal/mol. Nevertheless, predictions by RNA-IL and ff99OL3 produce of 0.49 and 0.22 kcal/mol, respectively (Table 1). This trend is slightly changed in the analyses of RNA AG DNMP, where is measured to be 0.09 kcal/mol, while the free energies predicted by RNA-IL and ff99OL3 are 0.40 and 0.12 kcal/mol, respectively, yielding < 0.3 kcal/mol (Table S2).
While relatively good predictions are observed in RNA Pu-Pu DNMPs, both RNA force fields overstabilize the stacked states in RNA guanine-pyrimidine DNMPs. For example, the experimental measured for RNA GC DNMP is 0.11 kcal/mol, while it is predicted to be −0.59 and −0.27 kcal/mol, respectively, by RNA-IL and ff99OL3 yielding 0.38 < < 0.70 kcal/mol (Table S2). This result holds for RNA GU DNMP as well, where experimental measurements produce a of 0.39 kcal/mol, while it is predicted to be −0.39 and −0.09 kcal/mol, respectively, by RNA-IL and ff99OL3, yielding 0.48 < < 0.78 kcal/mol (Table S2). Predictions of in RNA adenine-pyrimidine DNMPs were modestly better. For example, the experimental measured for RNA AU DNMP is 0.32 kcal/mol implying preference toward unstacked states, while it is predicted to be around 0 kcal/mol by both RNA-IL and ff99OL3, yielding around 0.30 kcal/mol (Table S2). A similar result was observed in the analyses of RNA AC DNMP, where predictions by RNA-IL and ff99OL3 display of −0.03 and 0.15 kcal/mol, respectively, compared to experimental of 0.19 kcal/mol, yielding < 0.2 kcal/mol (Table S2).
When investigating the RNA cytidine-purine DNMPs, both force fields understabilized the stacked states. For example, the experimental values measured for RNA CA and UA DNMPs are 0.27 and −0.02 kcal/mol, respectively, while they are predicted to be 0.78 and 0.54 kcal/mol by RNA-IL, and 0.64 and 0.27 kcal/mol by ff99OL3, yielding 0.28 < < 0.56 kcal/mol (Table S2). A similar trend was seen in RNA UA DNMP, where the experimental is 0.12 kcal/mol and the predicted values are 0.83 and 0.61 kcal/mol by RNA-IL and ff99OL3, respectively, yielding 0.49 < < 0.71 kcal/mol (Table S2). A better prediction is observed for RNA UG DNMP where the experimentally measured of 0.44 kcal/mol is reproduced with < 0.20 kcal/mol by both RNA force fields (Table S2).
Predictions for RNA Py-Py DNMPs performed comparatively the best in both forcefields, except for the RNA UU DNMP (Table 1). Predicted values of RNA CC, CU, and UC DNMPs are particularly accurate with < 0.20 kcal/mol (Table S2). For example, the predicted of RNA CC DNMP by RNA-IL and ff99OL3 is 0.39 kcal/mol, which is within 0.03 kcal/mol compared to the experimental measurements (Table S2). For all the definitions, the largest deviation from the experimental data was observed in RNA UU DNMPs, with of 1.1 and 0.7 kcal/mol for RNA-IL and ff99OL3, respectively. The experimental of RNA UU DNMP is 1.6 kcal/mol, which implies excessive preference for unstacked states, with only 6% of structures exhibiting stacked conformations, while predictions by RNA-IL and ff99OL3 determined to be 0.51 and 0.95 kcal/mol, respectively (Table S2). The experimental data is largely in agreement with other studies, which show RNA UU DNMPs preferring mostly unstacked states at equilibrium.20–21, 68–70 Our results suggest that further revisions in RNA force fields are needed to reconcile predictions with experimental thermodynamics data of RNA DNMPs, particularly for RNA AA, AU, CA, CG, GC, GU, UA, and UU DNMPs.
Distribution of sugar pucker: Occurrences of C4′-exo and C2′-exo.
RNA residues are known to prefer both C3′- and C2′-endo sugar puckers with higher preference for the former state. In some earlier studies, it was found that the sugar conformation is determined by the stacking interactions as well as the nature of the base.19 By adopting the concept of pseudorotation,71 which utilizes the amplitude (vm) and the phase angle (P) of a five-membered ring to describe sugar puckers, we analyzed the percentages of different sugar puckers adopted by the residues in the 16 RNA DNMPs in the MD simulations. The first noteworthy difference between the two force fields concerns the percentage of C3′-endo populations observed in RNA Py-Py DNMPs. On average, the RNA-IL force field produces over 15% more C3′-endo population in Py-Py DNMPs compared to the ff99OL3 force field (Figure 6, Tables S3 and S4). This difference becomes even more pronounced in RNA CC DNMPs, where RNA-IL predicts C3′-endo populations of 62% and 69%, respectively, for the 5′- and 3′-end residues, while ff99OL3 predicts 49% and 43% for these residues (Table S3). On average, RNA-IL predicts 57% and 59% C3′-endo populations for the 5′- and 3′-end residues of Py-Py DNMPs, respectively, while these values drop to 34% and 27% in RNA Pu-Pu DNMPs (Table S4). Results of ff99OL3 display similar values for the Pu-Pu DNMPs. Using a two-state model, NMR studies indicate an equilibrium distribution of C2′-endo and C3′-endo sugar puckers in RNA DNMPs with a preference for C3′-endo.19 Both force fields can reproduce the experimentally observed preferences for C3′-endo rather successfully, with a better performance of RNA-IL overall (Tables S3 and S4). This trend is somehow broken in RNA AU DNMPs predicted by ff99OL3, where the C2′-endo population exceeds C3′-endo in the 3′-end uridine residue (Table S3). Furthermore, ff99OL3 predicts the 3′-end uridine of RNA GU DNMPs to have equally distributed populations (34%), as well as marginal preference for C3′-endo in 3′-end uridine of RNA CU DNMPs (31% C2′-endo vs 36% C3′-endo) (Table S3). For all of these combinations, RNA-IL consistently exhibits higher preferences for C3′-endo (Table S3). These results are in line with experimental studies as well, where NMR performed on RNA AU DNMPs suggests 59% C3′-endo population for the 3′-end uridine residue.19 Furthermore, experimental studies show that RNA DNMPs with 3′-cytosine residues prefer the highest population for C3′-endo sugar pucker. 19 For example, RNA-IL predicts 64% C3′-endo population for the 3′-cytosine residue in RNA GC DNMPs, which is in reasonable agreement with experimental measurements of 79% (Table S3),19 while ff99OL3 does not perform as well, with a 41% C3′-endo population predicted for the 3′-cytosine residue in RNA GC DNMPs (Table S3 and Figure 6).
Figure 6.
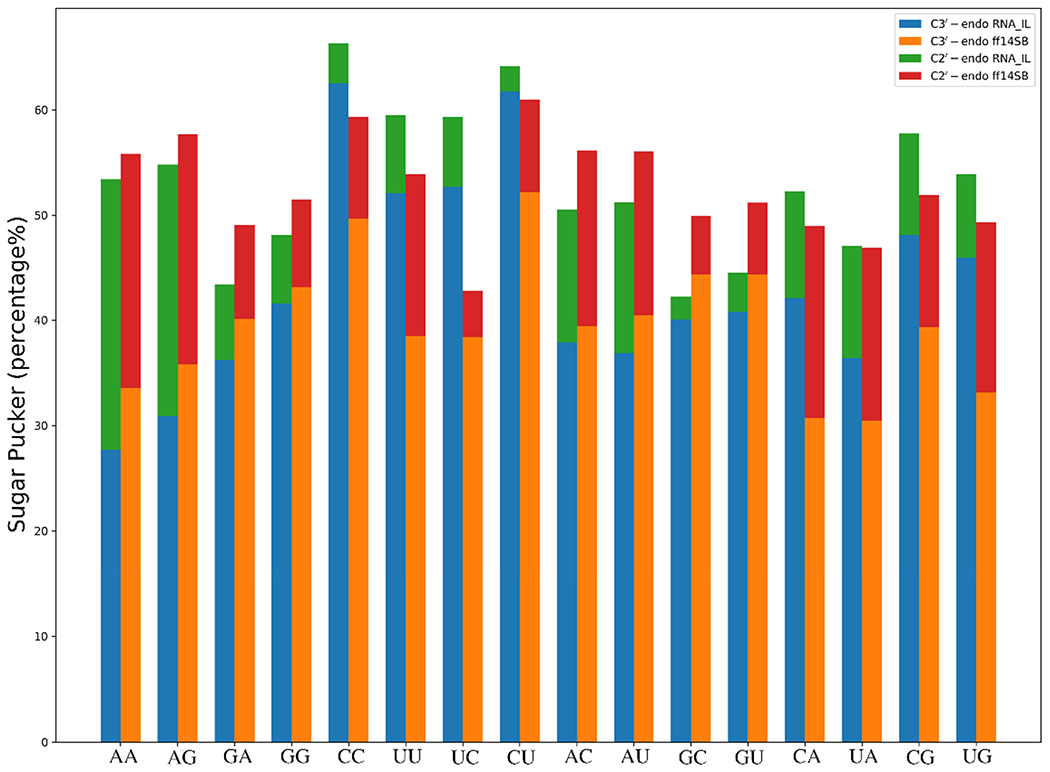
Analysis of the sugar pucker, using the pseudorotation metric, of all sets of RNA dimers applying ff99OL3 and RNA-IL force fields. Distribution of C3’-endo and C2’-endo puckers at the 5’-end is shown as the percent of the total structures. Because the percentages observed for “exo” puckers are not included in the plot, the total percentages do not add up to 100%.
Interestingly, two other unique sugar puckers, C4′-exo and C2′-exo, which have phase angles around 54° and −18°, respectively, are observed in our analyses, which are close to the C3′-endo region having a phase angle around 18°. Both force fields are predicting high C4’-exo populations in Pu-Pu and Py-Pu DNMPs at the 5′-end residues with an average between 28% and 31%, respectively (Tables S3 and S4). While in general, both force fields are predicting an average of over 20% C4′-exo populations at the 5′-end residues, RNA-IL predicts an average around 12-13% C4′-exo in Pu-Py and Py-Py (Table S4) as well as 33% and 20% C2′-exo, respectively (Table S4). In general, occurrence of C4′-exo at the 5′-end is higher than the 3′-end in both force fields (Tables S3 and S4). Even though the highest population predicted by both force fields is C3′-endo, the next most populated sugar pucker is C4′-exo, which is followed by C2′-exo and C2′-endo (Table S4). Measurements of 3JH1′-H2′ coupling constants combined with a two-state model can provide information about the ribose ring, but differentiation of C3′-endo from C4′-exo and C2′-exo is in general not possible. Furthermore, no detailed force field revision has been performed on the RNA sugar region, which might be crucial, as the orientation of the sugar pucker can affect the observed stacked and unstacked states. Re-puckering is not an unusual ribose transition, especially in the loop region of RNA structures.72 Analyses performed using the CoSSMos database73 revealed RNA structures having C4′-exo and C2′-exo puckers in the loop regions studied by NMR methods (Tables S5 and S6). If energetics would allow, it might be normal to observe C4′-exo and C2′-exo sugar puckers in RNA residues, but the balance between C4′-exo, C2′-exo, and C3′-endo is a missing piece in RNA force fields, which should be studied in detail in future work. In conclusion, it is probably fair to say that the RNA-IL force field better reproduces the experimental results in RNA DNMPs by better sampling the C3′-endo region.
It has been shown that introduction of methylated cytosine into a self-complementary DNA sequence, d(CCGGCGCCGG), can cause significant changes in the sugar pucker that are detectable in the IR regions sensitive to sugar pucker and glycosidic torsional angle. The results suggest the coexistence of two different major sugar puckers within the S-conformational family, with an increased relative contribution of the C2′-endo type of sugar in the methylated sequences.74 Such changes can be induced into different structures and changes in the sugar pucker can be studied along the MD trajectories. If such shifts happen in MD simulations, one can evaluate the accuracy of force fields by analyzing the sampled sugar puckers. One can also utilize 2′-O-Methyl RNA residues, which favor C3′-endo sugar pucker in canonical duplexes. These changes are detectable by NMR and can be another test case for evaluating force field performances.75
Conformational variability of RNA DNMPs.
RNA DNMPs are small systems, which will experience relatively fast structural transformations to sample different conformations in stacked and unstacked states.76 The energy landscapes of RNA DNMPs, therefore, have several distinct regions representing stacked and unstacked states.20, 68–70 We performed cluster analyses on each system to extract the stable conformational states preferred by each RNA DNMP. Figure 7 shows the RMSD analysis of the MD trajectories for all the 16 RNA DNMP sets using the ff99OL3 and RNA-IL force fields. To distinguish different conformations visited throughout these simulations, trajectories were color coded based on the data provided in Table S7. As a general pattern followed by almost all sets of RNA DNMPs, RNA-IL drives the DNMPs to adopt a more compact and less entropic conformational ensemble compared to ff99OL3, where the number of different structures visited along the trajectory in RNA-IL contain a limited number of conformational states, while ff99OL3 provides more variations (Figure 7 and Table S7). For example, 6 unique conformations are sampled by ff99OL3 in RNA GC DNMPs while RNA-IL samples only two conformations (Figure 7 and Table S7). This pattern is more pronounced, especially in RNA Py-Py DNMPs (CC, CU, UC, and UU), for RNA-IL, where over 77% of structures are observed in stacked states with anti-anti orientations (Table S7). The prevalence of stacked RNA AA, AC and AU DNMPs adopting the anti-anti orientation for RNA-IL is also a noteworthy difference between the performances of the two force fields (Table S7), as discussed in the next section. As mentioned above, the conformational variability observed in the MD trajectories of all 16 RNA DNMPs is more pronounced in ff99OL3.
Figure 7.

RMSD analysis performed on MD trajectories of all 16 RNA DNMPs predicted by ff99OL3 (A) and RNA-IL (B) force fields. Cluster analysis was performed on MD trajectories using an in-house script (Script S3) with a rmsd criteria of 1.2 Å. Color codes described in Table S7 are utilized to discriminate different structures observed along the trajectories.
Preference for anti over syn orientation.
One of the strong points of both force fields used in this study consists of the corrections implemented to the χ torsions, which properly defines the anti and syn configurations in RNA residues. The anti- and syw-regions are defined as 180° < χ < 280° and 50° < χ < 80°, respectively.77 Histogram analyses performed on the χ torsions of 3′-end residues (χ2) show that, irrespective of the force field being used, Pu-Pu and Py-Pu DNMPs exhibit a wide distribution with a significant population in the syn region, while the syn population almost disappears in the Pu-Py and Py-Py DNMPs, as expected (Figure 8). A similar analysis was performed on the 5′-end residues (χ1), which reveals that χ1 distributions were not as pronounced as χ2, although, we can still see high syn populations in Pu-Pu DNMPs (Figure S1). 5′-end residues are more flexible compared to 3′-end residues in RNA DNMPs, and thus it is expected that χ1 distributions will correlate with the results for RNA mononucleosides.32 Another noteworthy point about the χ2 results is the enriched high-anti (χ > 250°) populations observed in the 3′-purine residues predicted by both the ff99OL3 and RNA-IL force fields (Figure 8). The high-anti populations are observed in B-DNA structures, such as the G-bulge of the sarcin–ricin loop (SRL) with a χ torsion around 260°.78–79 It is generally accepted that RNA nucleobases adopt anti-conformations. However, occurrences of syn conformations are commonly observed among purines in regions having important functions in RNA molecules.77, 80 Even though at ambient temperatures coexistence of significant syn- and anti-populations is observed for adenosine residues, the syn conformation for free purines is disfavored by ~1.2 kcal/mol at 35 °C.81–82 Histogram analyses, which exhibit minor populations in the syn regions, confirm the fact that anti conformations are dominated by Py (Figures 8 and S1). The presence of the syn nucleobases in functional parts of RNA causes kinking in the backbone creating binding pockets, which is important in ligand interactions.77 Hence, the ability of RNA force fields in properly scanning the syn region is important especially from a functional standpoint.
Figure 8.

Histogram analyses performed on χ torsions of the 3’-end residue (χ2) for all the 16 RNA DNMPs using RNA-IL (blue) and ff99OL3 (orange). Compared to pyrimidine (Py) residues, purine (Pu) residues have tendencies towards syn. Therefore, Pu-Pu and Py-Pu DNMPs display a clear population in the syn region. Bases are considered syn and anti, respectively, if 50° ≤ χ ≤ 80°, and 180° ≤ χ ≤ 280°.
Heterogeneity of stacked conformations.
Alternative stacked and unstacked conformations are observed along the MD trajectories for all sets of RNA DNMPs. Equilibrium experimental studies are unable to distinguish between multiple stacked states, where the observed dynamics are restricted to either stacked or unstacked conformations. Stacking of a single-stranded RNA heptamer, A7, was first observed by Dewey and Turner in about 100 ns by laser temperature-jump method.83 Recently it has been shown that conformational transformations in RNA oligonucleotides are multi-timescale phenomena, which happen within the range of a few nanoseconds to 80 ns.84 It has also been argued that the heterogeneous decay of fluorescence signals in RNA DNMPs labelled with 2-aminopurine (2Ap) is an indication of the variability of stacked structures.85 Furthermore, femtosecond spectroscopy has shown the importance of the RNA ability to adopt multiple stacked states, especially in a highly dynamic structure like a tetraloop.86 These results have been confirmed theoretically through MD simulations,84 which are in line with our results, where cluster analyses to partition the observed structures along the trajectory for all sets of RNA DNMPs revealed multiple varied stacked states (Figure S2 and Table S7). RNA DNMPs are the simplest structures to investigate a variety of conformational states including stacked states. Determination of stable states observed in RNA DNMPs can provide important structural properties one can expect in dynamic RNA regions and can be used in homology modeling of these dynamic regions to further study other properties.
DPS results reinforce the MD results.
The discrete path sampling (DPS) method,49 a geometry optimization-based approach for landscape exploration, was applied to the RNA DNMPs, to complement the explicit solvent MD simulations. As explained in the methods section, RNA-IL along with an implicit solvent model is used for DPS calculations. DPS calculations produce a database of minima connected through transition states. Local minima have only real nonzero normal mode frequencies, while transition states have a unique imaginary frequency corresponding to the reaction path.87 Figure 9 shows a representative disconnectivity graph showing the predicted free energy landscape for the RNA GG DNMP (for other RNA DNMPs, see Figures S3–S21). The global minimum predicted by DPS for the RNA GG DNMP exhibits a stacked GG state with both residues in anti orientations (Figure 9, red structure). This structure is similar to the most populated clusters observed in the explicit solvent MD simulation results of RNA-IL (38.9%+10.7%=49.6%) with rmsd around 0.34 Å (Figure 9 and Table S7). Furthermore, other minima highlighted in the disconnectivity graph, such as the states colored blue and green with stacked states in anti-syn orientations (Figure 9), have a population of 16% in the MD trajectories (Table S7). Comparison of structures extracted from the DPS calculations and predicted from cluster analyses of explicit solvent MD trajectories for all 16 RNA DNMPs produce strong overlap (Tables S7 and S8). As an example, the majority of observed conformations for RNA AA DNMP extracted from the MD trajectory using RNA-IL (Table S7), such as stacked syn-syn, anti-anti and anti-syn, are also observed in DPS-based cluster analysis (Table S8). Although the DPS calculations were performed using an implicit solvent model, the very fact that most of the low-lying minima are also observed as highly populated clusters in explicit solvent simulations demonstrates the usefulness of both the implicit solvent model and the DPS approach in helping to validate the MD simulations and providing relative free energy values.
Figure 9.

Disconnectivity graph representing the free energy landscape of RNA GG dimer calculated with the RNA-IL force field for selected eight conformations observed in the free energy landscape with the RNA-IL force field. Conformations displayed are color coded to highlight the conformations observed in the free energy landscape and MD trajectories. See Table S8 for details of color-coded conformations.
Conclusion.
Despite the tremendous advances made in RNA force fields31–32, 88–89 there is still a need for significant improvements to bring them up to the accuracies of protein force fields.90 The large number of degrees of freedom of nucleic acids (RNA and DNA) complicates the optimization process for RNA force fields compared to protein force fields. In this contribution, we propose a new way of identifying the stacked and unstacked states in nucleobases by extending the Condon’s stacking definition to a continuous function and introducing “stacking cutoffs” separately for each RNA force field (RNA-IL and ff99OL3) to optimize the agreement between predicted and measured stacking free energies.
Although originating from quantum mechanical interactions, molecular mechanics represents stacking interactions through non-bonded terms such as Lennard–Jones (LJ) and Coulombic interactions. Traditional approaches utilize simple geometric terms to decide if a state is stacked or unstacked (binary). This two-state model, however, is probably not the best way to describe the π-π interactions observed quantum mechanically, which are responsible of stacking. A more direct way to reconcile the quantum mechanical π-π interactions with molecular mechanics is through explicit description of π-orbitals, where overlap of π-rings can better describe stacking in a non-binary form. This, however, will need i) a proper description of π-rings while calculating the overlap volumes, and ii) a physical model to convert the volumes to stacking energies, which we are planning in our future studies.
Even though RNA force fields are revised to improve predictions, overstabilization of stacking interactions and accompanying artifacts are the main focus of this study. Experimental studies measuring free energies of unstacking ↔ stacking for RNA DNMPs can be easily compared to predictions using statistical analysis of population distributions of stacked and unstacked states. The first prerequisite of a statistical-based analysis is having a reliable geometrical definition to discriminate stacked conformers from unstacked. The second essential component is a set of experimental results to compare with the computational predictions. This platform provides a rather fast and convenient framework to evaluate the performance of currently available RNA force fields to correctly represent stacking interactions and delineate a possible roadmap for force field refinements. Despite the uncertainties of experimental studies, such as potential nucleobase aggregation due to usage of DNMPs in high concentration, they are still the best resources to compare with computational predictions.
In this paper we first evaluate the performances of four geometric definitions for the stacking phenomenon using two RNA force fields. We then show that a modified version of Condon’s stacking definition, based on the experimental results, can provide better results to investigate the unstacking ↔ stacking transformation observed in RNA DNMPs. We argue that a stacking cutoff calculated after comparing experimental thermodynamics data to MD simulations, is a more realistic approach than choosing arbitrary geometric cutoffs. We then evaluate the performances of two RNA force fields, RNA-IL and ff99OL3, in reproducing the experimental thermodynamic data, and show that the ff99OL3 and RNA-IL force fields with the Condonmod definition of stacking produce similar results with a marginal better performance of ff99OL3. In the analyses of RNA DNMPs of CC, CU, UC, AG, GA, and GG, almost perfect agreements were observed. Nevertheless, stacking in RNA Pu-Py and Py-Pu DNMPs were under- and over-predicted, respectively. The most dramatic results were observed in predicting the stacking properties of RNA AA and UU DNMPs. While NMR studies reveal that RNA AA DNMPs prefer stacked states, both force fields predict unstacked states as the dominant conformations. Furthermore, while NMR studies produce RNA UU DNMP unstacked populations over 94%, both force fields still over-predict the stacked states. Although recent corrections of RNA force fields have improved the predictions in investigations of more exotic RNA systems, such as single-stranded RNA tetramers and RNA hairpins, the stacking properties of RNA DNMPs present another set of challenges to be overcome by RNA force fields. Additionally, detailed analyses of the sugar pucker show a rather large population of C4′-exo pucker, especially at the 5’-end of RNA DNMPs, which are observed in RNA loops determined by NMR spectroscopy. The ability of an RNA force field to scan a whole range of sugar puckers observed in experiment is an important requirement to reproduce the properties of highly dynamic RNA loop structures.
Cluster analyses further raise concerns about the possible over-representation of syn orientations in RNA DNMPs, especially in the RNA AA DNMP for both force fields, even though experimental results concluded that ΔGsyn→anti= −1.2 kcal/mol for adenosine residues at 35 °C.77, 81 There is mounting evidence for the importance of the syn orientation, especially in the catalytic activity of ribozymes91 and higher order RNA structures,92 where adenosine residues adopt energetically unfavorable syn orientations. Nevertheless, color-coded cluster analyses show that RNA AA exhibits the greatest number of structures in syn orientations, especially when using the ff99OL3 force field, which raises the question of whether the χ torsional parameters should be fine-tuned for adenosine residues.
DPS calculations, which are based on geometry optimization to explore the landscape, were developed to sample rare events, and can overcome kinetic related bottlenecks.93 Local minima and the transition states that connect them are used to construct a kinetic transition network,94 which is visualized using disconnectivity graphs.60–61, 95–96 By applying this method, we obtain a set of local potential and free energy minima for all 16 RNA DNMPs, which can be compared with the conformations sampled in the MD trajectories. The DPS results are subject to the same limitations in terms of the underlying force field, but provide an enhanced sampling framework that should overcome problems with broken ergodicity and simulation time scales in MD. Hence these approaches are complementary and provide a useful crosscheck of the principal conclusions.
In the RNA-IL force field, the α/γ torsional parameters were revised specifically for RNA residues while the ff99OL3 force field uses the α/γ torsional parameters revised specifically for DNA residues.31 Previously, it was shown that the ff99OL3 force field predicted unphysical states while investigating single-stranded RNA tetramers.88 The RNA-IL force field, however, resolved this issue with the revised α/γ torsional parameters, and did not display these unphysical states.31 Nevertheless, the revised α/γ torsional parameters overstabilize some of the RNA DNMPs as described here. In the current RNA force fields, the torsional parameters of α, β, γ, δ, ε, and ζ use single parameter sets for Pu-Pu, Pu-Py, Py-Pu, and Py-Py, where the backbone is described homogeneously. This can be considered normal because RNA structures prefer an A-form orientation. Nevertheless, Pu-Pu, Pu-Py, Py-Pu, and Py-Py DNMPs have different properties, which can exhibit differences including their torsional profiles. As a result, a novel RNA force field, where the force field parameters of each 16 RNA DNMP revised individually can better describe RNA molecules. This was the case when the χ torsional parameters of each RNA mononucleosides were revised individually, where dramatic improvements were observed in predictions.32 Finally, RNA force fields should be benchmarked against not only RNA systems having exclusively Watson-Crick base pairs but also dynamic RNA motifs such as loops and single-strands, which can serve as reliable models to investigate and provide solutions to force field issues. In this regard, we propose the use of Condonmod for investigating stacking in nucleobases, and the thermodynamic data of 16 RNA DNMPs as benchmarks to discover latent problems in RNA force fields. By utilizing a novel way to investigate stacking in RNA molecules as displayed in this contribution, we think that the quality of current RNA force fields can be improved.
Supplementary Material
ACKNOWLEDGMENT
Computations were performed using the High-Performance Computing (HPC) cluster, KoKo, at the Florida Atlantic University. This work was supported by the Florida Atlantic University startup grant (IY) and by the NIH grant R15GM146199 (IY). DJW gratefully acknowledges support from the EPSRC.
Footnotes
Supporting Information. T-shape analyses; details of stacking free energies; distributions of sugar puckers; results of CoSSMos database analyses; conformations observed in MD simulations and DPS calculations; Histogram analyses performed on χ1; representative structures observed in MD; disconnectivity graphs of all the RNA DNMPs; RMSD analyses of MD trajectories with respect to DPS structures; scripts to perform histogram, cluster, and stacking analyses (Brown, Florian, Condon, modified Condon). This information is available free of charge via the Internet at http://pubs.acs.org.
References
- 1.Damase TR; Sukhovershin R; Boada C; Taraballi F; Pettigrew RI; Cooke JP, The Limitless Future of RNA Therapeutics. Front. Bioeng. Biotechnol 2021, 9. [DOI] [PMC free article] [PubMed] [Google Scholar]
- 2.Kim YK, RNA Therapy: Current Status and Future Potential. Chonnam Med. J 2020, 56, 87–93. [DOI] [PMC free article] [PubMed] [Google Scholar]
- 3.Kaczmarek JC; Kowalski PS; Anderson DG, Advances in the Delivery of RNA Therapeutics: From Concept to Clinical Reality. Genome Med. 2017, 9, 60. [DOI] [PMC free article] [PubMed] [Google Scholar]
- 4.Meyer SM; Williams CC; Akahori Y; Tanaka T; Aikawa H; Tong Y; Childs-Disney JL; Disney MD, Small Molecule Recognition of Disease-Relevant RNA Structures. Chem. Soc. Rev 2020, 49, 7167–7199. [DOI] [PMC free article] [PubMed] [Google Scholar]
- 5.Grimme S, Do Special Noncovalent Π–Π Stacking Interactions Really Exist? Angew. Chem. Int. Ed 2008, 47, 3430–3434. [DOI] [PubMed] [Google Scholar]
- 6.Sponer J; Leszczynski J; Hobza P, Nature of Nucleic Acid-Base Stacking: Nonempirical Ab Initio and Empirical Potential Characterization of 10 Stacked Base Dimers. Comparison of Stacked and H-Bonded Base Pairs. J. Phys. Chem 1996, 100, 5590–5596. [Google Scholar]
- 7.Banas P; Hollas D; Zgarbova M; Jurecka P; Orozco M; Cheatham TE; Sponer J; Otyepka M, Performance of Molecular Mechanics Force Fields for RNA Simulations: Stability of UUCG and GNRA Hairpins. J. Chem. Theory Comput 2010, 6, 3836–3849. [DOI] [PMC free article] [PubMed] [Google Scholar]
- 8.Murata K; Sugita Y; Okamoto Y, Free Energy Calculations for DNA Base Stacking by Replica-Exchange Umbrella Sampling. Chem. Phys. Lett 2004, 385, 1–7. [Google Scholar]
- 9.Morgado CA; Jurecka P; Svozil D; Hobza P; Sponer J, Reference Mp2/Cbs and Ccsd(T) Quantum-Chemical Calculations on Stacked Adenine Dimers. Comparison with Dft-D, Mp2.5, Scs(Mi)-Mp2, M06-2x, Cbs(Scs-D) and Force Field Descriptions. PCCP 2010, 12, 3522–34. [DOI] [PubMed] [Google Scholar]
- 10.Evans FE; Lee CH; Sarma RH, 300 Mhz NMR Study on the Effect of Base Stacking on Backbone Conformational Flexibility in Oxy- and Deoxy- Adenyl Dinucleosides. Biochem. Biophys. Res. Commun 1975, 63, 106–14. [DOI] [PubMed] [Google Scholar]
- 11.Lee CH; Ezra FS; Kondo NS; Sarma RH; Danyluk SS, Conformational Properties of Dinucleoside Monophosphates in Solution: Dipurines and Dipyrimidines. Biochemistry 1976, 15, 3627–39. [DOI] [PubMed] [Google Scholar]
- 12.Davis DR, Stabilization of RNA Stacking by Pseudouridine. Nucleic Acids Res. 1995, 23, 5020–6. [DOI] [PMC free article] [PubMed] [Google Scholar]
- 13.Altona C; Van Boom JH; De Jager J; Koeners HJ; Van Binst G, Conformational Analysis of N6-Methyladenylyl-Uridine. Nature 1974, 247, 558–561. [DOI] [PubMed] [Google Scholar]
- 14.Chen J; Kohler B, Base Stacking in Adenosine Dimers Revealed by Femtosecond Transient Absorption Spectroscopy. J. Am. Chem. Soc 2014, 136, 6362–6372. [DOI] [PubMed] [Google Scholar]
- 15.Jean JM; Hall KB, Stacking-Unstacking Dynamics of Oligodeoxynucleotide Trimers. Biochemistry 2004, 43, 10277–84. [DOI] [PubMed] [Google Scholar]
- 16.Miyahara T; Nakatsuji H, Indicator of the Stacking Interaction in the DNA Double-Helical Structure: Chirasac Study. J. Phys. Chem. A 2015, 119, 8269–8278. [DOI] [PubMed] [Google Scholar]
- 17.Ballin JD; Bharill S; Fialcowitz-White EJ; Gryczynski I; Gryczynski Z; Wilson GM, Site-Specific Variations in RNA Folding Thermodynamics Visualized by 2-Aminopurine Fluorescence. Biochemistry 2007, 46, 13948–13960. [DOI] [PMC free article] [PubMed] [Google Scholar]
- 18.Sarkar K; Meister K; Sethi A; Gruebele M, Fast Folding of an RNA Tetraloop on a Rugged Energy Landscape Detected by a Stacking-Sensitive Probe. Biophys. J 2009, 97, 1418–1427. [DOI] [PMC free article] [PubMed] [Google Scholar]
- 19.Ezra FS; Lee C-H; Kondo NS; Danyluk SS; Sarma RH, Conformational Properties of Purine-Pyrimidine and Pyrimidine-Purine Dinucleoside Monophosphates. Biochemistry 1977, 16, 1977–1987. [DOI] [PubMed] [Google Scholar]
- 20.Frechet D; Ehrlich R; Remy P; Gabarroarpa J, Thermal Perturbation Differential Spectra of Ribonucleic-Acids .2. Nearest Neighbor Interactions. Nucleic Acids Res. 1979, 7, 1981–2001. [DOI] [PMC free article] [PubMed] [Google Scholar]
- 21.Tsuboi M; Takahashi S; Kyogoku Y; Hayatsu H; Ukita T; Kainosho M, Phosphorus-Proton Spin-Spin Coupling and Conformation of a Dinucleoside Phosphate. Science 1969, 166, 1504–5. [DOI] [PubMed] [Google Scholar]
- 22.Hayatshahi HS; Henriksen NM; Cheatham TE, Consensus Conformations of Dinucleoside Monophosphates Described with Well-Converged Molecular Dynamics Simulations. J. Chem. Theory Comput 2018, 14, 1456–1470. [DOI] [PubMed] [Google Scholar]
- 23.Brown RF; Andrews CT; Elcock AH, Stacking Free Energies of All DNA and RNA Nucleoside Pairs and Dinucleoside-Monophosphates Computed Using Recently Revised Amber Parameters and Compared with Experiment. J. Chem. Theory Comput 2015, 11, 2315–2328. [DOI] [PMC free article] [PubMed] [Google Scholar]
- 24.Jafilan S; Klein L; Hyun C; Florián J, Intramolecular Base Stacking of Dinucleoside Monophosphate Anions in Aqueous Solution. J. Phys. Chem. B 2012, 116, 3613–3618. [DOI] [PMC free article] [PubMed] [Google Scholar]
- 25.Gabb HA; Sanghani SR; Robert CH; Prévost C, Finding and Visualizing Nucleic Acid Base Stacking. J. Mol. Graphics 1996, 14, 6–11, 23-4. [DOI] [PubMed] [Google Scholar]
- 26.Norberg J; Nilsson L, Stacking Free Energy Profiles for All 16 Natural Ribodinucleoside Monophosphates in Aqueous Solution. J. Am. Chem. Soc 1995, 117, 10832–10840. [Google Scholar]
- 27.Norberg J; Nilsson L, Potential of Mean Force Calculations of the Stacking-Unstacking Process in Single-Stranded Deoxyribodinucleoside Monophosphates. Biophys. J 1995, 69, 2277–2285. [DOI] [PMC free article] [PubMed] [Google Scholar]
- 28.Vokacova Z; Budesinsky M; Rosenberg I; Schneider B; Sponer J; Sychrovsky V, Structure and Dynamics of the Apa, Apc, Cpa, and Cpc RNA Dinucleoside Monophosphates Resolved with NMR Scalar Spin-Spin Couplings. J. Phys. Chem. B 2009, 113, 1182–1191. [DOI] [PubMed] [Google Scholar]
- 29.Condon DE; Kennedy SD; Mort BC; Kierzek R; Yildirim I; Turner DH, Stacking in RNA: NMR of Four Tetramers Benchmark Molecular Dynamics. J. Chem. Theory Comput 2015, 11, 2729–2742. [DOI] [PMC free article] [PubMed] [Google Scholar]
- 30.Zgarbova M; Otyepka M; Sponer J; Mladek A; Banas P; Cheatham TE; Jurecka P, Refinement of the Cornell Et Al. Nucleic Acids Force Field Based on Reference Quantum Chemical Calculations of Glycosidic Torsion Profiles. J. Chem. Theory Comput 2011, 7, 2886–2902. [DOI] [PMC free article] [PubMed] [Google Scholar]
- 31.Wales DJ; Yildirim I, Improving Computational Predictions of Single-Stranded RNA Tetramers with Revised A/Γ Torsional Parameters for the Amber Force Field. J. Phys. Chem. B 2017, 727, 2989–2999. [DOI] [PubMed] [Google Scholar]
- 32.Yildirim I; Stern HA; Kennedy SD; Tubbs JD; Turner DH, Reparameterization of RNA X Torsion Parameters for the Amber Force Field and Comparison to NMR Spectra for Cytidine and Uridine. J. Chem. Theory Comput 2010, 6, 1520–1531. [DOI] [PMC free article] [PubMed] [Google Scholar]
- 33.Cornell WD; Cieplak P; Bayly CI; Gould IR; Merz KM; Ferguson DM; Spellmeyer DC; Fox T; Caldwell JW; Kollman PA, A Second Generation Force Field for the Simulation of Proteins, Nucleic Acids, and Organic Molecules. J. Am. Chem. Soc 1995, 117, 5179–5197. [Google Scholar]
- 34.Maier JA; Martinez C; Kasavajhala K; Wickstrom L; Hauser KE; Simmerling C, Ff14sb: Improving the Accuracy of Protein Side Chain and Backbone Parameters from Ff99sb. J. Chem. Theory Comput 2015, 11, 3696–3713. [DOI] [PMC free article] [PubMed] [Google Scholar]
- 35.Turner DH, Conformational Changes. In Nucleic Acids: Structures, Properties, and Functions, Bloomfield VA; Crothers DM; Tinoco I Jr., Eds. University Science Books: Sausalito, California, 2000; pp 259–334. [Google Scholar]
- 36.Sinnokrot MO; Valeev EF; Sherrill CD, Estimates of the Ab Initio Limit for Π–Π Interactions: The Benzene Dimer. J. Am. Chem. Soc 2002, 124, 10887–10893. [DOI] [PubMed] [Google Scholar]
- 37.Sinnokrot MO; Sherrill CD, High-Accuracy Quantum Mechanical Studies of Π–Π Interactions in Benzene Dimers. J. Phys. Chem. A 2006, 110, 10656–10668. [DOI] [PubMed] [Google Scholar]
- 38.Rogers DM; Hirst JD; Lee EPF; Wright TG, Ab Initio Study of the Toluene Dimer. Chem. Phys. Lett 2006, 427, 410–413. [Google Scholar]
- 39.Case DA; Betz RM; Cerutti DS; Cheatham TE; Darden TA; Duke RE; Giese TJ; Gohlke H; Goetz AW; Homeyer N, et al. Amber 16, University of California: San Francisco, CA, 2016. [Google Scholar]
- 40.Wang JM; Cieplak P; Kollman PA, How Well Does a Restrained Electrostatic Potential (Resp) Model Perform in Calculating Conformational Energies of Organic and Biological Molecules?. J. Comput. Chem 2000, 21, 1049–1074. [Google Scholar]
- 41.Perez A; Marchan I; Svozil D; Sponer J; Cheatham TE; Laughton CA; Orozco M, Refinement of the Amber Force Field for Nucleic Acids: Improving the Description of Alpha/Gamma Conformers. Biophys. J 2007, 92, 3817–3829. [DOI] [PMC free article] [PubMed] [Google Scholar]
- 42.Joung IS; Cheatham TE, Determination of Alkali and Halide Monovalent Ion Parameters for Use in Explicitly Solvated Biomolecular Simulations. J. Phys. Chem. B 2008, 772, 9020–9041. [DOI] [PMC free article] [PubMed] [Google Scholar]
- 43.Jorgensen WL; Chandrasekhar J; Madura JD; Impey RW; Klein ML, Comparison of Simple Potential Functions for Simulating Liquid Water. J. Chem. Phys 1983, 79, 926–935. [Google Scholar]
- 44.Yildirim I; Park H; Disney MD; Schatz GC, A Dynamic Structural Model of Expanded RNA CAG Repeats: A Refined X-Ray Structure and Computational Investigations Using Molecular Dynamics and Umbrella Sampling Simulations. J. Am. Chem. Soc 2013,135, 3528–3538. [DOI] [PMC free article] [PubMed] [Google Scholar]
- 45.Ryckaert JP; Ciccotti G; Berendsen HJC, Numerical-Integration of Cartesian Equations of Motion of a System with Constraints: Molecular-Dynamics of N-Alkanes. J. Comput. Phys 1977, 23, 327–341. [Google Scholar]
- 46.Essmann U; Perera L; Berkowitz ML; Darden T; Lee H; Pedersen LG, A Smooth Particle Mesh Ewald Method. J. Chem. Phys 1995,103, 8577–8593. [Google Scholar]
- 47.Uberuaga BP; Anghel M; Voter AF, Synchronization of Trajectories in Canonical Molecular-Dynamics Simulations: Observation, Explanation, and Exploitation. J. Chem. Phys 2004, 120, 6363–74. [DOI] [PubMed] [Google Scholar]
- 48.Sindhikara DJ; Kim S; Voter AF; Roitberg AE, Bad Seeds Sprout Perilous Dynamics: Stochastic Thermostat Induced Trajectory Synchronization in Biomolecules. J. Chem. Theory Comput 2009, 5, 1624–1631. [DOI] [PubMed] [Google Scholar]
- 49.Wales DJ, Discrete Path Sampling. Mol. Phys 2002,100, 3285–3305. [Google Scholar]
- 50.Wales DJ, Energy Landscapes. Cambridge University Press, UK: 2003. [Google Scholar]
- 51.Wales DJ, Exploring Energy Landscapes. Annu. Rev. Phys. Chem 2018, 69, 401–425. [DOI] [PubMed] [Google Scholar]
- 52.Joseph JA; Roder K; Chakraborty D; Mantell RG; Wales DJ, Exploring Biomolecular Energy Landscapes. Chem. Commun 2017, 53, 6974–6988. [DOI] [PubMed] [Google Scholar]
- 53.Roder K; Joseph JA; Husic BE; Wales DJ, Energy Landscapes for Proteins: From Single Funnels to Multifunctional Systems. Adv. Theory Simul 2019,2, 1800175. [Google Scholar]
- 54.Wales DJ; Disney MD; Yildirim I, Computational Investigation of RNA a-Bulges Related to the Microtubule-Associated Protein Tau Causing Frontotemporal Dementia and Parkinsonism. J. Phys. Chem. B 2019,123, 57–65. [DOI] [PMC free article] [PubMed] [Google Scholar]
- 55.Chen JL; VanEtten DM; Fountain MA; Yildirim I; Disney MD, Structure and Dynamics of RNA Repeat Expansions That Cause Huntington’s Disease and Myotonic Dystrophy Type 1. Biochemistry 2017, 56, 3463–3474. [DOI] [PMC free article] [PubMed] [Google Scholar]
- 56.Yildirim T; Chakraborty D; Disney MD; Wales DJ; Schatz GC, Computational Investigation of RNA CUG Repeats Responsible for Myotonic Dystrophy 1. J. Chem. Theory Comput 2015,11, 4943–4958. [DOI] [PMC free article] [PubMed] [Google Scholar]
- 57.Liu DC; Nocedal J, On the Limited Memory Bfgs Method for Large-Scale Optimization. Math. Program 1989, 45, 503–528. [Google Scholar]
- 58.Strodel B; Whittleston CS; Wales DJ, Thermodynamics and Kinetics of Aggregation for the Gnnqqny Peptide. J. Am. Chem. Soc 2007,129, 16005–16014. [DOI] [PubMed] [Google Scholar]
- 59.Wales DJ, The Energy Landscape as a Unifying Theme in Molecular Science. Philos. Trans. Royal Soc. A 2004, 363, 357–377. [DOI] [PubMed] [Google Scholar]
- 60.Becker OM; Karplus M, The Topology of Multidimensional Potential Energy Surfaces: Theory and Application to Peptide Structure and Kinetics. J. Chem. Phys 1997,106, 1495–1517. [Google Scholar]
- 61.Wales DJ; Miller MA; Walsh TR, Archetypal Energy Landscapes. Nature 1998, 394, 758–760. [Google Scholar]
- 62.Strodel B; Wales DJ, Free Energy Surfaces from an Extended Harmonic Superposition Approach and Kinetics for Alanine Dipeptide. Chem. Phys. Lett 2008, 466, 105–115. [Google Scholar]
- 63.Wales DJ, Coexistence in Small Inert Gas Clusters. Mol. Phys 1993, 75, 151–171. [Google Scholar]
- 64.Lu XJ; Olson WK, 3dna: A Versatile, Integrated Software System for the Analysis, Rebuilding and Visualization of Three-Dimensional Nucleic-Acid Structures. Nat. Protoc 2008, 3, 1213–1227. [DOI] [PMC free article] [PubMed] [Google Scholar]
- 65.Kabeláč M; Hobza P, At Nonzero Temperatures, Stacked Structures of Methylated Nucleic Acid Base Pairs and Microhydrated Nonmethylated Nucleic Acid Base Pairs Are Favored over Planar Hydrogen-Bonded Structures: A Molecular Dynamics Simulations Study. Chem. Eur. J 2001, 7, 2067–2074. [DOI] [PubMed] [Google Scholar]
- 66.Sinnokrot MO; Sherrill CD, Substituent Effects in Π–Π Interactions: Sandwich and T-Shaped Configurations. J. Am. Chem. Soc 2004,126, 7690–7697. [DOI] [PubMed] [Google Scholar]
- 67.Dinadayalane TC; Leszczynski J, Geometries and Stabilities of Various Configurations of Benzene Dimer: Details of Novel V-Shaped Structure Revealed. Struct. Chem 2009, 20, 11–20. [Google Scholar]
- 68.Simpkins H; Richards EG, Spectrophotometric Titration Studies on Poly (Uridylic Acid). Biopolymers 1967, 5, 551–560. [Google Scholar]
- 69.Dhingra MM; Sarma RH, Why Do Nucleic Acids Have 3’5’ Phosphodiester Bonds? Nature 1978, 272, 798–801. [DOI] [PubMed] [Google Scholar]
- 70.Warshaw MM; Tinoco I Jr., Optical Properties of Sixteen Dinucleoside Phosphates. J. Mol. Biol 1966, 20, 29–38. [DOI] [PubMed] [Google Scholar]
- 71.Altona C; Sundaralingam M, Conformational Analysis of the Sugar Ring in Nucleosides and Nucleotides. A New Description Using the Concept of Pseudorotation. J. Am. Chem. Soc 1972, 94, 8205–8212. [DOI] [PubMed] [Google Scholar]
- 72.Steffen FD; Khier M; Kowerko D; Cunha RA; Bömer R; Sigel RKO, Metal Ions and Sugar Puckering Balance Single-Molecule Kinetic Heterogeneity in RNA and DNA Tertiary Contacts. Nat. Commun 2020, 11, 104. [DOI] [PMC free article] [PubMed] [Google Scholar]
- 73.Vanegas PL; Hudson GA; Davis AR; Kelly SC; Kirkpatrick CC; Znosko BM, RNA Cossmos: Characterization of Secondary Structure Motifs-a Searchable Database of Secondary Structure Motifs in RNA Three-Dimensional Structures. Nucleic Acids Res 2012, 40, D439–D444. [DOI] [PMC free article] [PubMed] [Google Scholar]
- 74.Banyay M; Gräslund A, Structural Effects of Cytosine Methylation on DNA Sugar Pucker Studied by Ftir. J. Mol. Biol 2002, 324, 667–676. [DOI] [PubMed] [Google Scholar]
- 75.Abou Assi H; Rangadurai AK; Shi H; Liu B; Clay MC; Erharter K; Kreutz C; Holley CL; Al-Hashimi HM, 2’-O-Methylation Can Increase the Abundance and Lifetime of Alternative RNA Conformational States. Nucleic Acids Res 2020, 48, 12365–12379. [DOI] [PMC free article] [PubMed] [Google Scholar]
- 76.Pinamonti G; Zhao J; Condon DE; Paul F; Noè F; Turner DH; Bussi G, Predicting the Kinetics of RNA Oligonucleotides Using Markov State Models. J. Chem. Theory Comput 2017, 13, 926–934. [DOI] [PMC free article] [PubMed] [Google Scholar]
- 77.Sokoloski JE; Godfrey SA; Dombrowski SE; Bevilacqua PC, Prevalence of Syn Nucleobases in the Active Sites of Functional RNAs. RNA 2011, 17, 1775–87. [DOI] [PMC free article] [PubMed] [Google Scholar]
- 78.Sychrovsky V; Foldynova-Trantirkova S; Spackova N; Robeyns K; Van Meervelt L; Blankenfeldt W; Vokacova Z; Sponer J; Trantirek L, Revisiting the Planarity of Nucleic Acid Bases: Pyramidilization at Glycosidic Nitrogen in Purine Bases Is Modulated by Orientation of Glycosidic Torsion. Nucleic Acids Res 2009, 37, 7321–31. [DOI] [PMC free article] [PubMed] [Google Scholar]
- 79.Šponer J; Banáš P; Jurečka P; Zgarbová M; Kührová P; Havrila M; Krepl M; Stadlbauer P; Otyepka M, Molecular Dynamics Simulations of Nucleic Acids. From Tetranucleotides to the Ribosome. J. Phys. Chem. Lett 2014, 5, 1771–1782. [DOI] [PubMed] [Google Scholar]
- 80.Sychrovsky V; Vokacova Z; Sponer J; Spackova N; Schneider B, Calculation of Structural Behavior of Indirect NMR Spin-Spin Couplings in the Backbone of Nucleic Acids. J. Phys. Chem. B 2006, 110, 22894–22902. [DOI] [PubMed] [Google Scholar]
- 81.Hemmes PR; Oppenheimer L; Jordan F, Ultrasonic Relaxation Evaluation of the Thermodynamics of Syn-Anti Glycosidic Isomerization in Adenosine. J. Am. Chem. Soc 1974, 96, 6023–6026. [DOI] [PubMed] [Google Scholar]
- 82.Dudycz L; Stolarski R; Pless R; Shugar D, A 1h NMR Study of the Syn-Anti Dynamic Equilibrium in Adenine Nucleosides and Nucleotides with the Aid of Some Synthetic Model Analogues with Fixed Conformations. Z. Naturforsch., C: Biosci 1979, 34c, 359–73. [DOI] [PubMed] [Google Scholar]
- 83.Dewey TG; Turner DH, Laser Temperature-Jump Study of Stacking in Adenylic Acid Polymers. Biochemistry 1979, 18, 5757–5762. [DOI] [PubMed] [Google Scholar]
- 84.Remington JM; McCullagh M; Kohler B, Molecular Dynamics Simulations of 2-Aminopurine-Labeled Dinucleoside Monophosphates Reveal Multiscale Stacking Kinetics. J. Phys. Chem. B 2019, 123, 2291–2304. [DOI] [PubMed] [Google Scholar]
- 85.Jones AC; Neely RK, 2-Aminopurine as a Fluorescent Probe of DNA Conformation and the DNA-Enzyme Interface. Q. Rev. Biophys 2015, 48, 244–79. [DOI] [PubMed] [Google Scholar]
- 86.Zhao L; Xia T, Direct Revelation of Multiple Conformations in RNA by Femtosecond Dynamics. J. Am. Chem. Soc 2007, 129, 4118–4119. [DOI] [PubMed] [Google Scholar]
- 87.Murrell JN; Laidler KJ, Symmetries of Activated Complexes. Trans. Faraday Soc 1968, 64, 371–&. [Google Scholar]
- 88.Aytenfisu AH; Spasic A; Grossfield A; Stern HA; Mathews DH, Revised RNA Dihedral Parameters for the Amber Force Field Improve RNA Molecular Dynamics. J. Chem. Theory Comput 2017, 13, 900–915. [DOI] [PMC free article] [PubMed] [Google Scholar]
- 89.Tan D; Piana S; Dirks RM; Shaw DE, RNA Force Field with Accuracy Comparable to State-of-the-Art Protein Force Fields. Proc. Natl. Acad. Sci. U. S. A 2018, 115, E1346–E1355. [DOI] [PMC free article] [PubMed] [Google Scholar]
- 90.Lindorff-Larsen K; Piana S; Dror RO; Shaw DE, How Fast-Folding Proteins Fold. Science 2011, 334, 517–520. [DOI] [PubMed] [Google Scholar]
- 91.Messina KJ; Kierzek R; Tracey MA; Bevilacqua PC, Small Molecule Rescue and Glycosidic Conformational Analysis of the Twister Ribozyme. Biochemistry 2019, 58, 4857–4868. [DOI] [PMC free article] [PubMed] [Google Scholar]
- 92.Li S; Su Z; Lehmann J; Stamatopoulou V; Giarimoglou N; Henderson FE; Fan L; Pintilie GD; Zhang K; Chen M, et al. , Structural Basis of Amino Acid Surveillance by Higher-Order Tma-Mma Interactions. Nat. Struct. Mol. Biol 2019, 26, 1094–1105. [DOI] [PMC free article] [PubMed] [Google Scholar]
- 93.Wales DJ, Some Further Applications of Discrete Path Sampling to Cluster Isomerization. Mol. Phys 2004, 102, 891–908. [Google Scholar]
- 94.Wales DJ; Bogdan TV, Potential Energy and Free Energy Landscapes. J. Phys. Chem. B 2006, 110, 20765–20776. [DOI] [PubMed] [Google Scholar]
- 95.Krivov SV; Karplus M, Free Energy Disconnectivity Graphs: Application to Peptide Models. J. Chem. Phys 2002, 117, 10894–10903. [Google Scholar]
- 96.Evans DA; Wales DJ, Free Energy Landscapes of Model Peptides and Proteins. J. Chem. Phys 2003, 118, 3891–3897. [Google Scholar]
Associated Data
This section collects any data citations, data availability statements, or supplementary materials included in this article.