

Abstract
As state-funded prekindergarten programs expand, it is critical to investigate their short- and long-term effects. This paper presents the results through 6th grade of a longitudinal randomized control study of the effects of a scaled-up, state-supported pre-k program. The analytic sample includes 2990 children from low-income families who applied to oversubscribed pre-k program sites across the state and were randomly assigned to offers of admission or a wait list control. Data through 6th grade from state education records showed that the children randomly assigned to attend pre-k had lower state achievement test scores in third through 6th grades than control children, with the strongest negative effects in 6th grade. A negative effect was also found for disciplinary infractions, attendance, and receipt of special education services, with null effects on retention. The implications of these findings for pre-k policies and practices are discussed.
Keywords: public pre-k, randomized control trial, longitudinal, early childhood education, achievement, policy
Prior to 1980, only two states funded pre-k programs; currently 43 states fund such programs. There has been a corresponding increase in the enrollment of 4-year-old children with about 1.5 million currently enrolled in state-funded pre-k programs—nearly one-third of all 4-year-old children in the U.S. (Friedman-Krauss et al., 2018) and a larger enrollment than the federal Head Start program (Administration for Children and Families, 2019). The objectives of the advocacy groups and state legislatures promoting this expansion vary, but one common theme is enhancing the school readiness of children prior to kindergarten entry, especially children from economically disadvantaged families. Alongside that short-term goal, however, is an expectation that pre-k will have longer-term effects on academic and behavioral outcomes and help close the achievement gap (Phillips et al., 2017).
The expectations for long-term pre-k effects are largely based on the results of the now classic early longitudinal studies – the Perry Preschool and Abecedarian demonstration projects (Bailey et al., 2017). Both projects not only showed positive effects on later academic performance but, after high school, on such life outcomes as employment and income, further education, criminal behavior, and health. However, these were small demonstration projects that involved intensive programs for highly disadvantaged African American children in contexts that provided few intellectually stimulating alternatives. Whether similar results can be produced by less intensive scaled-up contemporary statewide programs for more diverse populations is a critical question for both policy and practice.
Unfortunately, questions about both short-term and, especially, long-term state pre-k effects are difficult to address in a methodologically rigorous way. A randomized study akin to those used in the Perry Preschool and Abecedarian projects would require assembling a sample of pre-k eligible children prior to the beginning of the pre-k school year whose parents consented to having them randomly assigned to attend or not attend the state program. Few parents can be expected to allow the equivalent of a coin flip to make such an important decision for their child. Absent random assignment, the inherent parental discretion involved in choosing between options creates considerable potential for selection bias in any comparison of outcomes for state pre-k vs. any or all of the available alternatives. Similar concerns apply to evaluations of other publicly funded pre-k programs such as place-based locally funded programs (e.g., Tulsa and Boston) and the federally funded Head Start program.
One credible approach to evaluating the immediate effects of state pre-k programs under these circumstances is the age-cutoff regression-discontinuity (RD) design developed by Gormley and colleagues in their study of the Tulsa pre-k program (Gormley et al., 2005). This design capitalizes on a strict age cutoff for pre-k eligibility and compares age-adjusted outcomes at the beginning of kindergarten for children who attended pre-k the prior year with those for younger children just beginning the pre-k program and thus had no pre-k exposure that prior year. These evaluations have focused on early literacy, language, and math and, almost without exception, have found positive effects at kindergarten entry (e.g., Pion & Lipsey, in press; Hustedt et.al. 2021; Montrosse-Moorhead et al., 2019; Wong et al., 2008). A limitation of this design is that it cannot be used for longer term follow-up—by the end of kindergarten both the treatment and control groups have experienced pre-k.
Because of the practical difficulties of implementing random assignment, studies of the sustained effects of state pre-k past the beginning of kindergarten almost universally use nonrandomized designs. One approach to avoiding selection bias associated with parental decisions about attending pre-k has been to use aggregate data that includes all the children in different cohorts whether they attended state pre-k or not. Longer-term outcomes are then compared for cohorts that vary in their exposure to state pre-k. For example, Ladd, Muschkin, and Dodge (2014) examined 3rd grade test scores as a function of differences across counties in the onset and magnitude of state financial investments in the North Carolina pre-k program. They found positive effects in reading and math with especially large estimates if the aggregate effects were assumed to come entirely from the children in each county who actually attended pre-k. Similarly, other studies (e.g., Bartik & Hershbein, 2018; Cascio & Schanzenbach, 2013; Rosinsky, 2014) have analyzed 4th grade NAEP test scores in relation to variation in pre-k enrollment across time and, in some instances, across states. The results of these studies have been mixed and generally show sensitivity to differences in the statistical models used.
Attributing such aggregate effects to the influence of pre-k, however, assumes that the aggregate units most successful in increasing exposure to pre-k were not also more likely to implement or experience any other developments that affected educational performance co-occurring with the pre-k expansion or in any year between then and the time at which the longer-term outcomes were measured. This assumption that pre-k variation is independent of other educational influences is difficult to confirm and not entirely plausible in the context of interconnected educational innovations and policy.
The most common approach to investigating longer-term effects of locally funded and statewide pre-k programs is a post hoc comparison of later outcomes for children who did vs. did not attend the pre-k program years earlier (e.g., Hill et al., 2015; Preskitt et al., 2020). These studies generally attempt to address the inherent potential for selection bias by matching the children in each group on a set of variables available at the time of outcome measurement. A recent example is an investigation of the long-term effects of Georgia’s universal pre-k program (Early et al., 2019). Using demographic data from the state database, kindergarten eligibility for free or reduced-price lunch, and kindergarten school attended, Early et al. created propensity score matches for pre-k attenders and non-attenders. The results showed positive pre-k effects on 3rd grade reading and math scores for children from low-income families, but negative effects for pre-k participants from higher income families. Notably, however, no pretest measures taken before the beginning of the pre-k year for early reading and math skills or for family circumstances that might influence pre-k enrollment were available to ensure initial equivalence between those groups. Indeed, the authors caution that variables such as these might have accounted for the differences found. The child and family characteristics associated with enrollment in pre-k generally favor enrollees (Ansari & Crosnoe, 2015; Coley et al., 2016) in ways that undermine the validity of such post hoc comparisons.
Despite the challenges that have motivated the large body of nonrandomized studies of the longer-term effects of state and locally funded pre-k, there are circumstances amenable to randomized designs. For example, when a sizeable number of pre-k sites receive more applicants than they have capacity to serve, some applicants must of necessity be turned away. Randomization provides an equitable and transparent way to allocate the available seats at the respective sites. One of the two studies of state or locally funded pre-k that has randomized in such a situation capitalized on the lottery procedure used to select applicants for popular pre-k program sites in Boston (Weiland et al., 2020). This naturally occurring lottery allowed Weiland and colleagues to compare children randomly selected to attend their first choice program with a control group not selected for that first choice. This contrast was diminished, however, by the ultimate attendance of 72% of the control group in another Boston pre-k program, 24% in a center-based preschool other than a Boston pre-k, and only about 3% who did not attend any preschool. The direct intent-to-treat comparison between the overall treatment and control groups found no differences on 3rd grade English language arts and math tests nor on retention in grade and special education placements through 3rd grade. An instrumental variable analysis that compared children attending any Boston pre-k program with those attending other preschools or none similarly found no difference on any of these outcomes. It is notable, however, that the effect estimates for the 3rd grade math scores and kindergarten special education placements were negative, though short of statistical significance.
While a state pre-k program is the focus of this paper, a large body of research has focused on the Head Start program. However, there is only one randomized study of longer-term Head Start effects (Puma et al., 2012), one that also randomized applicants to oversubscribed programs. Head Start children had larger gains than controls on literacy and language measures (but not math) prior to kindergarten entry, but these effects disappeared by the end of kindergarten. Focusing on earlier Head Start programs, Deming (2009) conducted a study comparing siblings within the same family born between 1976 and 1986 who did or did not attend Head Start, and found long-term positive Head Start effects on adult outcomes even though test score differences faded. In a similar analysis, Pages et al. (2020) found that using the Deming sample but extending the measurement period decreased the adult effects, and data for children attending more recent Head Start programs showed mostly negative effects. Siblings who attended Head Start were less likely to be employed or enrolled in school compared to their siblings who mostly received home care. These later Head Start programs occurred within the same time window as the implementation of the Tennessee Voluntary Pre-K (TN-VPK) program that is the topic of the current paper.
This paper reports results from a randomized longitudinal study of TN-VPK that began with the 2009 and 2010 pre-k cohorts. As in the Head Start Impact Study, the Tennessee research team implemented randomization at oversubscribed program sites and followed the resulting sample afterwards to investigate how well the pre-k effects were sustained. The results through 6th grade are reported here and those for earlier periods are summarized.
TN-VPK and Effects through Third Grade
While state pre-k programs vary, the Tennessee program is relatively typical. Pilot programs began in 1996 with full statewide implementation in 2005. TN-VPK is organized and overseen by the state department of education and serves more than 18,000 4-year-old children from low-income families statewide with local program sites in all but a few of the school districts in the state. The state requires a minimum instructional time of 5.5 hours per day, five days a week during the school year, classes of no more than 20 students staffed by a state-licensed teacher endorsed for early childhood education and paid at public school teacher rates, an educational assistant in each room, and a curriculum selected from a state-approved list (Tennessee Department of Education, 2019).
When the TN-VPK program began, it met 9 of the 10 standards advocated until recently revised by the National Institute of Early Education Research (NIEER: Barnett et al., 2009). The current study began with the 2009 and 2010 pre-k cohorts. In 2015 (Farran & Lipsey) we reported a separate related study of a representative sample of TN-VPK programs in the state that found that quality as measured by the Early Childhood Environment Rating Scale (Harms & Clifford, 1980) matched or exceeded that reported in evaluations of other state pre-k programs. More recently, Pion & Lipsey (in press) used a regression-discontinuity design with that statewide sample to investigate end-of-pre-k effects on a battery of commonly used cognitive measures. The TN-VPK results compared favorably with those found in similar designs for more than a dozen other statewide pre-k programs.
The findings of the TN-VPK study through 3rd grade were described in prior research reports (Lipsey et al., 2013a and 2013b) and a published summary article (Lipsey et al., 2018). The design involves over-subscribed program sites across Tennessee in which applicants were randomized to offers of admission or waitlist status (N = 2,990 children; referred to as the RCT analytic sample). In addition, parental consent was obtained for 1,076 children to allow the research team to collect additional data from the children and their teachers at the beginning and end of the pre-k year and annually through 3rd grade (referred to as the intensive substudy (ISS) sample). We attempted to obtain parental consent for all children in the RCT full sample, but different procedures for obtaining consent were used with the two cohorts of students due to logistical reasons. For the 2009 cohort, the Tennessee Department of Education officials interpreted the confidentiality requirement for FRPL eligible children in a way that only allowed parents to be contacted via a mailing sent from their central office. Almost all parents who responded consented, but many did not respond (consent rate of 24.4%). For the 2010 cohort, arrangements were negotiated to allow parents to be approached about consent as part of the VPK application paperwork, and a member of the research team was available to respond to questions (consent rate of 67.8%). Again, most of the remainder did not respond and very few actively declined to consent. The interaction between cohort and condition was included in the ISS analyses, and the interaction was not ever significant. The ISS sample also showed strong baseline equivalence on achievement pre-tests and a wide range of family characteristics. A battery of Woodcock-Johnson achievement outcome measures showed significant positive immediate effects of TN-VPK at the end of pre-k. Those effects were especially pronounced for children who entered pre-k with lower baseline scores on the achievement measures and those for whom English was not their native language.
By the end of kindergarten, most of the effects on achievement were no longer statistically significant and, in later years, nearly all had turned at least slightly negative, although generally short of statistical significance (Lipsey et al., 2018). By the end of 3rd grade, state achievement test scores for the RCT analytic sample echoed the achievement results from the ISS subsample with TN-VPK participants scoring lower than nonparticipants, significantly so in math and science. No effects were found on either attendance or grade retention rates through 3rd grade. However, children who attended TN-VPK had marginally significant higher rates of school rule violations and a significantly greater proportion of TN-VPK participants had special education placements (Lipsey et al., 2018). There were no significant effects on the quality of the schools the students subsequently attended or their exposure to higher quality teachers in those schools (Pearman et al., 2020). However, positive TN-VPK effects were found on the 3rd grade state achievement tests for the small proportion (12%) of children who attended higher quality schools and were exposed to higher quality teachers.
TN-VPK Effects through Sixth Grade
The current paper reports the next phase of this study, which extended the investigation of longer-term TN-VPK effects through 6th grade. Several issues were of interest for this follow-up period. Paramount was the question of whether the negative effects found on the 3rd grade state achievement tests diminished or continued in the later grades. Similar questions apply to the further development of the null or negative findings on later attendance, retention, disciplinary infractions, and special education placements.
Method
RCT Sample
This study involves 79 over-subscribed TN-VPK program sites with two cohorts of pre-k applicants randomized to offers of admission or a waitlist, one cohort entering pre-k in 2009– 10, the other in 2010–11. This resulted in randomization of 111 site-level applicant lists (R-Lists). To be included in the RCT analytic sample, students had to: (1) be eligible for free or reduced price lunch, (2) be four years old by September 30 of their pre-k year, (3) be applicants to an oversubscribed TN-VPK program site that successfully randomized admission decisions, (4) not have applied for out-of-classroom special education services prior to pre-k enrollment, and (5) have a record in the state education database for at least one year of attendance in a Tennessee public school between pre-k and 3rd grade. Of the students who met criteria 1 through 4, there were 141 students who did not have subsequent state data in any year from kindergarten through 3rd grade (criterion 5). Omitting those students left a total of 2,990 eligible children in the sample used for analysis. Criterion 5 kept the RCT analytic sample the same as in previous reports; extending that criterion to include students with data from fourth through 6th grade would have added only one student to the sample.
We report all results using two definitions of treatment and control conditions: intent-to-treat (ITT) and treatment-on-treated (TOT). ITT differentiates students according to whether they were randomly assigned to receive offers of admission. TOT differentiates students according to whether they actually attended TN-VPK or not. Figure 1 provides a visual representation of the ITT and TOT conditions and the number of children in each. The children enrolled in TN-VPK attended an average of 143.8 days (SD = 31.6) during the school year. All participants were treated ethically, and the Vanderbilt University Institutional Review Board (IRB #090666, “Evaluating the Effectiveness of Tennessee Voluntary Pre-K Program”) approved this study.
Figure 1.
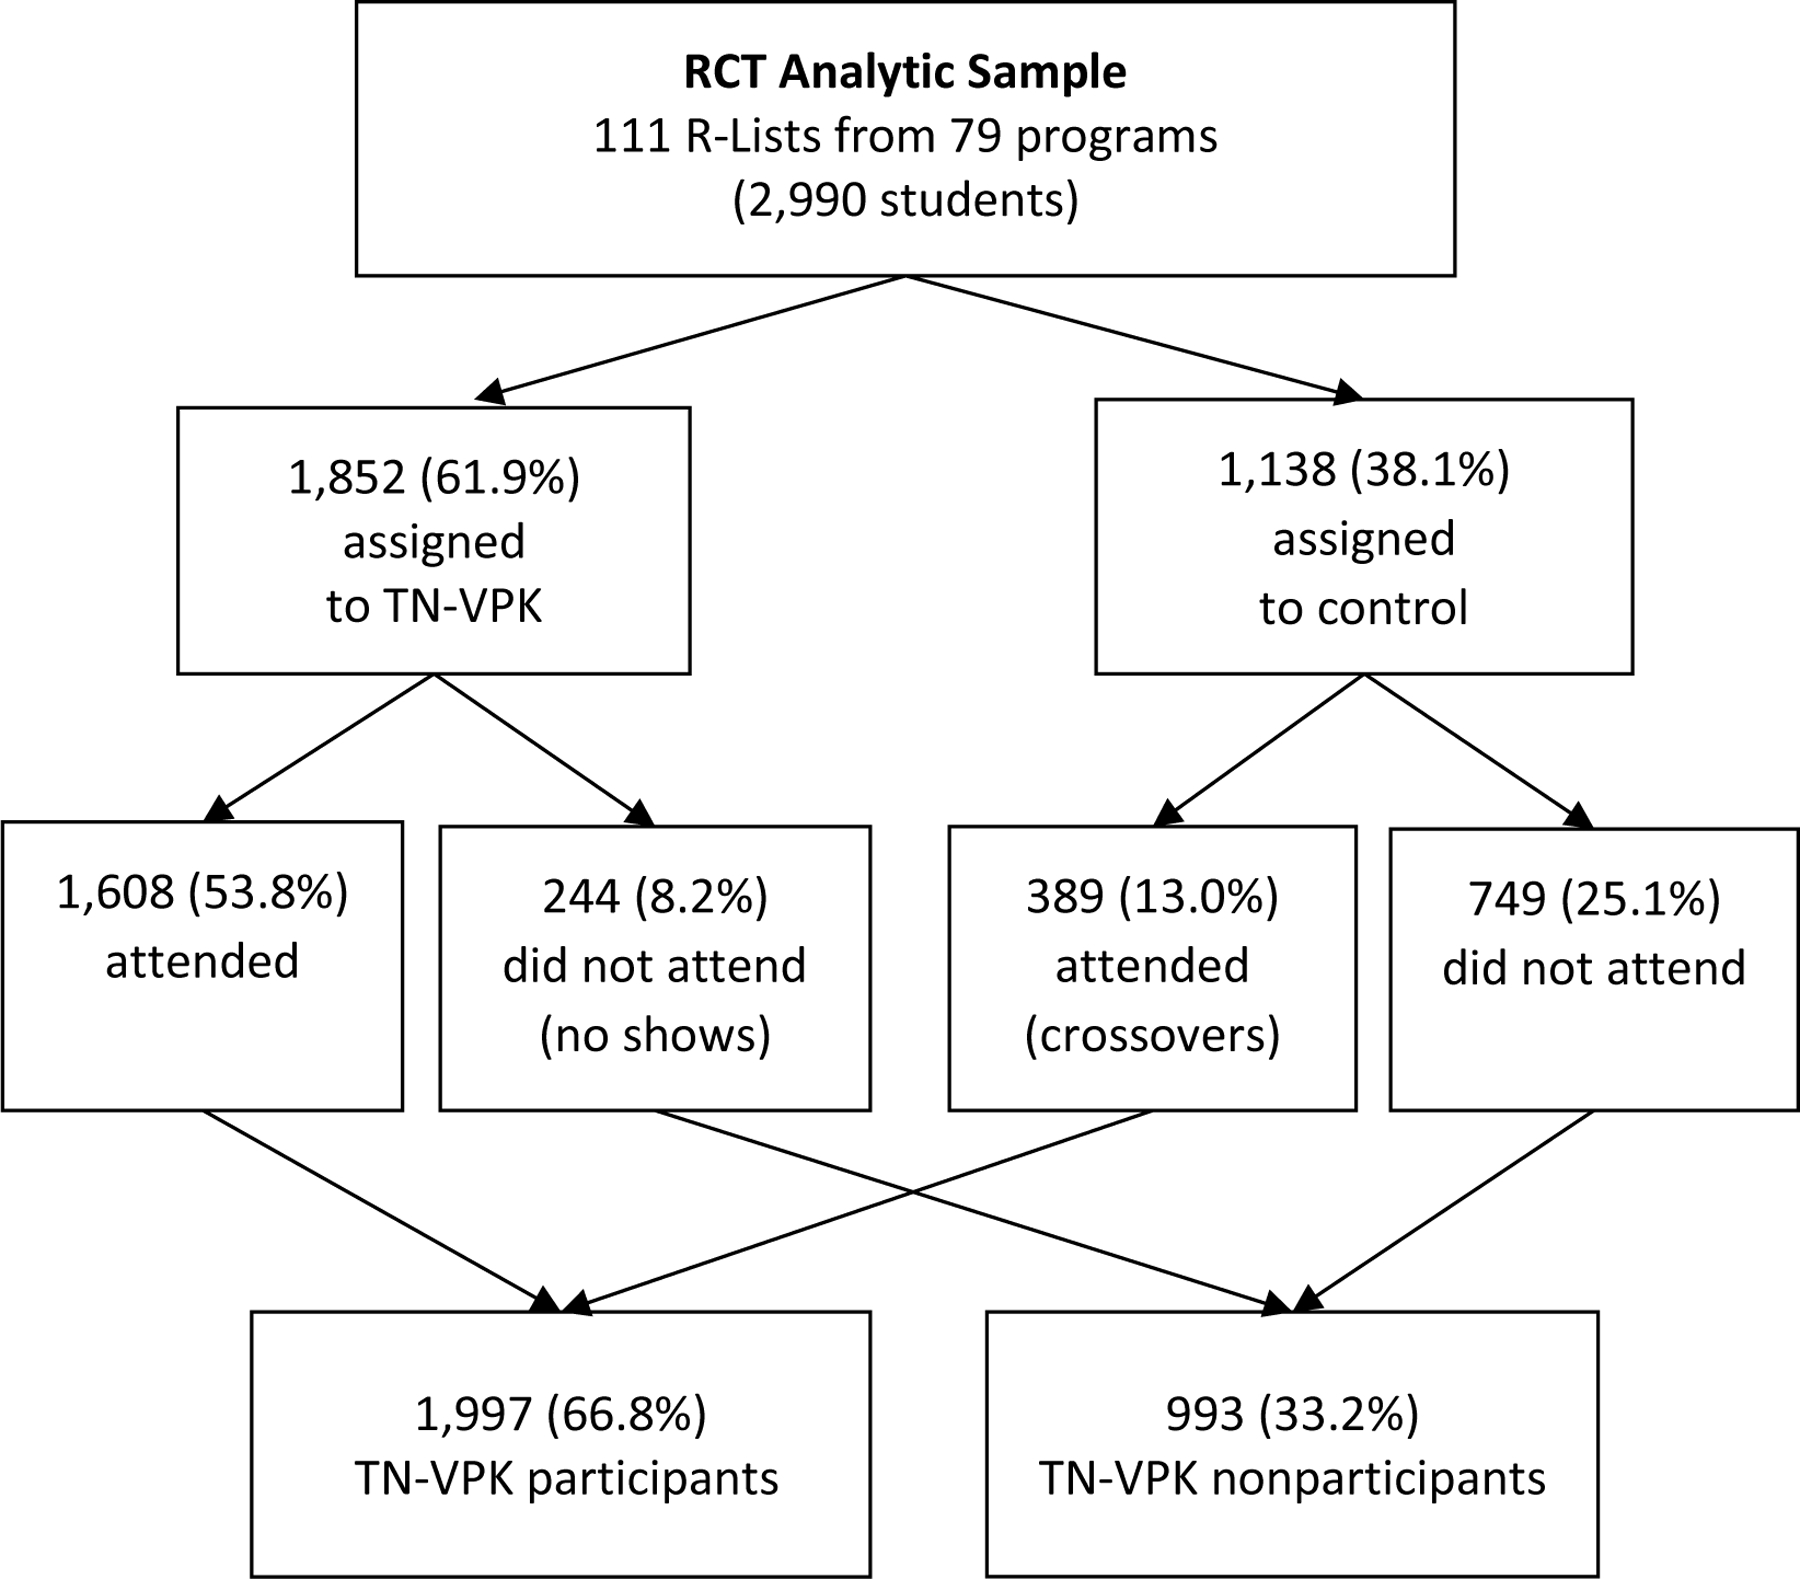
Composition of the Intent-to-Treat (ITT) and Treatment-on-Treated (TOT) Groups in the RCT Analytic Sample
Note: Percentages read across each row.
Counterfactual Conditions
While we do not have information on the alternative care arrangements for students in the RCT analytic sample who did not attend TN-VPK, we do have that information via parent interviews for the 306 non-attending children in the ISS sample described earlier. Overall, 63% received home-based care by a parent, relative, or other person; 13% attended Head Start; 16% were in private center-based childcare; 5% had some combination of Head Start and private childcare; and childcare for 3% was not reported. Characteristics of the programs and students contributing to the ISS were very similar to those in the RCT analytic sample (Lipsey et al., 2018).
Representativeness of the RCT Analytic Sample
Another component of the Tennessee Pre-K Study not otherwise discussed here involved a statewide probability sample of the 942 TN-VPK classrooms operating at the time the study began (Pearman et al., 2020). That sample included 155 TN-VPK classrooms purposely selected to be representative of the state program and 2,093 children in those classrooms with data on the same demographic characteristics available for the RCT analytic sample. To allow estimation of TN-VPK effects for students with the statewide demographic profile, children in the RCT analytic sample were identified with exact or very similar demographic profile matches to children in the statewide sample. Weighting functions were then created to up-weight or down-weight the children in the analytic sample to match the proportions with corresponding profiles in the statewide probability sample (see Lipsey et al., 2018 for details about the statewide probability sample demographics). This procedure allowed us to generalize the findings from oversubscribed programs in the RCT analytic to the statewide program as a whole.
RCT Analytic Sample Outcome Measures
Data providing outcome variables for the RCT analytic sample were drawn from the state database each year through 6th grade and included the following:
Tennessee Comprehensive Assessment Program (TCAP): State achievement test during students’ 3rd grade year; scaled scores for reading, math, and science.
TNReady: TNReady replaced TCAP in 2015–16 as the state standardized achievement test. A major breakdown in the testing program when switching to TNReady resulted in a loss of 4th grade test scores for Cohort 2 and 5th grade scores for Cohort 1. We analyzed the 6th grade scaled scores for both cohorts in English language arts, math, and science.
Violation of school rules: Any recorded violations of school policy such as attendance-related issues, dress code violations, cheating, and the like.
Major disciplinary infractions: Possession of drugs, alcohol, or weapons, theft, vandalism, violence or threats of violence, bullying, fighting, assault, and sexual harassment.
IEP other than for gifted or physical disability: Children with special education programming for a specific learning disability, intellectual disability, speech or language impairment, emotional disturbance, autism, functional delay, or developmental delay.
Attendance rate: The number of days attended divided by the number of days enrolled.
Grade level: Enrollment below vs. at or above expected grade indicating retention in grade.
Some children were not enrolled in a TN public school in some years and did not have state records those years. In kindergarten, 98.5% had state data, 96.5% in 1st grade, 95.0% in 2nd grade, 93.7% in 3rd grade, 92.5% in 4th grade, 91.3% in 5th grade, and 90.3% in 6th grade.
Analysis
Missing Data
Missing values on the variables used in analysis fell into two categories. First, 141 children in the initial randomization did not enroll in TN public schools after the pre-k year (with one late exception) and only 40 of those enrolled in TN-VPK during the pre-k year. Most of these children had no baseline data, none had outcome data, and they were dropped from the analytic sample. Second, there was missing outcome data in the analytic sample (ranging from 9.7% to 13.3%), though none on baseline variables.
The potential for differential attrition to bias treatment effect estimates was explored for the N=2990 analytic sample and the N=3131 initial sample that included the 141 cases without outcome data. First, missing data rates for outcome variables were compared for the ITT treatment vs. control conditions. The differences for the analytic sample were all less than 2 percentage points; for the initial sample, all were less than 3 percentage points. None of these differences were statistically significant at alpha=.05, but significance at p<.10 was found for major disciplinary infractions and the combined measure of major infractions and school rule violations in the analytic sample and for all three disciplinary measures in the initial sample.
Although missing data rates for the treatment and control conditions were generally comparable, consideration was also given to the possibility that the missing outcome data were different for each condition, which also could bias effect estimates. For this purpose, we imputed estimates of the missing values and compared effect estimates with and without the imputed data. Twenty-five imputed data sets were generated separately for the ITT treatment and control conditions and combined for analysis. The analysis models described in the next section were then used to estimate treatment effects for each outcome variable with the observed and imputed values for the analytic and initial samples.
With two exceptions, the effect estimates for the observed and imputed data from the analytic sample were closely comparable for direction, magnitude, and statistical significance. The exceptions were the proportion of children with an IEP in 6th grade and the proportion with any major disciplinary offense over the K-6th grades. In both cases, the estimates with imputed values were smaller and nonsignificant compared to larger significant ones with observed values. However, these effect estimates were very small, ranging from .014 to .033. For the initial sample, the direction, magnitude, and statistical significance of the effect estimates for the observed and imputed data were also comparable across outcomes with the exception of IEP and major disciplinary offenses, but also for attendance. Again, the estimates were very small, ranging from .001 to .033, and of dubious practical significance. Notably, the critical achievement test effect estimates were quite comparable across these various comparisons.
Details about these analyses and their results are in Supplemental Materials 1. Given how little evidence was found of consequential differentials in the proportions of missing values or the effects found with and without imputation, we have chosen to focus this report on the results found with the observed data in the analytic sample.
Analysis Models
Analysis of TN-VPK effects used hierarchical linear models (HLM) with students nested in the R-List program sites from which applicants were randomized and those nested in their respective school districts. Equations for the HLM models and the corresponding SPSS syntax are in Supplemental Materials 2. A reanalysis of TN-VPK effects through 3rd grade using block fixed effects models as an alternative approach resulted in findings comparable to those with HLM (Watts et al., 2019). Many of the outcome variables of interest are binary (e.g., whether a student is on grade level). For consistency, the HLM results are presented here. Confirmation that they are substantially similar to the results of more technically appropriate multilevel logistic regression analyses are in Supplemental Table S1.
All the analyses of TN-VPK effects (unless otherwise indicated) incorporated what we will refer to as the “standard set” of covariates to adjust for baseline differences, improve statistical power, and provide a basis for moderator analysis. These included age at the beginning of the pre-k year, gender (male), race/ethnicity (White, Black, Hispanic), and native language other than English. At Level 2, to aid statistical power, we included TN-VPK program site characteristics identified by representatives of the Tennessee Department of Education as relevant to program performance: Urbanicity (urban vs. rural), Partner programs (operated by community organizations vs. schools), Priority schools (operated in the lowest performing schools), Pilot programs (funded in 1996 as pilot pre-k programs), and Region (west, central west, central east, and east parts of the state)1. Further analyses tested interactions between treatment condition and the student demographic variables to determine whether any of those variables moderated the effects of TN-VPK. These analyses involved a large number of statistical tests and Benjamini-Hochberg corrections for false positive rates were applied.
The primary analyses involved ITT comparisons with the original observed data and repeated with the weighting functions derived from the statewide probability sample described earlier. A principal stratification strategy modeled on that used in the Head Start Impact Study (Puma et al., 2010) was used to generate complier average causal effect (CACE) estimates from the ITT estimates. This procedure recognizes that the ITT treatment and control groups include four distinct subgroups differentiated by how they react to the randomization: Compliers who accept the condition to which they are randomized; Always Takers who obtain treatment whether randomized to it or not; Never Takers who do not participate in treatment whether randomized to it or not; and Defiers who choose the opposite of their assigned condition.
Some reasonable assumptions are that there are no or trivially few Defiers (unlikely that parents who apply for TN-VPK will reject admission if offered but obtain it if not offered), and that the expectation from randomization will yield the same proportion and characteristics for Always Takers in both the ITT treatment and control groups (latter called Crossovers). Along with a few technical assumptions, these allow derivation of a multiplier that scales the ITT effect estimates into CACE estimates (Gennetian et al., 2005; Puma et al., 2010, p. 5–53). This procedure also rescales the standard errors of the ITT estimates with the same multiplier so the statistical significance of the CACE estimates is the same as for the corresponding ITT estimates. These scaled up estimates have been shown to be equivalent to the CACE estimates derived by an alternative approach using two-stage least-squares instrumental variable analysis with random assignment as the instrument (Angrist et al., 1996).
As effect estimates for Compliers, the CACE estimates omit the Always Taker subgroups that also participated in TN-VPK and would thus need to be included in full TOT estimates. While effects for Always Takers cannot be estimated directly, their outcomes on the state achievement tests were compared with those for control condition Compliers and for treatment condition No Shows to provide some general indication of their potential magnitude. Those estimates fell well within the confidence intervals for the CACE estimates. On that basis, we assume the effects for the Always Takers are comparable to the CACE estimates and have interpreted the CACE estimates as TOT estimates. Details for the CACE and TOT derivations are provided in Supplemental Materials 3.
Baseline Equivalence between Conditions
The state administrative data system does not collect data on TN-VPK applicants at the beginning of the pre-k year. Descriptive baseline variables for the RCT analytic sample were thus limited to demographic and program site characteristics. Baseline equivalence comparisons for the ITT treatment and control groups on student demographic characteristics in the observed data are presented in Table 1 (this comparison does not apply to program sites, only within sites). There were no statistically significant differences on any of the demographic variables and the effect sizes were small, indicating substantial similarity between the respective treatment and control groups. These analyses were repeated with the weighting function applied and with multilevel logistic regression, which also revealed no significant baseline differences (Supplemental Tables S2 and S3). As a further check, baseline differences on student demographics were examined for the data contributing to each outcome taking attrition into account. None of these differences were significant (Supplemental Table S4).
Table 1.
Intent-to-Treat (ITT) Treatment and Control Comparisons on Baseline Variables (RCT Analytic Sample, Observed Data)
| Variable | Treatment Group Meana | Control Group Meana | Pooled SDb | Coefficient for T-C Differencec |
Effect Sized | p-value |
|---|---|---|---|---|---|---|
| Age (months) | 53.21 | 53.30 | 3.47 | −.087 | −.025 | .507 |
| Gender (male) | .50 | .49 | .50 | .006 | .012 | .752 |
| White | .67 | .68 | .50 | −.010 | −.019 | .578 |
| Black | .20 | .20 | .45 | .001 | .003 | .941 |
| Hispanic | .14 | .13 | .41 | .007 | .018 | .639 |
| Non-native English | .14 | .13 | .41 | .008 | .019 | .617 |
| N = 1852 | N =1138 |
Estimated marginal means from multilevel analysis models.
Pooled treatment and control group standard deviations.
Coefficients for the treatment-control differences from multilevel models predicting each baseline variable with ITT condition as the only predictor.
Effect size: Coefficient for the treatment-control difference divided by the pooled standard deviation.
Study materials are available at https://my.vanderbilt.edu/tnprekevaluation/ and deidentified datasets are available by request from the first author. This study was not preregistered.
Results: RCT Analytic Sample
Academic Performance
State Achievement Tests
Most students in the RCT analytic sample had scores on the state achievement tests first administered in 3rd grade. TN-VPK effects on those scores were reported previously (Lipsey et al., 2018), but we include them here to allow comparison with the later 6th grade scores and because the weighting function and covariates were updated from previous reports. The first two panels of Table 2 present ITT and TOT results for 3rd and 6th grade; the second two panels present analogous results with the observed values weighted to match the demographic profile of the statewide TN-VPK population. The 3rd grade results show that control children outperformed TN-VPK children across the three subject areas, with those differences statistically significant for mathematics and science in the unweighted analyses and for all three tests in the weighted analyses. On the 6th grade TNReady tests, control children continued to outperform the TN-VPK children in reading, mathematics, and science with statistically significant differences larger than those observed in 3rd grade. These effects were similar when examining only the ISS sample (Table 3, see analysis details in Supplemental Table S5).
Table 2.
Intent-to-Treat (ITT) and Treatment-on-Treated (TOT) Effect Estimates for Third and Sixth Grade State Achievement Tests (RCT Analytic Sample)
| ITT | TOT | |||||||
|---|---|---|---|---|---|---|---|---|
|
| ||||||||
| Treatment Group Meana | Control Group Meana | Pooled SDb | Coefficient for T-C Differencec | Effect Sized | p - valuee | Coefficient for T-C Differencec | Effect Sized | |
| Third Grade TCAP (Observed Values) | ||||||||
| Reading | 746.1 | 748.2 | 34.34 | −2.13 | −.062 | .146 | −4.05 | −.118 |
| Math | 755.9 | 760.2 | 35.56 | −4.22* | −.119 | .006 | −8.02* | −.225 |
| Science | 748.6 | 752.2 | 35.33 | −3.58* | −.101 | .016 | −6.80* | −.192 |
| N = 1505–1506 | N = 935–936 | N = 2440–2442 | ||||||
|
| ||||||||
| Sixth Grade TNReady (Observed Values) | ||||||||
| ELA | 321.2 | 325.0 | 29.86 | −3.83* | −.128 | .002 | −7.18* | −.240 |
| Math | 317.1 | 323.6 | 36.31 | −6.46* | −.178 | .000 | −12.12* | −.333 |
| Science | 750.4 | 755.6 | 39.37 | −5.18* | −.132 | .002 | −9.83* | −.249 |
| N = 1615–1630 | N = 976–996 | N = 2591–2626 | ||||||
|
| ||||||||
| Third Grade TCAP (Weighted Observed Values) | ||||||||
| Reading | 746.9 | 750.1 | 33.59 | −3.26* | −.097 | .027 | −6.19* | −.184 |
| Math | 755.6 | 761.0 | 34.84 | −5.40* | −.155 | .000 | −10.24* | −.293 |
| Science | 750.0 | 754.1 | 35.48 | −4.03* | −.114 | .008 | −7.64* | −.215 |
| N = 1505–1506 | N = 935–936 | N = 2440–2442 | ||||||
|
| ||||||||
| Sixth Grade TNReady (Weighted Observed Values) | ||||||||
| ELA | 320.5 | 325.1 | 30.26 | −4.56* | −.151 | .000 | −8.56* | −.282 |
| Math | 316.8 | 324.5 | 36.14 | −7.70* | −.213 | .000 | −14.44* | −.399 |
| Science | 750.0 | 756.4 | 39.09 | −6.35* | −.163 | .000 | −12.06* | −.308 |
| N = 1615–1630 | N = 976–996 | N = 2591–2626 | ||||||
p < .05
p < .10 for coefficients
Covariate-adjusted means generated by multilevel analysis models.
Pooled treatment and control group standard deviations. There are minor variations between the pooled SDs for ITT and TOT; the mean is presented here but effect sizes are computed on the exact values.
Coefficients for treatment-control differences from multilevel models with children nested in R-Lists and R-Lists nested in districts and the standard set of covariates (see text). The multipliers for the ITT coefficients that estimate the TOT coefficients are between 1.8965–1.8990 with third grade and 1.8751–1.8972 for sixth grade.
Effect size: coefficient for the treatment-control difference divided by the pooled standard deviation. Negative signs indicate a less favorable outcome for the treatment group.
The p-values for statistical significance that are the same for the ITT and TOT coefficients.
Table 3.
Effect Sizesa for the RCT and ISS Samples for Sixth Grade Outcomes
| RCT (N = 2591–2700) |
ISS (N = 914–965) |
|||
|---|---|---|---|---|
| ITT | TOT | ITT | TOT | |
| Achievement Tests | ||||
| English | −.128 | −.240 | −.091 | −.185 |
| Math | −.178 | −.333 | −.113 | −.227 |
| Science | −.132 | −.249 | −.075 | −.156 |
| On Grade | −.025 | −.047 | .063 | .125 |
| IEP | −.107 | −.203 | −.135 | −.270 |
| School Rules | −.119 | −.222 | −.158 | −.316 |
| Major Offenses | −.083 | −.157 | −.073 | −.146 |
| Any Offenses | −.090 | −.170 | −.140 | −.278 |
Effect size: coefficient for the treatment-control difference divided by the pooled standard deviation. Negative signs indicate a less favorable outcome for the treatment group.
The loss of 4th grade state achievement test scores for Cohort 2 and 5th grade scores for Cohort 1 resulting from the lapse in testing when the TCAP was replaced by the TNReady tests precluded year-to-year comparisons for the analytic sample. Figure 2 charts the available reading and math scores for the cohorts with state data at each grade level. Supplemental Table S6 provides more detail for these estimates. These findings do not change when students who were retained or promoted a grade level are excluded (Supplemental Table S7).
Figure 2.
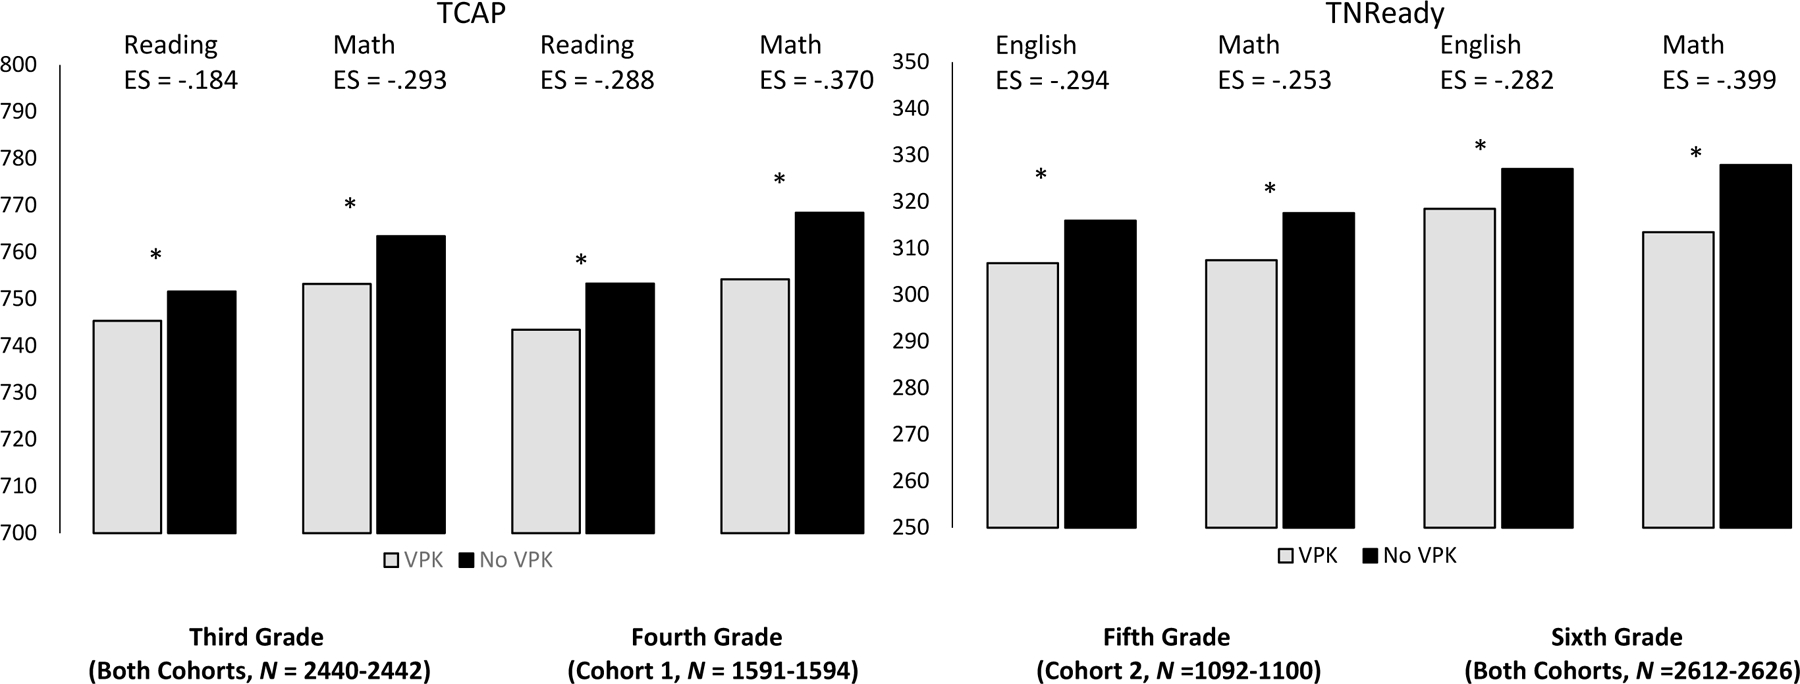
Standardized Tests TOT Weighted Covariate-Adjusted Means in Third through Sixth Grades (RCT Analytic Sample)
Note. Asterisks indicate significant differences (p <.05). These graphs include students who have been promoted or retained. The grades noted above refer to students’ expected grade levels. More detailed ITT and TOT results for each grade with observed and weighted data are provided in Supplemental Table S6. Analyses were also performed including only students who were at or above expected grade level with similar results (Supplemental Table S7).
Exploration of differential effects on the state achievement tests in 3rd and 6th grade found no statistically significant interactions of ITT treatment condition with age, gender, White, Black, or non-native English language. However, there were significant interactions for Hispanic children in 3rd grade for the weighted analysis for reading (B = 14.63, SE = 4.57, t = 3.20, p = .020) and marginally for mathematics and science after Benjamini-Hochberg adjustments (B = 13.26, SE = 4.74, t = 2.79, p = .098 and B = 12.50, SE = 4.74, t = 2.64, p = .125, respectively). Results for the unweighted models were similar. In 3rd grade, Hispanic students who did not participate in TN-VPK performed better than those who did participate; non-Hispanic students who did not participate in TN-VPK performed the same as those who did participate. In 6th grade, there were no significant interactions for any of the achievement tests.
Retention in Grade and Special Education
Whether students were in the expected grade level in 6th grade (had not been retained) was represented with a binary variable, 0 for below the expected level and 1 if at that level or (rarely) above. As Table 4 reports, 87.2% of the TN-VPK participants in the analytic sample and 88.1% of the nonparticipants were at grade level. There were no significant differences between these groups in retention with either the weighted or unweighted analysis, a finding confirmed with multilevel logistic regression (Supplemental Table S1).
Table 4.
Intent-to-Treat (ITT) and Treatment-on-Treated (TOT) Effect Estimates for Grade Level and Special Education Status at the End of Sixth Grade (RCT Analytic Sample)
| ITT | TOT | |||||||
|---|---|---|---|---|---|---|---|---|
|
| ||||||||
| Treatment Group Meana | Control Group Meana | Pooled SDb | Coefficient for T-C Differencec | Effect Sized | p-valuee | Coefficient for T-C Differencec | Effect Sized | |
| Observed Values | ||||||||
| On grade | .872 | .881 | .329 | −.008 | −.025 | .531 | −.016 | −.047 |
| IEP | .117 | .084 | .304 | .033* | −.107 | .010 | .062* | −.203 |
|
| ||||||||
| Weighted Observed Values | ||||||||
| On grade | .851 | .860 | .354 | −.009 | −.026 | .528 | −.017 | −.049 |
| IEP | .126 | .081 | .310 | .045* | −.144 | .001 | .085* | −.272 |
| N = 1678–1679 | N = 1021 | N = 2699–2700 | ||||||
p < .05
Note. On grade is a binary variable: 1=at or above expected grade level, 0 = below expected grade level. IEP = Individualized Educational Program as the formal special education designation coded 1 as yes and 0 as no.
Covariate-adjusted means generated by the multilevel analysis models.
Pooled treatment and control group standard deviations. There are minor variations between the pooled SDs for the ITT and TOT; the mean is presented here but effect sizes are computed on the exact values.
Coefficients for the treatment-control differences from multilevel multiple models with children nested in R-Lists and R-Lists nested in districts and the standard set of covariates (see text). The multipliers for ITT coefficients that estimate TOT coefficients are 1.8907 for expected grade level and 1.8904 for IEP.
Effect size: coefficient for the treatment-control difference divided by the pooled standard deviation.
The p-values for statistical significance are the same for the ITT and TOT coefficients.
Students were coded as 1 if they had any IEP except for gifted or physical disabilities in a given year, and 0 if they did not. As Table 4 reports, more TN-VPK participants (11.7%) had an IEP compared to nonparticipants (8.4%) in 6th grade. These differences were significant in both the weighted and unweighted analysis, and in parallel multilevel logistic regression (Supplemental Table S1). These effects were similar when examining the ISS sample compared to the RCT analytic sample (Table 3, see analysis details in Supplemental Table S8).
Although our focus is on 6th grade outcome data, trends across the years are also informative. From kindergarten through 6th grade, the treatment and control groups in the analytic sample had similar retention rates (Supplemental Table S9 and Supplemental Figure S1). One exception was 1st grade when more TN-VPK participants were at expected grade level (fewer retained in kindergarten). However, by 2nd grade the conditions were similar again.
Because the state department of education administers TN-VPK and most of the classrooms are in elementary schools, TN-VPK participants have an early extra year in which to be screened and identified for special education services, and once identified, generally maintain that status for several years. More TN-VPK participants than nonparticipants had an IEP in kindergarten, continuing into 6th grade (Supplemental Table S10 and Supplemental Figure S2). Moreover, the proportion of students in the control group with IEPs began trending down in 2nd grade while that for TN-VPK participants was more stable over time.
Behavioral Outcomes
Attendance and Attendance Trends
Attendance rates in 6th grade (proportion of instructional days without a recorded absence) were high for both TN-VPK participants and nonparticipants. Nonetheless, the difference between groups was statistically significant with a slightly higher rate for nonparticipants (97.5% vs. 97.1%, p = .013 for the ITT analysis with observed values). Supplemental Table S11 provides model details for each year (see also Supplemental Figure S3). Sixth grade was the first academic year with a significant attendance difference between conditions, although there were marginally significant effects in kindergarten and 1st grade.
Disciplinary Infractions
The frequency of expulsions, in-school suspensions, and out-of-school suspensions increased across the school years but was relatively low in any one school year. To summarize, we created outcome variables that indicated whether any such events were recorded across the kindergarten to 6th grade years (1 if any offenses, 0 in none). We also differentiated events classified as minor or major offenses. All analyses revealed higher rates of recorded disciplinary events for TN-VPK participants than nonparticipants, and these differences were statistically significant except for the weighted analysis for major offenses (Table 5; multilevel logistic results in Supplemental Table S1). These effects were also similar when examining the ISS sample (Table 3, see analysis details in Supplemental Table S12). There were no significant interactions between ITT condition and demographics for these outcomes. The offense rates are graphed across grades in Figure 3 (detail in Supplemental Table S13). The differences between conditions grew larger each year, particularly for school rule violations.
Table 5.
Intent-to-Treat (ITT) and Treatment-on-Treated (TOT) Effect Estimates for Cumulative Disciplinary Events through Sixth Grade (RCT Analytic Sample)
| ITT | TOT | |||||||
|---|---|---|---|---|---|---|---|---|
|
| ||||||||
| Treatment Group Meana | Control Group Meana | Pooled SDb | Coefficient for T-C Differencec | Effect Sized | p - valuee | Coefficient for T-C Differencee | Effect Sized | |
| Observed Values | ||||||||
| School Rules | .231 | .185 | .396 | .047* | −.119 | .004 | .088* | −.222 |
| Major Offenses | .137 | .109 | .331 | .028* | −.083 | .043 | .052* | −.157 |
| All Offenses | .273 | .234 | .429 | .039* | −.090 | .025 | .073* | −.170 |
|
| ||||||||
| Weighted Observed Values | ||||||||
| School Rules | .249 | .194 | .409 | .055* | −.135 | .001 | .103* | −.253 |
| Major Offense | .139 | .117 | .339 | .022 | −.066 | .121 | .042 | −.123 |
| All Offenses | .287 | .250 | .440 | .037* | −.084 | .041 | .070* | −.159 |
| N = 1618–1626 | N = 974–980 | N = 2592–2606 | ||||||
p < .05 for coefficients
Note. School rules: violations of school rules or other administrative issues; major offenses: fighting, bullying, weapon in school, and the like; all offenses: total across school rule and major offenses categories. These are coded for whether there is any infraction recorded in school records cumulatively from K through the sixth-grade year (1 = yes, 0 = no).
Covariate-adjusted means generated by the multilevel analysis models.
Pooled treatment and control group standard deviations. There were minor variations between the pooled SDs for the ITT and TOT; the mean is presented here but effect sizes were computed on the exact values.
Coefficients for the treatment-control differences from multilevel models with children nested in R-Lists and R-Lists nested in districts and the standard set of covariates (see text). The multiplier for ITT coefficients that estimates TOT coefficients is 1.8790 for school rule violations, 1.8811 for major offenses, and 1.8847 for all offenses.
Effect size: coefficient for the treatment-control difference divided by the pooled standard deviation.
The p-values for statistical significance that are the same for the ITT and TOT coefficients.
Figure 3.
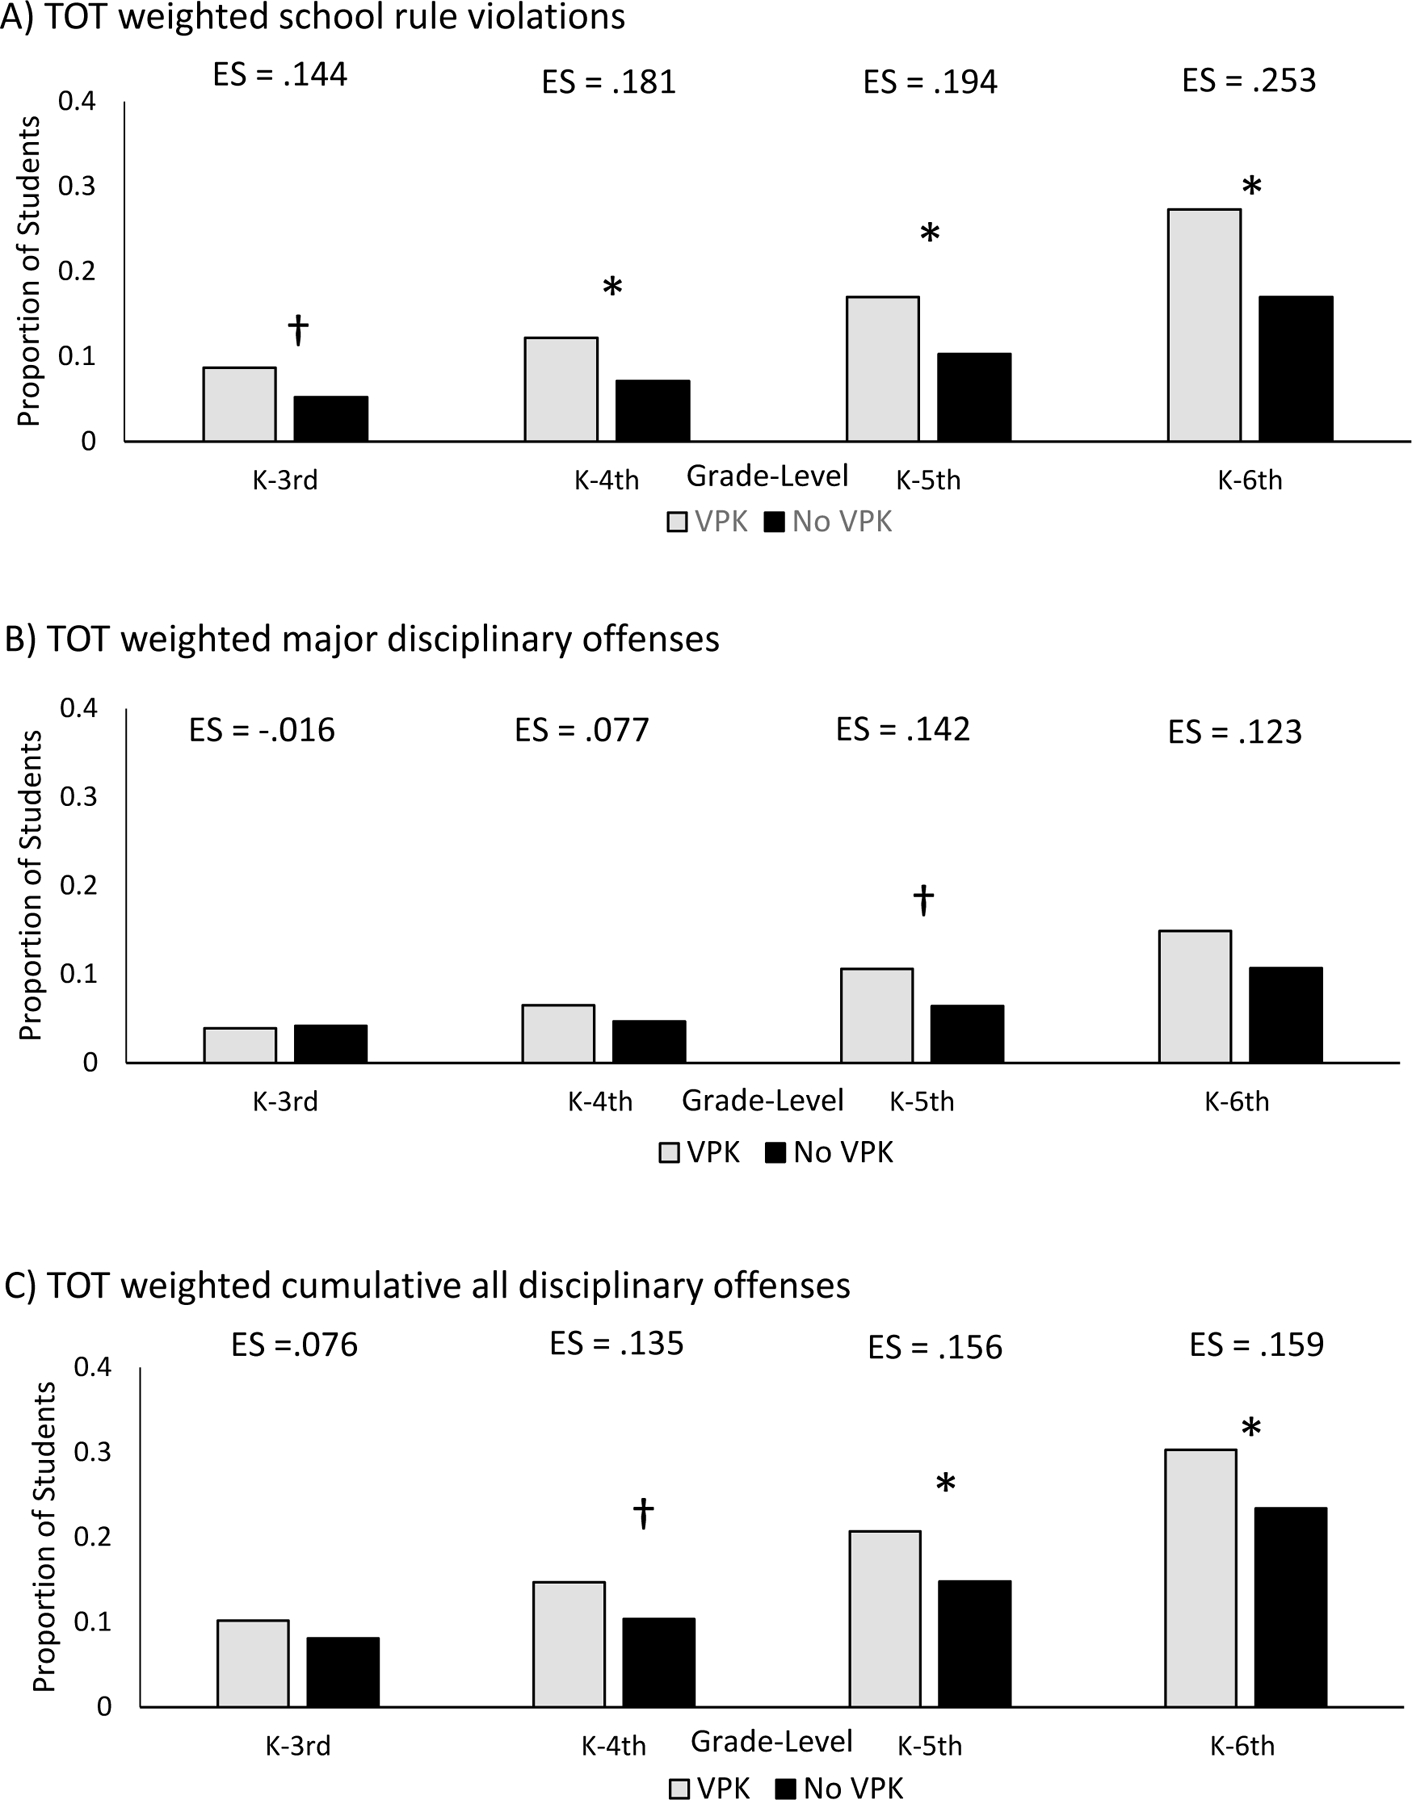
Disciplinary Offenses in Kindergarten through Sixth Grade (RCT Analytic Sample)
Note. Percentage of students with A) one or more school rule violation disciplinary offenses, B) one or more major disciplinary offenses, and C) any type of disciplinary offense across grades. Asterisks indicate p < .05 and obelisks indicate p < .10. Cumulative disciplinary analyses are located in Supplemental Table S13.
Discussion
We have presented the results through 6th grade of the effects of a scaled-up, state-funded prekindergarten program, the only randomized control study of a statewide pre-k program to date. As reported in prior papers (Lipsey et al., 2018; Pion & Lipsey, in press), the effects of TN-VPK on individually assessed early achievement measures at the end of the pre-k school year were strong, especially on literacy measures. Those results are thus similar to the findings of multiple age-cutoff regression-discontinuity studies that have become the most common research model for assessing end of pre-k effects (e.g., Hustedt et al., 2021; Montrosse-Moorhead et al., 2019; Wong et al., 2008).
Followed over time, however, the TN-VPK effects disappeared by the end of kindergarten and turned negative by the end of 3rd grade (Lipsey et al., 2018). Subsequently the achievement effects have increased in negative magnitude across the years and been moderate to strong. We found the same increasingly negative trend for disciplinary infractions and, by 6th grade, for attendance. For retention in grade we found no effect, and for the need for special education services we found a negative effect.
Quality of the TN-VPK Program
If TN-VPK is quite different from those implemented in other states, it could mean our results are limited to Tennessee. As we report, the statewide scale up of TN-VPK began in 2005 after nearly 10 years of pilot testing and met 9 of the 10 NIEER benchmarks (Barnett et al., 2009). A recent review of statewide programs by the NIEER group (Friedman-Krauss et al., 2019) praised the program in Tennessee for being among those in 27 states that paid its pre-k teachers at parity with elementary teachers, one of only 26 states to offer pre-k teachers retirement benefits, health care and paid time off, and one of only 25 to require its teachers to have a bachelor’s degree plus certification. Among state-funded pre-k programs, the TN program is above average and arguably in the top tier on characteristics many believe mark high quality (Sharpe et al., 2017).
However, as Bassok and Engel noted (2019), “there is surprisingly little consensus on the specific characteristics or combination of programmatic features that are most essential for ensuring the effectiveness of ECE programs” (p. 4). Judged alternatively by its performance in producing student gains on commonly measured cognitive outcomes, an age-cutoff regression-discontinuity substudy has also found that TN-VPK ranks as a top tier program when compared to the results of similar studies in other states (Pion & Lipsey, in press). While it is an open question whether results similar to those found for TN-VPK would be found with a similarly rigorous long-term evaluation of any other state program, no distinctive characteristics of the Tennessee program have yet been identified that are a likely explanation for the disappointing findings. It is important therefore to explore other potential explanations of a more general sort.
Reversal of Initial Positive Pre-K Effects
Our results are stronger than, but not dissimilar to, those from the Head Start Impact study (Puma et al., 2010) and other long-term follow up assessments without random assignment (see Bailey et al., 2017, Bailey et al., 2020 for reviews). Almost all early childhood interventions show initial positive effects and almost all show substantial fade out of effects, some immediate as for TN-VPK, others taking somewhat longer to emerge. As the only longitudinal evaluation of a statewide program with random assignment, this TN-VPK study is also the only one to date to show long-term negative effects. When we reported the 3rd grade results, there was concern about this unexpected finding. We anticipate that these results through 6th grade will heighten those concerns. While it is always speculative to explain unanticipated findings, it is important to offer some possible avenues for consideration. As mentioned earlier, there were no significant differences in the quality of the schools and teachers that VPK and control students subsequently experienced after pre-k (Pearman, 2020), so differences in the quality of schools treatment and control children attended is not a possible explanation for these findings.
Constrained versus Unconstrained Academic Skills
One contributor to the fade out of pre-k effects may involve the content focus of the instruction children receive, an idea recently gaining traction. Evaluating eight statewide pre-k programs, Barnett and colleagues (2018) found, as we did, that the largest immediate effect was in concrete literacy skills, with much smaller effects on language and math skills. They urge pre-k programs to broaden their scope of instruction. These early concrete literacy skills include directly teachable skills in a finite domain (e.g., 26 letters of the alphabet): “constrained skills have a ceiling; the learner can achieve perfect performance” (Snow & Matthews, 2016, p. 58).
Unconstrained skills in literacy (vocabulary, listening comprehension, and background knowledge) and in numeracy (problem solving and mathematical reasoning) are not typically the focus of instruction in early childhood classrooms (Montrosse-Moorhead et al., 2019; Valentino, 2017), perhaps because they are not the usual content of assessments amid the increasing emphasis on “school readiness.” Over time, these skills become increasingly important in school, but they are more difficult to teach and assess (Snow & Matthews, 2016).
A consistent finding across recent studies is that children who attend pre-k enter kindergarten scoring higher on concrete school readiness skills, skills that are then mastered by non-attenders over the course of the kindergarten year or shortly thereafter. The early childhood field has not been successful so far in identifying classroom characteristics and interactions linked to improvements in unconstrained skills (e.g., Guerrero-Rosada et al., 2021) although practices linked to gains in school readiness skills have been identified (e.g., Farran et al., 2017). In 2020, Bailey and colleagues addressed this perplexing finding by stressing the importance of targeting “trifecta” skills – “ones that are malleable, fundamental, and would not have developed in the absence of intervention” (Bailey et al., 2020, p. 66–67). They argue that the early childhood field must first answer the question about which fundamental and malleable outcomes pre-k should aim to improve if longer-term effects are to be attained.
Attention and Working Memory – Two Important Unconstrained Skills
The interest in unconstrained skills has thus far focused almost exclusively on specific academic outcomes like vocabulary and certain math skills; other more fundamental skills may be equally or more important. Many statewide programs target children of low-income families. Studies over the last 20 years or so have demonstrated the devastating effects of poverty on the developing brain (Brito & Noble, 2015; Yaple & Yu, 2020), particularly in the areas of language and executive function. Among the executive function skills that appear most affected are working memory and attention (Lupina & Posner, 2012). Moreover, differences in working memory continue to be associated with SES well into adolescence (Judd et al., 2020). Despite the focus of targeted pre-k programs on children from high poverty families, with rare exceptions the early childhood field has not taken these neuroscience findings into account. Even a pre-k curriculum focused on the development of executive function skills failed to show short or long-term effects on any of those skills that were measured (Nesbitt & Farran, 2021).
The possible benefits from developing good strategies for affecting children’s development in working memory and attention are illustrated in recent research. For example, improvements in working memory have been identified as a critical factor in children moving from a reliance on “reactive” to one of “proactive” cognitive control (Troller-Renfree et al., 2020), the latter associated with more planful learning strategies. Further, in a longitudinal study of mathematics achievement, Geary and colleagues (2017) demonstrated that working memory in early childhood emerged as the most important domain-general ability associated with performance in later grades.
In addition to working memory, early attention skills are related to SES and important for long-term development. A review by Duncan and colleagues (2007) of five major longitudinal studies identified early measures of attention as one of three key predictors of long-term outcomes. More recent research has shown that attention skills in early childhood appear to be composed of two factors: selective-sustained attention and an executive factor. Only sustained-selective attention related to gains in pre-literacy and math skills (Shannon et al., 2020; Steele et al., 2012). “The current findings therefore provide a direct demonstration that cognitive building blocks to early numeracy and literacy depend on effortful control in early childhood” (Steele et al., 2012, p. 2039).
Working memory and attention may indeed be the relevant building blocks among the unconstrained skills that underlie development of more academic outcomes. However, little is known about how to facilitate their development in a classroom context. This issue of which skills are foundational and thus the most important focus for instruction is a critical one as we examine long-term effects from pre-k attendance (Green, 2020). State legislatures believe pre-k will positively affect 3rd grade reading scores and thus long-term school achievement, closing the gap. If those are indeed the desired outcomes, the early childhood field must identify the fundamental skills that relate to these outcomes and determine when and how those skills can be positively affected. The rush to implement statewide programs and the focus on initial school readiness concrete skills have meant that these important steps were not carried out.
Negative Behavioral Outcomes Associated with Attending Pre-K
Apart from the lack of positive effects on achievement, an unexpected finding important to explore further is the negative behavioral outcomes. Here also the results for TN-VPK are not at odds with findings from other studies of children who experience group care in early childhood. One outcome reported for the Abecedarian program was more aggressive behavior for program participants in the early grades (Haskins, 1985). Similar findings have emerged in the two ECLS-K samples where both cohorts were found to exhibit more externalizing behaviors and less self-control if they had any type of formal care before kindergarten (Bassok et al., 2015). These findings were replicated and extended through age 15 in the NICHD Study of Early Childcare and Youth Development where children who experienced more care outside the family prior to school entry were greater risk takers and more impulsive (Vandell et al., 2010). Lest we think that these negative outcomes are a function of earlier outdated versions of pre-k, a study from the current IES Early Learning Network reported that children who attended pre-k had higher rates of kindergarten teacher-reported conflict and lower rates of task orientation (Ansari et al., 2021). Our findings of higher rates of school disciplinary infractions for pre-k participants provide further support for this as an issue that warrants serious attention.
Searching for possible explanations of this common outcome, however, has not been immediately fruitful. Moffitt and colleagues (2011) found that early measures of self control were predictive of health and financial outcomes when individuals were in their 30’s. The finding was robust after controlling for social class and early measures of IQ. Some children developed more self control in early childhood with subsequent better outcomes via what Moffitt calls a “natural history change.” Whether an intervention-induced change would yield the same positive outcomes is an open question.
One possibility is that center-based care (the common denominator for studies with negative behavioral outcomes) could be preventing children from developing the internal self-control necessary for long-term development. In particular, classrooms of 20 4-year-olds require behavioral control exerted by adults. Studies demonstrate that teachers in these circumstances often display a flat to negative affect (Coelho et al., 2021; Farran et al., 2017), one that could lead to children developing negative attentional biases. Negative attentional biases have been associated with increased reactivity to later stressors (Todd et al., 2012).
The long-term negative outcomes on behavior for children in group care have been found in both small experimental studies and broad-based population studies. Determining their etiology and creating classroom practices that yield different outcomes is critical for programs that serve children from low-income families, but efforts so far have proven unsuccessful (Morris et al., 2014). Several large-scale studies and a meta-analysis have demonstrated the long-term negative effects from the early school suspensions we found in TN-VPK (Mendez, 2003; Mowen et al., 2020; Noltemeyer et al., 2015). School suspensions, even though most are for nonviolent infractions, are associated with lower academic achievement in later grades and eventually dropping out of school.
Conclusion
The randomized control study of the effects of a scaled-up statewide pre-k program reported here provides results through the end of 6th grade that should lead, at minimum, to questions about the content and pedagogical strategies currently employed in pre-k classrooms nationally. Kindergarten readiness on constrained skills was demonstrated in this pre-k program as it has been in many others. Longer-term effects are not so sanguine. Our results are robust and contrary to the claims made by many advocates for the universally positive effects of pre-k participation. Children from poor families who attended a state pre-k program did not, for the most part, become proficient readers in 3rd grade. On the contrary, their performance on all measures of achievement through 6th grade was significantly below that of comparable children who did not attend. Children who attended pre-k were not less likely to be retained and had a greater likelihood of being referred for special education services from pre-k through 6th grade – both of these in opposition to savings promised to states (Council of Economic Advisers, 2015). Given prior research, our findings of more disciplinary infractions for children in 6th grade who attended pre-k should not have been so unexpected but are nonetheless worrisome.
The whole package of outcomes we have found is disconcerting. The intent of everyone who has advocated for expansion of state pre-k programs is well meaning and reflects a commitment to improving the life outcomes for children from impoverished circumstances. If the programs we have created do not produce the desired effects, the findings themselves should not be dismissed simply because they were unanticipated and unwelcome. Rather, they should stimulate creative research into both policies and practices with potential to have the desired effects. The goal remains the same. If we are serious about the goal, the means to attain it may have to change.
Supplementary Material
Acknowledgments
This research was supported by the U.S. Department of Education Institute of Education Sciences Grant #R305E090009 and the U.S. Department of Health and Human Services NICHD Grant #R01HD079461–01. The opinions expressed are those of the authors and do not represent the views of the Institute of Education Sciences, the U.S. Department of Education, or the NICHD. This work would not have been possible without the assistance of the Tennessee Department of Education and Tennessee Education Research Alliance. Special thanks to Stone Dawson who served as a key data analyst, Jane Hughart, the project coordinator, and Ilknur Sekmen, the database administrator. We are also grateful for the support of multiple school districts and school administrators throughout Tennessee.
Footnotes
Study materials are available at https://my.vanderbilt.edu/tnprekevaluation/ and deidentified datasets are available by request from the first author. This study was not preregistered.
This set of covariates is more extensive than those used in analyses reported earlier (Lipsey et al., 2018) and, by using more information, resulted in somewhat better fitting models. As a consequence of this change, third grade results reported here do not agree exactly with those reported earlier, although the patterns remain the same.
References
- Administration for Children and Families [ACF] (2019). Head Start federal funding and funded enrollment history https://eclkc.ohs.acf.hhs.gov/sites/default/files/pdf/hs-federal-funding-enrollment-history.pdf
- Angrist JD, Imbens GW, & Rubin DB (1996). Identification of causal effects using instrumental variables. Journal of the American Statistical Association, 91(434), 444–455. 10.2307/2291629 [DOI] [Google Scholar]
- Ansari A, & Crosnoe R (2015). Immigration and the interplay of parenting, preschool enrollment, and young children’s academic skills. Journal of Family Psychology, 29(3), 382–393. 10.1037/fam0000087 [DOI] [PMC free article] [PubMed] [Google Scholar]
- Ansari A, Pianta RC, Whittaker JE, Vitiello V, & Ruzek. E (2021). Enrollment in public-prekindergarten and school readiness skills at kindergarten entry: Differential associations by home language and program characteristics. Early Childhood Research Quarterly, 54, 60–71. 10.1016/j.ecresq.2020.07.011 [DOI] [Google Scholar]
- Bailey DH, Duncan GJ, Cunha F, Foorman BR, & Yeager DS (2020). Persistence and fade-out of educational-intervention effects: Mechanisms and potential solutions. Psychological Science in the Public Interest 21(2), 55–97. 10.1177/1529100620915848 [DOI] [PMC free article] [PubMed] [Google Scholar]
- Bailey D, Duncan GJ, Odgers CL, & Yu W (2017) Persistence and fadeout in the impacts of child and adolescent interventions. Journal of Research on Educational Effectiveness, 10(1), 7–39. 10.1080/19345747.2016.1232459 [DOI] [PMC free article] [PubMed] [Google Scholar]
- Barnett S, Epstein DJ, Friedman AH, Sansanelli RA, & Hustedt JT (2009). The state of preschool 2009: State preschool yearbook (Tennessee pp. 132–133). The National Institute for Early Education Research [NIEER]. Rutgers University. http://nieer.org/wp-content/uploads/2016/10/200920yearbook-1.pdf [Google Scholar]
- Barnett WS, Jung K, Friedman-Krauss A, Frede EC, Nores M, Hustedt JT, Howes C, & Daniel-Echols M (2018). State prekindergarten effects on early learning at kindergarten entry: An analysis of eight state programs. AERA Open, 4(2), 1–16. 10.1177/2332858418766291 [DOI] [Google Scholar]
- Bartik TJ, & Hershbein B (2018). Pre-k in the public schools: Evidence from within U.S. states Upjohn Institute Working Paper 18–285. Kalamazoo, MI: W.E. Upjohn Institute for Employment Research. 10.17848/wp18-285 [DOI] [Google Scholar]
- Bassok D, & Engel M (2019). Early childhood education at scale: Lessons from research for public policy and practice. AERA Open, 5(1), 1–7. 10.1177/2332858419828690 [DOI] [Google Scholar]
- Bassok D, Gibbs C, & Latham S (2015). Do the benefits of early childhood interventions systematically fade? Exploring variation in the association between preschool participation and early school outcomes EdPolicyWorks Working Paper Series No. 36. https://curry.virginia.edu/working-paper-preschool-fade-out [Google Scholar]
- Brito NH, & Noble KG (2015). Socioeconomic status and structural brain development. Frontiers in Neuroscience, 8, 276. 10.3389/fnins.2014.00276 [DOI] [PMC free article] [PubMed] [Google Scholar]
- Cascio EU, & Schanzenbach DW (2013). The impacts of expanding access to high quality preschool education. Brookings Papers on Economic Activity, Fall, 127–192. 10.3386/w19735 [DOI] [Google Scholar]
- Coelho V, Aström F, Nesbitt K, Sjöman M, Farran D, Björck-Äkesson E, Christopher C, Granlund M, Almqvist L, Grande C, & Pinto A (2021). Preschool practices in Sweden, Portugal, and the United States. Early Childhood Research Quarterly, 55, 79–96. 10.1016/j.ecresq.2020.11.004 [DOI] [Google Scholar]
- Coley RL, Votruba-Drzal E, Collins M, & DeMeo Cook K (2016). Comparing public, private, and informal preschool programs in a national sample of low-income children, Early Childhood Research Quarterly, 36, 91–105. 10.1016/j.ecresq.2015.11.002 [DOI] [Google Scholar]
- Council of Economic Advisers. (2015). The economics of early childhood investments https://obamawhitehouse.archives.gov/sites/default/files/docs/early_childhood_report_update_final_non-embargo.pdf
- Deming D (2009). Early childhood intervention and life cycle skill development: Evidence from Head Start. American Economic Journal: Applied Economics, 1(3), 111–134. 10.1257/app.1.3.111 [DOI] [Google Scholar]
- Duncan GJ, Dowsett CJ, Claessens A, Magnuson K, Huston AC, Klebanov P, . . . Sexton H (2007). School readiness and later achievement. Developmental Psychology, 43(6), 1428–1446. 10.1037/0012-1649.43.6.1428 [DOI] [PubMed] [Google Scholar]
- Early DM, Li W, Maxwell KL, & Ponder BD (2019). Participation in Georgia’s pre-k as a predictor of third-grade standardized test scores. AERA Open, 5(2), 1–16. 10.1177/2332858419848687 [DOI] [Google Scholar]
- Evaluating the Effectiveness of Tennessee’s Voluntary Pre-K Program (n.d.). https://my.vanderbilt.edu/tnprekevaluation/
- Farran DC, & Lipsey MW (2015). Expectations of sustained effects from scaled up pre-K: Challenges from the Tennessee study. Evidence Speaks Reports, 1(3). [Google Scholar]
- Farran DC, Meador D, Christopher C, Nesbitt K & Bilbrey L (2017). Data-driven improvement in prekindergarten classrooms: Report from a partnership in an urban district. Child Development, 88, 1466–1479. DOI: 10.1111/cdev.12906 [DOI] [PubMed] [Google Scholar]
- Friedman-Krauss AH, Barnett WS, Garver KA, Hodges KS, Weisenfeld GG, & DiCrecchio N (2019). The state of preschool 2018: State preschool yearbook (NIEER] Rutgers University. http://nieer.org/wp-content/uploads/2019/08/YB2018_Full-ReportR3wAppendices.pdf [Google Scholar]
- Friedman-Krauss AH, Barnett WS, Weisenfeld GG, Kasmin R, DiCrecchio N, & Horowitz M (2018). The state of preschool 2017: State preschool yearbook The National Institute of Early Education Research [NIEER]. Rutgers University. http://nieer.org/state-preschool-yearbooks/yearbook2017 [Google Scholar]
- Geary DC, Nicholas A, Li Y, & Sun J (2017). Developmental change in the influence of domain-general abilities and domain-specific knowledge on mathematics achievement: An eight-year longitudinal study. Journal of Educational Psychology, 109(5), 680–693. 10.1037/edu0000159 [DOI] [PMC free article] [PubMed] [Google Scholar]
- Gennetian LA, Morris PA, Bos JM, & Bloom HS (2005). Constructing instrumental variables from experimental data to explore how treatments produce effects. In Bloom H (Ed). Learning more from social experiments: Evolving analytic approaches (pp. 75–114). Russell Sage Foundation. [Google Scholar]
- Gormley WT Jr., Gayer T, Phillips D, & Dawson B (2005). The effects of universal pre-k on cognitive development. Developmental Psychology, 41(6), 872–884. 10.1037/0012-1649.41.6.872 [DOI] [PubMed] [Google Scholar]
- Green CS (2020). Interventions to do real-world good: Generalization and persistence. Psychological Science in the Public Interest, 21(2), 43–49. 10.1177/1529100620933847 [DOI] [Google Scholar]
- Guerrero-Rosada P, Weiland C, McCormick M, Hsueh J, Sachs J, Snow C, & Maier M (2021). Null relations between CLASS scores and gains in children’s language, math, and executive function skills: A replication and extension study. Early Childhood Research Quarterly, 54, 1–12. 10.1016/j.ecresq.2020.07.009 [DOI] [Google Scholar]
- Harms T, & Clifford RM (1980). The Early Childhood Environment Rating Scale New York, NY: Teachers College Press. [Google Scholar]
- Haskins R (1985). Public school aggression among children with varying day-care experience. Child Development, 56(3), 689–703. 10.2307/1129759 [DOI] [PubMed] [Google Scholar]
- Hill CJ, Gormley WT, & Adelstein S (2015). Do the short-term effects of a high-quality preschool program persist? Early Childhood Research Quarterly, 32, 60–79. 10.1016/j.ecresq.2014.12.005 [DOI] [Google Scholar]
- Hustedt J, Jung K, Friedman-Krauss A, Barnett S & Slicker G (2021). Impacts of the New Mexico pre-k initiative by children’s race/ethnicity. Early Childhood Research Quarterly, 54, 194–203. 10.1016/j.ecresq.2020.09.006 [DOI] [Google Scholar]
- Judd N, Sauce B, Wiedenhoeft J, Tromp J, Chaarani B, Schliep A, van Noort B, Penttilä J, Grimmer Y, Insensee C, Becker A, Banaschewski T, Bokde A, Quinlan E, Desrivières S, Flor H, Grigis A, Gowland P, Heinz A, . . . Klingberg T (2020). Cognitive and brain development is independently influenced by socioeconomic status and polygenic scores for educational achievement. PNAS, 117, 12411–12418. 10.1073/pnas.2001228117 [DOI] [PMC free article] [PubMed] [Google Scholar]
- Ladd HF, Muschkin CG, & Dodge KA (2014). From birth to school: Early childhood initiatives and third-grade outcomes in North Carolina. Journal of Policy Analysis and Management, 33(1), 162–187. 10.1002/pam.21734 [DOI] [Google Scholar]
- Lipsey MW, Farran DC, & Durkin K (2018). Effects of the Tennessee Prekindergarten Program on children’s achievement and behavior through third grade. Early Childhood Research Quarterly, 45, 155–176. 10.1016/j.ecresq.2018.03.005 [DOI] [Google Scholar]
- Lipsey MW, Hofer KG, Dong N, Farran DC, & Bilbrey C (2013a). Evaluation of the Tennessee Voluntary Prekindergarten Program: End of pre-K results from the randomized control design. Research report Nashville, TN: Vanderbilt University, Peabody Research Institute. https://my.vanderbilt.edu/tnprekevaluation/files/2013/10/May2013_PRI_EndofPK_TN-VPK_RCT_ProjectResults.pdf [Google Scholar]
- Lipsey MW, Hofer KG, Dong N, Farran DC, & Bilbrey C (2013b). Evaluation of the Tennessee Voluntary Prekindergarten Program: Kindergarten and first grade follow-up results from the randomized control design. Research report Nashville, TN: Vanderbilt University, Peabody Research Institute. https://my.vanderbilt.edu/tnprekevaluation/files/2013/10/August2013_PRI_Kand1stFollowup_TN-VPK_RCT_ProjectResults_FullReport1.pdf [Google Scholar]
- Lupina SJ, & Posner MI (2012). The impact of poverty on the development of the brain. Frontiers in Human Neuroscience 6, 1–12. 10.3389/fnhum.2012.00238 [DOI] [PMC free article] [PubMed] [Google Scholar]
- Mendez LMR (2003). Predictors of suspension and negative school outcomes: A longitudinal investigation. New Directions for Youth Development, 2003(99), 17–33. 10.1002/yd.52 [DOI] [PubMed] [Google Scholar]
- Moffitt TE, Arseneault L, Belsky D, Dickson N, Hancox RJ, Harrington H, Houts R, Poulton R, Roberts BW, Ross S, Sears MR, Thomson WM, & Caspi A (2011). A gradient of childhood self-control predicts health, wealth, and public safety. PNAS, 108(7), 2693–2698. 10.1073/pnas.1010076108 [DOI] [PMC free article] [PubMed] [Google Scholar]
- Montrosse-Moorhead B, Dougherty S, La Salle T, Weiner J, & Dostal H (2019). The overall and differential effects of a targeted prekindergarten program: Evidence from Connecticut. Early Childhood Research Quarterly, 48, 134–145. 10.1016/j.ecresq.2019.02.006 [DOI] [Google Scholar]
- Morris P, Mattera S, Castells N, Bangser M, Bierman K, & Raver C (2014). Impact Findings from the Head Start CARES Demonstration: National Evaluation of Three Approaches to Improving Preschoolers’ Social and Emotional Competence. OPRE Report 2014–44 Washington, DC: Office of Planning, Research and Evaluation, Administration for Children and Families, U.S. Department of Health and Human Services. [Google Scholar]
- Mowen TJ, Brent JJ, & Boman IV JH (2020). The effect of school discipline on offending across time. Justice Quarterly, 37(4), 739–760. 10.1080/07418825.2019.1625428 [DOI] [PMC free article] [PubMed] [Google Scholar]
- Nesbitt K & Farran DC (2021). Effects of prekindergarten curricula: Tools of the Mind as a case study. Monographs of the Society for Research in Child Development, 86(1), 7–119. 10.1111/mono.12425 [DOI] [PMC free article] [PubMed] [Google Scholar]
- Noltemeyer AL, Ward RM, & Mcloughlin C (2015). Relationship between school suspension and student outcomes: A meta-analysis. School Psychology Review, 44(2), 224–240. 10.17105/spr-14-0008.1 [DOI] [Google Scholar]
- Pages R, Lukes DJ, Bailey DH, & Duncan GJ (2020). Elusive longer-run impacts of Head Start: Replication within and across cohorts. Educational Evaluation and Policy Analysis, 42(4), 471–492. 10.3102/0162373720948884 [DOI] [Google Scholar]
- Pearman FA, Springer MP, Lipsey M, Lachowicz M, Swain W, & Farran D (2020). Teachers, schools, and pre-K effect persistence: An examination of the sustaining environment hypothesis. Journal of Research on Educational Effectiveness, 13(4), 547–573. 10.1080/19345747.2020.1749740 [DOI] [PMC free article] [PubMed] [Google Scholar]
- Phillips DA, Lipsey MW, Dodge KA, Haskins R, Bassok D, Burchinal MR, Duncan GJ, Dynarski M, Magnuson KA, & Weiland C (2017). Puzzling it out: The current state of scientific knowledge on pre-kindergarten effects: A consensus statement Washington, DC: The Brookings Institution. [Google Scholar]
- Pion GM, & Lipsey MW (in press). Impact of the Tennessee Voluntary Prekindergarten Program on children’s literacy, language, and mathematics skills: Results from a regression-discontinuity design. AERA Open 10.1177/23328584211041353 [DOI] [Google Scholar]
- Preskitt J, Johnson H, Becker D, Ernest J, Fifolt M, Adams J, Strichik T, Ross J, & Sen B (2020). The persistence of reading and math proficiency: The benefits of Alabama’s pre-kindergarten program endure through elementary and middle school. International Journal of Child and Education Policy, 14, 1–12. 10.1186/s40723-020-00073-3 [DOI] [Google Scholar]
- Puma M, Bell S, Cook R, & Heid C (2010). Head Start impact study. Technical report Washington DC: US Department of Health and Human Services, Administration for Children and Families. [Google Scholar]
- Puma M, Bell S, Cook R, Heid C, Broene P, Jenkins D, Mashburn A, & Downer J (2012). Third Grade Follow-up to the Head Start Impact Study Final Report, OPRE Report # 2012–45, Washington, DC: Office of Planning, Research and Evaluation, Administration for Children and Families, U.S. Department of Health and Human Services. [Google Scholar]
- Rosinsky K (2014). The relationship between publicly funded preschool and 4th grade math test scores: A state-level analysis Georgetown University, Washington, DC. https://repository.library.georgetown.edu/handle/10822/709852 [Google Scholar]
- Shannon KA, Scerif G, & Raver CC (2020). Using a multidimensional model of attention to predict low-income preschoolers’ early academic skills across time. Developmental Science, 24(2), 1–16. 10.1111/desc.13025 [DOI] [PubMed] [Google Scholar]
- Sharpe N, Davis B & Howard M (2017). Indispensable policies and practices for high-quality pre-k: Research and pre-k standards review New America Foundation. https://www.newamerica.org/education-policy/policy-papers/indispensable-policies-practices-high-quality-pre-k/ [Google Scholar]
- Snow CE, & Matthews TJ (2016). Reading and language in the early grades. The Future of Children, 26(2), 57–74. https://www.jstor.org/stable/43940581 [Google Scholar]
- Steele A, Karmiloff-Smith A, Cornish K, & Scerif G (2012). The multiple subfunctions of attention: Differential developmental gateways to literacy and numeracy. Child Development, 83(6), 2028–2041. 10.1111/j.1467-8624.2012.01809.x [DOI] [PubMed] [Google Scholar]
- Tennessee Department of Education [TDOE]. (2019). Scope of Services for Voluntary Pre-K 2019–20 https://www.tn.gov/content/dam/tn/education/early-learning/pre-k/prek_scope_of_services.pdf
- Todd RM, Cunningham WA, Anderson AA, & Thompson E (2012). Affect-biased attention as emotion regulation. Trends in Cognitive Sciences, 16(7), 365–372. 10.1016/j.tics.2012.06.003 [DOI] [PubMed] [Google Scholar]
- Troller-Renfree SV, Buzzell GA, & Fox NA (2020). Changes in working memory influence the transition from reactive to proactive cognitive control during childhood. Developmental Science, 23(6), 1–9. 10.1111/desc.12959 [DOI] [PubMed] [Google Scholar]
- Valentino R (2017). Will public pre-k really close achievement gaps? Gaps in prekindergarten quality between students and across states. American Educational Research Journal, 55(1), 79–116. 10.3102/0002831217732000 [DOI] [Google Scholar]
- Vandell DL, Belsky J, Burchinal M, Steinberg L, & Vandergrift N (2010). Do effects of early child care extend to age 15 years? Results from the NICHD study of early childcare and youth development. Child Development, 81(3), 737–56. 10.1111/j.1467-8624.2010.01431.x [DOI] [PMC free article] [PubMed] [Google Scholar]
- Watts T, Duncan GJ, and Rivas M (2019). A reanalysis of impacts of the Tennessee Voluntary Prekindergarten Program (EdWorkingPaper: 19–28). Retrieved from Annenberg Institute at Brown University: 10.26300/mzk4-jk96 [DOI] [Google Scholar]
- Weiland C, Unterman R, Shapiro A, Staszak S, Rochester S, & Martin E (2020). The effects of enrolling in oversubscribed prekindergarten programs through third grade. Child Development 91, 1401–1422. 10.1111/cdev.13308 [DOI] [PubMed] [Google Scholar]
- Wong VC, Cook TD, Barnett WS, & Jung K (2008). An effectiveness-based evaluation of five state pre-kindergarten programs. Journal of Policy Analysis and Management, 27(1), 122–154. 10.1002/pam.20310 [DOI] [Google Scholar]
- Yaple ZA, & Yu R, (2020). Functional and structural brain correlates of socioeconomic status. Cerebral Cortex, 30(1), 181–196. 10.1093/cercor/bhz080 [DOI] [PubMed] [Google Scholar]
Associated Data
This section collects any data citations, data availability statements, or supplementary materials included in this article.