

Abstract
Background: Objectives were to investigate aspects of the COVID-19 epidemics via testing the individuals who were referred to Aramesh Medical Laboratory in Tehran and to integrate the molecular results with epidemiological data since the beginning of the epidemic.
Methods: In this cross-sectional Study 77528 outpatients were referred to Aramesh Medical laboratory by physicians for the diagnosis of SARS-CoV-2 infection between March 2019 and May 2021. Viral acid nucleic extracted from nasal and throat specimens and subsequently amplified using Reverse Transcriptase Real-Time PCR. Laboratory data including Ct values compared with epidemic peaks of COVID-19 countrywide. Statistical Analysis was done by SPSS 21 Software.
Results: 14312 (18.46%) tested positive.36.5% of the positive cases were in the 30 to 39 years old age group. The positive result rate was significantly different based on months, ranging from 6% to 28%, compatible with four recognized epidemic peaks encompassing the end of March through the first week of April (first epidemic peak), from June to July 2020 (second epidemic peak), October until mid of November 2020 (third epidemic wave) followed by the end of April to May 2021 (until the end period of study, in the middle of 4th peak). In 37.8% of cases, the Ct value was between 21 and 28. Two separate trends were seen for Ct ≤ 25 and Ct ≤ 20 for the first and fourth epidemic peaks, respectively. There was an association between the number of total monthly positive results and total deaths in the country, especially with the second to third peaks (in the course of summer 2020) and fourth epidemic peak.
Conclusion: It might be useful to consider laboratory admission rates as an indicator for changes in the epidemic level in the country to continue the SARS-CoV-2 surveillance in accordance with public decision-makers.
Keywords: SARS-Cov-2, Corona Virus Disease 2019 (COVID 19), Cycle threshold (Ct)
↑What is “already known” in this topic:
Different aspects of SARS Cov2 testing have been reported. The relationship between Ct real Time PCR values and the severity of the disease is a matter of interest.
→What this article adds:
The relation of COVID 19 epidemic via testing the individuals was clarified in this article. It might be useful to consider laboratory admission rates as an indicator for changes in the epidemic level in the country to continue the SARS-CoV-2 surveillance in accordance with public decision-makers and prediction of epidemic level. This is the first high-sample result in its format published yet. No such study for interpretation of Ct values in relation to epidemic waves has been done before in Iran.
Introduction
The outbreak of COVID‑19 due to the new coronavirus (SARS‑CoV‑2) began in December 2019 in Wuhan, China, and then spread rapidly crosses the borders of many countries and territories worldwide. Following the global outbreak of COVID‑19, Iran encountered the COVID-19 pandemic as the first country outside of China with rapid new incidence cases and also increases in death rates nationwide (1). The first reported cases in Iran were approved by the Ministry of Health on 19 February 2020. Afterward, daily increased cases were escalated from several provinces around the country. Despite the fact that the employment of infection control measures such as increased testing, travel restraints, social distancing as well as several lockdowns, the numbers of new incidence and death tolls have not decreased with the exception of a short period of time between different national epidemic waves.
According to the World Health Organization (WHO) guidelines, the gold standard method for the diagnosis of new coronavirus is testing of upper respiratory tract specimens by Reverse Real-time reverse-transcriptase Polymerase Chain reaction (RT) PCR as a major modality (2). One of the adjunct advantages of Real-Time PCR includes its potential for semi-quantitative information on targets in clinical specimens. In fact, the cycle threshold value (Ct) stemming from a specimen is principally an indicator of the amplification measurement for the target viral gene to cross a threshold value to assess measurements of viral load (and subsequently its burden) indirectly (3). Understanding the burden of disease in society is crucial to exploit public health policies on restriction, tracing of new cases, etc. Therefore, molecular epidemiology surveys are critical to providing identification of the proportion of the population who have not yet been infected and to design future healthcare plans.
One of the major distinctive of regions with main disease outbreaks is the exponential increase in the number of COVID-19 cases over time. Since the epidemics, by comparing the reported new cases and deaths, Iran has been shown on an exponential trajectory. Upon beginning the epidemic, due to the limited molecular diagnostic facilities in hospitals and due to shortage of kits and consumables across the country, some private laboratories were selected by the Ministry of Health to undertake the tests on outpatients and referrals.
In this investigation, we assessed some features of the COVID-19 outbreak via testing the individuals who were referred to Aramesh Medical Laboratory in Tehran since the early of the epidemic. We analyzed the demographic and epidemiological features of positive cases along with their Ct values at different time points since the beginning of the epidemic. Further, we investigated the results according to national reported cases and deaths.
Methods
Patients and Samples
The current cross-sectional survey was carried out on 77528 outpatients who were suspected of being infected by SARS-Cov-2 and who were referred to Aramesh Medical Laboratory by physicians with different specialties between March 23rd, 2020 and 31st May 2021. Aramesh laboratory is a referral laboratory collaborated with the Research Center for Clinical Virology, affiliated with Tehran University of Medical Sciences, which receives clinical specimens from a broad range of governmental and private sectors, especially for SARS-Cov-2 testing from the beginning of epidemics in 2020. This laboratory was one of the first laboratories in Tehran Metropolitan which was authorized by The Ministry Of Health to undertake SARS-Cov-2 molecular and serological testing. Written informed consent forms were obtained from the adults and the parents of the children. The enrolled subjects included asymptomatic patients or those who were referred for testing due to acute or moderate to severe forms of common respiratory symptoms. Respiratory specimens were taken from individuals by plastic swabs from the nose and throat, then inserted in viral transport medium (VTM) to conserve viral nucleic acids until being tested in the laboratory for molecular analysis on the same basis.
Extraction and RT PCR
Viral nucleic acids were extracted from respiratory specimens using viral RNA/DNA nucleic acid extraction kits (ROJE Diagnostic Kit, Tehran, Iran) according to the manufacturer’s instructions. As a quality control step and before loading the trays, internal controls were added to specimens. After getting 60 µl of eluted DNA, qualitative Reverse Transcriptase Real-Time PCR was carried out on 40 µL of extracted materials using SANSURE Biotech 2019 nCov Kit (China), according to the manufacturer’s recommendations. This kit could amplify RdRp and N genes of SARS-Cov-2 virus. Results of tests are reported as cycle threshold (Ct) values. If a sample was positive for either of or both genes, the test was considered to be positive. A cycle threshold (Ct) value below the detection limit of the assay (< 37) was considered a positive result. Ct values between 37 and 40 were deemed as weakly positive. All the test results statements were based on the same-day reporting system.
Data Collection and Analysis
Demographical and virological information was processed and evaluated by the Research Center for Clinical Virology. All data were analyzed by two independent trained researchers. Extracted molecular data were compared to national Covid-19 epidemic data obtained from the Iranian center for disease control (CDC) and WHO, especially the following time intervals which were considered for the four disease waves as follow; First peak (19 February 2020- 15 May 2020), Second peak; summer 2020 (1 June 2020 - 31 August 2020), Third peak; autumn 2020 (1 September 2020 – 1 January 2021), Fourth peak; Spring 2021 (1 April 2021- June 2021) based on WHO Coronavirus (COVID-19) Dashboard (https://covid19.who.int/region/emro/country/ir).
Statistical Analysis
Statistical analysis was accomplished using the Statistical Package for Social Science (SPSS 21, SPSS Inc., Chicago, Illinois, USA). Normality of the data evaluated using Kolmogorov-Smirnov Test. Data were expressed as percentages for categorical variables and means± standard deviation (SD) for continuous variables. The differences were tested using the Student’s t-test or Mann-Whitney test according to data distribution for numerical values and chi-square for categorical variables. One-way ANOVA was applied for comparison between multiple subgroups. correlation of the variables was determined using Spearman Coefficient. For all comparisons, P-value <0.05 was considered statistically substantial.
Results
We evaluated the results of 77528 consecutive cases referred to Aramesh laboratory in Tehran, Iran, between March 23rd, 2020 and 31,st May 2021 (Table 1). The number of cases ranged from 1000 (May 2020 )to 17367 (April 2021) cases per month, as shown in Table 2 and Figure 1-A. The age of the participants ranged from 3 days to 100 years (mean age: 39.8, SD: 14.42). Mean age was higher in males (40.3, SD: 14.21) compared to females (39.3, SD: 14.67) (p<0.001, results not shown). Of the total subjects, 46385 (59.8%) were between 15 and 40-year-old age group, while only 3.72% were 70 years and older (Table 1 and Figure 1-B). The proportion of male cases ranged from 52% to 60.7%, and was considered different based on month, with an average of 56.1% of the total population (Table 1 and Figure 1-A, p<0.001). The male proportion was also different based on age groups (p<0.001) where the highest proportion (61%) was observed in 40-49 age group (Table 1 and Figure 1-B).
Table 1. Demographical characteristics of total number of subjects as well as positive COVID-19 cases.
| Gender/Age | Total N (%) | Positive N (%) | P-Value |
|---|---|---|---|
| Total | 77528 | 14312 (18.46%) | |
| Male | 43505 (56.1%) | 7853 (54.8%) | <0.001 |
| Female | 33995 (43.9%) | 6459 (45.12%) | |
| ≤15 | 2033 (2.6%) | 330 (2.3%) | <0.001 |
| 15-30 | 17917 (23.1%) | 2587 (18%) | |
| 30-40 | 28468 (36.7%) | 5236 (36.5%) | |
| 40-50 | 13244 (17%) | 2659 (18.57%) | |
| 50-60 | 7912 (10.2%) | 1645 (11.5%) | |
| 60-70 | 4907 (6.3%) | 1119 (7.8%) | |
| 70-80 | 2158 (2.8%) | 549 (3.8%) | |
| ≥80 | 726 (0.93%) | 187 (1.3%) |
Table 2. Distribution of Ct value results among positive cases between March and October 2020 in Aramesh Laboratory, Tehran.
| Month | Number Tested | Positive N (%) | Ct Values; Number of patients (%) | ||||
|---|---|---|---|---|---|---|---|
| ≤20 | 21 to 28 | 29 to 34 | >34 | P-value | |||
| March | 1700 | 325 (19.1%) | 5 (1.53%) | 81 (24.92%) | 72 (22.15%) | 167 (51.3%) | <0.001 |
| April | 1538 | 83 (5.4%) | 2 (2.4%) | 21 (25.3%) | 19 (22.9%) | 41 (49.4%) | |
| May | 1000 | 200 (20%) | 16 (8%) | 39 (19.5%) | 33 (16.5%) | 112 (56%) | |
| June | 3341 | 876 (26.2%) | 83 (9.5%) | 274 (31.3%) | 263 (30%) | 256 (29.2%) | |
| July | 6880 | 1887 (27.4%) | 178 (9.4%) | 648 (34.3%) | 649 (34.4%) | 412 (21.8%) | |
| August | 6522 | 772 (11.8%) | 101 (13.1%) | 313 (40.5%) | 193 (25%) | 165 (21.3%) | |
| September | 6230 | 1170 (18.7%) | 219 (18.7%) | 491 (42%) | 317 (27.1%) | 143 (12.2%) | |
| October | 7062 | 1946(27.5%) | 200 (10.28%) | 874 (44.91%) | 595 (30.58%) | 277 (14.23%) | |
| November | 1163 | 185 (16%) | 14 (7.56%) | 78 (42.16%) | 67 (36.21%) | 26 (14%) | |
| December | 107 | 18 (16.8%) | 1 (5.55%) | 6 (33.33%) | 9 (50%) | 2 (11.11%) | |
| January | 2293 | 123 (5.4%) | 11 (8.94%) | 71 (57.72%) | 37 (30.08%) | 4 (3.25%) | |
| February | 6525 | 35 (0.54%) | 5 (14.28%) | 14 (40.00%) | 14 (40.00%) | 2 (5.71%) | |
| March | 8225 | 1371 (17%) | 315 (22.97%) | 645 (47.04%) | 350 (25.52%) | 61 (4.44%) | |
| April | 17367 | 3575 (20.5%) | 516 (14.43%) | 1827 (51.11%) | 930 (26.01%) | 302 (8.53%) | |
| May | 7547 | 1746(23%) | 186 (10.65%) | 740 (42.38%) | 499 (28.57%) | 321 (18.38%) | |
| Total | 77500 | 14312 (18.46%) | 1852 (12.9%) | 6122 (42.8%) | 4047 (28.2%) | 2291 (16%) | <0.001 |
Figure 1-A.

Figure 1-B.

Altogether, 14312 (18.46%) tested positive for COVID-19. The number of positive cases ranged from 35 (February 2021) to 3575 (April 2021) cases per month (Table 2 and Figure 1-C). Among positive cases, 18% and 19% were males and females, respectively which was associated with a significant difference (Table 1 and Figure 1-D, p<0.001). The age of the positive cases ranged from 3 days to 97 years (mean age: 39.8, SD: 14.42). More than 36.5 % of the positive cases were in 30-39 years old age group, while only 5.1% were 70 years and older which was significantly lower than younger people (Table 1 and Figure 1-D, p<0.001). The mean age of males was higher than females (40.3 and 39.4 respectively, p=0.004, results not shown). Of the total positive cases, 10482 (73.2%) were age categories between 15 and 50, whereas 734 (5.1%) population belonged to ≥70 years old (Table 1 and Figure 1-D).
Figure 1-C.

Figure 1-D.
Demographical characteristics of patients. A) Monthly distribution of total admissions; B) Age distribution between both genders among total admissions; C) Monthly distribution of positive Covid-19 cases, and D) Monthly distribution of age categories between genders among positive cases.

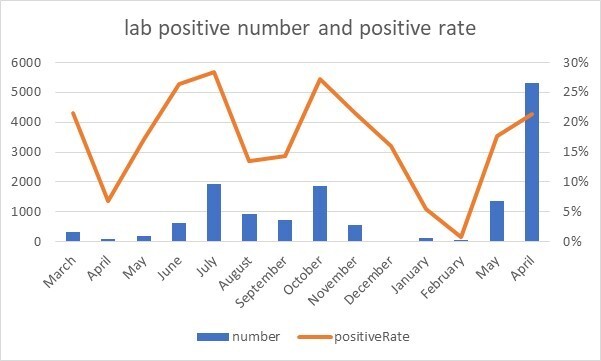
The positive result rate was significantly different based on months (Figure 1-C, p<0.001), ranging from 6% to 28%. It was compatible with different separate national four epidemic peaks; with the highest rates observed at the beginning of the study encompassing the end of March through the first week of April (first epidemic peak), in June-July 2020(second epidemic peak), in October until mid of November 2020 (third epidemic wave) followed by the end of April to May 2021 (until the end period of study, in the middle of 4th peak) (Table 2 and Figure 2).
Figure 2.
The number of monthly positive cases and positive rate in admissions of Aramesh Laboratory, Tehran, between March 2020 and May 2021.
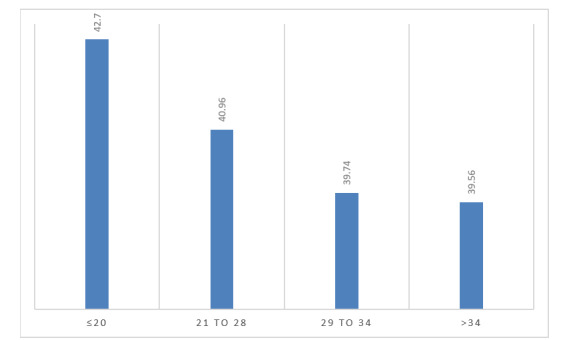
Ct values of positive cases ranged from 15 to 37 (weakly-positive), while in 42.8% of cases, the Ct value was between 21 and 28 (Table 2). The association between Ct values and the gender of patients was not statistically different (p=0.244, results not shown). However, there was a substantial correlation between the age of positive cases and Ct values (p=0.098); the highest Ct values (≤ 20) was prevalent in age groups 37.5 to 42.5 years old (Figure 3).
Figure 3.
Association between different Ct values of positive cases and age category 37-43 years old. Only age categories with significant correlation are shown, so a relative proportion of areas is skewed in favor of these age groups, respectively
Results of ANOVA showed that the means of Ct values were not equal in different months (Figure 4). A trend for variable rates of Ct 21-28 was seen in four periods in accordance with the above-mentioned waves (Table 2 and Figure 4). Altogether, Ct values between 21 and 28 comprised 6122 (42.8%) of total values (Table 2). Also, two separate trends were seen for Ct ≤ 25 and Ct ≤ 20 for the first and fourth epidemic peaks, respectively. Therefore, the highest Ct values (≤ 20) were prevalent throughout the fourth epidemic wave (March-April 2021). On the other hand, Ct ≥34 which indicated weak positive, showed reverse trends in comparison with Ct <20 and Ct 21-28 in the remarked four waves (Table 2 and Figure 4).
Figure 4.
Monthly distribution of CT value results in positive cases between March 2020 and May 2021.

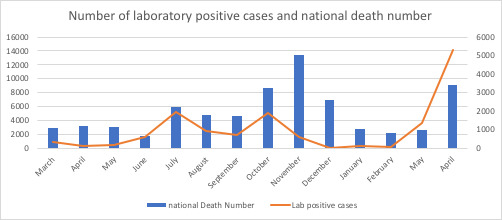
Lastly, there was an association between the number of total monthly positive results and total deaths in the country (p<0.001). The correlation between the national death rate and total monthly positive test results was significantly compatible with the second to third peaks (in the course of summer 2020) and fourth epidemic peak (Figure 5 and Table 2).
Figure 5.
The association between the number of positive tests and Iran’s total COVID-19 deaths between March 2020 and May 2021.
Discussion
We observed an average of 20% positive cases of outpatients. Results from this study were in compliance with results obtained by Pasture Institute, Department of Virology, and also with Virology Reference Laboratories connected to the Iranian Network for Research in Viral Diseases during several epidemic waves across the country (personal communications). Therefore, we believe that the relatively high number of samples in the present study reflects the passive case-finding policy of the country. The positive rate of tests ranged in different studies based on the target population; lower in the general population and higher in hospital-based samples. Similar data have been reported from outpatients from Mexico and Argentina, where COVID-19 incidences were 41% and 34.2%, respectively (4, 5). On the other hand, the positivity rates for SARS-CoV-2 from a different survey from the USA outpatient clinics were between 8.2% in Washington State and 8.4% in Seattle area (6). Both of the above American Latin countries were confronted with high incidence rates, 43% and 65%, respectively, whereas, at the same time, the USA had a lower incidence rate of 7% (7). Similarly, the finding of 21% outpatient positive cases in the present survey complied with a high incidence rate in Iran (8).
The positive rates were changed in age and gender subgroups in different stages of the national epidemic. In general, men were referred more often for laboratory testing than women, although the positive rate was not different in our sample of outpatients. In general, women are more prominently present in similar samples due to their different health-seeking behavior (9). In a study on a laboratory registry from Finland, females tested more frequently than men, yet the positive rate was higher in men (10). Age distribution among individuals showed that 30 to 39 years old composed the highest proportion of positive cases together with the fact that the highest Ct values (≤ 20) were prevalent in age groups 37.5 to 42.5 years old. Similar data obtained from other parts of the world showed that unlike the increased severity of disease among older ages, the incidence rates were higher between young and middle-aged individuals in the societies (5, 6).
Using laboratory data, we found that there were four distinctive epidemic waves that were principally well-matched with national data released by WHO (11). The first epidemic wave started at the end of March and lasted until the 1st week of April 2020 which was typically compatible with the Iranian New Calendar. During this period, due to massive numbers of social contact and significant travel events across the country, the number of new cases increased. Our data showed that both the referrals and positive cases escalated during this time period. The country lockdown was started on 18th April and lasted for 4 weeks. Accordingly, the number of new cases went down for about four consecutive weeks countrywide. Similarly, present laboratory data showed decreases in both referral and population positive cases. Subsequently, upon uplifting the lockdown in early May, the second epidemic wave began at the end of June, and lasted until mid of August 2020. At this time, both referrals and positive cases were raised. Applying extensive social distancing and widespread use of protective measures (especially masks) led to the subside of the second epidemic wave in the mid of summer. However, this subsidence lasted for only two weeks, and then the third wave of the epidemic started about early September 2020, and lasted until January 2021. Lastly, the fourth national epidemic peak began in April 2021 and lasted until the writing of the results of the present survey. During both latter peaks, the number of referrals and positive cases raised accordingly. These findings were in accordance with other observations from other countries which showed a definite correlation between the positivity rates and the different sequential waves of the epidemics (12-15).
One of the findings was the association between daily laboratory admissions and national mortality. Since the beginning of the COVID-19 pandemic, health authorities have aimed at establishing surveillance systems to provide indicators helping them predict the upcoming changes on the pandemic level and preparing the system by redistributing resources accordingly (16). It might be useful to consider laboratory admission rates as an indicator of changes in the epidemic level in the country. The finding of 21% outpatient positive cases was in agreement with observing of 17.9% to 24.4% in-hospital mortality rate among Iranian COVID-19 patients (17-19). We observed a moderate correlation between daily admissions to the laboratory with national deaths. It should be highlighted that changes in case finding policies and case definitions (20) and higher validity of mortality data compared to new cases could have contributed to a stronger correlation. We also observed a moderate correlation between daily admissions to the laboratory with national deaths over the next 14 days, as observed in previous studies (21-23).
Among these outpatient individuals, a trend for Ct ≤ 25 was seen from a period between the middle of June until the end of the study (6th November) with a prominent peak in the whole of September. Moreover, Table 2 clearly showed that the more time elapsed from March to October 2020, the more decrease in Ct values (≤34) was observed. Interestingly, the reverse pattern was seen for weakly positive Ct values (≥34). In the same period, the number of weakly positive cases tended to be decreased. Lastly, about two-thirds (67.3%) of Ct values were recorded between 21 and 34 (of total Ct ranges between 15 and 40). Altogether, Ct values between 21 and 28 comprised 6122 (42.8%) of total values.
Moreover, a trend for variable rates of Ct 21-28 was seen in the four periods in accordance with the above-mentioned waves. Interestingly, the highest Ct values (≤ 20) were prevalent during the fourth epidemic wave (March-April 2021). All of the above phenomena reflect the increase in the invasive nature of epidemics mirrored in the four epidemic waves in the patients studied and also in the nation. This has been highlighted in Figure 5.
Interestingly, Yagci and colleagues observed that the prevalence of Ct value <20 was higher in outpatients than in inpatients (13 vs 31 patients, p<0.01) (24). Clearly, from June 2020 until the end of the study period, a majority of cases increasingly showed lower values, indicating a high potential for infectivity and transmissibility of disease. The benefit of cycle threshold assessment at admission as an indicator of disease severity of SARS-CoV-2, has been suggested as an imprecise measurement of viral load burden. On the contrary, in a report from Italy, where in the three distinguishable periods, the average value of Ct increased from 24.80 in the first epidemic period to 26.64 in the second period, then again increased to 28.50 in the third period (p<0.001) (25).
Despite neither surveys comparing the Ct values with COVID-19 case- definition nor the potential infectivity was included among the aims of studies. However, this finding was in concordance with the fact that all epidemiological reports from Iran indicated high number of new cases and also death rates beginning from May 2020 until the end of May 2021 (at the time of writing up of this report). We observed two separate trends were seen for Ct ≤ 25 and Ct ≤ 20 for the first and the fourth epidemic peaks, respectively. Previous Iranian data indicated that clade B4 was the dominant clade in the country between March 2019 and May 2020, compatible with the first epidemic wave (26).
This clade might have been imported from China at the beginning of the Sars-Cov-2 pandemic. However, in the fourth epidemic peak, our unpublished data based on next-generation sequencing of random sampling indicated that variant Delta which was firstly detected in January 2021, was the dominant isolate in the fourth peak in the country (Najmabadi et al., Unpublished). Literature indicated that higher transmissibility of variants of concern might be correlated to a higher viral load which could be mirrored by semi-quantitative indication by Ct values (27, 28).
There were several limitations in this survey. This study was not based on a laboratory registry database and only contained outpatients referred to a private laboratory. Thus, it does not reflect the complete profile of the Iranian tested patients. Instead, it provides a picture of a less investigated sample of the population who seek medical care in the midst of the COVID-19 pandemic. Also, due to governmental restraint measurement on schools since 2nd April 2020, the children and teenager population (<18 years old) were sub-presented.
Conclusion
In conclusion, the present survey clearly showed the correlations between different countrywide epidemic peaks of COVID-19 and positive results of PCR tests (and the Ct values) among outpatients, bolstering the significance of initial access to testing for populations and execution of public health measures to suspend transmission of SARS-CoV-2 more effectively. However, further studies are needed to correlate observational epidemiological data with the dynamics of infectiousness and viral transmissibility based on Ct data.
Conflict of Interests
The authors declare that they have no competing interests.
Acknowledgments
This study would not have been possible without the sample handling and organizing of the data by Aramesh Medical Laboratory supervisors including Mrs. Ramesh Yaghoobi and Mr. Javid.
Cite this article as : Rezaee Azhar I, Yaghoobi M, Ghalich L, Masoudian Z, Shabanzadeh Pirsaraei A, Yaghoobi P, Hamednaghsheh M, Roshanaie Zadeh AM, Ghafari P, Soltani S, Bozorgmehr S, Shafiei M, Mortazavi SE, Ghaziasadi A, Sharafkhanian B, Akhiani H, Javidnejad J, Nomanpour B, Araeynejad F, Jazayeri SM. Socio-demographical Profile of 7285 SARS-Cov-2 Positive Early Cases; Comparison with National Four Epidemic Waves. Med J Islam Repub Iran. 2022 (9 Nov);36:131. https://doi.org/10.47176/mjiri.36.131
References
- 1.Shakiba M, Nazemipour M, Salari A, Mehrabian F, Nazari SSH, Rezvani SM. et al. Seroprevalence of SARS-CoV-2 in Guilan Province, Iran, April 2020. Emerg Infect Dis. 2021:636. doi: 10.3201/eid2702.201960. [DOI] [PMC free article] [PubMed]
- 2. https://www.who.int/emergencies/diseases/novel-coronavirus-2019 . https://www.who.int/emergencies/diseases/novel-coronavirus-2019
- 3.Rao SN, Manissero D, Steele VR, Pareja J. A Systematic Review of the Clinical Utility of Cycle Threshold Values in the Context of COVID-19. Infect Dis Ther. 2020:573. doi: 10.1007/s40121-020-00324-3. [DOI] [PMC free article] [PubMed]
- 4.Fernandez-Rojas MA, Esparza MAL, Romero AC, Calva-Espinosa DY, Moreno-Camacho JL, Langle-Martinez AP. et al. Epidemiology of COVID-19 in Mexico, symptomatic profiles and presymptomatic people. Int J Infect Dis. 2021 doi: 10.1016/j.ijid.2020.12.086. [DOI] [PMC free article] [PubMed]
- 5.Macchia A, Ferrante D, Battistella G, Mariani J, Gonzalez Bernaldo. COVID-19 among the inhabitants of the slums in the city of Buenos Aires: a population-based study. BMJ Open. 2021:e044592. doi: 10.1136/bmjopen-2020-044592. [DOI] [PMC free article] [PubMed]
- 6.Randhawa AK, Fisher LH, Greninger AL, Li SS, Andriesen J, Corey L. et al. Changes in SARS-CoV-2 Positivity Rate in Outpatients in Seattle and Washington State, March 1-April 16, 2020. JAMA. 2020:2334. doi: 10.1001/jama.2020.8097. [DOI] [PMC free article] [PubMed]
- 7. WHO 2020b. WHO Coronavirus Disease (COVID-19) Dashboard 2020. https://covid19.who.int
- 8. https://www.worldometers.info/coronavirus/country/iran . https://www.worldometers.info/coronavirus/country/iran
- 9.Wong KC, Luscombe GM, Hawke C. Influenza infections in Australia 2009-2015: is there a combined effect of age and sex on susceptibility to virus subtypes. BMC Infect Dis. 2019:42. doi: 10.1186/s12879-019-3681-4. [DOI] [PMC free article] [PubMed]
- 10.Jarva H, Lappalainen M, Luomala O, Jokela P, Jaaskelainen AE, Jaaskelainen AJ. et al. Laboratory-based surveillance of COVID-19 in the Greater Helsinki area, Finland, February-June 2020. Int J Infect Dis. 2020 doi: 10.1016/j.ijid.2020.12.038. [DOI] [PMC free article] [PubMed]
- 11. https://www.worldometers.info/coronavirus/ . https://www.worldometers.info/coronavirus/
- 12.Bouzid D, Mullaert J, Le Hingrat, Laurent O, Duval X, Lescure X. et al. Characteristics associated with COVID-19 or other respiratory viruses' infections at a single-center emergency department. PLoS One. 2020:e0243261. doi: 10.1371/journal.pone.0243261. [DOI] [PMC free article] [PubMed]
- 13.da Silva, Shepherd JG, Williams T, Hughes J, Aranday-Cortes E, Asamaphan P. et al. Genomic epidemiology reveals multiple introductions of SARS-CoV-2 from mainland Europe into Scotland. Nat Microbiol. 2021:112. doi: 10.1038/s41564-020-00838-z. [DOI] [PubMed]
- 14.Glass DH. European and US lockdowns and second waves during the COVID-19 pandemic. Math Biosci. 2020 doi: 10.1016/j.mbs.2020.108472. [DOI] [PMC free article] [PubMed]
- 15.Lampl BMJ, Salzberger B. Changing epidemiology of COVID-19. GMS Hyg Infect Control. 2020 doi: 10.3205/dgkh000362. [DOI] [PMC free article] [PubMed]
- 16.van Goethem, Vilain A, Wyndham-Thomas C, Deblonde J, Bossuyt N, Lernout T. et al. Rapid establishment of a national surveillance of COVID-19 hospitalizations in Belgium. Arch Public Health. 2020:121. doi: 10.1186/s13690-020-00505-z. [DOI] [PMC free article] [PubMed]
- 17.Arman A, Tajik M, Nazemipour M, Ahmadinejad Z, Shahrestanaki SK, Hazrati E. et al. Risk factors of developing critical conditions in Iranian patients with COVID-19. Glob Epidemiol. 2021 doi: 10.1016/j.gloepi.2020.100046. [DOI] [PMC free article] [PubMed]
- 18.Jalili M, Payandemehr P, Saghaei A, Sari HN, Safikhani H, Kolivand P. Characteristics and Mortality of Hospitalized Patients With COVID-19 in Iran: A National Retrospective Cohort Study. Ann Intern Med. 2021:125. doi: 10.7326/M20-2911. [DOI] [PMC free article] [PubMed]
- 19. https://www.who.int/emergencies/diseases/novel-coronavirus-2019/ . https://www.who.int/emergencies/diseases/novel-coronavirus-2019/
- 20.Karanikolos M, McKee M. How comparable is COVID-19 mortality across countries. Eurohealth. 2020:45.
- 21.Chan JFW, Yuan S, Kok KH, To KKW, Chu H, Yang J. et al. A familial cluster of pneumonia associated with the 2019 novel coronavirus indicating person-to-person transmission: a study of a family cluster. Lancet. 2020:514. doi: 10.1016/S0140-6736(20)30154-9. [DOI] [PMC free article] [PubMed]
- 22.Xu XW, Wu XX, Jiang XG, Xu KJ, Ying LJ, Ma CL. et al. Clinical findings in a group of patients infected with the 2019 novel coronavirus (SARS-Cov-2) outside of Wuhan, China: retrospective case series. BMJ. 2020:m606 doi: 10.1136/bmj.m606. [DOI] [PMC free article] [PubMed]
- 23.Epidemiology Working, Chinese Center. [The epidemiological characteristics of an outbreak of 2019 novel coronavirus diseases (COVID-19) in China] Zhonghua Liu Xing Bing Xue Za Zhi. 2020 Feb 10:145. doi: 10.3760/cma.j.issn.0254-6450.2020.02.003. [DOI] [PubMed]
- 24.Karahasan Yagci, Sarinoglu RC, Bilgin H, Yanilmaz O, Sayin E, Deniz G. et al. Relationship of the cycle threshold values of SARS-CoV-2 polymerase chain reaction and total severity score of computerized tomography in patients with COVID 19. Int J Infect Dis. 2020 doi: 10.1016/j.ijid.2020.09.1449. [DOI] [PMC free article] [PubMed]
- 25.Veronesi L, Colucci ME, Pasquarella C, Caruso L, Mohieldin Mahgoub, Zoni R. et al. Virological surveillance of SARS-CoV-2 in an Italian northern area: comparison of Real Time RT PCR cycle threshold (Ct) values in three epidemic periods. Acta Biomed. 2020:19. doi: 10.23750/abm.v91i9-S.10138. [DOI] [PMC free article] [PubMed]
- 26.Fattahi Z, Mohseni M, Jalalvand K, Aghakhani Moghadam, Ghaziasadi A, Keshavarzi F. et al. SARS‐CoV‐2 outbreak in Iran: The dynamics of the epidemic and evidence on two independent introductions. Transbound Emerg Dis. 2021 doi: 10.1111/tbed.14104. [DOI] [PMC free article] [PubMed]
- 27.Singanayagam A, Hakki S, Dunning J, Madon KJ, Crone MA, Koycheva A. et al. Community transmission and viral load kinetics of the SARS-CoV-2 delta (B. 1. 617 doi: 10.1016/S1473-3099(21)00648-4. [DOI] [PMC free article] [PubMed]
- 28.Kissler SM, Fauver JR, Mack C, Tai CG, Breban MI, Watkins AE. et al. Viral Dynamics of SARS-CoV-2 Variants in Vaccinated and Unvaccinated Persons. NEJM. 2021 doi: 10.1056/NEJMc2102507. [DOI] [PMC free article] [PubMed]