

Abstract
Objectives
To explore the impact of various measurements of long‐term health conditions (LTCs) on the resulting prevalence estimates using data from a nationally representative dataset.
Methods
Children and young people in the Millennium Cohort Study were followed at ages 3, 5, 7, 11, and 14 years (N = 15,631). We estimated the weighted prevalence of LTCs at each time point and examined the degree to which estimates agreed with alternate health indicators (special educational needs and disability [SEND], specific chronic conditions, and common chronicity criteria) using descriptive analyses, Cohen's kappa statistic, and percentage agreement.
Results
The estimated weighted prevalence of LTCs peaked at 5 years old (20%). Despite high percentage agreement, we observed at best moderate chance‐corrected agreement between the type of LTC and reasons for SEND (kappas from 0.02 to 0.56, percentage agreement from 97% to 99%) or specified chronic conditions (kappas from 0.002 to 0.02, percentage agreement from 73% to 97%). Applying chronicity criteria decreased the estimated weighted prevalence of LTCs (3%).
Conclusion
How long‐term conditions are defined drastically alters the estimated weighted prevalence of LTCs. Improved clarity and consistency in the definition and measurement of LTCs is urgently needed to underpin policy and commissioning of services.
Keywords: childhood, definitions, long‐term conditions, measurement
1. INTRODUCTION
Estimating the prevalence of long‐term health conditions (LTCs) in children and young people (CYP) is essential for rational health care provision and commissioning, as well as the elaboration of health policies. However, definitions of LTCs are notoriously imprecise (van der Lee et al., 2007), which limits the opportunity to capture valid and reliable prevalence estimates. A quote frequently attributed to Socrates, which states ‘The beginning of wisdom is the definition of terms’, emphasises the importance of accurately describing who we plan to include as having a LTC in our studies.
Obviously, the type and severity of conditions that are included impact prevalence estimates, yet due to the considerable heterogeneity in study definitions, the reported prevalence estimates for longstanding health conditions in children vary widely across studies (0.2%–44%) (van der Lee et al., 2007). Most of the definitions identified in the literature are based on a combination of chronicity criteria, including the duration of symptoms and their consequences in terms of a) functional limitations and b) health care requirements (Addor et al., 1997; Feudtner et al., 2000; McPherson et al., 1998; Perrin et al., 1993; Pless & Douglas, 1971; Pless et al., 2010; Stein, 2011; Stein et al., 1993; Westbom & Kornfält, 1987). These criteria have been acknowledged by Mokkink et al. when reporting their consensus‐based definition of chronic health conditions in childhood (Mokkink et al., 2008). Broader definitions consist of a measure of duration only (Knottnerus et al., 1992; Newacheck & Stoddard, 1994), which also vary between some of the most frequently cited definitions (van der Lee et al., 2007). For example, some studies report a minimum duration of 3 months in order for a condition to be classified as long‐term (Perrin et al., 1993; Pless & Douglas, 1971), while others indicate a minimum duration of 12 months (Stein et al., 1993).
Some studies focussing on the measurement of chronic health conditions in childhood use lists (e.g., the International Classification of Diseases) of specific chronic conditions due to their expected persistence or recurrent nature. Examples include asthma, eczema, hayfever, Attention Deficit Hyperactivity Disorder (ADHD), and Autism Spectrum Disorder (ASD) (Barlow & Ellard, 2006; McAleer et al., 2012; Neff et al., 2002; Newacheck & Stoddard, 1994; Wolraich et al., 2019).
Other studies of LTCs include functional impairment as well as, or instead of a duration criterion (Cadman et al., 1986; Farooqi et al., 2006; Perrin et al., 1993; Stein et al., 2000), which may ultimately have a negative impact at school including increased absenteeism, grade repetition, and lower levels of educational attainment (McKinley Yoder & Cantrell, 2019). Indeed, the presence of a chronic illness may be associated with special education provision (McClanahan & Weismuller, 2015; McKinley Yoder & Cantrell, 2019). The UK describes four major reasons for special educational needs and disability (SEND) provision: problems with cognition and learning, communication and interaction (including ASD), sensory or physical needs, and socio‐emotional or mental health needs (Department of Education, 2020). Given the scarcity of resources, SEND identification or provision for a health‐related reason reflects not only the severity but also the chronicity of a condition and therefore information on the presence of SEND may provide useful data on the prevalence of certain LTCs in childhood in the absence of other direct health data. While consensus and consistency in the field is clearly key, we aimed to illustrate the impact of various measurements of LTCs on the resulting prevalence estimates using data from a large UK‐representative birth cohort study.
2. METHOD
2.1. Participants
The current study analysed data from the Millennium Cohort Study (MCS), a birth cohort of individuals born across England, Scotland, Wales, and Northern Ireland at the start of this millennium. MCS is a multi‐purpose study designed to explore the circumstances, growth, and development of CYP in the UK. The sample was constructed to be representative of the total UK population. In brief, the sample frame was defined as all living children born between September 2000 and 2002, resident in the UK at nine months old, and eligible to receive Child Benefit. At this time, the latter was a universal benefit so covered all children except those whose residency status was uncertain or temporary such as children of asylum seekers and members of foreign armed forces. The sample was drawn from electoral wards across the UK, clustered geographically and disproportionately stratified to over‐represent areas with high proportions of (typically difficult to reach) ethnic minorities in England, residents of wards of increased rates of child poverty across the UK, and residents of Scotland, Wales, and Northern Ireland to ensure that these populations are adequately represented (Plewis et al., 2007). The baseline sample includes families from across the different ethnic groups and the socio‐economic distribution (Connelly & Platt, 2014). Response rate was 96% (at Sweep 1), 81% (at Sweep 2), 79% (at Sweep 3), 72% (at Sweep 4), 69% (at Sweep 5), and 61% (at Sweep 6) (Joshi & Fitzsimons, 2016). In all UK countries, non‐response rates (whether through non‐contact or refusal) in each sweep have been consistently higher for participants in ethnic or disadvantaged areas as compared to families in advantaged areas (Ketende, 2010). It has been shown that attrition bias was more likely than initial response bias (Plewis, 2007) and one suggested solution for researchers is to supplement the survey design weights with attrition weights (Mostafa, 2013). Full details of the study design and data collection are reported elsewhere (Dex & Joshi, 2005; Hansen, 2010; Plewis et al., 2007).
The first data collection phase was carried out between 2001 and 2002 when children were nine months old (Sweep 1). Since then, the cohort follow‐ups occurred at ages 3 (Sweep 2), 5 (Sweep 3), 7 (Sweep 5), 11 (Sweep 6), and 14 years (Sweep 7) (Joshi & Fitzsimons, 2016). Parents/carers provided fully informed written consent for the participation of their child (Shepherd & Gilbert, 2019). Assent was also sought from children themselves from age 7 and onwards. The MCS was approved by the National Health System Research Ethics Committees (Shepherd & Gilbert, 2019). For this work, analysis of the openly available MCS data was undertaken and therefore specific ethics approval was not required. Data were accessed via the UK Data Service (https://ukdataservice.ac.uk/, reference numbers 5350, 5795, 6411, 7464, 8156).
In the present study, we estimated the weighted prevalence of any LTCs in CYP over time and tested agreement between different reports. We used data collected from age 3 (when data on any LTCs was first collected) to age 14.
All participants with complete information on the study variables at the time of assessment were included in analyses; 15,631 children had complete data on any LTCs at age 3 but 25% were lost to follow‐up or had missing follow‐up data by age 14.
2.2. Measures
Data was provided by the main parent/carer, who was the biological mother in 96% of the cases. Information was collected during a face‐to‐face interview conducted by a trained interviewer at participants' homes. There were different variables available across the different study sweeps as illustrated in Table 1 and described below.
TABLE 1.
The weighted prevalence estimates of long‐term health conditions from age 3 to age 14 as assessed in the Millennium Cohort Study
| Age 3 | Age 5 | Age 7 | Age 11 | Age 14 | |
|---|---|---|---|---|---|
| Definition read out by interviewer | Any longstanding conditions that the child has had for at least 3 months or is expected to continue for at least the next 3 months and was diagnosed by a health professional | Any longstanding illness/disability/infirmity that has troubled the child for a period of time or is expected to last for a period of time | Any longstanding illness/disability/infirmity that has troubled the child for a period of time or is expected to last for a period of time | Any physical or mental health conditions/illnesses lasting or expected to last 12 months or more | Any physical or mental health conditions/illnesses lasting or expected to last 12 months or more |
| LTC status (n % yes) | 2454/15,542 (15.8) | 3049/15,523 (19.6) | 2636/13,770 (19.1) | 1870/13,143 (14.2) | 2088/11,689 (17.9) |
Abbreviations: LTC, long‐term condition; n, number.
2.2.1. Any LTCs
Information on the presence of any LTCs (yes/no) was obtained from age 3 to age 14.
2.2.2. Type of LTCs
More detailed data on the type of LTCs were only available at ages 11 and 14. If the parent answered ‘yes’ to whether the child has any LTCs they were then asked ‘Does this (any of these) condition(s) or illness(es) affect [Cohort member's name] in any of the following areas?’. This was a nominal question with an open‐answer element. Response categories were merged with free text‐box answers to derive condition categories. We used the following response categories: sight problems (yes/no), hearing problems (yes/no), ADHD (yes/no), ASD (yes/no), mental illness (yes/no), dyslexia (yes/no), speech/language/communication problems (yes/no). Merging was carried out by the survey agency using the 10th revision of the International Classification of Diseases. Fifty‐one categories were recorded at age 11 and 28 categories were recorded at age 14 (see Supporting Information S1: Appendix A and Appendix B).
2.2.3. SEND status
At ages 7, 11, and 14 the parent answered the question ‘Has [Cohort member's name]'s school or the [local education authority/education board] ever told you [he/she] has [special educational needs/additional support needs]?’ (yes/no).
2.2.4. Reasons for SEND
At age 11 a parent responding ‘yes’ to the question about SEND status was asked ‘What are the reasons for [Cohort child's name]'s special educational/additional support needs?’. This was a nominal question with an open‐answer element. We used the following response categories: sight problems (yes/no), hearing problems (yes/no), ADHD (yes/no), ASD (yes/no), mental illness (yes/no), dyslexia (yes/no), speech/language/communication problems (yes/no). The specific response categories were chosen because the same response categories were available at the same sweep on the question about the type of LTCs and therefore would facilitate within‐sweep comparisons of responses. We included dyslexia, which many would consider to be a learning difficulty rather than a health condition, because we had different reports that allowed a comparison of agreement across more variables. Thirty response categories of the reasons for SEND were recorded at age 11 (see Supporting Information S1: Appendix C).
2.2.5. Specific questions about asthma, eczema, hayfever, ADHD, ASD
Five distinct questions were used at age 14 to assess the prevalence of specific chronic health conditions using the following items: Does [Cohort member's name] have [asthma/eczema/hayfever]? (yes/no), and Has a doctor or health professional ever told you that [Cohort child's name] had [Attention Deficit Hyperactivity Disorder or ADHD/Autism, Asperger's Syndrome or other autistic spectrum]? (yes/no).
2.2.6. Limiting condition and personalised care plan criteria
In CYP at age 14, we were able to assess whether the reported LTCs (see Supporting Information S1: Appendix B) imposed significant limitations in child's daily activities using the question ‘Does this (Do any of these) condition(s) or illness(es) reduce [Cohort member's name]'s ability to carry out day‐to‐day activities?’ (yes/no). Additionally, we measured how many CYP with LTCs at age 14 received a personalised care plan using the question ‘Does [Cohort member's name] have a personalised care plan?’ (yes/no).
2.3. Statistical analysis
We estimated the population prevalence of LTCs by accounting for the MCS survey design and attrition/non‐response sampling weights (Plewis et al., 2007). The level of agreement between the single LTC question with alternate health indicators and two chronicity criteria was explored using descriptive analyses, Cohen's kappa (κ) statistic, and percentage agreement. Cohen's kappa measures report agreement adjusting for chance. The amount of agreement can be classified into almost perfect (κ > 0.80), substantial (κ from 0.61 to 0.80), moderate (κ from 0.41 to 0.60), fair (κ from 0.21 to 0.40), and poor (κ < 0.21) (Landis & Koch, 1977), while a kappa value below 0.60 indicates inadequate agreement (McHugh, 2012). Percentage agreement was tested by dividing the number of agreed reports with the total number of reports.
Differences between CYP who were lost to follow‐up or had missing follow‐up data and CYP retained in the study up to age 14 were tested using chi‐square tests. All analyses were carried out using the Statistical Package for Social Sciences (version 27).
3. RESULTS
Using the single question of any LTCs available across all sweeps, the estimated weighted prevalence of any LTCs in CYP aged 3 years old was 16%, peaked at age 5 (20%) before decreasing at following ages (19% at age 7, 14% at age 11, 18% at age 14; see Table 1 and Figure 1). The estimated weighted prevalence of SEND increased from age 7 (9%) to age 11 (12%) and slightly decreased at age 14 (11%) (see Table 2 and Figure 1); as Table 2 illustrates, not all CYP with SEND also had a LTC and vice versa.
FIGURE 1.
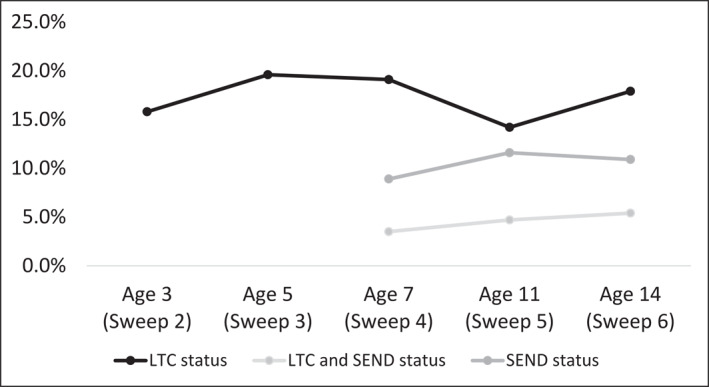
The weighted prevalence estimates of any longstanding health conditions and special educational needs and disability from age 3 to age 14. LTC, long‐term condition; SEND, special educational needs and disability
TABLE 2.
Agreement between reporting of special educational/additional support needs and reporting of long‐term health conditions from age 7 to age 14 in the Millennium Cohort Study
| Age 7 | Age 11 | Age 14 | |
|---|---|---|---|
| LTC status (n % yes) | 2636/13,770 (19.1) | 1870/13,143 (14.2) | 2088/11,689 (17.9) |
| SEND status (n % yes) | 1217/13,746 (8.9) | 1526/13,124 (11.6) | 1272/11,626 (10.9) |
| LTC and SEND (n % yes) | 481/13,770 (3.5) | 622/13,143 (4.7) | 625/11,650 (5.4) |
| SEND without LTC (n % yes) | 733/11,107 (6.6) | 903/11,252 (8.0) | 646/9577 (6.7) |
| LTC without SEND (n % yes) | 2143/12,517 (17.1) | 1241/10,349 (10.7) | 1423/10,354 (13.7) |
Note: Results are weighted.
Abbreviations: LTC, long‐term condition; n, number; SEND, special educational needs and disability.
3.1. Agreement between reports
3.1.1. Agreement between type of LTCs and reasons for SEND
The proportion of reports that agreed ranged from 97% to 99%, but as Table 3 shows, there were low levels of chance‐corrected agreement between reporting of the type of LTCs and the reasons for SEND at age 11. These ranged from no better than chance for dyslexia (κ = 0.02, p‐value < 0.001) to moderate for ADHD or ASD (κ = 0.56, p‐value < 0.001).
TABLE 3.
Agreement between reporting of reasons for special educational/additional support needs and reporting of type of longstanding condition at age 11 in the Millennium Cohort Study
| SEND (n % yes) | LTC (n % yes) | kappa value, p value a | Percent agreement a (%) | |
|---|---|---|---|---|
| Total | 1419/13,317 (10.7) | 1800/13,335 (13.5) | ‐ | ‐ |
| Sight problems | 36/13,317 (0.3) | 126/13,335 (0.9) | κ = 0.32, p < 0.001 | 99 |
| Hearing problems | 51/13,317 (0.4) | 108/13,335 (0.8) | κ = 0.38, p < 0.001 | 99 |
| ADHD, ASD | 368/13,317 (2.8) | 325/13,335 (2.4) | κ = 0.56, p < 0.001 | 98 |
| Mental illness | 10/13,317 (0.1) | 153/13,335 (1.1) | κ = 0.07, p < 0.001 | 99 |
| Speech/language problems, poor communication skills | 197/13,317 (1.5) | 9/13,335 (0.1) | κ = 0.07, p < 0.001 | 99 |
| Dyslexia | 433/13,317 (3.3) | 8/13,335 (0.1) | κ = 0.02, p < 0.001 | 97 |
Note: A selection of comparable conditions*. The categories ‘poor communication skills’ (for both questions) and ‘dyslexia’ (for the type of LTC question) were created after coding open text answers (carried out by the survey agency).
Abbreviations: ADHD, Attention Deficit Hyperactivity Disorder; ASD, Autistic Spectrum Disorders; LTC, long‐term condition; N, number; SEND, special educational need and disability.
N = 13,306.
*See Appendix A and Appendix C in Supporting Information S1 for the full list of SEND and LTC categories at age 11.
3.1.2. Agreement between type of LTCs and specific chronic conditions
Similarly, Table 4 demonstrates poor chance‐corrected agreement between reporting of the type of LTCs and reporting of specified chronic conditions at age 14 (κ values from 0.002 to 0.03, p‐values < 0.001). The proportion of reports that agreed ranged from 73% to 97%. Agreement levels in cases of comorbid conditions were also low (κ values 0.02, p‐values < 0.001).
TABLE 4.
Agreement between reporting of specified conditions using binary questions and reporting of the type of longstanding condition at age 14 in the Millennium Cohort Study
| Binary question (n % yes) | LTC (n % yes) | Kappa value, p value | Percent agreement | |
|---|---|---|---|---|
| Asthma | 1485/11,717 (12.7) | 509/11,720 (4.3) a | κ = 0.03, p < 0.001 | 89% |
| N = 11,716 | N = 11,716 | |||
| Eczema | 1650/11,720 (14.1) | 38/11,720 (0.3) b | κ = 0.002, p < 0.001 | 86% |
| N = 11,719 | N = 11,719 | |||
| Hayfever | 3240/11,708 (27.7) | 41/11,720 (0.3) c | κ = 0.002, p < 0.001 | 73% |
| N = 11,708 | N = 11,708 | |||
| ADHD, ASD | 637/11,722 (5.4) | 447/11,720 (3.6) | κ = 0.03, p < 0.001 | 97% |
| N = 11,715 | N = 11,715 | |||
| Comorbidities d | ||||
| Asthma and eczema | 480/11,716 (4.1) | 5/11,720 (0.1) | κ = 0.02, p < 0.001 | 96% |
| N = 11,715 | N = 11,715 | |||
| Asthma and hayfever | 839/11,704 (7.2) | 11/11,720 (0.1) | κ = 0.02, p < 0.001 | 93% |
| N = 11,704 | N = 11,704 | |||
| Eczema and hayfever | 758/11,707 (6.5) | 6/11,720 (0.1) | κ = 0.02, p < 0.001 | 94% |
| N = 11,707 | N = 11,707 | |||
| Asthma and eczema and hayfever | 331/11,703 (2.8) | 2/11,720 (0.0) | κ = 0.01, p < 0.001 | 97% |
| N = 11,703 | N = 11,703 | |||
Note: A selection of comparable conditions*.
Abbreviations: ADHD, Attention Deficit Hyperactivity Disorder; ASD, Autistic Spectrum Disorders; LTC, long‐term condition; n, number.
Corresponding category is ‘respiratory problems’ or ‘stamina/breathing/fatigue’.
Corresponding category is ‘skin condition’.
Corresponding category is ‘allergy related problems’. The categories ‘respiratory problems’, ‘skin condition’, and ‘allergy related problems’ were created after coding open text answers (carried out by the survey agency).
It was not possible to examine comorbid ADHD and ASD because the type of LTC question had a single category for ADHD or ASD or both and therefore it was not possible to identify the subsample with comorbid ADHD and ASD within the category.
*See Appendix B in Supporting Information S1 for the full list of LTC categories at age 14.
3.1.3. Agreement between LTCs and two chronicity criteria
Among CYP with LTCs at age 14, 63% had a LTC that reduced their ability to carry out day‐to‐day activities, which amounted a weighted estimate of 11% of the whole sample. Also, among CYP with LTCs at age 14, 22% received a personalised care plan, which amounted a weighted estimate of 4% of the total sample. Additionally, among CYP with LTCs at age 14, 18% had a condition that was limiting and also required a personalised care plan, which amounted a weighted estimate of 3% of the population (see Figures 2 and 3).
FIGURE 2.
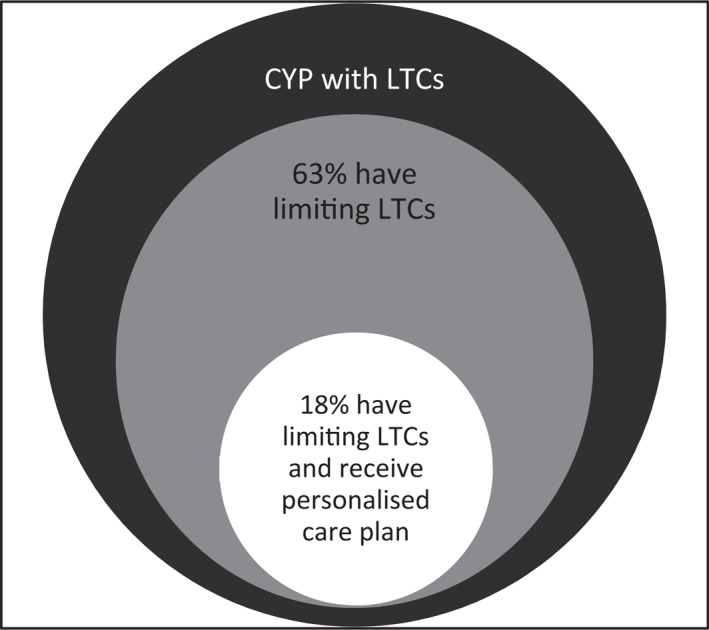
Venn diagram illustrating the subsamples of CYP with estimated weighted prevalence of long‐term conditions who meet the two chronicity criteria in the Millennium Cohort Study. CYP, children and young people; LTC, long‐term condition
FIGURE 3.
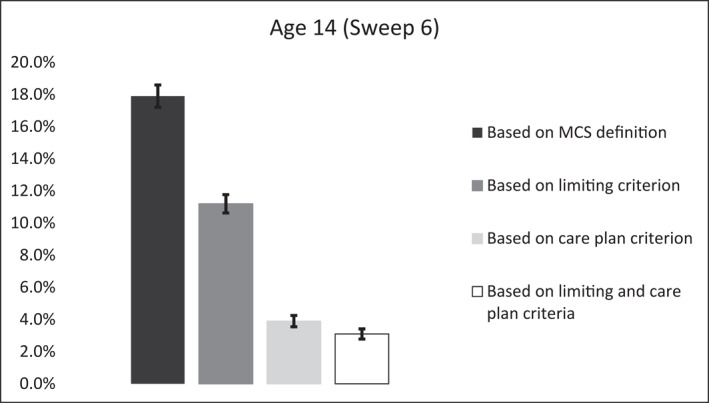
The estimated weighted prevalence of any longstanding health conditions in CYP measured using the two chronicity criteria available in the Millennium Cohort Study. Error bars are 95% confidence intervals of proportions. CYP, children and young people
CYP with LTCs were not more likely to be lost to follow‐up or have missing follow‐up data than those without any LTCs (p‐values ≥ 0.092). Additionally, within the sample who continued to participate in the study from age 3 to age 14, between 98.9% and 99.9% responded to the question about any LTCs.
4. DISCUSSION
Findings from this study revealed that the measurements of LTCs across the sweeps of data collection for the MCS varied, which resulted in significant variation in the estimated prevalence of LTCs. Descriptive statistics suggested that the number of CYP with any LTCs, as measured using the only question available across all sweeps of the MCS, was higher in childhood than in adolescence, in contrast with previous reports (Newacheck & Kim, 2005). While it is well‐established that attrition is higher among participants with poorer health (Wolke et al., 2009), our analyses suggested no evidence of differential dropout. Furthermore, the high (>99%) data completeness for this key variable supports the validity of our results. These findings almost certainly reflect the variation in the definition of LTCs as read out to study participants by the interviewer across the different study sweeps (see Table 1). For example, a smaller minimum duration was applied to classify a condition as being longstanding at age 3 (at least three months) compared to ages 11 and 14 (at least 12 months). This larger duration, which was applied for the first time at age 11, may help explain the lower estimates of LTCs observed in adolescence compared to childhood, but would have implications in terms of service planning for adolescents compared to children. What is more, the LTC is defined as a physical or mental health condition, specifically, only at ages 11 and 14, a distinction that probably sets the term apart from other conditions, such as dyslexia, that may have been reported in earlier sweeps. This inconsistency in the definitions across sweeps limits our ability to obtain comparable prevalence estimates over time and impedes formal, between‐sweep comparisons.
The MCS is an excellent and robust source of data on childhood development, and there were no doubt sound reasons for these changes in wording. This single question of the MCS was used in previous studies examining chronic health conditions in childhood (Boyle et al., 2012; Nikiéma et al., 2010), but future longitudinal studies need to consider the variation in the definition as observed within the current study. Additionally, policy makers, researchers, practitioners, and commissioners urgently need to establish a consensus definition that researchers can apply to data gathered in population samples, which is essential for needs assessment and the monitoring of interventions and access to services. Parents and young patients are critical contributors to this discourse about the important elements of the definition, as well as to the understanding of the terms used. We would further argue that health service contact is a poor indicator of need, as it is dependent on many other variables as well as the health needs of the young person (Ford, 2008). In an ideal world, self‐report information on LTCs should be supplemented with direct measurements of aspects of the person (e.g., height and weight for objective obesity calculations) and healthcare records.
We also observed an increase in the number of CYP with SEND from age 7 to age 11 followed by a decrease at age 14. This finding is in line with previous official school data which indicate that SEND support reaches a peak at age 10, before decreasing as age increases through secondary ages (Department of Education, 2019). Similarly, the number of participants with both LTC and SEND increased with age, which indicates the anticipated overlap between these two conditions; for many children with SEND, their LTC explains their educational needs. SEND was consistently measured across study sweeps in the MCS (from age 7 and onwards), hence may represent a more valid and reliable measure of LTCs in this cohort. However, one should consider that not all CYP with SEND have a chronic health condition since SEND status is not always illness‐related but instead a consequence of cognitive or learning problems (see Supporting Information S1: Appendix C). At the same time, not all CYP with a LTC have SEND. Indeed, SEND requires that the health condition has an impact in school (Black et al., 2019) and therefore this measurement may serve as an indicator of more severe or more pervasive health conditions. Furthermore, some would argue that as academic demands increase, that you would expect more CYP to require additional help at school, and that as argued above, provision does not necessarily equate well to need (Hutchinson, 2021).
We found at best moderate chance‐corrected agreement between reports on the type of LTCs and reasons for SEND at age 11, although kappa statistics may be depressed at the extremes of agreement and could thus underestimate the level of agreement between different reports as percentage agreement often exceeded 97% (Spitznagel & Helzer, 1985). More than 3% of young people at age 11 had SEND status because of dyslexia, in agreement with previous official school data which reported that a substantial number of pupils in the UK receive SEND because of learning difficulties (Department of Education, 2020). In contrast, only 0.1% of participants mentioned dyslexia when asked about the presence of LTCs. While this may relate to the perception that dyslexia is not a health condition, some participants still reported dyslexia when asked about the presence of any physical or mental LTCs. How questions are asked of participants is hugely important and often not sufficiently piloted and tested. Piloting and testing survey questions is a crucial part of the survey design.
We observed low agreement between reports on the type of LTCs and specified chronic conditions at age 14; but importantly, for most of the examined conditions, more participants responded ‘yes’ to the binary disease‐specific question than those who reported having the specific condition in the question about the type of LTC (even though response categories for the type of LTC question were broader e.g., eczema vs. skin disorder). For example, 13% responded ‘yes’ to the question whether the child has asthma whereas only 4% reported having respiratory problems or a condition that affects stamina/breathing/fatigue when asked about the type of LTC the child has. This suggests that specificity on the kinds of conditions included in the prevalence estimates might yield more precise results. Nevertheless, agreement on a single list might be unrealistic so that this greater precision might be achieved at a cost to comparability. A previous nation‐wide study in the UK using electronic healthcare records has estimated an 8% prevalence of asthma in the age group 12 to 17 (Bloom et al., 2019). The binary asthma question used in the current study may have overestimated the prevalence of asthma, as frequently observed in surveys that use self‐reported diagnosis (Anderson et al., 2007; Lai et al., 2009; Mukherjee et al., 2016; Sembajwe et al., 2010; Simpson & Sheikh, 2010; To et al., 2012) while the type of LTC question may have underestimated the rates. A previous Canadian study comparing parental report on different childhood LTCs (asthma, bronchitis, and otitis) and health events (birth weight, accidents, immunisations, hospitalisations, health visits) found otitis and health visits to be the only measures that were underreported by the parent as compared to medical data, with all other measures being overreported (Pless & Pless, 1995). Another study conducted in the UK showed that the annual prevalence of self‐reported asthma diagnosis and treatment was 9.6% versus 5.7% using clinicians' reports on the same condition and treatment (Mukherjee et al., 2016). Asthma, specifically, is an interesting example, because it may vary from mild wheezing during an upper respiratory tract infection or on exercise to life threatening or fatal, and episodes can be daily or less than yearly. The overestimation of the prevalence of a health condition, such as asthma, when using self‐reported information may be related to false interpretation of symptoms (e.g., wheeze due to infection), increased symptom awareness, or augmented readiness to report symptoms (Barraclough et al., 2002). On the other hand, restricting the definition of LTCs to a specific duration (e.g., 12 months as applied at age 14 with the type of LTC question) may exclude recurrent conditions which do not fit this timescale in some informants' minds. Should asthma attacks, resulting in intensive care admissions occurring 13 months apart count? That can still cause severe limitations and require significant support.
Applying two common chronicity criteria (limiting daily activities and having a personalised care plan) resulted in a smaller number of CYP with LTCs, as expected. The larger difference in numbers was observed when we included the personalised care plan as a criterion. Over the last decades, the concept of personalised care planning has been championed in health policy as a means of achieving person‐centred care for patients with LTCs (Coulter et al., 2015). This concept was further endorsed by the government's mandate to NHS England that stated by 2015 ‘Everyone with LTCs, including people with mental health problems, will be offered a personalised care plan that reflects their preferences and agreed decisions’. However, findings from this and previous studies, showed that the implementation has been slow (Kennedy et al., 2014). A health care plan criterion (and not a personalised care plan criterion) might better reflect the presence of a LTC in CYP but such item was not available in the MCS. In addition, the ‘personalised care plan’ is generally a UK‐specific term and therefore may not be consistently applied internationally.
Estimating the prevalence of LTCs in childhood may have substantial implications for research, health care planning and service monitoring, as well as the implementation of health policies. For example, epidemiological data is commonly used to determine the needs of the population; understanding the level of need related to LTCs is an essential starting point to mitigate the associated impact on children's development and to optimise their outcomes. Indeed, to be able to plan for effective health care services, SEND support, and social care, commissioners need to rely on accurate population prevalence data. These data can also be used as an outcome measure when comparing predictors of youth health nationally or internationally and over time. Understanding changes in the prevalence of LTCs among CYP can lead to the development of preventive interventions to reduce disparities in access to services. An agreed terminology will also improve communication between professionals and ensure consistent identification of the patient group which will ultimately improve consistency, continuity, and effectiveness of care across health, education, and social services.
Our study is not without limitations. We have tested only one dataset to illustrate these issues, although we are aware of others with similar methodological considerations (Finning et al. In Submission). Future research should replicate our approach in other data sources. Secondly, the MCS has further data at age 17, which we excluded as LTCs were reported by young people themselves, rather than parents. There is a small literature that indicates poor agreement between informants (Collishaw et al., 2009) and therefore we chose to maintain consistency of informants. However, multi‐informant diagnostic assessments may have provided greater accuracy than a single informant provided that there is a clear process for managing disagreement (Garb, 2005). Within‐sweep comparisons of reporting of health conditions were examined for ages 11 and 14 only, as data were not available to us from earlier sweeps. The measurement of SEND at ages 7, 11, and 14 and the measurement of ADHD and ASD using the two binary questions at age 14 may reflect lifelong prevalence (‘ever had’) and therefore may not be directly comparable with alternate reports included in the study. Data linkage was out of the scope of this study and ethics approval for data linkage was not sought, therefore no efforts were made to link data from this cohort with health record data. Future studies should further explore differences in prevalence estimates by comparing survey data with medical records.
Concluding, this is the first study to explore variation in the measurement of LTCs in childhood within a large, nationally representative dataset. While it is unlikely that there will be a single definition that suits all stakeholders for all purposes, improved clarity about the key dimensions and greater transparency about what is or is not included, and why, for particular purposes is desperately needed. Importantly, future longitudinal studies need to maintain a consistent system for assessing LTCs in order to ensure that prevalence estimates are comparable over time.
CONFLICTS OF INTEREST
The author declares that there is no conflict of interest that could be perceived as prejudicing the impartiality of the research reported.
Supporting information
Supporting Information S1
ACKNOWLEDGMENTS
We thank the Beryl Alexander Charity for funding this study.
Panagi, L. , White, S. R. , Patel, S. , Bennett, S. , Shafran, R. , & Ford, T. (2022). The importance of definitions in the measurement of long‐term health conditions in childhood. Variations in prevalence of long‐term health conditions in the UK using data from the Millennium Cohort Study, 2004–2015. International Journal of Methods in Psychiatric Research, 31(4), e1926. 10.1002/mpr.1926
DATA AVAILABILITY STATEMENT
The data that support the findings of this study are openly available via the UK Data Service at https://ukdataservice.ac.uk/ (reference numbers: 350, 5795, 6411, 7464, 8156).
REFERENCES
- Addor, V. , Santos‐Eggimann, B. , Fawer, C. , Paccaud, F. , & Calame, A. (1997). Enrollment of a population‐based cohort of newborns at higher risk of developing a chronic condition: The EDEN study. Etude du Developpement des Nouveau‐nés study. International Journal of Epidemiology, 26(2), 340–348. 10.1093/ije/26.2.340 [DOI] [PubMed] [Google Scholar]
- Anderson, H. R. , Gupta, R. , Strachan, D. P. , & Limb, E. S. (2007). 50 years of asthma: UK trends from 1955 to 2004. Thorax, 62(1), 85–90. 10.1136/thx.2006.066407 [DOI] [PMC free article] [PubMed] [Google Scholar]
- Barlow, J. H. , & Ellard, D. R. (2006). The psychosocial well‐being of children with chronic disease, their parents and siblings: An overview of the research evidence base. Child: Care, Health and Development, 32(1), 19–31. 10.1111/j.1365-2214.2006.00591.x [DOI] [PubMed] [Google Scholar]
- Barraclough, R. , Devereux, G. , Hendrick, D. , & Stenton, S. (2002). Apparent but not real increase in asthma prevalence during the 1990s. European Respiratory Journal, 20(4), 826–833. 10.1183/09031936.02.00822002 [DOI] [PubMed] [Google Scholar]
- Black, A. , Bessudnov, A. , Liu, Y. , & Norwich, B. (2019). Academisation of schools in England and placements of pupils with special educational needs: An analysis of trends, 2011–2017. Frontiers in Education, 4. 10.3389/feduc.2019.00003 [DOI] [Google Scholar]
- Bloom, C. I. , Saglani, S. , Feary, J. , Jarvis, D. , & Quint, J. K. (2019). Changing prevalence of current asthma and inhaled corticosteroid treatment in the UK: Population‐based cohort 2006–2016. European Respiratory Journal, 53(4), 1802130. 10.1183/13993003.02130-2018 [DOI] [PubMed] [Google Scholar]
- Boyle, E. M. , Poulsen, G. , Field, D. J. , Kurinczuk, J. J. , Wolke, D. , Alfirevic, Z. , & Quigley, M. A. (2012). Effects of gestational age at birth on health outcomes at 3 and 5 years of age: Population based cohort study. BMJ, 344(2), e896. 10.1136/bmj.e896 [DOI] [PMC free article] [PubMed] [Google Scholar]
- Cadman, D. , Boyle, M. H. , Offord, D. R. , Szatmari, P. , Rae‐Grant, N. I. , Crawford, J. , & Byles, J. (1986). Chronic illness and functional limitation in Ontario children: Findings of the Ontario child health study. Canadian Medical Association Journal, 135, 761. [PMC free article] [PubMed] [Google Scholar]
- Collishaw, S. , Goodman, R. , Ford, T. , Rabe‐Hesketh, S. , & Pickles, A. (2009). How far are associations between child, family and community factors and child psychopathology informant‐specific and informant‐general? Journal of Child Psychology and Psychiatry, 50(5), 571–580. 10.1111/j.1469-7610.2008.02026.x [DOI] [PubMed] [Google Scholar]
- Connelly, R. , & Platt, L. (2014). Cohort profile: UK millennium cohort study (MCS). International Journal of Epidemiology, 43(6), 1719–1725. 10.1111/j.1469-7610.2008.02026.x [DOI] [PubMed] [Google Scholar]
- Coulter, A. , Entwistle, V. A. , Eccles, A. , Ryan, S. , Shepperd, S. , & Perera, R. (2015). Personalised care planning for adults with chronic or long‐term health conditions. Cochrane Database of Systematic Reviews. 10.1002/14651858.CD010523.pub2 [DOI] [PMC free article] [PubMed] [Google Scholar]
- Department of Education . (2019). Special educational needs in England. Retrieved from https://assets.publishing.service.gov.uk/government/uploads/system/uploads/attachment_data/file/814244/SEN_2019_Text.docx.pdf
- Department of Education . (2020). Special educational needs and disability: An analysis and summary of data sources. Retrieved from https://www.fenews.co.uk/press‐releases/217‐resources/47072‐special‐educational‐needs‐analysis‐and‐summary‐of‐data‐sources
- Dex, S. , & Joshi, H. (2005). Children of the 21st century: From birth to nine months. Policy Press. [Google Scholar]
- Farooqi, A. , Hägglöf, B. , Sedin, G. , Gothefors, L. , & Serenius, F. (2006). Chronic conditions, functional limitations, and special health care needs in 10‐ to 12‐year‐old children born at 23 to 25 weeks' gestation in the 1990s: A Swedish national prospective follow‐up study. Pediatrics, 118(5), e1466–e1477. 10.1542/peds.2006-1070 [DOI] [PubMed] [Google Scholar]
- Feudtner, C. , Christakis, D. A. , & Connell, F. A. (2000). Pediatric deaths attributable to complex chronic conditions: A population‐based study of Washington State, 1980–1997. Pediatrics, 106(Supplement 1), 205–209. 10.1542/peds.106.s1.205 [DOI] [PubMed] [Google Scholar]
- Ford, T. (2008). Practitioner review: How can epidemiology help us plan and deliver effective child and adolescent mental health services? Journal of Child Psychology and Psychiatry, 49(9), 900–914. 10.1111/j.1469-7610.2008.01927.x [DOI] [PubMed] [Google Scholar]
- Garb, H. N. (2005). Clinical judgment and decision making. Annual Review of Clinical Psychology, 1, 67–89. 10.1146/annurev.clinpsy.1.102803.143810 [DOI] [PubMed] [Google Scholar]
- Hansen, K. (2010). Millennium cohort study first, second, third and fourth surveys: A guide to the datasets. Centre for Longitudinal Studies. University of London. [Google Scholar]
- Hutchinson, J. (2021). Identifying pupils with special educational needs and disabilities. Education Policy Institute. Nuffield Foundation. Retrieved from https://epi.org.uk/wp‐content/uploads/2021/03/SEND‐Indentification_2021‐EPI.pdf [Google Scholar]
- Joshi, H. , & Fitzsimons, E. (2016). The millennium cohort study: The making of a multi‐purpose resource for social science and policy. Longitudinal and Life Course Studies, 7(4), 409–430. 10.14301/llcs.v7i4.410 [DOI] [Google Scholar]
- Kennedy, A. , Rogers, A. , Chew‐Graham, C. , Blakeman, T. , Bowen, R. , Gardner, C. , Lee, V. , Morris, R. , & Protheroe, J. (2014). Implementation of a self‐management support approach (WISE) across a health system: A process evaluation explaining what did and did not work for organisations, clinicians and patients. Implementation Science, 9, 1–16. 10.1186/s13012-014-0129-5 [DOI] [PMC free article] [PubMed] [Google Scholar]
- Ketende, S. C. (2010). Technical report on response. Centre for Longitudinal Studies, University of London. [Google Scholar]
- Knottnerus, J. A. , Metsemakers, J. , Höppener, P. , & Limonard, C. (1992). Chronic illness in the community and the concept of ‘social prevalence’. Family Practice, 9(1), 15–21. 10.1093/fampra/9.1.15 [DOI] [PubMed] [Google Scholar]
- Lai, C. K. , Beasley, R. , Crane, J. , Foliaki, S. , Shah, J. , Weiland, S. , & Group, I. P. T. S. (2009). Global variation in the prevalence and severity of asthma symptoms: Phase three of the International Study of Asthma and Allergies in Childhood (ISAAC). Thorax, 64(6), 476–483. 10.1136/thx.2008.106609 [DOI] [PubMed] [Google Scholar]
- Landis, J. R. , & Koch, G. G. (1977). An application of hierarchical kappa‐type statistics in the assessment of majority agreement among multiple observers. Biometrics, 33(2), 363–374. 10.2307/2529786 [DOI] [PubMed] [Google Scholar]
- McAleer, M. A. , Flohr, C. , & Irvine, A. D. (2012). Management of difficult and severe eczema in childhood. BMJ, 345(2), e4770. 10.1136/bmj.e4770 [DOI] [PubMed] [Google Scholar]
- McClanahan, R. , & Weismuller, P. C. (2015). School nurses and care coordination for children with complex needs: An integrative review. The Journal of School Nursing, 31(1), 34–43. 10.1177/1059840514550484 [DOI] [PubMed] [Google Scholar]
- McHugh, M. L. (2012). Interrater reliability: The kappa statistic. Biochemia Medica (Zagreb), 22, 276–282. 10.11613/bm.2012.031 [DOI] [PMC free article] [PubMed] [Google Scholar]
- McKinley Yoder, C. L. , & Cantrell, M. A. (2019). Childhood disability and educational outcomes: A systematic review. Journal of Pediatric Nursing, 45, 37–50. 10.1016/j.pedn.2019.01.003 [DOI] [PubMed] [Google Scholar]
- McPherson, M. , Arango, P. , Fox, H. , Lauver, C. , McManus, M. , Newacheck, P. W. , Perrin, J. M. , Shonkoff, J. P. , & Strickland, B. (1998). A new definition of children with special health care needs. Pediatrics, 102(1), 137–139. 10.1542/peds.102.1.137 [DOI] [PubMed] [Google Scholar]
- Mokkink, L. B. , van der Lee, J. H. , Grootenhuis, M. A. , Offringa, M. , & Heymans, H. S. (2008). Defining chronic diseases and health conditions in childhood (0–18 years of age): National consensus in The Netherlands. European Journal of Pediatrics, 167(12), 1441–1447. 10.1007/s00431-008-0697-y [DOI] [PubMed] [Google Scholar]
- Mostafa, T. (2013). Technical report on response in the millennium cohort study wave 5. Centre for Longitudinal Studies, University of London. [Google Scholar]
- Mukherjee, M. , Stoddart, A. , Gupta, R. P. , Nwaru, B. I. , Farr, A. , Heaven, M. , Fitzsimmons, D. , Bandyopadhyay, A. , Aftab, C. , Simpson, C. R. , Lyons, R. A. , Fischbacher, C. , Dibben, C. , Shields, M. D. , Phillips, C. J. , Strachan, D. P. , Davies, G. A. , McKinstry, B. , & Sheikh, A. (2016). The epidemiology, healthcare and societal burden and costs of asthma in the UK and its member nations: Analyses of standalone and linked national databases. BMC Medicine, 14, 1–15. 10.1186/s12916-016-0657-8 [DOI] [PMC free article] [PubMed] [Google Scholar]
- Neff, J. M. , Sharp, V. L. , Muldoon, J. , Graham, J. , Popalisky, J. , & Gay, J. C. (2002). Identifying and classifying children with chronic conditions using administrative data with the clinical risk group classification system. Ambulatory Pediatrics, 2(1), 71–79. 10.1367/1539-4409(2002)002<0071:iaccwc>2.0.co;2 [DOI] [PubMed] [Google Scholar]
- Newacheck, P. W. , & Kim, S. E. (2005). A national profile of health care utilization and expenditures for children with special health care needs. Archives of Pediatrics and Adolescent Medicine, 159(1), 10–17. 10.1001/archpedi.159.1.10 [DOI] [PubMed] [Google Scholar]
- Newacheck, P. W. , & Stoddard, J. J. (1994). Prevalence and impact of multiple childhood chronic illnesses. Journal of Pediatrics, 124(1), 40–48. 10.1016/s0022-3476(94)70252-7 [DOI] [PubMed] [Google Scholar]
- Nikiéma, B. , Spencer, N. , & Séguin, L. (2010). Poverty and chronic illness in early childhood: A comparison between the United Kingdom and Quebec. Pediatrics, 125(3), e499–e507. 10.1542/peds.2009-0701 [DOI] [PubMed] [Google Scholar]
- Perrin, E. C. , Newacheck, P. , Pless, I. B. , Drotar, D. , Gortmaker, S. L. , Leventhal, J. , Perrin, J. M. , Stein, R. E. , Walker, D. K. , & Weitzman, M. (1993). Issues involved in the definition and classification of chronic health conditions. Pediatrics, 91(4), 787–793. 10.1542/peds.91.4.787 [DOI] [PubMed] [Google Scholar]
- Pless, C. E. , & Pless, I. B. (1995). How well they remember: The accuracy of parent reports. Archives of Pediatrics and Adolescent Medicine, 149(5), 553–558. 10.1001/archpedi.1995.02170180083016 [DOI] [PubMed] [Google Scholar]
- Pless, I. B. , & Douglas, J. W. (1971). Chronic illness in childhood: Part I. Epidemiological and clinical characteristics. Pediatrics, 47(2), 405–414. 10.1542/peds.47.2.405 [DOI] [PubMed] [Google Scholar]
- Pless, I. , Stein, R. E. , & Walker, D. K. (2010). Research consortium on children with chronic conditions (RCCCC): A vehicle for interdisciplinary collaborative research. Maternal and Child Health Journal, 14(1), 9–19. 10.1007/s10995-009-0484-z [DOI] [PubMed] [Google Scholar]
- Plewis, I. (2007). Non‐response in a birth cohort study: The case of the millennium cohort study. International Journal of Social Research Methodology, 10(5), 325–334. 10.1080/13645570701676955 [DOI] [Google Scholar]
- Plewis, I. , Calderwood, L. , Hawkes, D. , Hughes, G. , & Joshi, H. (2007). Millennium cohort study: Technical report on sampling. Centre for Longitudinal Studies, University of London. [Google Scholar]
- Sembajwe, G. , Cifuentes, M. , Tak, S. , Kriebel, D. , Gore, R. , & Punnett, L. (2010). National income, self‐reported wheezing and asthma diagnosis from the World Health Survey. European Respiratory Journal, 35(2), 279–286. 10.1183/09031936.00027509 [DOI] [PubMed] [Google Scholar]
- Shepherd, P. , & Gilbert, E. (2019). Millennium cohort study: Ethical review and consent. Centre for Longitudinal Studies, University of London. [Google Scholar]
- Simpson, C. R. , & Sheikh, A. (2010). Trends in the epidemiology of asthma in England: A national study of 333, 294 patients. Journal of the Royal Society of Medicine, 103(3), 98–106. 10.1258/jrsm.2009.090348 [DOI] [PMC free article] [PubMed] [Google Scholar]
- Spitznagel, E. L. , & Helzer, J. E. (1985). A proposed solution to the base rate problem in the kappa statistic. Archives of General Psychiatry, 42(7), 725–728. 10.1001/archpsyc.1985.01790300093012 [DOI] [PubMed] [Google Scholar]
- Stein, R. E. (2011). The 1990s: A decade of change in understanding children with ongoing conditions. Archives of Pediatrics and Adolescent Medicine, 165(10), 880–883. 10.1001/archpediatrics.2011.165 [DOI] [PubMed] [Google Scholar]
- Stein, R. E. , Bauman, L. J. , Epstein, S. G. , Gardner, J. D. , & Walker, D. K. (2000). How well does the questionnaire for identifying children with chronic conditions identify individual children who have chronic conditions? Archives of Pediatrics and Adolescent Medicine, 154(5), 447–452. 10.1001/archpedi.154.5.447 [DOI] [PubMed] [Google Scholar]
- Stein, R. E. , Bauman, L. J. , Westbrook, L. E. , Coupey, S. M. , & Ireys, H. T. (1993). Framework for identifying children who have chronic conditions: The case for a new definition. Journal of Pediatrics, 122(3), 342–347. 10.1016/s0022-3476(05)83414-6 [DOI] [PubMed] [Google Scholar]
- To, T. , Stanojevic, S. , Moores, G. , Gershon, A. S. , Bateman, E. D. , Cruz, A. A. , & Boulet, L.‐P. (2012). Global asthma prevalence in adults: Findings from the cross‐sectional world health survey. BMC Public Health, 12(1), 1–8. 10.1186/1471-2458-12-204 [DOI] [PMC free article] [PubMed] [Google Scholar]
- van der Lee, J. H. , Mokkink, L. B. , Grootenhuis, M. A. , Heymans, H. S. , & Offringa, M. (2007). Definitions and measurement of chronic health conditions in childhood: A systematic review. JAMA, 297(24), 2741–2751. 10.1001/jama.297.24.2741 [DOI] [PubMed] [Google Scholar]
- Westbom, L. , & Kornfält, R. (1987). Chronic illness among children in a total population: An epidemiological study in a Swedish primary health care district. Scandinavian Journal of Social Medicine, 15(2), 87–97. 10.1177/140349488701500206 [DOI] [PubMed] [Google Scholar]
- Wolke, D. , Waylen, A. , Samara, M. , Steer, C. , Goodman, R. , Ford, T. , & Lamberts, K. (2009). Selective drop‐out in longitudinal studies and non‐biased prediction of behaviour disorders. The British Journal of Psychiatry, 195(3), 249–256. 10.1192/bjp.bp.108.053751 [DOI] [PMC free article] [PubMed] [Google Scholar]
- Wolraich, M. L. , Chan, E. , Froehlich, T. , Lynch, R. L. , Bax, A. , Redwine, S. T. , Ihyembe, D. , & Hagan, J. F., Jr. (2019). ADHD diagnosis and treatment guidelines: A historical perspective. Pediatrics, 144(4), e20191682. 10.1542/peds.2019-1682 [DOI] [PubMed] [Google Scholar]
Associated Data
This section collects any data citations, data availability statements, or supplementary materials included in this article.
Supplementary Materials
Supporting Information S1
Data Availability Statement
The data that support the findings of this study are openly available via the UK Data Service at https://ukdataservice.ac.uk/ (reference numbers: 350, 5795, 6411, 7464, 8156).