Abstract
Background:
The treatment of ankle osteoarthritis (OA) varies depending on the severity and distribution of the associated joint degeneration. Disease staging is typically based on subjective grading of appearance on conventional plain radiographs, with reported subpar reproducibility and reliability. The purpose of this study was to develop and describe computational methods to objectively quantify radiographic changes associated with ankle OA apparent on low-dose weightbearing CT (WBCT).
Methods:
Two patients with ankle OA and 1 healthy control who had all undergone WBCT of the foot and ankle were analyzed. The severity of OA in the ankle of each patient was scored using the Kellgren-Lawrence (KL) classification using plain radiographs. For each ankle, a volume of interest (VOI) was centered on the tibiotalar joint. Initial computation analysis used WBCT image intensity (Hounsfield units [HU]) profiles along lines perpendicular to the subchondral bone/cartilage interface of the distal tibia extending across the entire VOI. Graphical plots of the HU distributions were generated and recorded for each line. These plots were then used to calculate the joint space width (JSW) and HU contrast.
Results:
The average JSW was 3.89 mm for the control ankle, 3.06 mm for mild arthritis (KL 2), and 1.57 mm for severe arthritis (KL 4). The average HU contrast was 72.31 for control, 62.69 for mild arthritis, and 33.98 for severe arthritis. The use of 4 projections at different locations throughout the joint allowed us to visualize specifically which quadrants have reduced joint space width and contrast.
Conclusion:
In this technique report, we describe a novel methodology for objective quantitative assessment of OA using JSW and HU contrast.
Clinical Relevance:
Objective, software-based measurements are generally more reliable than subjective qualitative evaluations. This method may offer a starting point for the development of a more robust OA classification system or deeper understanding of the pathogenesis and response to ankle OA treatment.
Keywords: osteoarthritis, arthritis, ankle, Kellgren-Lawrence, joint space width, weightbearing CT, software-based, classification
Introduction
Osteoarthritis (OA) is the most common joint disease and a cause of significant disability and reduced quality of life. Primary OA commonly affects the hand, spine, hip, and knee joints, whereas ankle OA is more often secondary to ankle fracture or trauma. 2 Notably, grading of OA plays an important role in determining the treatment plan, which ranges from anti-inflammatory medications and bracing to ankle arthrodesis or replacement. Thus, there is a need for a reliable and reproducible method to measure and classify the severity of OA.
Kellgren and Lawrence described the radiographic features of knee OA apparent on plain 2D radiographs in 1957 and integrated them into an OA classification system (typically referred to as the KL grade) that is still the most commonly used staging system in both clinical and research environments. 7 KL grading involves subjectively evaluating the presence and significance of osteophytes, bony sclerosis, joint space narrowing, and deformity of the bone ends. Although Kellgren and Lawrence did not originally describe a classification scheme for the ankle joint, Holzer et al 6 describe a modified version specifically for the ankle, including more specific criteria (eg, osteophytes on the medial malleolus) and a measurement of tibiotalar tilt. Although the KL grade and other similar OA classification schemes are used widely in clinical practice, their reliability and degrees of inter- and intraobserver agreement are generally fair or poor because of their subjective nature.3,8
Weightbearing CT (WBCT) is a relatively new technology that allows for low-dose radiographic imaging of the foot and ankle while they are subjected to a functional load.1,4,5,9 WBCT offers significant clinical advantages when compared to conventional weightbearing radiographs and unloaded supine ankle CT in that it provides a 3D snapshot of the loaded ankle joint. This advantage is especially crucial in the setting of OA, where thinning of the ankle cartilage, softening of the cartilage, and other deformities become more apparent under load. WBCT also provides a better geometric representation of the ankle and allows for more accurate measurements when compared to a conventional radiograph. 9 To our knowledge, only 1 study has been published on the use of WBCT to assess joint space narrowing to monitor posttraumatic OA. 11 The purpose of our study was to develop and describe computational methods to objectively quantify additional radiographic changes associated with ankle OA apparent on low-dose WBCT images. Our primary measure was joint space width (JSW), which has been used previously in the ankle joint. 11 Our secondary measure was Hounsfield unit (HU) contrast, a measure of the ability to distinguish between differences in image intensity. 10 We present this as a novel method with the goal of detecting subtle changes in the subchondral bone or joint cartilage.
Methods
Participants
This descriptive case-control report was approved by the institutional review board at our institution. Two patients with clinical and radiographic diagnosis of ankle OA and 1 healthy control that underwent WBCT of the foot and ankle for assessment of a forefoot pathology were selected. None of the patients had a history of ankle pain or injuries. Severity of ankle OA was evaluated using the KL grading system 6 by consensus by 2 fellowship-trained foot and ankle surgeons, each with >10 years of postfellowship experience. This assigned KL grade was confirmed by a radiologist currently in musculoskeletal fellowship training. Patients whose ankles had substantially different KL grades (one KL grade 2, the other KL grade 4) were selected for this study, to provide an initial demonstration of the computational analysis capabilities across a range of OA severity.
Imaging
Patients had previously been imaged using a cone-beam WBCT scanner (PedCAT, CurveBeam LLC, Warrington, PA). Images were acquired with patients standing with full weightbearing bilaterally with kVp = 120 and mA = 5. Images were reconstructed into 533 slices using 0.37-mm voxels with the reconstruction software provided with the scanner.
Image Analysis
WBCT image reconstructions were opened within the CubeVue software (CurveBeam LLC), which presents the 3D data set in sagittal, coronal, and axial multiplanar reconstruction (MPR) views. Coronal and sagittal planes were adjusted such that they were positioned at the midpoint of the anteroposterior and mediolateral length of respectively the distal tibial articular surface and talar dome. Then the axial plane was positioned parallel to the distal tibial articular surface (Figure 1A). For a more precise positioning at the center of the tibiotalar joint space, a distance measurement tool was used to mark the anterior and posterior edges of the articular surface of the distal tibia in the sagittal view. The coronal plane was selected as the midpoint between the two (Figure 1B). In the coronal plane, a distance measurement tool was used to mark the medial and lateral edges of the talar dome, and the sagittal plane was selected as the midpoint between the two (Figure 1A). If necessary, minor adjustments were then made in the sagittal plane to finalize the coronal plane placement. Finally, the axial plane was adjusted such that it was at roughly the midpoint of the tibiotalar joint space, as visualized in the sagittal plane (Figure 1A, B). For ankles with complete joint space narrowing, the axial plane was adjusted to approximately the point of contact between the distal tibia and the talar dome.
Figure 1.
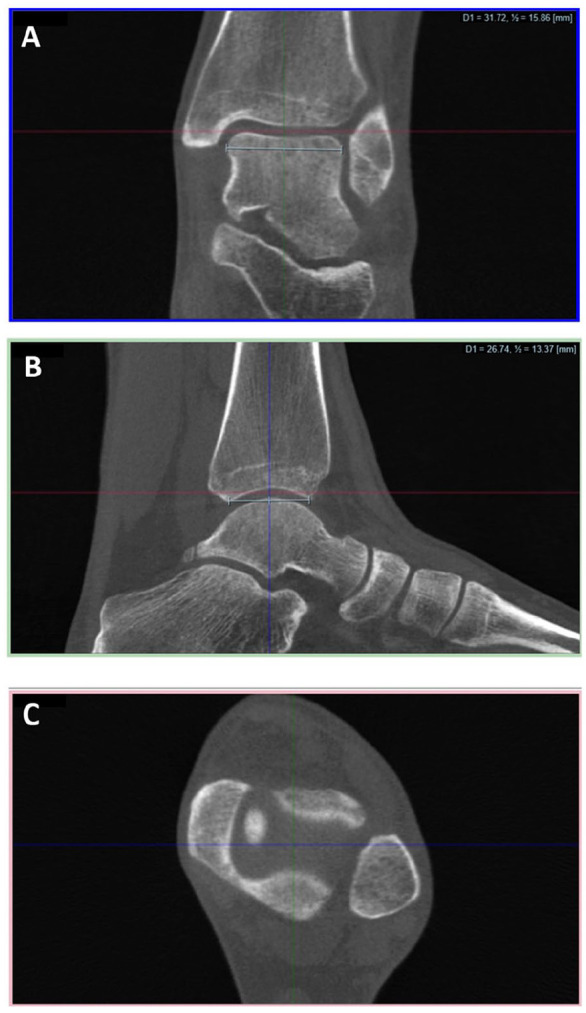
(A) Crosshair placement in the coronal view using the distance measurement tool. This view is used to align the axial plane (red line) to the articular surface of the distal tibia using the rotate tool, and to place the sagittal plane (green line). (B) Crosshair placement in the sagittal view using the distance measurement tool. This view is used to place the coronal plane (blue line). (C) Crosshair placement in the axial view. This view is not used for crosshair placement but can be used to confirm that the axial plane is within the joint space.
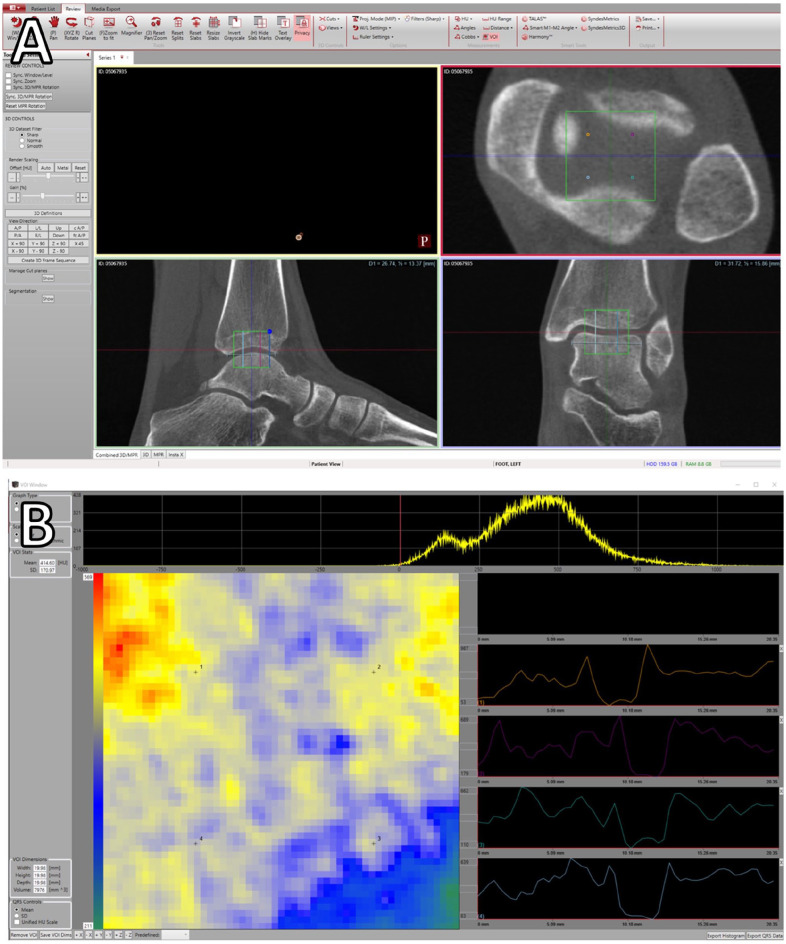
After the center of the tibiotalar joint space was identified, the volume of interest (VOI) tool was utilized. This tool automatically places a predefined VOI to analyze the distribution of voxel intensities within the entire selected volume. Selection of the tool places the VOI at the center of the MPR cross-section (Figure 2A), previously positioned at the center of the ankle joint, opening a second window within the software that shows the user a heatmap representation of the mean intensity of the voxels in the axial plane (Figure 2B). Within this VOI, the software automatically generates 4 linear projections perpendicular to the axial plane and crossing the entire joint space. These projections are used to query the image intensity in 4 specific regions of the joint, and graphical plots are generated and displayed on the screen (Figure 2B).
Figure 2.
(A) CubeVue window showing the volume of interest (VOI; green square) centered at the tibiotalar joint space, and the 4 selected projections (orange, magenta, cyan, and blue lines) for the control. (B) Second CubeVue window demonstrating the VOI tool interface. Left: a heatmap of mean intensity within the axial plane; right: Hounsfield unit plots perpendicular to the axial plane for the 4 selected projections; top: histogram of the voxels in the VOI (top).
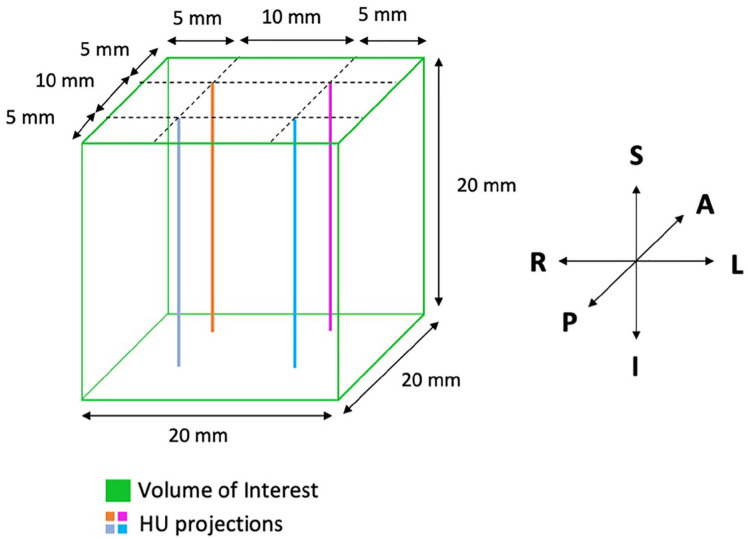
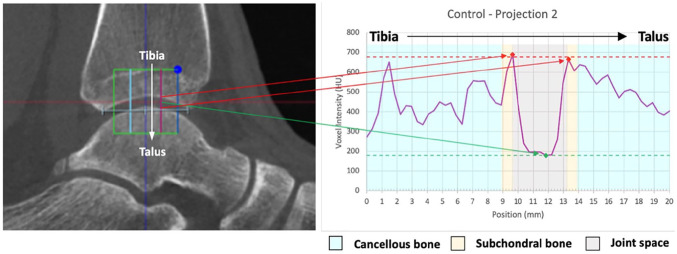
The VOI was predefined to be 20 × 20 × 20 mm, with the center of the cube positioned at the center of the tibiotalar joint space as described previously. Within the cube, 4 points and resultant linear projections perpendicular to the axial plane were preselected precisely at the center of each of the 4 quadrants. Each projection was 5 mm from the 2 closest cube edges, and 10 mm from each other projection (Figure 3). The points and respective projections served as representations of the HU distribution in the anteromedial, anterolateral, posteromedial, and posterolateral aspects of the ankle joint. Each line collected image intensity data across the transition of distal tibial cancellous and subchondral bone, the joint space, and talar subchondral and cancellous bone, in that order (Figure 4). The intensity profiles were recorded, and graphical plots of the HU distributions were generated for each line (Figures 5-7). These plots were used to calculate the JSW and HU contrast.
Figure 3.
3D representation of the volume of interest (green) and Hounsfield unit projections (orange, magenta, cyan, and blue). Superior-inferior, anterior-posterior, and left-right directions are indicated by the arrows.
Figure 4.
Graphic showing an example of an intensity projection through the tibiotalar joint. The projection samples the voxel intensity through the tibial cancellous bone, tibial subchondral bone, the joint space, talar subchondral bone, and talar cancellous bone, in that order.
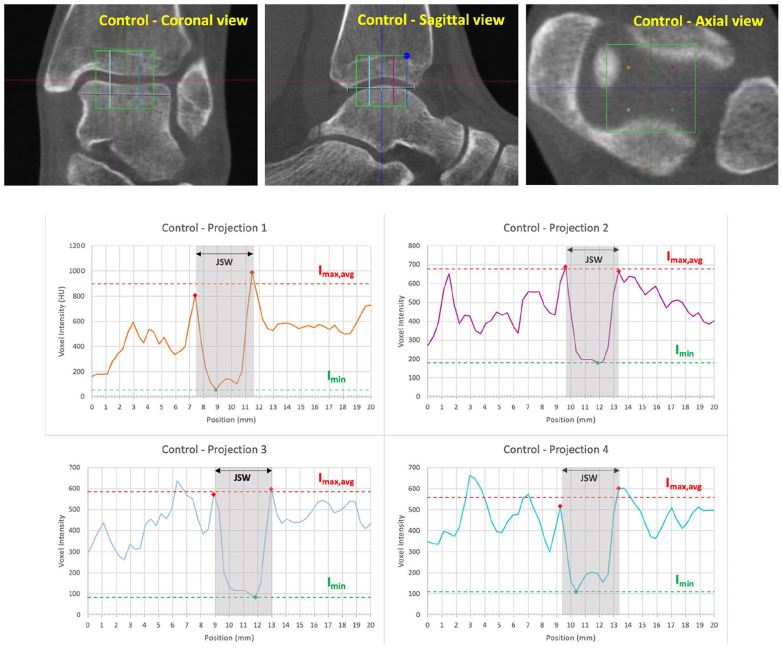
Figure 5.
Control ankle computed tomographic (CT) images in the coronal, sagittal, and axial views, and graphical plots for all 4 projections. JSW, Imax,avg, and Imin are shown on each plot. Colors of the plots correspond to the color of the projection in the CT images.
Figure 6.
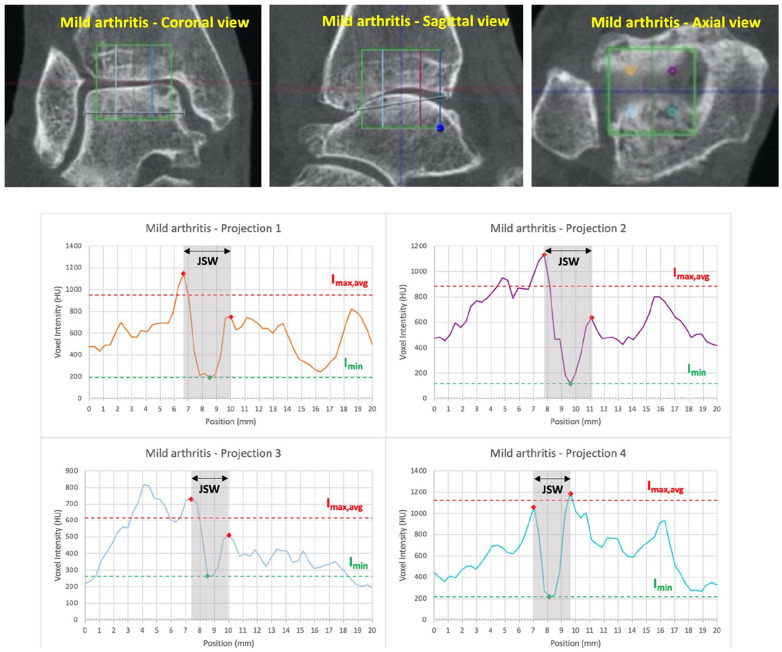
Mildly arthritic ankle computed tomographic (CT) images in the coronal, sagittal, and axial views, and graphical plots for all 4 projections. JSW, Imax,avg, and Imin are shown on each plot. Colors of the plots correspond to the color of the projection in the CT images. Note that all projections demonstrate joint space width narrowing and that projection 3 shows reduced contrast (Imax,avg, and Imin are closer together).
Figure 7.
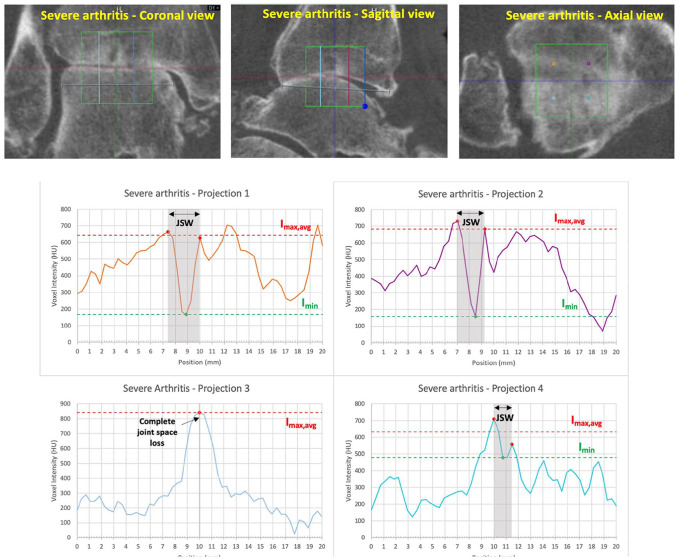
Severely arthritic ankle computed tomographic (CT) images in the coronal, sagittal, and axial views, and graphical plots for all 4 projections. JSW, Imax,avg, and Imin are shown on each plot where applicable. Colors of the plots correspond to the color of the projection in the CT images. Note that projections 1, 2, and 4 demonstrate joint space width narrowing and that projection 3 shows complete joint space loss. Projection 4 also shows significant reduction in contrast (Imax,avg, and Imin are closer together).
Calculations
For each line inside the VOI and respective HU projection, the JSW and HU contrast were calculated as follows: first, the intensity values representing the subchondral bone on the tibia ( ) and on the talus ( ) were manually selected as the 2 maximum points on either side of the joint space (red marks, Figures 5–7). Then, the minimum value (Imin) within the joint space was selected (green marks, Figures 5–7). The joint space width was calculated as the difference in position between the 2 selected maximum points. The joint contrast, a measure of the ability to differentiate between differences in image intensity, was calculated as where is the average of and The values were compared between the 3 ankles to evaluate differences across different stages of OA.
Results
The average JSW was 3.89 mm for the healthy control ankle, 2.69 mm for the mildly arthritic ankle (KL 2), and 1.57 mm for the severely arthritic ankle (KL 4). The average HU contrast was 72.31 for the healthy control ankle, 62.69 for the mildly arthritic ankle, and 33.98 for the severely arthritic ankle. Complete calculations of JSW and HU contrast for each line/projection for all 3 ankles are shown in Table 1. Of note, one projection in the severely arthritic ankle had JSW and contrast values of 0 because of complete joint space loss along projection 4, which corresponds in this case to the posterolateral part of the joint.
Table 1.
Joint Space Width and Contrast Measurements, for Each Intensity Projection, for Each Ankle.
| Ankle | Calculation | Projection 1 | Projection 2 | Projection 3 | Projection 4 | Average |
|---|---|---|---|---|---|---|
| Control | JSW (mm) | 4.07 | 3.70 | 3.70 | 4.07 | 3.89 |
| Contrast | 88.84 | 58.18 | 75.17 | 67.07 | 72.31 | |
| Mild Arthritis (KL 2) |
JSW (mm) | 2.96 | 3.33 | 2.59 | 1.85 | 2.69 |
| Contrast | 66.37 | 76.61 | 67.75 | 38.41 | 62.29 | |
| Severe Arthritis (KL 4) |
JSW (mm) | 2.59 | 2.22 | 1.48 | 0 | 1.57 |
| Contrast | 58.82 | 63.26 | 13.85 | 0 | 33.98 |
Abbreviation: JSW, joint space width.
Discussion
In this descriptive report, we present a novel computational methodology to quantify OA using WBCT images. The proposed method is simple and can easily be incorporated in the workflow for OA staging if the appropriate tools (ie, WBCT and analysis software) are available. The quantitative measurements and objective point selection within each joint should in theory improve the reliability and reproducibility of OA grading when compared to subjective classification systems previously described in the literature. Quantitative metrics allow for straightforward comparison between patients and when analyzing the progression of joint degeneration in a single patient over time.
The initial analysis of this method is limited by a very small sample of patients and OA severities. Assessment may be more challenging when radiologic findings such as osteophytes, cysts, and severe subchondral sclerosis are present inside the selected HU dispersion. It is currently unclear how these factors will affect the results obtained by this method. Furthermore, assessment of the full joint is limited to 4 linear samples. Although these 4 projections may sufficiently sample the joint to capture any focal narrowing, peripheral changes in joint space width may not be adequately captured by the projection placement. This will need to be further assessed in subsequent studies. Finally, although the method aligns the axial plane with the distal articular surface of the tibia, the curve in the tibiotalar joint prevents this method from making a true perpendicular measurement of JSW across the entire joint surface. True 3D mesh algorithms would need to be implemented to more precisely evaluate the shortest distances between the subchondral bones of 2 opposing articular surfaces.
Conclusion
We describe a novel computational assessment of ankle osteoarthritis using low dose WBCT imaging. Although the small sample size limits the current study to a simple technique introduction, the methodology may represent an important step toward a more reliable OA assessment. Additional studies are needed to more rigorously assess the algorithm over a variety of radiographic presentations, to compare this methodology to the commonly used visual classification systems, and to eventually correlate the quantitative measurements to clinical outcomes.
Footnotes
Ethics Approval: University Ethics Committee approved this research under the number 202012422 in accordance with the Declaration of Helsinki.
Declaration of Conflicting Interests: The author(s) declared no potential conflicts of interest with respect to the research, authorship, and/or publication of this article. ICMJE forms for all authors are available online.
Funding: The author(s) received no financial support for the research, authorship, and/or publication of this article.
ORCID iDs: Tutku E. Tazegul, BBME,  https://orcid.org/0000-0002-3802-3422
Donald D. Anderson, PhD,  https://orcid.org/0000-0002-1640-6107
Nacime S. Barbachan Mansur, MD, PhD,  https://orcid.org/0000-0003-1067-727X
Christian VandeLune, BS,  https://orcid.org/0000-0002-7797-6111
Cesar de Cesar Netto, MD, PhD,  https://orcid.org/0000-0001-6037-0685
References
- 1. Barg A, Bailey T, Richter M, et al. Weightbearing computed tomography of the foot and ankle: emerging technology topical review. Foot Ankle Int. 2018;39(3):376-386. doi: 10.1177/1071100717740330 [DOI] [PubMed] [Google Scholar]
- 2. Buckwalter JA, Martin JA. Osteoarthritis. Adv Drug Deliv Rev. 2006;58(2):150-167. doi: 10.1016/j.addr.2006.01.006 [DOI] [PubMed] [Google Scholar]
- 3. Claessen FM, Meijer DT, van den Bekerom MP, et al. Reliability of classification for post-traumatic ankle osteoarthritis. Knee Surg Sports Traumatol Arthrosc. 2016;24(4):1332-1337. doi: 10.1007/s00167-015-3871-6 [DOI] [PMC free article] [PubMed] [Google Scholar]
- 4. Godoy-Santos AL, Bernasconi A, Bordalo-Rodrigues M, Lintz F, Lôbo CFT, Netto CC. Weight-bearing cone-beam computed tomography in the foot and ankle specialty: where we are and where we are going—an update. Radiol Bras. 2021;54(3):177-184. doi: 10.1590/0100-3984.2020.0048 [DOI] [PMC free article] [PubMed] [Google Scholar]
- 5. Godoy-Santos AL, Cesar CN. Weight-bearing computed tomography of the foot and ankle: an update and future directions. Acta Ortop Bras. 2018;26(2):135-139. doi: 10.1590/1413-785220182602188482 [DOI] [PMC free article] [PubMed] [Google Scholar]
- 6. Holzer N, Salvo D, Marijnissen AC, et al. Radiographic evaluation of posttraumatic osteoarthritis of the ankle: the Kellgren-Lawrence scale is reliable and correlates with clinical symptoms. Osteoarthritis Cartilage. 2015;23(3):363-369. doi: 10.1016/j.joca.2014.11.010 [DOI] [PubMed] [Google Scholar]
- 7. Kellgren JH, Lawrence JS. Radiological assessment of osteo-arthrosis. Ann Rheum Dis. 1957;16(4):494-502. doi: 10.1136/ard.16.4.494 [DOI] [PMC free article] [PubMed] [Google Scholar]
- 8. Kohn MD, Sassoon AA, Fernando ND. Classifications in brief: Kellgren-Lawrence classification of osteoarthritis. Clin Orthop Relat Res. 2016;474(8):1886-1893. doi: 10.1007/s11999-016-4732-4 [DOI] [PMC free article] [PubMed] [Google Scholar]
- 9. Lintz F, de Cesar Netto C, Barg A, Burssens A, Richter M. Weight-bearing cone beam CT scans in the foot and ankle. EFORT Open Rev. 2018;3(5):278-286. doi: 10.1302/2058-5241.3.170066 [DOI] [PMC free article] [PubMed] [Google Scholar]
- 10. Niknejad M, Bell D. Contrast resolution. 2022. Radiopaedia.org; 2013. [Google Scholar]
- 11. Willey MC, Compton JT, Marsh JL, et al. Weight-bearing CT scan after tibial pilon fracture demonstrates significant early joint-space narrowing. J Bone Joint Surg Am. 2020;102(9):796-803. doi: 10.2106/jbjs.19.00816 [DOI] [PubMed] [Google Scholar]


