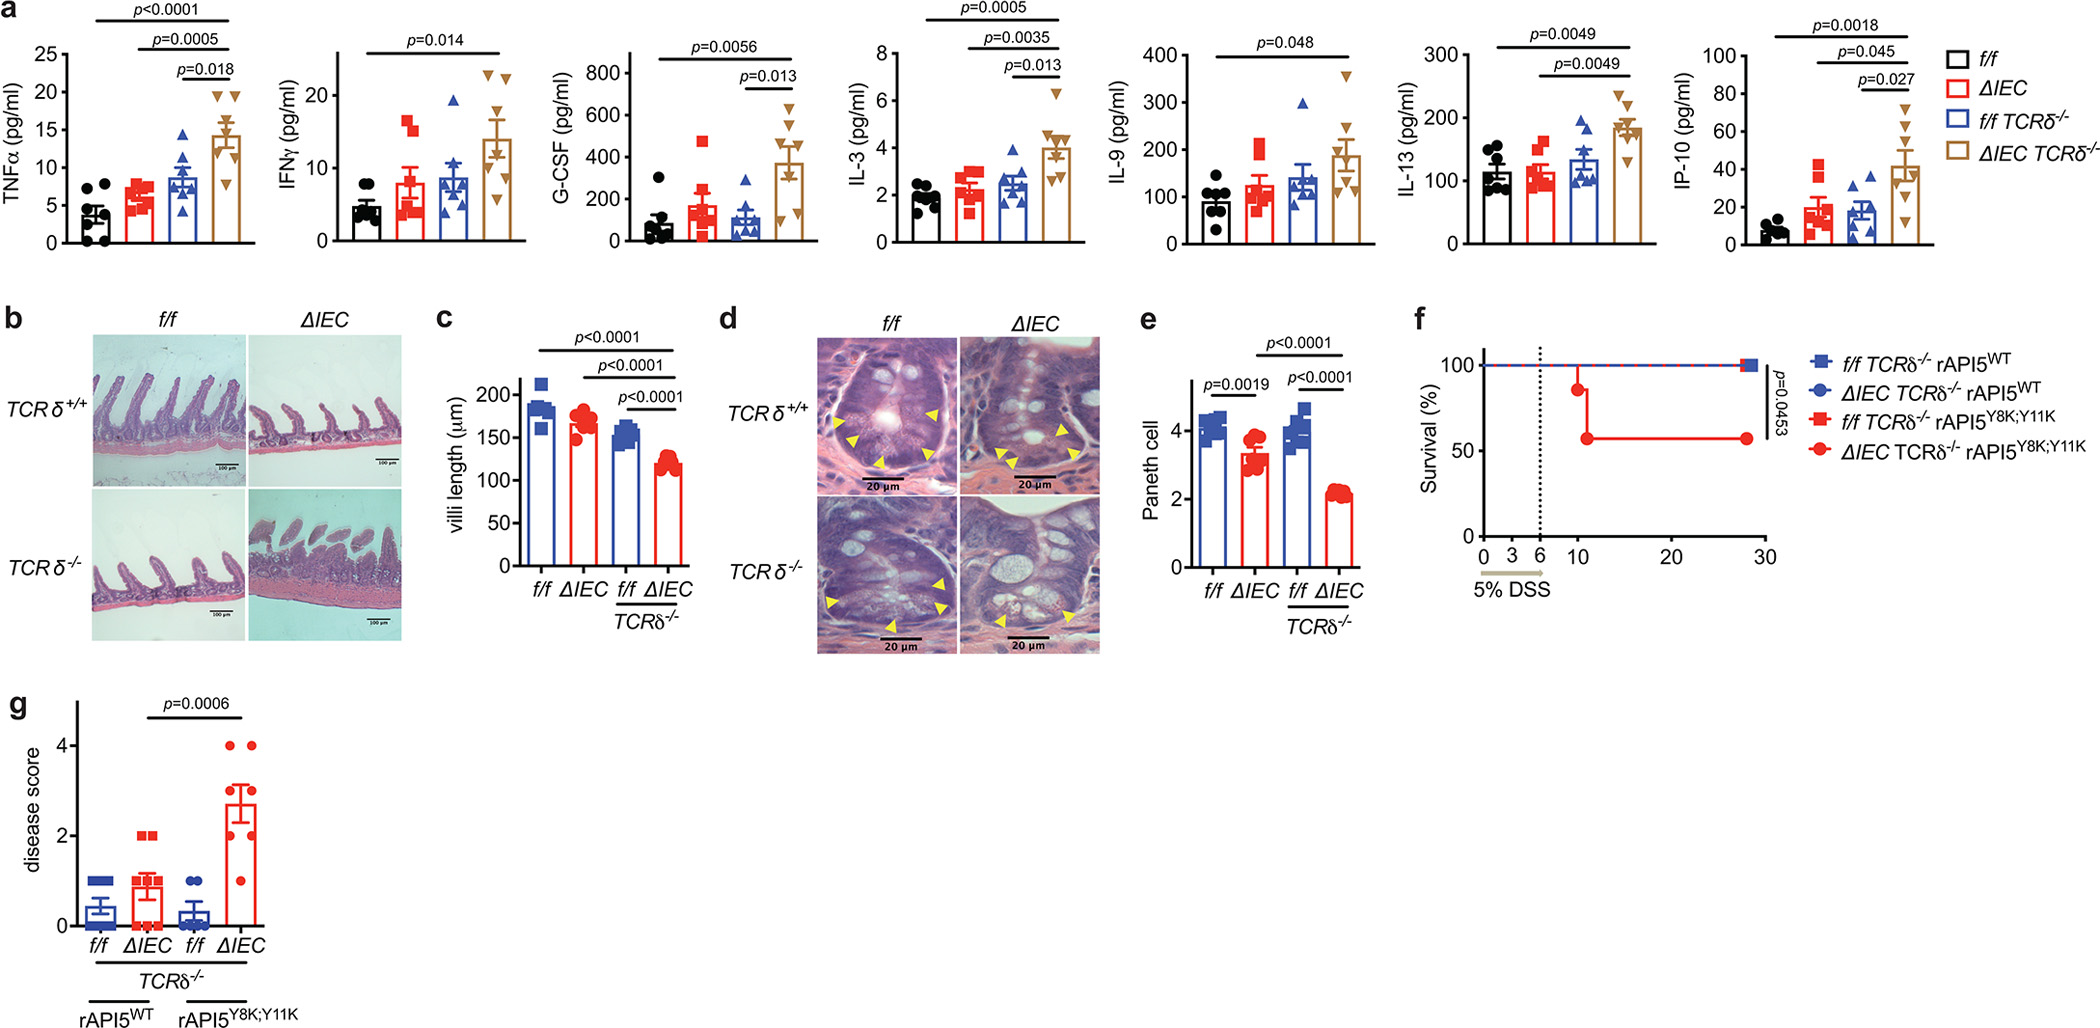
Extended Data Fig. 7 |. γδ IELs and rAPI5 protect Atg16L1ΔIEC mice against DSS-induced intestinal inflammation.

a-e, Atg16L1f/f (f/f), Atg16L1ΔIEC (ΔIEC), Atg16L1f/f TCRδ−/− (f/f TCRδ−/−), and Atg16L1ΔIEC TCRδ−/− (ΔIEC TCRδ−/−) mice were treated with 5% DSS, and euthanized on day 5. n=7 (f/f), 7 (ΔIEC), 7 (f/f TCRδ−/−), and 7 (ΔIEC TCRδ−/−). a, Quantification of the indicated cytokines in SN harvested from gut explants. b, c, d, e, Representative images of H&E staining (b and d) and quantification of villi length (c) and Paneth cells (e). Scale bar 100 μm (b) and 20 μm (e). f, g, Survival (f) and disease score on day 6 (g) of f/f TCRδ−/− and ΔIEC TCRδ−/− mice injected intravenously with 40 μg/mouse of wild-type or Y8K:Y11K rAPI5 protein on day 0, 3, and 6, while treated with 5% DSS for 6 days. n=9 (f/f TCRδ−/− rAPI5WT), 8 (ΔIEC TCRδ−/− rAPI5WT), 6 (f/f TCRδ−/− rAPI5Y8K:Y11K), and 7 (ΔIEC TCRδ−/− rAPI5Y8K:Y11K). An ANOVA with Tukey’s multiple-comparison test in (a, c, e, g). Mantel-Cox log-rank test in (f). Data points in (a), (c), and (e) are individual mice, and data points in (g) are mean of disease scores of viable mice. Bars represent means ± SEM, and at least two independent experiments were performed.
